EGFE: End-to-end Grouping of Fragmented Elements in UI Designs with Multimodal Learning
Abstract.
When translating UI design prototypes to code in industry, automatically generating code from design prototypes can expedite the development of applications and GUI iterations. However, in design prototypes without strict design specifications, UI components may be composed of fragmented elements. Grouping these fragmented elements can greatly improve the readability and maintainability of the generated code. Current methods employ a two-stage strategy that introduces hand-crafted rules to group fragmented elements. Unfortunately, the performance of these methods is not satisfying due to visually overlapped and tiny UI elements. In this study, we propose EGFE, a novel method for automatically End-to-end Grouping Fragmented Elements via UI sequence prediction. To facilitate the UI understanding, we innovatively construct a Transformer encoder to model the relationship between the UI elements with multi-modal representation learning. The evaluation on a dataset of 4606 UI prototypes collected from professional UI designers shows that our method outperforms the state-of-the-art baselines in the precision (by 29.75%), recall (by 31.07%), and F1-score (by 30.39%) at edit distance threshold of 4. In addition, we conduct an empirical study to assess the improvement of the generated front-end code. The results demonstrate the effectiveness of our method on a real software engineering application. Our end-to-end fragmented elements grouping method creates opportunities for improving UI-related software engineering tasks.
1. Introduction
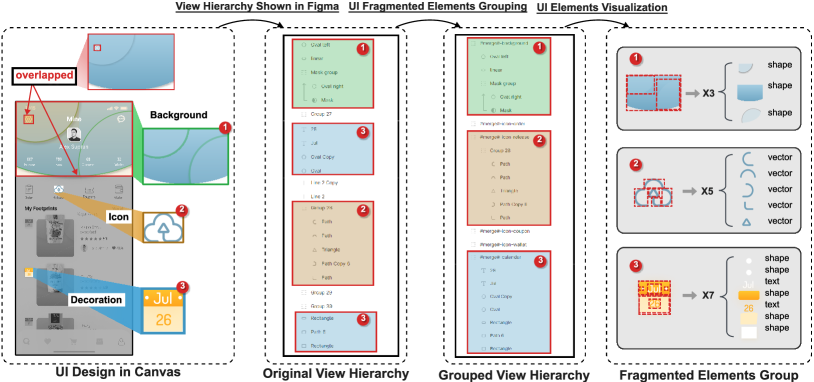
With the rapid progress in electronic devices, there is a growing demand from both companies and individuals for Graphical User Interfaces (GUIs) that provide a superior visual experience. The development of GUI in industry starts from design prototypes111This work uses ”design prototype” and ”UI design” interchangeably. which are produced with design software including Sketch (Sketch., 2022b) and Figma (figma., 2022). A design prototype generally consists of multiple UI pages, each featuring a visual effect (UI design in canvas) and a view hierarchy that captures the arrangement of UI elements, as shown in Figure 1. In industrial settings, front-end developers implement UI design prototypes into code, with a full understanding of the designer’s intentions (Moran et al., 2020). For example, developers can identify discrete objects in the UI that should be instantiated as components on the screen. They categorize these components appropriately based on their intended functionalities and arrange them in a suitable hierarchical structure to ensure correct display on various screen sizes. However, even for skilled developers, this process can be time-consuming and prone to errors. To alleviate the burden on developers, some semi-automated code generation tools, such as Imgcook (Imgcook., 2022) and Codefun (Codefun, 2022), utilize design prototypes as inputs to generate code automatically. In academia, it is also appealing to propose approaches for generating code from images (Chen et al., 2019; Beltramelli, 2018; Moran et al., 2020), even though the performance is not ready for industrial development. Furthermore, due to the lack of UI view hierarchy, the resulting code often lacks proper structure and accessibility.
In the context of industrial UI prototype design, designers often utilize basic elements to create aesthetic and unique UI components such as backgrounds, icons, and decorations, to enhance the visual appeal. However, due to loose design standards, these elements are typically not combined into a single image view. For example, the “calendar” decoration marked as in Figure 1 is formed by 7 basic elements. These individual elements in the view hierarchy that cannot independently convey visual semantics are defined as fragmented elements. During the automated UI-to-code generation process, these fragmented elements can be erroneously interpreted as distinct entities, rather than integral parts of a single, cohesive component. This misinterpretation can cause an escalation in the complexity and redundancy of the generated code. To achieve higher-quality generated code, developers manually group and label UI designs in design software based on visual semantics and the view hierarchy to obtain grouped UI designs, as shown in Figure 1. However, this grouping process often requires developers to have a thorough understanding of the UI structure and involves iterative trial and error.
In the context of industrial UI-to-code generation, to improve the readability and maintainability of generated code, grouping fragmented elements belonging to the same component in the design prototype is a crucial step, which is referred to as the fragmented element grouping problem (Chen et al., 2022). Current approaches (Chen et al., 2022; Li et al., 2022b) for automatically grouping fragmented UI elements employ a two-stage strategy that introduces hand-crafted post-processing to group fragmented elements. However, we found that the two-stage process of identification and grouping can result in cumulative errors, thereby reducing the grouping performance. Furthermore, these approaches are not always robust enough to accurately retrieve all fragmented elements, especially when there is an overlapping issue between background components and foreground components, which is very common in GUIs. For instance, in Figure 1 (UI design in canvas), detecting the bounding boxes for the background component marked as also includes the foreground icon inside, making it difficult to visually separate those overlapped elements in the view hierarchy (Chen et al., 2022). A more intuitive and logically sound approach to address this problem would be to first detect all individual fragmented elements and then merge them into groups based on their spatial position, which is also the pipeline used by most other UI grouping tasks (Zhang et al., 2021; Xie et al., 2022). Although this approach can effectively avoid defects in post-processing, the problem of detecting tiny objects becomes a new bottleneck, as the fragmented elements grouping task deals with the smallest UI element granularity, and many single elements are hard to detect.
In this paper, we propose EGFE, an approach for End-to-end Grouping of Fragmented Elements, which leverages effective UI multimodal feature representation to group UI fragmented elements. EGFE employs a Transformer encoder to model the relationship between UI elements with multi-modal feature representation learning. Specifically, to address the overlapped issue, EGFE followed the idea to process a pixel-based image into a sequence as ViT (Dosovitskiy et al., 2021). The element sequence is extracted from the view hierarchy using a depth-first traversal. To address the issue of tiny object detection, we not only consider the vision information of UI elements but also take the attribute information to facilitate UI understanding. To avoid introducing hand-crafted rules, we innovatively transform the detection-based grouping problem into a sequence classification task. EGFE achieves the automatic grouping of fragmented elements as a single stage without introducing any post-processing with hand-crafted rules. To better learn the complex UI context, we use the ResNet model to encode vision features. Moreover, we use the pre-trained BERT (Devlin et al., 2019) model and fully connected layers to encapsulate the attribute features. To evaluate our approach, we create a dataset containing 4606 UI prototypes designed by professional UI designers. The experimental results demonstrate that our approach outperforms all other baselines. Additionally, we conduct an empirical user study to assess the effectiveness of our method on a real software engineering application. We evaluate the improvement of generated front-end code on four aspects: code availability, modification time, readability, and maintainability. The study shows that EGFE can assist in generating high-quality front-end code at an industrial level.
Our main contributions are outlined as follows:
-
•
To the best of our knowledge, this is the first attempt to address the grouping of UI fragmented elements with an end-to-end method. The datasets and source code 222https://github.com/test2975/EGFE used in our study are publicly accessible to facilitate replication of our research.
-
•
We propose a novel multi-modal model in EGFE to classify UI fragmented elements and group these elements, and demonstrate its effectiveness in encoding multi-modal features through experiments and an ablation study.
-
•
A comprehensive evaluation of the performance of EGFE against state-of-the-art baselines, together with an empirical user study, further confirms the effectiveness of EGFE on the industrial aspect.
2. Methodology
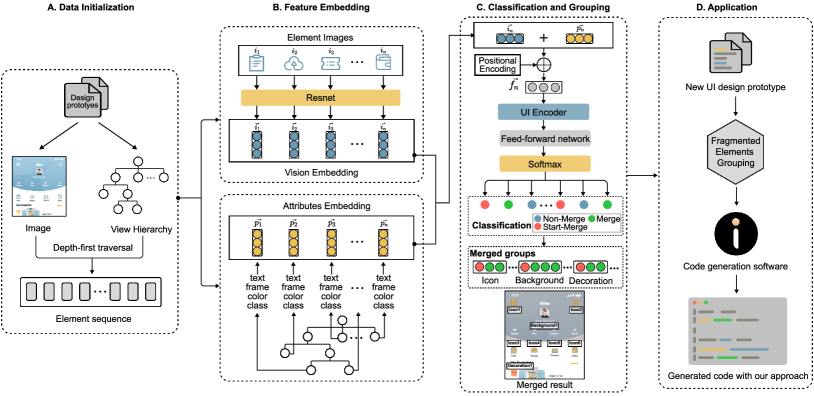
Figure 2 presents the overview of EGFE, which consists of three main steps: (1) Data Initialization, for extracting UI features from the input UI design prototype and generating UI elements sequence; (2) Feature Embedding, for generating deep multi-modal embeddings of UI elements; (3) Classification and Grouping, for classifying UI elements and grouping associated fragmented elements. EGFE is an end-to-end approach. It does not require any ad-hoc or case-specific rules to retrieve UI fragmented elements. Instead, our approach identifies fragmented elements and groups fragmented elements directly. Below, we provide details for each step in EGFE.
2.1. Data Initialization
This step is aimed at generating UI element sequences that include both UI element attributes and vision information for a given design prototype, denoted as . The predicted elements fall under three categories, namely, start-merge, merge, and non-merge, represented by , , and , respectively. The fragmented element group is a sub-sequence of the prediction sequence with a beginning node and any number of successive merge nodes, denoted as .
2.1.1. UI Design Dataset
UI design prototypes are high-fidelity GUI prototypes with a view hierarchy that shows how UI elements are constructed and arranged. A view hierarchy is a JSON file with a tree structure where each node in the tree corresponds to an element of a UI design prototype. All elements have meaningful attributes related to the appearance and functionality of UI components, such as content description, frame (position and size), color, and class. When preparing the experimental dataset, as shown in Figure 1, fragmented components are classified into three categories based on their spatial size and visual effect including icon, decoration, and background. These components are often highly customized, reflecting the aesthetics and characteristics of the user interface. To train and evaluate our approach, we collect 4606 design prototypes created on Sketch (Sketch., 2022b). These UI design prototypes are designed by professional designers for various kinds of apps such as shopping, travel, and communication. To obtain vision information of UI elements, we use Sketch command-line interface (Sketch., 2022a) to export element images. We assign each element a label: start-merge, merge, and non-merge. Specifically, we assign the label start-merge to the first traversed element of each merged group. The remaining elements within a merged group are labeled as merge, while the elements outside of merged groups are labeled as non-merge.
2.1.2. Annotation Process
As data annotation has become more difficult due to the need for large-scale data and the lack of adequately labeled data, crowdsourcing (Su et al., 2012) has gained considerable attention within the computer vision community. In our study, we employed crowdsourcing to comprehensively annotate the EGFE dataset, recruiting 18 professional front-end developers with over five years of experience each. The annotators received detailed instructions and examples of fragmented element groups, and each annotator was required to annotate approximately 250 design prototypes. Following the initial annotation, two authors of this paper, a researcher and a senior front-end engineer, meticulously assessed the quality of all design prototypes and identified any annotation errors. Annotators were then instructed to revise their annotations based on our feedback and re-annotate any UI designs that did not meet our quality standards. During the labeling process, annotators need to identify the associated fragmented elements and group them, assigning the fragmented elements group a “#merge#” label. The view hierarchy of fragmented element groups is illustrated in Figure 1 (Grouped view Hierarchy). On average, a duration of approximately 10 minutes was dedicated to each design prototype to ensure that the labeling quality met our standards.
2.2. UI Elements Embedding
2.2.1. Image Embedding
Most of the current research (Bai et al., 2021; Bunian et al., 2021; Li et al., 2022a) treats UI images as image patches based on the bounding boxes denoted in a view hierarchy. The image patches contain their surrounding information. Inspired by the Gestalt principle (Gestalt., 1967; Xie et al., 2022), they suggest that elements are perceptually grouped if they are similar to each other. The different surrounding information may destroy the semantics of the element itself. For example, in the background component shown in Figure 1, splitting image patches of background elements would result in including the overlapping UI elements. This redundant vision information would hinder the identification of individual background elements. Therefore, we directly use element images instead of encoding the entire image patches. To reduce the image processing time, we normalize the element images to a fixed size of before training. We use Resnet-50 (He et al., 2016) of which the last fully connected layer is replaced by dimension to encode the pixel information of elements, where is the dimension size that is 256 in our case. The output is a two-dimensional tensor , with each row serving as the visual encoding of an element.
2.2.2. Attributes Embedding
The UI elements in Design prototypes contain multiple attributes, including text descriptions, class, color, and frame. To encode each element as a dense vector, we embed its attributes separately and then combine these embeddings. The element text description is a brief description of the functionality of this UI element provided by the designer. If the delivery is badly organized, the developer can use the text description as a prompt to group related fragmented elements together. For instance, shape elements typically contain keywords like “path” and “rectangle” while elements representing symbols are often named based on their functionality, such as “status bars”. To achieve an adaptable representation of the element text, we normalize all the text with lower letters, and a specific tokenizer with pre-trained BERT (Devlin et al., 2019) is adopted. We embed each text into a tensor with a length of 32, with each value denoting the index of the word in the pre-trained corpus. Two-sided padding (with 0) and truncation strategies are used to eliminate the effect of text length differences. Every text is represented as a tensor. To ensure synchronization with the image features, we compress the first dimension by summing up each column. This results in a text embedding .
The element color item in our dataset denotes each element’s background color. Note that some elements do not include such background color information, and we just leave them as zero vectors. We normalize the color between 0 and 1. The bounding box defines the frame of UI elements. Considering the different sizes of the design prototypes, we convert the data pair into format and then apply min-max normalization to scale all the bounding boxes into the same range. We adopt a similar way to process the color embedding and frame embedding by using fully connected layers, and both of their output shapes are .
The class indicates the predefined type in the UI design prototype, such as the oval, rectangle, or text. It is a useful attribute that helps EGFE learn specific patterns. For example, the text element is usually more unlikely to be part of the fragmented elements, as it makes no sense to separate some text with coherent semantics into several parts in the design stage. Such prior information from the class is valuable for our prediction. Instead of processing the class of each element as a one-hot vector, we use an embedding layer, resulting in an output feature shape of as . By obtaining an embedding of the class, we achieve a more pronounced impact at the fusion stage. In contrast, a one-hot vector is too sparse to fulfill this expectation, as most of its values are 0.
2.3. Classification and Grouping
We construct a UI encoder to capture the relationship between elements by following the structure of the DETR Encoder (Carion et al., 2020). Overall, our model uses the UI encoder to encode the entire embedding and a two-layer Feed-Forward Network (FFN) with a ReLU activation function to predict the type of each element. Specifically, given a element sequence , where is the number of elements in the sequence. The image embedder first embeds each image of the elements into a dimensional vision embedding . Then, the attributes embedder embeds attributes into dimensional embeddings (i.e., ). The final embeddings are as follows:
| (1) |
We use the and functions of different frequencies to compute the position encoding :
| (2) | ||||
| (3) |
where is the position of the element and denotes the -th dimension of the embedding vector. Then, the final embeddings with positional encoding are as follows:
| (4) |
Then, the UI encoder inputs the sequence of element embeddings into identical Transformer encoder blocks to calculate the hidden states of the element. For the block of the UI encoder, suppose that the input is , and the output is calculated as follows:
| (5) | ||||
| (6) |
where is the hidden states of the first sub-layer and is the multi-head attention layers. Initially, the element embedding vectors are fed into the first block, and the block outputs the final hidden states of the input element . Then, it uses a two-layer FFN to map the features into the classification representation .
| (7) |
With a Softmax function, the outputs of the is a distribution of our element prediction probability with the row represents the classification probability of the element. Finally, we use the cross-entropy metric to calculate the loss between each prediction and ground truth.
The element sequence we obtained has eliminated the hierarchical bias that may be caused by various design patterns. As shown in Figure 2, our approach assigns a label to each element. Any potential groups of fragmented elements are naturally grouped as sub-sequences without rule-based grouping algorithms. We start grouping the element with a start-merge label and continue to group elements with a merge label until traversed another start-merge element. During traversal, the elements with non-merge label are filtered.
2.4. Application
Competitive GUI development typically requires a large team of designers and engineers with specialized domain expertise. The UI design and code implementation process often involves multiple iterations to ensure that end-users experience the UI as intended, resulting in a time-consuming and error-prone process (Moran et al., 2018). Prior methods based on image-captioning (Beltramelli, 2018; Moran et al., 2020) have attempted to automate the code development process to address this repetition. However, the generated code is highly redundant for repetitive GUI blocks as it lacks awareness of the GUI structure during code generation. More recent industrial solutions, such as Imgcook (Imgcook., 2022), have addressed this limitation by utilizing design prototypes containing UI metadata to avoid code redundancy and structural loss. However, this approach lacks awareness of fragmented elements, resulting in the generation of redundant image containers. This requires developers to invest additional effort in revising the code. Our approach can group fragmented elements and generate less redundant and more reusable GUI code. In Section 4, we conduct an empirical user study to demonstrate the effectiveness of our approach in this downstream automation software engineering task.
3. Experiments
According to our research purpose, the evaluation aims to answer the following research questions:
RQ1:(Elements Classification Performance) How does the EGFE perform compared to the state-of-the-art image classification baselines?
RQ2:(Fragmented Elements Grouping Performance) What’s the performance of EGFE on fragmented elements grouping?
RQ3:(Multimodal UI Features Performance) How does each individual feature in EGFE improve the overall performance?
To fully understand the performance of our sequence-based approach, we compare it with the state-of-the-art image classification method in RQ1. We examine the grouping performance of EGFE and compare it with state-of-the-art baselines in RQ2. As we observe that fusing multimodal features improves the classification performance, we figure out the influence of each feature in RQ3.
3.1. Dataset
As described in 2.1, we generate element sequences from manually labeled design prototypes. During the data labeling process, the original order of elements may be disrupted. Therefore, we generate element sequences based on the original design prototypes and the element UUIDs obtained from the labeled design prototypes. Regarding our training-testing data split, the split was performed file-wise, i.e., prototypes from the same design file are not shared among the three splits. This is to avoid information leakage because prototypes from the same package might have similar appearances. We split the design prototypes in the dataset, completing the split for the training, validation, and test sets, respectively. The resulting split has 3686 design prototypes in the training dataset, 460 design prototypes in the validation dataset, and 460 design prototypes in the testing dataset. Table 1 shows the number of elements in three sets. The total ratio of merged versus non-merged elements is approximately .
| Split | S | M | N | Tiny | Overlap |
|---|---|---|---|---|---|
| Training | 15,247 | 23,851 | 287,513 | 123,734 | 1,592 |
| Validation | 1,258 | 2,263 | 35,939 | 25,645 | 231 |
| Test | 2,554 | 3,700 | 30,480 | 28,982 | 412 |
| Total | 19,059 | 29,814 | 353,932 | 178,361 | 2,235 |
-
•
S, M, N denotes Start-merge, Merge and Non-merge, respectively.
3.2. Implementation Details
We use a ResNet-50 model pretrained on ImageNet as an element image encoder. The text embeddings are initialized with a pretrained BERT encoder. The hidden dimension is set to 256 for all the embeddings. For the Transformer Encoder, we use Transformer layers and 8 attention heads with MLP dimension 2048 and query/key/value dimension 256. We train our models with a mini-batch of 8 samples for 300 epochs using the Adam optimizer with a . To avoid over-fitting, we set , and adopt the with . The learning rate is divided by 10 times after 200 epochs. To describe the multi-class classification task, we adopt the cross-entropy loss to train our EGFE. We employ class weights to alleviate the issue of long-tail distribution in the data. Our approach is implemented based on the Pytorch (Meta platforms., 2022) framework. The experimental environment is a desktop computer equipped with an NVIDIA GeForce RTX 3090 GPU, intel core i7 CPU, and 32GB RAM, running on Ubuntu OS and it cost 12 hours to converge.
3.3. Baselines
To the best of our knowledge, only a few works focus on specific element grouping tasks, and no existing work in this area follows an end-to-end pipeline to ours. In this case, we compare the classification and group performance of EGFE with the state-of-the-art baselines, respectively.
For classification performance comparison, we choose the following baselines:
EfficientNet (Tan and Le, 2019) is a CNN-based method that uses a simple yet highly effective compound coefficient to scale up CNNs in a more structured manner. Recently, it has been a frequently employed baseline in image classification tasks.
Vision Transformer (Dosovitskiy et al., 2021) Known as ViT succeeded in using a full transformer to outperform previous works based on convolutional networks in the vision field.
Swin Transformer (Liu et al., 2021) is a hierarchical Transformer whose representation is computed with shifted windows. It achieves strong performance on many vision downstream tasks.
We trained these image classification models using the same element image data as EGFE from the initial state. The trained models are capable of performing the same classification tasks as EGFE.
For grouping performance comparison, we choose the following baselines:
UILM (Chen et al., 2022) is an object detection-based method for grouping fragmented elements in UI designs. Initially, it uses a novel object detector to detect UI component regions that consist of fragmented elements. Then, it proposes a rule-based algorithm to retrieve the fragmented elements within the bounding boxes.
ULDGNN (Li et al., 2022b), a method grouping fragmented elements based on UI view hierarchy, transforms the layout of each UI design prototype into a graph with each node representing a UI element. ULDGNN employs a self-attention-based graph neural network to identify whether an element is fragmented. Subsequently, a rule-based algorithm is implemented to group fragmented elements.
UIED (Chen et al., 2020) is a hybrid object detection approach for UI element detection. It is demonstrated to outperform YOLO v3, FasterRCNN, and Centernet. UIED first employs traditional computer vision methods to detect the boundaries of elements (referred to as components in this paper) and then uses CNN to classify these components.
We replicated the models of UILM and ULDGNN and trained them on our dataset from the initial state. For UIED, we follow the detection approach of UIED and retrain the region classifier of UIED with our dataset to enable it to recognize component regions containing fragmented elements. Similar to UILM, the rule-based grouping algorithm is utilized to identify fragmented elements within the regions.
3.4. Evaluation Metrics
UI elements classification. To evaluate the classification performance of EGFE and image classification baselines, we use precision, recall, and F1-score to measure the performance of element classification.
UI elements grouping. To evaluate the grouping performance of EGFE and state-of-the-art baselines, we generate the ground-truth UI element sequence as a string through depth-first traversal, based on the design prototype’s view hierarchy. As described in Section 2, only UI elements with non-merge labels are filtered, resulting in ground-truth groups consisting solely of merge and tart-merge types. To enable comparison, the predicted merged groups generated by our approach and baselines are outputted in the same format. The Levenshtein edit distance is computed between the ground-truth sequence and the predicted sequence, revealing the specific mismatches between the two groups and aiding in the analysis of grouping errors. To determine the optimal matching between the ground-truth group string and the predicted merged group string, we minimize the overall edit distance among all candidate matches. If a merged group corresponds to a ground-truth group, it is classified as a true positive (TP); otherwise, it is a false positive (FP). Any ground-truth groups that do not correspond to any merged group are classified as false negatives (FN). Based on the matching results, we compute (1) precision (2) recall , and (3) F1-score
3.5. RQ1: Performance of UI Elements Classification
The results in Table 2 show that EGFE outperforms all baselines in every situation. Our method outperforms the state-of-the-art image classification baseline (Swin Transformer) in terms of precision, recall, and F1-score, with improvements of 25.5%, 22.7%, and 24.0%, respectively. EGFEimage means using image features only. The performance of EGFEimage is also better than that of other baselines. This is because image classification models focus on classifying individual elements without considering the relationships between them. In contrast, EGFEimage employs a Transformer encoder to model the relationships between image features of elements, leading to an improvement in performance. Besides, regardless of whether the image classification model is based on CNN or Transformer, relying solely on pixel information makes it challenging to fully understand the UI design prototype, resulting in lower performance. By employing multi-modal representation learning, we enable EGFE to better understand design prototypes, consequently yielding significant performance advancements. This suggests that improving the representation of multi-modal features is a crucial aspect of improving model performance. The result in Table 3 also shows that our approach has good performance in three types, especially in the non-merge type. Since there are fewer fragmented elements in the design prototypes than ordinary elements, more training examples of fragmented object types would potentially improve the model performance.
| Method | Precision | Recall | F1 |
|---|---|---|---|
| EfficientNet | 0.568 | 0.580 | 0.574 |
| Vision Transformer | 0.625 | 0.638 | 0.631 |
| Swin Transformer | 0.675 | 0.682 | 0.679 |
| EGFEimage | 0.769 | 0.786 | 0.777 |
| EGFE | 0.847 | 0.837 | 0.842 |
| Element Type | Precision | Recall | F1 |
|---|---|---|---|
| Non-merge | 0.980 | 0.956 | 0.968 |
| Start-merge | 0.764 | 0.772 | 0.767 |
| Merge | 0.797 | 0.783 | 0.790 |
3.6. RQ2: Performance of UI Elements Grouping
The results in Figure 3 show that EGFE outperforms baselines in five edit distance thresholds (0-4). The distance 0 means the two groups of a ground-truth merged group and a predicted merged group have the perfect match. The distance 4 means the unmatched elements in the two groups are no more than 4. As shown in Figure 3, as the distance threshold increases, which means the matching criterion relaxes, the precision, recall, and F1-score keep increasing to 0.772, 0.831, and 0.80 at threshold 4. Our method outperforms the state-of-the-art baselines in the precision (by 29.75%), recall (by 31.07%), and F1-score (by 30.39%) at the edit distance threshold of 4. It indicates that our approach can classify and group UI elements more precisely than all baselines. Due to the limitations of traditional computer vision techniques in generalizing to complex UI designs, the performance of UIED in detecting component boundaries is not satisfied, which subsequently affects the classification of these components. Consequently, the detection and identification of components that contain fragmented elements are also impacted, resulting in unsatisfactory performance. Despite the progress made by UILM in enhancing detection performance, it still faces challenges in accurately identifying the elements within the detected bounding boxes. Our EGFE also achieves a noticeable improvement over the two-stage graph-based approach ULDGNN. Our approach leverages the accessible layer element information from design prototypes, thereby eliminating the need for element localization. By employing a multimodal Transformer and multi-class classifier, it achieves end-to-end recognition and grouping of fragmented elements.
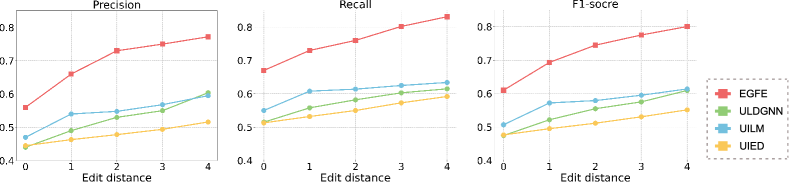
Table 4 demonstrates the superior performance of EGFE compared to baselines in grouping tiny and overlapping elements. For tiny elements, we follow the COCO format (Lin et al., 2014), which considers an area smaller than pixels. For elements with large aspect ratios in the designs, we require both the length and width of tiny elements must be less than pixels. Regarding overlapping elements, we automatically select samples from the test set that have overlapping bounding boxes and calculate precision, recall, and F1-score for these samples. The results show that EGFE outperforms the best baseline (UILM) by 41.7%, 30.6%, and 36.2% in terms of precision, recall, and F1-score for overlapping elements. Our model also outperforms the best baseline by 19.9%, 16.0%, and 18.0% in terms of precision, recall, and F1-score for tiny elements. This is primarily due to the fact that EGFE not only identifies elements from a visual perspective but also incorporates UI attribute information from the design metadata.
| Tiny Elements | Overlapping Elements | |||||
|---|---|---|---|---|---|---|
| Method | prec. | rec. | F1 | prec. | rec. | F1 |
| ULDGNN | 0.466 | 0.537 | 0.499 | 0.453 | 0.478 | 0.465 |
| UIED | 0.420 | 0.497 | 0.455 | 0.209 | 0.235 | 0.221 |
| UILM | 0.523 | 0.582 | 0.551 | 0.460 | 0.487 | 0.473 |
| EGFE | 0.627 | 0.675 | 0.650 | 0.652 | 0.636 | 0.644 |
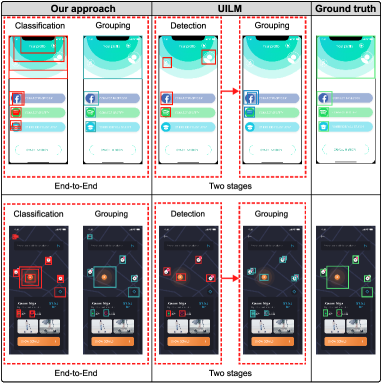
We also present examples in Figure 4 for intuitive comparison. Our approach can not only accurately recognize the complex merged group of background elements, but it can also reduce false positive predictions with powerful multimodal learning ability. For example, in the first row of Figure 4, the background object composed of multi-semicircular elements is not detected by the object detection method, and it also incorrectly recognizes two complete UI icons on the background object. However, our approach still robustly recognizes the groups of fragmented elements.
We present two typical failure cases to highlight the potential improvements of our approach. As demonstrated in Figure 5, the primary challenge of the end-to-end grouping approach is detecting and classifying elements accurately. In the first row, our approach successfully identifies all fragmented elements on the GUI, but due to misclassification, it groups nearby widgets as a single component marked as . This issue could be addressed by reducing data imbalance or implementing a weighted training strategy. In the second row, our approach segments the artistic font component into several groups due to missed element detection. This is because artistic fonts are composed of many “shape” elements, which results in misunderstandings by the model. This issue could be alleviated by introducing an OCR tool to predict the artistic font component. This approach can also be considered end-to-end as it does not involve any additional rules.

3.7. RQ3: Ablation Experiment on Multimodal Features
To investigate the effectiveness of each UI feature, we discard each at a time. The experimental results of the ablation study are shown in Table 5. As arranged in the first column, EGFE represents our ensemble performance using image and element properties (i.e., text, class, frame, and color), and each row below represents the result of a missing feature. For example, EGFE w/o text denotes the model without the attribute of text description. Table 5 shows that each feature contributes to the overall performance. The results that the removal of the image feature leads to a dramatic decrease in both macro (by 18.93%) and weighted (by 9.09%) F1 scores, which has strongly indicated the element image feature is essential information that contributes to the high performance of our EGFE. We can also observe that removing the text description feature will lead to a performance decline in the macro F1 (by 7.54%), and weighted F1 (by 4.95%).
| Macro Average | Weighted Average | |||||
|---|---|---|---|---|---|---|
| Method | prec. | rec. | F1 | prec. | rec. | F1 |
| EGFE | 0.847 | 0.837 | 0.842 | 0.919 | 0.904 | 0.912 |
| w/o text | 0.794 | 0.772 | 0.783 | 0.879 | 0.859 | 0.869 |
| w/o color | 0.828 | 0.811 | 0.820 | 0.910 | 0.897 | 0.903 |
| w/o class | 0.819 | 0.793 | 0.806 | 0.896 | 0.885 | 0.891 |
| w/o frame | 0.827 | 0.811 | 0.819 | 0.906 | 0.895 | 0.901 |
| w/o image | 0.716 | 0.700 | 0.708 | 0.836 | 0.836 | 0.836 |
4. Empirical study on code generation
Our fragmented grouping method fills an important gap in UI understanding. The experiments above demonstrate the performance of our approach with other baselines. However, the satisfactoriness of the predicted merged group can be subjective to different users or developers. Therefore, we choose GUI-to-code generation, an innovative application in the software engineering domain, to demonstrate the effectiveness of our method. We perform an empirical human evaluation to further assess the quality of code improvement by applying EGFE. We also investigate the feedback from developers.
4.1. Procedure
We conduct a comprehensive investigation to assess the quality of the generated code with our approach. To carry out this experiment, we utilize vscode (Microsoft., 2022) as the development environment for participants and Imgcook (Imgcook., 2022) to generate the React-format code with and without fragmented element grouping. We recruit ten participants, all of whom possess over three years of programming experience in front-end development using the JavaScript framework, and can be considered senior front-end code developers capable of evaluating the quality of our generated code. We randomly selected ten UI design prototypes for each of the three typical categories of UI design prototypes, namely travel, communication, and shopping. For comparison purposes, we use the original generated code from Imgcook as the baseline, which does not group fragmented elements. The final number of code snippets generated by Imgcook is 60 in total, comprising 30 code snippets from the merged UI prototypes by EGFE and 30 code snippets from the non-merged ones.
Initially, we provide generated code snippets to each participant with and without applying EGFE. The participants then revise each code snippet with rendered GUI until they believe the code structure meets the production standards. It is important to note that they are not aware of which code snippets are from which method, and all of them evaluate the code individually without any discussion. After the experiment, each participant rates each generated code based on four aspects stated in advance: (1) Readability reflects the difficulty of understanding the generated code from the perspective of structure; (2) Maintainability reflects the difficulty of maintaining the generated code for the next requirement; 3) Code Availability reflects how much code is available for prototyping; 4) Code Modification Time reflects how much time is required to adjust the code to actual production standards. For the first two aspects, participants should rate scores, ranging from 1 to 5 (1 for poor and 5 for excellent). We calculate the code availability as follows:
| (8) |
We divide the score range [0.80, 0.85, 0.90, 0.95] into intervals of 5% code changes and assign a score to each interval from 1 to 5. We use this mapping to calculate the code availability score. For the code modification time, we record the time taken by each participant to adjust the generated code to actual production standards. We set the interval for this aspect as 5 minutes, where a score of 5 is assigned to those who complete the task within five minutes, and a score of 1 is assigned to those who take more than 20 minutes.
4.2. Results
Table 6 shows the statistic results. Overall, EGFE is better than the baseline in three types of design prototypes. The average score for code availability, modification time, readability, and maintainability are 3.41, 3.46, 4.00, and 3.61, respectively. In terms of code availability, modification time, readability, and maintainability, which are four metrics for evaluating code quality, EGFE has increased by 46.35%, 41.22%, 37.46%, and 36.74% compared with baseline. This indicates that EGFE can assist front-end developers in improving the readability and maintainability of generated code. This is mainly because the code structure is simplified a lot with less fragmented code snippets. Furthermore, our approach has achieved satisfactory improvements in code availability and maintainability, providing strong evidence that EGFE enhances the industry compliance of GUI-to-code generation. To demonstrate the significance of EGFE, we adopt the Mann-Whitney U test (Fay and Proschan, 2010) on four metrics where a is considered statistically significant, and a denotes highly statistically significant. The statistics suggest that EGFE can contribute significantly to the generated code in all four metrics.
| Type | Metric | Score | ||
|---|---|---|---|---|
| Baseline | EGFE | P-value | ||
| Travel | code availability | 2.52 | 3.46 | |
| modification time | 2.60 | 3.51 | ||
| readability | 3.28 | 4.17 | ||
| maintainability | 3.10 | 4.14 | ||
| Communication | code availability | 2.36 | 3.49 | |
| modification time | 2.47 | 3.42 | ||
| readability | 2.87 | 3.93 | ||
| maintainability | 2.42 | 3.34 | ||
| Shopping | code availability | 2.11 | 3.29 | |
| modification time | 2.29 | 3.45 | ||
| readability | 2.58 | 3.89 | ||
| maintainability | 2.40 | 3.34 | ||
| Average | code availability | 2.33 | 3.41 | |
| modification time | 2.45 | 3.46 | ||
| readability | 2.91 | 4.00 | ||
| maintainability | 2.64 | 3.61 | ||
-
•
** denotes and * denotes
4.3. User Interview
We hold an interview with these participants. They are generally positive about EGFE and the code improvement it makes. When we questioned the difference they observe between the code changes, P1 indicated that the code structure after applying EGFE is much clean and easy to understand. P2 responded by saying, “This code (applied EGFE) is much close to the version (that) I will submit in my project.” Participants also discussed their experiences with GUI-to-code generation tools i.e., Imgcook, noting that “I would be wary of using automatic tools, especially for some complex layout”(P5) or “(The tools) save my time, but sometimes I have to come back to check design prototypes to manually merge the fragmented elements after noting anomaly in the code”(P1). We also inquired about their intention to use our EGFE, and most participants replied with positive responses such as “Definitely (I) will try. It seems able to pull me out from implementing repetitive code again and again”(P4).
4.4. Qualitative Analysis
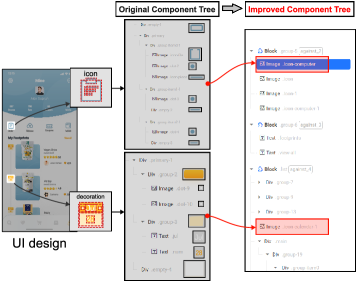
To offer a comprehensive evaluation of our EGFE approach, we demonstrate the code generation results with and without our fragmented elements grouping method, using cases from web resources333https://www.sketchappsources.com/search_dining.html. The results are presented in Imgcook online web, as shown in Figure 6. To better demonstrate the code structure changes, we compare the improvement by our approach based on the component tree rather than specific code. In general, the component tree generated by EGFE tends to be concise and more structured than the original version. For the icon component, the original code mistakenly generates 8 separate image views, resulting in a complicated structure. In contrast, the code generated by EGFE has only one holistic image view representing the icon in GUI, indicating that our approach can understand the GUI layout by encapsulating element grouping information. For the decoration, the original code has redundant UI components, as the code automation software is unaware of the hierarchical information about the input UI design prototype. However, in our approach, the fragmented group is represented by a single image view, making it easier for developers to implement changes and conduct code reviews. As demonstrated in the two cases, structural elements grouping is a crucial step to generate high-quality and maintainable code. Our approach streamlines the code generation process, resulting in less redundant and more reusable GUI code.
5. Threats to Validity
There are two main threats to the validity of our approach. The first threat to validity is that our method mainly solves the problem of fragmented elements in the UI design prototypes of mobile application layouts. We did not verify our method on the UI design prototypes that are designed for desktop or web. We will further verify the robustness of the proposed method in future work.
The second threat to validity is the dataset. Although we have performed strict quality control on the dataset annotation process, there may still be some annotation errors. This may reduce the generalization ability of the model. The datasets used by related works were not available due to their company’s confidentiality measures, so we were unable to verify the performance of the method on their datasets. To mitigate this issue, we need to obtain UI design prototypes from different sources to verify the generalization ability of the method.
6. Related Work
6.1. UI Elements Grouping
UI grouping is an essential step toward UI understanding. To our knowledge, there are several types of UI grouping: section-level grouping (Xie et al., 2022), component-level grouping (Xie et al., 2020; Zhang et al., 2021), and element-level grouping (Chen et al., 2022; Li et al., 2022b). Section-level grouping refers to the division of UI based on human perception, such as grouping components into sections like cards, lists, tabs, and menus. For example, (Xie et al., 2022) proposed a psychologically-inspired perceptual group. They aim to group UI components with similar structures (such as menus, multi-tabs, and cards) based on the Gestalt theory of perception. Component-level grouping is based on identifying UI components with independent semantics to complete downstream tasks (Zhang et al., 2021). For example, recognizing UI components would allow screen readers (Google., 2022; apple., 2022) to provide higher-order perceptual UI structure (e.g. components) for navigating visually impaired users to access applications. REMAUI (Nguyen and Csallner, 2015) infers three Android-specific layouts (LinearLayout, FrameLayout, and ListView) based on hand-craft rules to group widgets.
Fragmented elements grouping (FEG) belongs to element-level grouping. FEG differs from other types in two aspects: granularity and the data to be understood. Firstly, in terms of granularity, the grouping of fragmented elements addresses the smaller granularity of elements within the current UI domain. The fragmented elements are basic shape elements that need to be combined together to express visual semantics. Secondly, in terms of data to be understood, FEG utilizes design prototypes as inputs, whereas other types mainly use images. Therefore, two challenges arise. The first challenge is the detection of UI fragmented elements at a smaller granularity. The second challenge lies in data understanding. FEG not only requires visually locating semantically related fragmented elements but also identifying them within the view hierarchy. UILM (Chen et al., 2022) is a representative FEG method based on visual learning while requiring a view hierarchy of the design prototype to locate each fragmented element. However, due to the limitations of hand-craft or heuristics rules, this method has poor generalization. To build the relationship between detected UI objects, (Li et al., 2022b) proposed a graph neural network to learn the structure information in the GUI. However, such a relationship graph cannot represent complex UI element relations in fragmented groups. Furthermore, these methods do not take full advantage of the multimodal features in design prototypes.
6.2. UI Features Extraction
The UI image is considered the most prominent feature in UI-related tasks because of its rich sources (e.g., screenshots from real GUIs (Nguyen and Csallner, 2015), sketches and wireframes of design (Robinson, 2019)) and the SOTA performance of today’s image feature network like Resnet (He et al., 2016) and ViT (Dosovitskiy et al., 2021). With the widespread use of UI images, object detection methods are introduced into UI tasks extensively, especially in UI element detection (Liu et al., 2020) and UI component recognition (Zang et al., 2021). However, images are usually processed flatly while leaving out instructional information in the original UI designs, for example, the description of each component. In this case, the view hierarchy of designs is introduced. Multi-modal solutions (Liu et al., 2018; Zang et al., 2021; He et al., 2021) with both image features and extra information from the view hierarchy have boosted the performance. In this work, we fully utilize the multi-head feature space mapping and non-local aggregating from multi-head attention and make our approach more powerful by using multi-modal features.
6.3. GUI-to-Code Generation
Existing methods for GUI-to-code generation often suffer from code redundancy and code structure complexity. Image-captioning-based GUI-to-code methods (Beltramelli, 2018; Robinson, 2019; Chen et al., 2018) are completely unaware of GUI structure during the code generation process. As a result, the generated GUI code is highly redundant for some UI components. For example, the background component in Figure 1 will generate three pieces of the image view, one for each of the fragmented elements. This type of generated code is nothing like the real GUI code developers write. Therefore, it has little practicality. To overcome this limitation, some companies have proposed more mature code generation schemes (Imgcook., 2022; Codefun, 2022). However, they also hardly recognize fragmented elements very well due to the complex UI view hierarchy as shown in Figure 1. Without grouping these elements, the generated GUI layouts and widgets have no connection to the corresponding parts in the GUI image. It would be hard to understand how the generated code implements the GUI. With the support of our fragmented elements grouping, GUI-to-code generation can translate the fragmented groups into holistic image views during the code generation process and produce much less redundant and more reusable GUI code.
7. Conclusion
In this paper, we propose EGFE, a novel end-to-end approach for recognizing fragmented element groups in UI design prototypes. EGFE effectively leverages multimodal features of UI design prototypes, enabling enhanced UI understanding. To the best of our knowledge, EGFE represents the first automatic end-to-end UI grouping approach for fragmented elements. The evaluation results show that our approach significantly outperforms all other baselines on UI design datasets. An empirical study also confirms the generated code by EGFE tends to be more readable, well-structured, and useful. The positive feedback from participants serves as strong evidence of the validity and potential of EGFE. Our approach addresses the gap in visual intelligence between current GUI-to-code generation techniques, which rely on hand-crafted rules, and the comprehensive GUI-to-code generation at the UI component level. In future work, we plan to incorporate additional UI semantic information and explicitly encode structural details into our model to further enhance its performance.
Acknowledgements.
We would like to thank anonymous reviewers for their insightful and constructive comments, which significantly improve the quality of this paper. This work was supported by the National Key R&D Program of China (Grant No.2022YFB3303300), the National Natural Science Foundation of China (Grant No.62207023), the Ng Teng Fong Charitable Foundation in the form of ZJU-SUTD IDEA (Grant No.188170-11102), and Alibaba-Zhejiang University Joint Research Institute of Frontier Technologies.References
- (1)
- apple. (2022) apple. 2022. Accessibility - Vision. Website. https://www.apple.com/accessibility/vision/ [Accessed on Dec. 27, 2022].
- Bai et al. (2021) Chongyang Bai, Xiaoxue Zang, Ying Xu, Srinivas Sunkara, Abhinav Rastogi, Jindong Chen, et al. 2021. Uibert: Learning generic multimodal representations for ui understanding. arXiv preprint arXiv:2107.13731 (2021).
- Beltramelli (2018) Tony Beltramelli. 2018. pix2code: Generating Code from a Graphical User Interface Screenshot. Proceedings of the ACM SIGCHI Symposium on Engineering Interactive Computing Systems (2018).
- Bunian et al. (2021) Sara Bunian, Kai Li, Chaima Jemmali, Casper Harteveld, Yun Fu, and Magy Seif Seif El-Nasr. 2021. VINS: Visual Search for Mobile User Interface Design. In Proceedings of the 2021 CHI Conference on Human Factors in Computing Systems (Yokohama, Japan) (CHI ’21). Association for Computing Machinery, New York, NY, USA, Article 423, 14 pages. https://doi.org/10.1145/3411764.3445762
- Carion et al. (2020) Nicolas Carion, Francisco Massa, Gabriel Synnaeve, Nicolas Usunier, Alexander Kirillov, and Sergey Zagoruyko. 2020. End-to-end object detection with transformers. In European conference on computer vision. Springer, 213–229.
- Chen et al. (2018) Chunyang Chen, Ting Su, Guozhu Meng, Zhenchang Xing, and Yang Liu. 2018. From UI Design Image to GUI Skeleton: A Neural Machine Translator to Bootstrap Mobile GUI Implementation. In 2018 IEEE/ACM 40th International Conference on Software Engineering (ICSE). 665–676. https://doi.org/10.1145/3180155.3180240
- Chen et al. (2020) Jieshan Chen, Mulong Xie, Zhenchang Xing, Chunyang Chen, Xiwei Xu, Liming Zhu, and Guoqiang Li. 2020. Object Detection for Graphical User Interface: Old Fashioned or Deep Learning or a Combination? Association for Computing Machinery, New York, NY, USA, 1202–1214.
- Chen et al. (2019) Sen Chen, Lingling Fan, Ting Su, Lei Ma, Yang Liu, and Lihua Xu. 2019. Automated Cross-Platform GUI Code Generation for Mobile Apps. In 2019 IEEE 1st International Workshop on Artificial Intelligence for Mobile (AI4Mobile). 13–16. https://doi.org/10.1109/AI4Mobile.2019.8672718
- Chen et al. (2022) Yunnong Chen, Yankun Zhen, Chuning Shi, Jiazhi Li, Liuqing Chen, Zejian Li, Lingyun Sun, Tingting Zhou, and Yanfang Chang. 2022. UI Layers Merger: merging UI layers via visual learning and boundary prior. Frontiers of Information Technology & Electronic Engineering (2022). https://doi.org/10.1631/FITEE.2200099
- Codefun (2022) Codefun 2022. Codefun platform. https://code.fun/ [Accessed on Dec. 27, 2022].
- Devlin et al. (2019) Jacob Devlin, Ming-Wei Chang, Kenton Lee, and Kristina Toutanova. 2019. BERT: Pre-training of Deep Bidirectional Transformers for Language Understanding. In Proceedings of the 2019 Conference of the North American Chapter of the Association for Computational Linguistics: Human Language Technologies, Volume 1 (Long and Short Papers). 4171–4186.
- Dosovitskiy et al. (2021) Alexey Dosovitskiy, Lucas Beyer, Alexander Kolesnikov, Dirk Weissenborn, Xiaohua Zhai, Thomas Unterthiner, Mostafa Dehghani, Matthias Minderer, Georg Heigold, Sylvain Gelly, Jakob Uszkoreit, and Neil Houlsby. 2021. An Image is Worth 16x16 Words: Transformers for Image Recognition at Scale. ICLR (2021).
- Fay and Proschan (2010) Michael P Fay and Michael A Proschan. 2010. Wilcoxon-Mann-Whitney or t-test? On assumptions for hypothesis tests and multiple interpretations of decision rules. Statistics surveys 4 (2010), 1.
- figma. (2022) figma. 2022. Figma platform. https://www.figma.com/[Accessed on Dec. 27, 2022].
- Gestalt. (1967) Gestalt. 1967. Gestalt psychology. https://en.wikipedia.org/wiki/Gestalt_psychology#ite_note-1 [Accessed on Dec. 27, 2022].
- Google. (2022) Google. 2022. Get started on Android with TalkBack - Android Accessibility Help. Website. https://support.google.com/accessibility/android/answer/6283677?hl=en [Accessed on Dec. 12, 2022].
- He et al. (2016) Kaiming He, Xiangyu Zhang, Shaoqing Ren, and Jian Sun. 2016. Deep Residual Learning for Image Recognition. In 2016 IEEE Conference on Computer Vision and Pattern Recognition (CVPR). 770–778. https://doi.org/10.1109/CVPR.2016.90
- He et al. (2021) Zecheng He, Srinivas Sunkara, Xiaoxue Zang, Ying Xu, Lijuan Liu, Nevan Wichers, Gabriel Schubiner, Ruby Lee, and Jindong Chen. 2021. ActionBert: Leveraging User Actions for Semantic Understanding of User Interfaces. Proceedings of the AAAI Conference on Artificial Intelligence 35, 7 (May 2021), 5931–5938. https://doi.org/10.1609/aaai.v35i7.16741
- Imgcook. (2022) Imgcook. 2022. Intelligent Code Generation for Design Drafts. https://www.imgcook.com/ [Accessed on Dec. 27, 2022].
- Li et al. (2022a) Gang Li, Gilles Baechler, Manuel Tragut, and Yang Li. 2022a. Learning to Denoise Raw Mobile UI Layouts for Improving Datasets at Scale. In Proceedings of the 2022 CHI Conference on Human Factors in Computing Systems (New Orleans, LA, USA) (CHI ’22). Association for Computing Machinery, New York, NY, USA, Article 67, 13 pages. https://doi.org/10.1145/3491102.3502042
- Li et al. (2022b) Jiazhi Li, Tingting Zhou, Yunnong Chen, Yanfang Chang, Yankun Zhen, Lingyun Sun, and Liuqing Chen. 2022b. ULDGNN: A Fragmented UI Layer Detector Based on Graph Neural Networks. (2022). https://doi.org/10.48550/ARXIV.2208.06658
- Lin et al. (2014) Tsung-Yi Lin, Michael Maire, Serge Belongie, James Hays, Pietro Perona, Deva Ramanan, Piotr Dollár, and C Lawrence Zitnick. 2014. Microsoft coco: Common objects in context. In Computer Vision–ECCV 2014: 13th European Conference, Zurich, Switzerland, September 6-12, 2014, Proceedings, Part V 13. Springer, 740–755.
- Liu et al. (2018) Thomas F. Liu, Mark Craft, Jason Situ, Ersin Yumer, Radomir Mech, and Ranjitha Kumar. 2018. Learning Design Semantics for Mobile Apps. In Proceedings of the 31st Annual ACM Symposium on User Interface Software and Technology (Berlin, Germany) (UIST ’18). Association for Computing Machinery, New York, NY, USA, 569–579. https://doi.org/10.1145/3242587.3242650
- Liu et al. (2020) Zhe Liu, Chunyang Chen, Junjie Wang, Yuekai Huang, Jun Hu, and Qing Wang. 2020. Owl Eyes: Spotting UI Display Issues via Visual Understanding. In 2020 35th IEEE/ACM International Conference on Automated Software Engineering (ASE). 398–409.
- Liu et al. (2021) Ze Liu, Yutong Lin, Yue Cao, Han Hu, Yixuan Wei, Zheng Zhang, Stephen Lin, and Baining Guo. 2021. Swin transformer: Hierarchical vision transformer using shifted windows. In Proceedings of the IEEE/CVF international conference on computer vision. 10012–10022.
- Meta platforms. (2022) Meta platforms. 2022. Pytorch Framework. https://pytorch.org/[Accessed on Dec. 27, 2022].
- Microsoft. (2022) Microsoft. 2022. vscode. https://code.visualstudio.com[Accessed on Dec. 12, 2022].
- Moran et al. (2020) Kevin Moran, Carlos Bernal-Cárdenas, Michael Curcio, Richard Bonett, and Denys Poshyvanyk. 2020. Machine Learning-Based Prototyping of Graphical User Interfaces for Mobile Apps. IEEE Transactions on Software Engineering 46, 2 (2020), 196–221. https://doi.org/10.1109/TSE.2018.2844788
- Moran et al. (2018) Kevin Moran, Boyang Li, Carlos Bernal-Cárdenas, Dan Jelf, and Denys Poshyvanyk. 2018. Automated reporting of GUI design violations for mobile apps. In Proceedings of the 40th International Conference on Software Engineering. 165–175.
- Nguyen and Csallner (2015) Tuan Anh Nguyen and Christoph Csallner. 2015. Reverse Engineering Mobile Application User Interfaces with REMAUI (T). In 2015 30th IEEE/ACM International Conference on Automated Software Engineering (ASE). 248–259. https://doi.org/10.1109/ASE.2015.32
- Robinson (2019) Alex Robinson. 2019. Sketch2code: Generating a website from a paper mockup. ArXiv abs/1905.13750 (2019).
- Sketch. (2022a) Sketch. 2022a. Sketch Command-line interface. https://developer.sketch.com/cli/[Accessed on Dec. 27, 2022].
- Sketch. (2022b) Sketch. 2022b. Sketch software. https://www.sketch.com/[Accessed on Dec. 27, 2022].
- Su et al. (2012) Hao Su, Jia Deng, and Li Fei-Fei. 2012. Crowdsourcing annotations for visual object detection. In Workshops at the Twenty-Sixth AAAI Conference on Artificial Intelligence.
- Tan and Le (2019) Mingxing Tan and Quoc Le. 2019. Efficientnet: Rethinking model scaling for convolutional neural networks. In International conference on machine learning. PMLR, 6105–6114.
- Xie et al. (2020) Mulong Xie, Sidong Feng, Zhenchang Xing, Jieshan Chen, and Chunyang Chen. 2020. UIED: A Hybrid Tool for GUI Element Detection. In Proceedings of the 28th ACM Joint Meeting on European Software Engineering Conference and Symposium on the Foundations of Software Engineering (Virtual Event, USA) (ESEC/FSE 2020). Association for Computing Machinery, New York, NY, USA, 1655–1659. https://doi.org/10.1145/3368089.3417940
- Xie et al. (2022) Mulong Xie, Zhenchang Xing, Sidong Feng, Xiwei Xu, Liming Zhu, and Chunyang Chen. 2022. Psychologically-inspired, unsupervised inference of perceptual groups of GUI widgets from GUI images. In Proceedings of the 30th ACM Joint European Software Engineering Conference and Symposium on the Foundations of Software Engineering. 332–343.
- Zang et al. (2021) Xiaoxue Zang, Ying Xu, and Jindong Chen. 2021. Multimodal icon annotation for mobile applications. In Proceedings of the 23rd International Conference on Mobile Human-Computer Interaction. 1–11.
- Zhang et al. (2021) Xiaoyi Zhang, Lilian de Greef, Amanda Swearngin, Samuel White, Kyle Murray, Lisa Yu, Qi Shan, Jeffrey Nichols, Jason Wu, Chris Fleizach, Aaron Everitt, and Jeffrey P Bigham. 2021. Screen Recognition: Creating Accessibility Metadata for Mobile Applications from Pixels. In Proceedings of the 2021 CHI Conference on Human Factors in Computing Systems (Yokohama, Japan) (CHI ’21). Association for Computing Machinery, New York, NY, USA, Article 275, 15 pages. https://doi.org/10.1145/3411764.3445186