The effect of initial texture on multiple necking formation in polycrystalline thin rings subjected to dynamic expansion
Abstract
In this paper, we have investigated, using finite element calculations, the effect of initial texture on the formation of multiple necking patterns in ductile metallic rings subjected to rapid radial expansion. The mechanical behavior of the material has been modeled with the elasto-viscoplastic single crystal constitutive model developed by Marin (2006). The polycrystalline microstructure of the ring has been generated using random Voronoi seeds. Both grain and grain aggregates have been investigated, and for each polycrystalline aggregate three different spatial distributions of grains have been considered. The calculations have been performed within a wide range of strain rates varying from to , and the rings have been modeled with four different initial textures: isotropic texture, Goss texture, R Goss texture and Z fiber texture. The finite element results show that: (i) the spatial distribution of grains affects the location of the necks, (ii) the decrease of the grain size delays the formation of the necking pattern and increases the number of necks, (iii) the initial texture affects the number of necks, the location of the necks, and the necking time, (iv) the development of the necks is accompanied by a local increase of the slip activity. This work provides new insights into the effect of crystallographic microstructure on dynamic plastic localization and guidelines to tailor the initial texture in order to delay dynamic necking formation and, thus, to improve the energy absorption capacity of ductile metallic materials at high strain rates.
keywords:
Dynamic necking , Inertia , Crystal plasticity , Texture , Finite elements1 Introduction
The ring expansion experiment developed by Niordson (1965) has become a reference benchmark problem to investigate dynamic necking localization and fragmentation of ductile metallic materials. The test consists of a thin circular specimen with square/rectangular cross-section which is expanded radially at high strain rates using electromagnetic loading schemes, explosive charges or mechanical loading systems such as gas guns (Fyfe and Rajendran, 1980; Goto et al., 2008; Wood et al., 2021; Gant et al., 2021), so that multiple necks are formed throughout the circumference of the sample at large strains, leading to the final fragmentation of the ring. The principal advantage of the rapidly expanding ring experiment –in comparison with the tensile impact testing of linear specimens (slender bars)– is that the radial symmetry of both specimen and loading nearly eliminates the propagation of stress waves along the hoop direction of the sample before necking localization, thus revealing the true dynamic properties of the material.
The experiments of Grady and Benson (1983) with OFHC copper and aluminum -O rings having inner diameter of and square cross-section of , tested at radial velocities ranging from about to , showed that the number of necks, the proportion of necks developing into fractures, and the fracture strain, increase with the applied velocity. Following Mott (1947) postulates, the distribution of neck spacings and fragment sizes was attributed to the spatial variability of the necking and fracture strains throughout the circumference of the ring, and to the unloading waves released from growing necks and early fractures which remove the driving force from nearby sections of the specimen before fracture is completed. Moreover, Altynova et al. (1996) carried out ring expansion tests with aluminum and OFHC copper samples, for radial speeds ranging between and . The rings had inner diameter of , radial thickness of , and different widths varying from to . For expansion velocities above , the ductility of aluminum 6061 and OFHC copper rings increased with respect to the quasi-static value by and , respectively. The improved ductility at high strain rates was attributed to inertia effects which diffuse deformation throughout the specimen, leading to stabilization against neck growth and delaying failure. Ring expansion experiments on U6N specimens were carried out by Grady and Olsen (2003). The samples had inner diameter of and square cross-section of , and were submitted to radial velocities ranging from to . The number of fragments, and the distributions of fragment sizes and masses, were compared with the fragmentation theories of Mott (1947) and Kipp and Grady (1985) which consider the fragmentation patterns of metallic samples subjected to intense impulsive tensile loads to be the result of the activation of weak points of the material (e.g., material defects like pores, cavities and cracks formed during materials processing, and microstructural heterogeneities like soft phases, grain boundaries) which are scattered throughout the specimen and determine the distributions of necks and fracture sites. Zhang and Ravi-Chandar (2006) tested aluminum 6061-O specimens with inner diameter of , and rectangular cross-section of thickness and length . The radial loading speeds investigated ranged between and . Consistent with previous works of Grady and Benson (1983) and Grady and Olsen (2003), the experiments of Zhang and Ravi-Chandar (2006) showed that the neck and fragment distributions shift towards smaller neck spacings and smaller fragments, and towards narrower distributions, with increasing loading rate. It was concluded that as the strain rate increases, the propagation of the release wave emanating from growing necks and early fractures is limited to shorter times, so that the unloading wave does not travel far enough quickly to inhibit further nucleation of necks and fractures at neighboring locations. An incomplete list of additional papers including ring expansion experiments on metallic samples is (Perrone, 1968; Stepanov and Babutskii, 1984; Janiszewski, 2012; Cliche and Ravi-Chandar, 2018).
The ring expansion problem has been also extensively investigated over the last two decades using finite element calculations. For instance, Guduru and Freund (2002) carried out simulations in ABAQUS/Explicit of the ring expansion experiments performed by Grady and Benson (1983), modeling the mechanical behavior of the material using Gurson porous plasticity, and assuming that fracture occurs when a critical value of porosity is achieved. The finite element model consisted of a long rod submitted to rapid stretching and with initial conditions consistent with the expanding ring. The finite element results yielded qualitative agreement with the experiments for the number of necks, the fragmentation statistics, and the increase in the fracture strain with the loading rate. Moreover, Rusinek and Zaera (2007) performed ring expansion finite element simulations modeling the material behavior with von Mises plasticity, different constitutive relations for the evolution of the yield stress, and a fracture criterion which assumed the material to fail when a predefined value of plastic strain is reached. The numerical predictions for the number of fragments were compared with the experimental data reported by Grady and Benson (1983), Altynova et al. (1996) and Diep et al. (2004) for aluminum 1100-0, aluminum 6061 and steel 34CrNiMo6, respectively, and satisfactory quantitative agreement was obtained for the whole range of loading velocities considered. Moreover, additional calculations with baseline material parameters corresponding to mild steel showed that the number of fragments increases with the decrease of the strain hardening and with the increase of the material density. Shortly after, Zhang and Ravi-Chandar (2008) simulated ring expansion experiments on aluminium 6061-O specimens with different cross-section sizes using von Mises plasticity and a power law strain hardening to model the mechanical behavior of the material. A random distribution of material defects (modeled as elements of the finite element grid with low yield stress) was included in the finite element model to break the symmetry of the problem and trigger plastic localization. The loading condition was a pulse pressure applied in the inner surface of the ring, leading to a maximum expansion velocity of , corresponding to a strain rate of . The calculations showed, in agreement with the experiments, that increasing the cross-section of the ring delays localized necking. N’souglo et al. (2018) carried out finite element calculations of elasto-plastic bars with yielding modeled with Gurson plasticity and submitted to dynamic tension at strain rates ranging from to . An initial velocity field compatible with the loading condition was applied on the specimen to minimize the intervention of waves before plastic flow localization, so that the deformation field during the bar extension was consistent with the ring expansion problem. The main difference with respect to the calculations of Guduru and Freund (2002) is that the initial porosity –which in the Gurson model intends to idealize material defects– was randomly varied at the element level, using predefined upper and lower bounds for the porosity variation, and different spatial distributions. The results of N’souglo et al. (2018) showed that, for the lower strain rates, the distribution of neck spacings is heterogeneous, and the porosity defects act as preferential sites for the nucleation of necks. On the other hand, as the strain rate increases, the distribution of neck spacings becomes more homogeneous due to the regularizing effect of inertia. Moreover, Vaz-Romero et al. (2019) performed a comparative study on the formation of multiple necks and fragments in elasto-plastic and hyperelastic rings subjected to expansion velocities ranging between and . The elasto-plastic material and the hyperelastic material were modeled with constitutive equations which provide nearly the same stress-strain response during monotonic uniaxial tensile loading, and fracture was assumed to occur at the same level of deformation energy. The calculations predicted virtually the same number of necks for the elasto-plastic and the hyperelastic rings, however, the mechanisms controlling the development of the necking pattern and the final fragmentation of the specimens were shown to be different. In the elasto-plastic rings several necks were arrested due to the release waves that travel throughout the circumference of the specimen after the localization process has started, so that the number of fractures was significantly lower than the number of necks. On the other hand, the release waves did not arrest the growth of any neck in the hyperelastic rings, on the contrary, the elastic energy released from the sections of the ring which are unloading during the localization process fueled the development of the necks, so that most of the necks developed into fractures. More recently, Marvi-Mashhadi et al. (2021) performed finite element calculations of expanding rings which included explicit representation of the porous microstructure of different additive-manufactured metals. The mechanical behavior of the material was modeled with von Mises plasticity, and a critical value of effective plastic strain was used as fracture criterion. The calculations, carried out for expansion velocities ranging from to , yielded individualized correlations between the number of necks and fragments, and the main features of the porous microstructure, including the initial void volume fraction and the maximum void size. The following is an incomplete list of additional finite element works in which the formation of multiple necks and fragments in metallic rings subjected to dynamic expansion is modeled (Pandolfi et al., 1999; Becker, 2002; Rodríguez-Martínez et al., 2013b; Vaz-Romero et al., 2017; Marvi-Mashhadi and Rodríguez-Martínez, 2020; El Maï et al., 2022).
Notice that most of the works cited in previous paragraph focused the attention on the effect that mechanical behavior of the material and material defects have on the necking and fragmentation patterns. However, all these papers modeled the material response using macroscopic constitutive equations, paying no attention to the polycrystalline microstructure of the metallic rings, although the microstructure is known to be responsible for inherent material variations at the micromechanical level that favor plastic localization. This is precisely the gap we intend to fill in this paper, in which crystal plasticity finite element simulations of metallic rings subjected to dynamic expansion have been performed using the elasto-viscoplastic constitutive model developed by Marin (2006). The polycrystalline microstructure of the ring has been generated using two different random Voronoi tessellations containing and grains, respectively. The grains of the microstructure have been assigned with an initial crystal orientation corresponding to one of the four different textures investigated: isotropic texture, Goss texture, R Goss texture and Z fiber texture. A salient feature of this investigation is that the finite element results show that the initial texture can be tailored to delay the formation of dynamic necks, improving the energy absorption capacity of ductile metallic materials at high strain rates. Note that, while Dequiedt and Denoual (2021) were probably the first researchers to perform crystal plasticity finite element simulations in order to study the effect of material microstructure on dynamic plastic localization, to the authors’ knowledge, this is the first paper ever providing a systematic analysis on the effect of initial texture on the formation of multiple necking patterns.
2 Crystal plasticity model
The single crystal constitutive model used to perform the calculations of Section 4 is the elasto-viscoplastic formulation developed by Marin (2006), specialized to the case of small elastic strains. The main features of the formulation are presented in what follows, while the reader is referred to the technical report of Marin (2006) to obtain additional details. The model formulation follows the classical works by Hill and Rice (1972) and Asaro and Needleman (1985) as concerns the kinematics description and the use of the rate-dependent power law for slip.
Accordingly, the constitutive model considers that crystallographic slip is the dominant deformation mechanism. The single crystal kinematics rely on the multiplicative decomposition of the deformation gradient into an elastic component and a plastic component :
| (1) |
where describes the motion of dislocations on crystallographic planes (leaving the crystal lattice unchanged), while and represent the rotation and the elastic stretching of the lattice, respectively. The decomposition (1) introduces two intermediate configurations between the reference and the current configurations, which are denoted as and , respectively. Note that brings the crystal from the reference to the intermediate configuration , while connects with the intermediate configuration , which is used to express the crystal constitutive equations.
Moreover, assuming small elastic strains, is approximated by:
| (2) |
where is the unit second-order tensor and is the small elastic strain tensor with , so that the current configuration differs from the intermediate configuration only by an infinitesimal amount. Hence, the rate of deformation tensor and the spin tensor are expressed as:
| (3) |
with and being the elastic part of the rate of deformation tensor and the elastic lattice spin tensor, respectively. Note that the superscript refers to the tensor transpose, is the material Jaumann rate, and denotes differentiation with respect to time. Moreover, and are the plastic part of the rate of deformation tensor and the plastic spin tensor given by:
| (4) |
where is the plastic shear rate on the slip system, is the number of slip systems, and is the Schmidt tensor with and being the slip direction and the normal to the slip plane in the current configuration, respectively.
The plastic shear rate is defined with a power law flow rule:
| (5) |
where is a reference shear strain rate and is the rate sensitivity of slip. Moreover, is the slip system hardness governed by the following modified Voce-type relation:
| (6) |
where is the initial hardening rate and is the initial slip strength, while , the saturation slip strength, is given by:
| (7) |
with being the net shear strain rate within the crystal, and , and being the slip system hardening parameters which, similarly to and , are taken to be the same for all slip systems.
Moreover, in equation (5), is the resolved shear stress on the slip system:
| (8) |
where is the Kirchhoff stress tensor defined by the elasticity relationship:
| (9) |
with being the fourth order crystal elasticity tensor.
The calculations presented in Section 4 have been performed with the UMAT user subroutine developed by Marin (2006) for ABAQUS/Standard. The integration of the crystal plasticity constitutive model has been carried out using an implicit numerical integration procedure, see Marin (2006) for details. The material investigated is aluminum with FCC structure. The twelve slip systems in FCC crystal structure are shown in Table 1. The anisotropic elasticity constants (see Eq. (10)), taken from Marin (2006), and the parameters for the flow rule (see Eq. (5)) and the hardening law (see Eq. (6)), taken from Beaudoin et al. (1994), are shown in Table 2. The initial density used in the calculations is . Note that the mild strain rate sensitivity of the material presumably heightens the influence of texture on the multiple necking patterns. It is expected that increasing the value of the strain rate sensitivity parameter will decrease the relative influence of texture on necking ductility (strain rate sensitivity stabilizes the material behavior, see Mercier and Molinari (2003) and Zhou et al. (2006)). Nevertheless, validation of this hypothesis is left for future work.
3 Finite element model
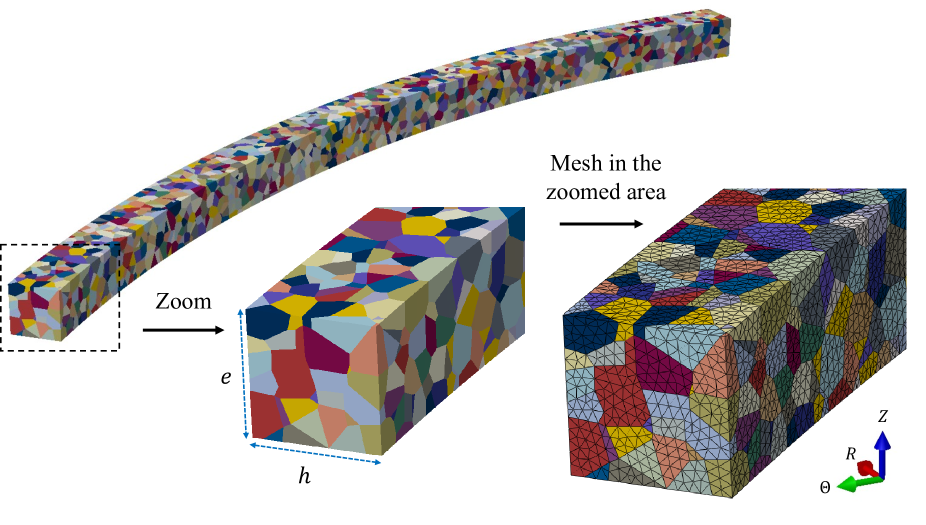
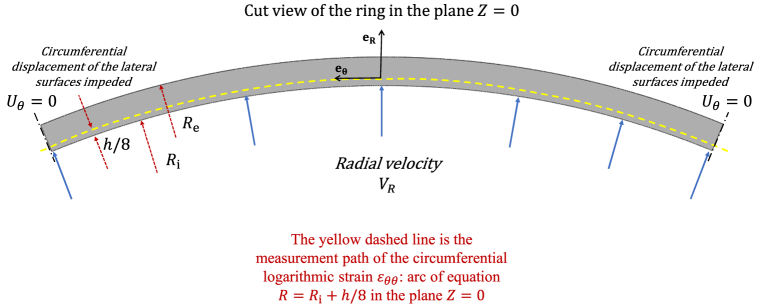
This section describes the finite element model developed to study the formation of multiple necks in polycrystalline thin rings subjected to rapid radial expansion, see Fig. 1. Material points are referred to using cylindrical coordinates . The origin of the coordinate system is located at the center of mass of the ring.
The inner and outer radii of the specimen are and , respectively, and the axial and radial thicknesses are and , see Fig. 1a and 1b. Similar specimen dimensions were used in the experiments performed by Zhang and Ravi-Chandar (2006). In order to reduce the computational time, only one eighth of the ring has been analyzed, so that, to maintain the axial symmetry of the problem, the circumferential displacement of the lateral surfaces of the specimen has been impeded, see Fig. 1b. The loading condition is a radial velocity applied in the inner surface of the ring which remains constant during the entire analysis (Rusinek and Zaera, 2007; Vadillo et al., 2012; Vaz-Romero et al., 2019), whereas the initial condition is a radial velocity of the same value applied to all material points (Marvi-Mashhadi and Rodríguez-Martínez, 2020; Marvi-Mashhadi et al., 2021). The application of this initial condition minimizes the propagation of waves through the radial thickness of the ring caused by the abrupt motion of the inner surface at , precluding instantaneous plastic localization due to the velocity loading condition (Needleman, 1991; Xue et al., 2008; Vaz-Romero et al., 2019). The calculations are performed for loading velocities ranging between and , leading to nominal strain rates varying from . While the largest strain rates investigated exceed the regular experimental capabilities (depending on the specimen size, the maximum strain rate attained in ring expansion laboratory experiments is , see Zhang and Ravi-Chandar (2006) and Janiszewski (2012)), exploring such a wide range of loading rates helps to enlighten the interplay between inertia effects and crystallographic microstructure. Moreover, similar range of loading velocities and strain rates was considered in the numerical simulations performed by El Maï et al. (2022) to investigate the effect of surface roughness on the formation of multiple necks in round bars subjected to dynamic stretching, and in the ring expansion calculations performed by Rodríguez-Martínez et al. (2013a) to determine the effect of strain rate on the average neck spacing in multiple necking patterns (see Section 1). Note that the largest strain rates investigated are characteristic of hypervelocity impacts (Hassani et al., 2020) and high-energy forming operations (Golovashchenko et al., 2013).
The polycrystalline microstructure of the rings has been created with the open-source software NEPER (Quey et al., 2011), so that the specimens have been tessellated into an aggregate of grains using random Voronoi seeds (grains are also referred to as crystals in this paper). The color map in Fig. 1a depicts the grains with different orientations. Two polycrystalline aggregates of and grains have been generated (the number of grains will be denoted as ), and for each polycrystalline aggregate up to three different spatial distributions of seed points, D1, …, D3, have been considered (note that each spatial distribution of seed points amounts to a different spatial distribution of grains with different orientations). The resulting microstructures are denoted by N5000-D1,…, N5000-D3, and N15000-D1, …, N15000-D3, respectively. The idea is to investigate the effects of grain size and spatial distribution of grains on the formation of the necking pattern. Note that the microstructures with and grains have in average and grains throughout the thicknesses of the ring, which leads to an average grain size of and , respectively. While the grains are relatively large, similar grain sizes have been reported for different commercial aluminum alloys (Shankar et al., 2005; Patil et al., 2014; Padmanabhan et al., 2019). Performing calculations with smaller grain size led to excessive increase of the computational cost of the calculations (see next paragraphs). Moreover, each grain of the polycrystalline aggregate is allotted with a crystal orientation taken from one of the four different textures that have been generated with an in-house Wolfram Mathematica code developed for this purpose, namely, isotropic texture (randomly oriented grains which indeed lead to isotropic texture, see Fig. 3), Goss texture (see Fig. 5), R Goss texture (see Fig. 7) and Z fiber texture (see Fig. 9). The anisotropic textures were generated perturbing the corresponding ideal orientations according to the formula ( and are rotation matrix transforming the local basis of the cylindrical frame to the crystal frame):
| (10) |
where is the rotation matrix of perturbation specified by –the misorientation axis defined by two angles , polled randomly from the intervals and , respectively, assuming uniform distribution in the interval. Moreover, is the misorientation angle also polled randomly assuming a normal (Gaussian) distribution with the mean value equal zero and standard deviation. The resulting orientation is then assigned to the grain of the ring microstructure. Recall that is the number of grains. All the microstructures have been generated using a specific seed (random number seed), allowing for replicable analysis. The goal is to investigate the effect of initial texture on the formation of the necking pattern (the orientation of the crystals can change during loading). Note that the radial symmetry of the problem is broken by the different orientation of the grains, leading to perturbations in the field variables and ultimately to the formation of necks (there is no need to introduce geometrical or material defects to break the symmetry of the problem, e.g., see Zhang and Ravi-Chandar (2008)).
The ring is discretized using four node linear tetrahedral elements (C3D4 in ABAQUS notation), as they are particularly suitable to describe the complex geometry of the grains, see Fig. 1a. For the microstructures with and grains, the average number of elements and the standard deviation for the three distributions of seed points are and , respectively, with the average number of elements per grain being for both microstructures. Moreover, we have performed a mesh sensitivity analysis and checked that increasing the number of elements hardly affects the strain fields, the number of necks and the necking time predicted by the finite element simulations (the results of the mesh sensitivity analysis are not shown for the sake of brevity). We are aware that using tetrahedral elements to discretize the ring introduces artificial stiffness in the model which may delay necking. Nevertheless, it is difficult to provide a quantitative measure of the effect that using this type of element has on the finite element results. Note that we have also used C3D4 elements to discretize rings and plates containing explicitly resolved pores and subjected to dynamic loading (Marvi-Mashhadi et al., 2021; Nieto-Fuentes et al., 2022), and the necking predictions were consistent with experiments and numerical calculations available in the literature, which reinforces the idea that the trends presented in this paper are hardly affected by the mesh. The calculations have been performed with the dynamic implicit solver of ABAQUS/Standard (2019), using core of a workstation Intel Xeon Gold @ GHz. The time increment was set by the code. The computational cost of each simulation ranged between and days, depending on the microstructure considered and the applied velocity. Increasing the loading velocity has a twofold impact on the computational time, decreasing the necking time because the loading process is shorter (i.e., reducing the computational cost), but increasing the necking strain due to inertia effects (i.e., increasing the computational cost). Note that the finite element results have been processed by first converting the ABAQUS ODB files to VTK format for ParaView using the Python script developed by Liu et al. (2017).
4 Results
The presentation of results is divided into three sections: the effects of grain size, spatial distribution of grains and texture development on the necking pattern are investigated in Section 4.1 for the initially isotropic material, Section 4.2 shows the influence of initial texture on the necking time, on the necking pattern and on the distribution of grain orientations after necking localization, and Section 4.3 illustrates the effect of loading velocity on the number of necks for different initial textures.
4.1 Salient features
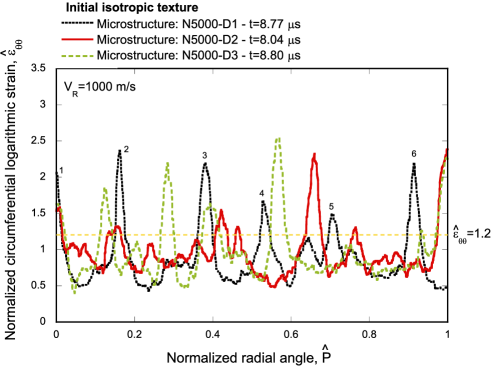
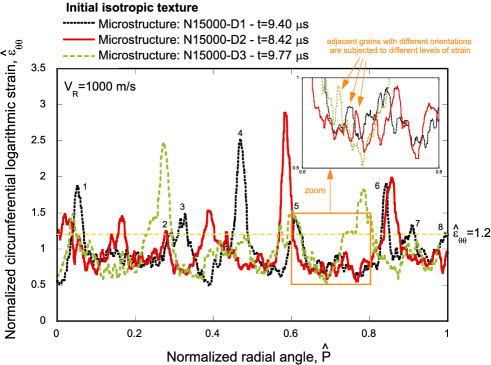
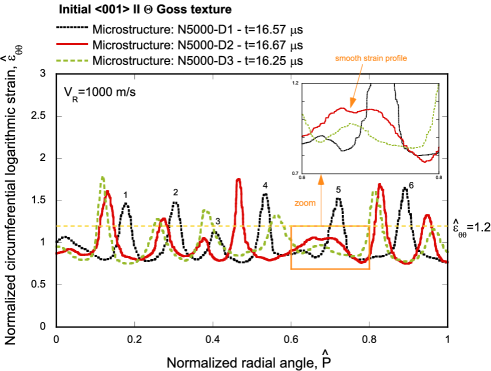
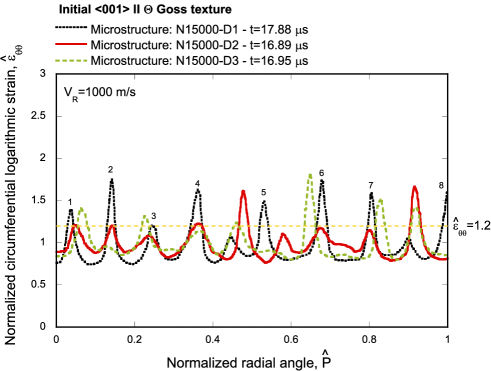
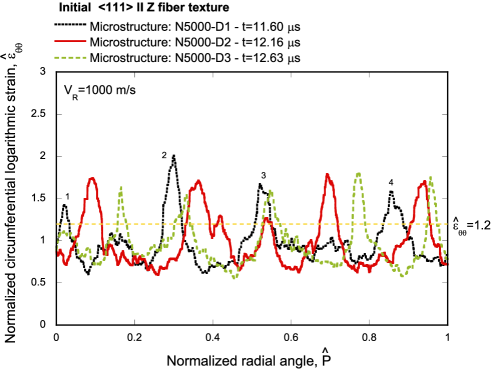
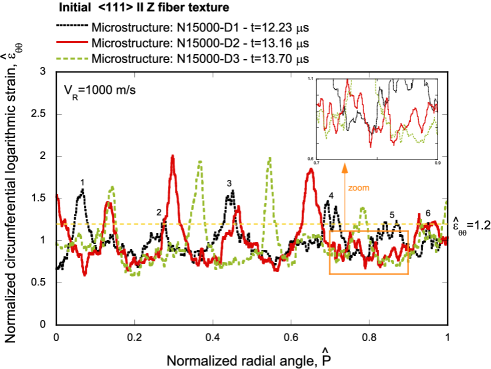
The calculations presented in this section are performed with the initially isotropic texture (grains randomly oriented), for a loading velocity of , which corresponds to a nominal strain rate of . Fig. 2 shows the normalized circumferential logarithmic strain versus the normalized perimeter of the ring . Recall from Section 3 that only one eighth of the ring is modeled in the finite element simulations. The normalized perimeter of the ring is also referred to as normalized radial angle. The results correspond to aggregates containing and grains, generated with three different spatial distributions of grains: N5000-D1,…, N5000-D3, and N15000-D1, …, N15000-D3. The notation used to designate the microstructures was introduced in Section 3. The normalized circumferential logarithmic strain is defined as , where is the circumferential logarithmic strain measured along the path shown in Fig. 1b, and approximates the background circumferential logarithmic strain in the ring, where refers to the loading time. The background strain corresponds to the fundamental theoretical solution of the problem, which is computed assuming homogeneous deformation of the specimen, so that before plastic localization occurs (see Fig. 3a in Marvi-Mashhadi and Rodríguez-Martínez (2020)). The normalized circumferential logarithmic strain facilitates to perform one-to-one comparisons of necking patterns obtained from calculations carried out at different loading velocities and with different initial textures, for which the formation of necks occurs at (very) different logarithmic strains (see Marvi-Mashhadi and Rodríguez-Martínez (2020)). The curves of Fig. 2 correspond to the necking time and display a succession of excursions of strain which stand for sections of the ring with localized plastic deformation. Following N’souglo et al. (2021) and Jacques and Rodríguez-Martínez (2021), the necking time is the loading time when the condition is met for the first time for any material point of the path indicated in Fig. 1b. Note that is a scalar measure of plastic strain rate. The necking criterion corresponds to the specimen unloading, indicating that plastic strain has localized, giving rise to the formation of necking instabilities. The necking pattern is assumed to be (fully) formed at the necking time. Moreover, note that, while is an arbitrary value of plastic strain rate for the necking condition, we have checked that the necking time is largely independent of this threshold value, provided that it is small enough as compared to the nominal strain rate, so that the sections of the ring outside the excursions of strain are unloaded. Similarly to Marvi-Mashhadi and Rodríguez-Martínez (2020), the excursions of strain that meet the condition at the necking time are taken to be the necks of the localization pattern (the results in Figs. 2, 4, 6, 8 and 11-14 correspond to the necking time). This criterion is relaxed by since, as the necking condition is approached, the simulations yield a field output every (it is difficult to obtain more field and history outputs due to the increase in the size of the ODB file), which determines the error in the identification of the necking time and thus in the number of necks (the actual condition for the necking time may be met between the selected field output included in Figs. 2, 4, 6, 8 and 11-14, and the next one corresponding to later). This explains that necks and in Figs. 4a and Fig 6a are taken to be necks, while the peak strain is slightly below . (the necking time and the number of necks for all calculations reported in the paper are included in A). The necks for the microstructures N5000-D1 and N15000-D1 are indicated with black numbers in Figs. 2a and 2b, respectively. Moreover, Marvi-Mashhadi and Rodríguez-Martínez (2020) showed that this criterion to determine the number of necks is not generally very sensitive to the cut-off value of chosen ( in this paper), providing numerical predictions for the number of necks which are consistent with the experimental evidence (the reader is referred to the works of Guduru and Freund (2002) and El Maï et al. (2022) to find alternative criteria for the identification of necks in multiple necking patterns). Note that the roughness of the curves, which show many little peaks of strain of smaller size than the necks, see the zoomed area in Fig. 2b, is due to the fact that adjacent grains with different orientations are subjected to different levels of strain, which leads to sharp transitions of strain at the grain boundaries. Recall from Section 1 that Dequiedt and Denoual (2021) performed crystal plasticity calculations to study multiple necking formation in thin plates subjected to dynamic biaxial stretching. Similarly to the results shown in Fig. 2, Dequiedt and Denoual (2021) obtained strain profiles with fluctuations of strain from grain to grain that they also attributed to differences in the local slip resistance of the grains because of their different lattice orientation.
Fig. 2a includes curves for the three microstructures generated with grains (recall that all the curves shown in this paper correspond to the necking time). Attending to the necking criterion (introduced in the paragraph above), necks are formed in the ring for N5000-D1 and for N5000-D2 and N5000-D3. The location of the necks varies with the spatial distribution of grains, which makes apparent the effect of the microstructure on the morphology of the localization pattern. The necking time also shows a slight variation with the microstructure, being smaller for N5000-D2 than for N5000-D1 and N5000-D3 (note that this difference lies within the error in the determination of the necking time based on the criterion given in previous paragraphs).
Fig. 2b shows results for the microstructures with grains. The curves are qualitatively the same than for calculations with grains. For N15000-D1 the necking pattern consists of necks, while necks are formed for N15000-D2 and N15000-D3. While these results are not conclusive, it seems that there is a small increase in the number of necks with the increase in the number of grains (for the grain sizes investigated in this work). Note that the results for the number of necks show limited statistical significance since only one-eight of the ring is modeled. On the other hand, the necking time is greater in average than for the calculations with grains, suggesting that decreasing the grain size delays the formation of the necking pattern (yet, difference lies within the error in the determination of the necking time based on the criterion given in previous paragraphs). Note that, while the mesh is finer for the microstructures with 15000 grains, the differences in the number of necks and the necking time between the microstructures with and grains do not seem to be attributed to the discretization, as decreasing the element size generally leads to the opposite effect (i.e., it leads to earlier formation of necks, see Nieto-Fuentes et al. (2022)). The results obtained in this paper are consistent with the calculations performed by Dequiedt and Denoual (2021) with and grains which showed that decreasing the grain size delays necking formation in thin plates subjected to biaxial stretching. The increasing necking time with decreasing grain size can be attributed to a decrease of the perturbation amplitude introduced by the tessellation with the increasing number of grains. This observation seems to be consistent with the results of El Maï (2014) –see equation (4.10) therein– which showed that increasing the amplitude of perturbations leads to a decrease of the necking time in thin rods with imposed geometrical perturbations and subjected to dynamic stretching.
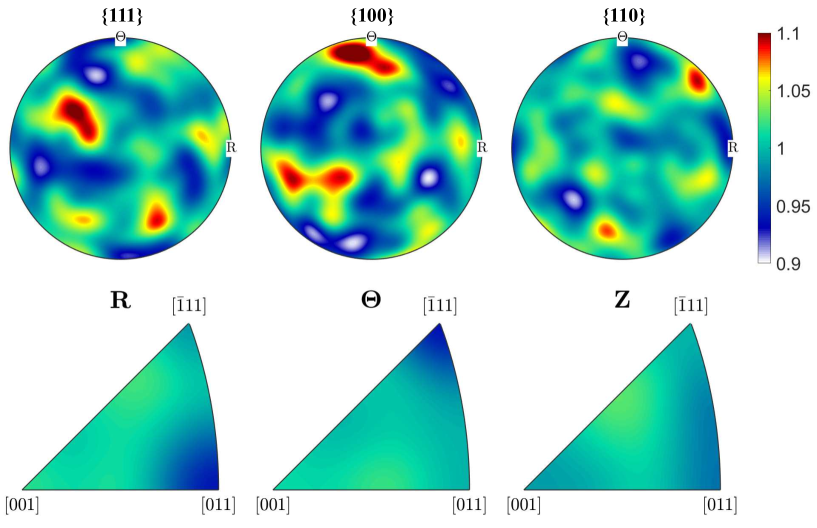
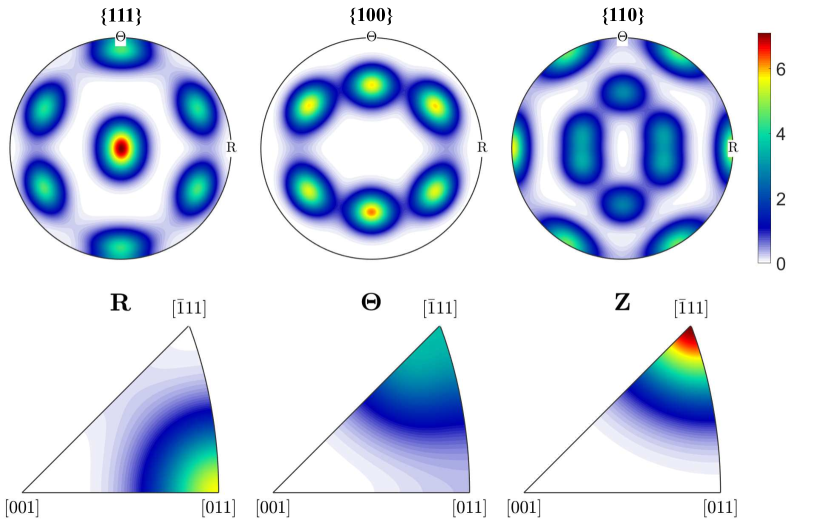
Texture analysis is performed for the microstructure N5000-D1. Fig. 3 includes pole figures for , and plane families, as a standard for crystals of cubic symmetry, with respect to coordinate system. Inverse pole figures show orientation of local R, and Z directions with respect to , and crystal axes (note that by the use of the symmetry of the cubic crystal the plot is reduced to the basic triangle). All the grains of the finite element model are included in the analysis. Fig. 3a shows the results for the undeformed configuration. The color coding of the isocontours is such that the texture index (measured in units of multiple of random distribution) ranges from to for a color scale that goes from white to dark red. The texture index varies within a narrow range of values, and neither the pole figures, nor the inverse pole figures show any preferential orientation of grains (as expected based on the random orientation assigned to the grains in the finite element model, so that this texture is referred to as initially isotropic). Fig. 3b shows the results for the deformed configuration corresponding to the necking time. The color coding is the same used for the undeformed configuration results, yet the texture index shows much wider variation from to . The pole figures show the development of a moderate axially symmetric texture with grains that have rotated during loading to align either the crystallographic directions or the with the circumferential direction of the ring. Notice that for the majority of these grains it is the direction that aligns with the ring expansion direction , with the texture index being twice that for the . This is confirmed by the inverse pole figures in which direction is mostly aligned with crystal axes , with some amount of crystals in which it is aligned with . As a consequence, the inverse pole figures for R and Z directions show that the crystallographic directions more frequently aligned with the radial and axial directions of the ring are the , with texture index approximately double than the and the . These results are easily explained by observing that the material volume elements along the ring circumference are locally under the state of uniaxial tension in the direction . For the assumed initially random orientation distribution, deformation of these elements along the ring is then on average equivalent to the one of the extruded rod with the extrusion direction coaxial with the circumferential direction . Note that in the analyzed example, the inner circumference of the ring has increased to by the necking time, which would correspond to the extrusion process with the rod cross-section reduction (ratio between current and initial cross-section areas). It is well known (Kocks et al., 2000) that texture developed in FCC metals in such process (if initially material was untextured) is composed of and fibers with the advantage of the former one.
4.2 The effect of initial texture
The results included in this section correspond to calculations with three different initial textures: Goss texture, R Goss texture and Z fiber texture. The imposed nominal strain rate is (the same used in the simulations of Section 4.1).
Figs. 4 and 5 show results for the initial Goss texture. The grains along the ring are oriented such that the crystal directions are locally parallel to the circumferential direction, while directions are aligned with the radial and axial directions (see Fig. 5a). Selection of this texture in the analysis is driven by the fact that the Goss component RD (RD - rolling direction) is one of the components of the rolling texture in FCC metals, which if strong leads to the high in-plane anisotropy of the sheet, cf. Kocks et al. (2000). Depending on the process by which the ring is obtained from the rolled sheet one may expect components or R (analyzed in the next part of this subsection) to be present in the ring. Note that the presence of this component after rolling process can be enhanced by some alloying additions or heat treatment.
The evolution of the normalized circumferential logarithmic strain along the normalized perimeter of the ring is shown in Figs. 4a and 4b for calculations performed with microstructures N5000-D1,…, N5000-D3 and N15000-D1,…, N15000-D3, respectively. The results correspond to the necking time (the criterion to determine the necking time was given in Section 4.1). The shape of the curves obtained for all the microstructures is very similar regardless the number and the spatial distribution of grains. On the other hand, the specific location of the necks varies with the microstructure. The number of necks ranges between and for the calculations with grains, and between and for the calculations with grains. These results suggest that the number of necks for the initial Goss texture tends to increase with the decrease of the average grain size (recall that the results for the number of necks show limited statistical significance since only one-eight of the ring is modeled). The necking time is also slightly larger for the aggregates with grains, consistent with the trend obtained from the simulations with initially isotropic texture in which decreasing the grain size delayed necking formation. Moreover, notice that the necking time is almost double than for the initially isotropic texture (compare the necking times reported in Figs. 2 and 4). This is an important finding of this investigation, which shows that texture can be tailored to delay dynamic necking formation and thus to improve the energy absorption capacity of ductile metallic materials at high strain rates. Notice also that the curves present much less roughness than the calculations with initially isotropic texture (compare Figs. 2 and 4). The strain profiles are smooth, with well-defined strain excursions, and the reason is that the initial texture does not evolve during loading, all crystals show similar slip resistance, which leads to gentle transitions of strain from grain to grain (this conclusion is further substantiated with the texture analysis presented below).
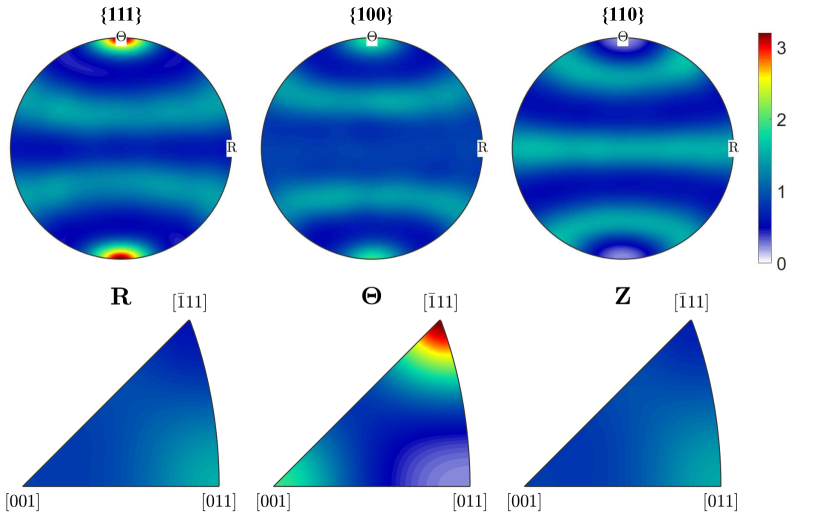
The results of the texture analysis performed for the microstructure N5000-D1 are shown in Figs. 5a and 5b for the undeformed configuration and for the necking time, respectively. As for the case of the initially isotropic texture, the pole figures correspond to , and plane families with respect to coordinate system, and the inverse pole figures to R, and Z directions with respect to , and crystallographic axes (we use the same representations of pole figures and inverse pole figures for all the texture analyses performed in this paper). The texture index ranges from to for a color scale that goes from white to dark red. The large gradients in the texture index shown in the pole figures illustrate the strong texture of the material, the multiple of random orientation reaching for the plane families, and and for the and plane families, respectively. This is the result of the assumed orientation distribution which only slightly may deviate from the ideal configuration as described in Section 3. Notice that the texture does not change during loading (as anticipated in previous paragraph), i.e., the orientation of the crystals stays the same during the whole loading process (compare Figs. 5a and 5b). The inverse pole figures show that the crystallographic direction stays aligned with the radial and axial directions of the ring, and the direction with the circumferential (loading) direction. These results are consistent with the analysis of the initial isotropic texture, which showed the lattice rotating during loading to align the crystallographic directions with the circumferential direction of the ring in some fraction of grains (see Fig. 3). Note that the Goss texture is the component of the fiber . The latter is a stable orientation for the deformation path considered in the analysis (being in principle extrusion deformation in circumferential direction), for which, due to the lack of the lattice spin, we do not observe reorientation. For a strict definition of the stable orientation one may refer to Li (2008).

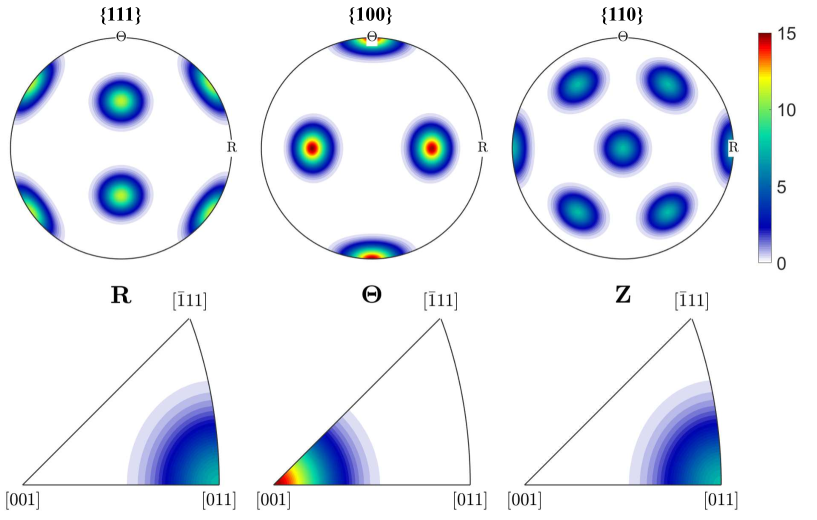
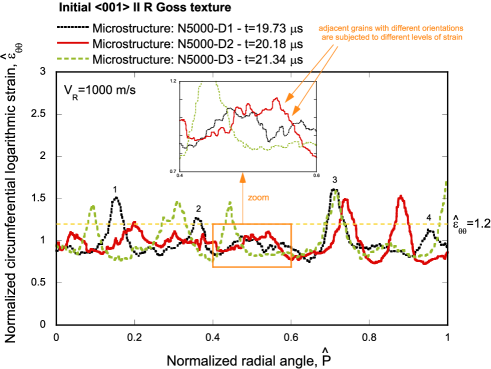
Figs. 6 and 7 include results for the initial R Goss texture. The difference with respect to the previously considered texture is that the crystal directions are locally parallel to the radial ring direction, while directions are parallel to the circumferential and axial directions, so that the crystals are rotated by around Z axis as compared to the previous case (see Figure 6a).
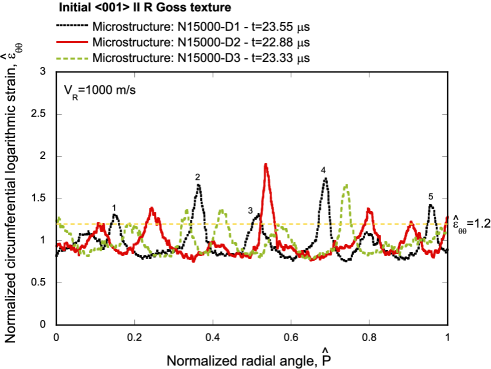
The evolution of the normalized circumferential logarithmic strain along the normalized perimeter of the ring is shown in Figs. 6a and 6b for calculations performed with polycrystalline aggregates containing and grains, respectively. The general trends on the effect of grain size on the necking pattern are the same obtained for the initial isotropic texture and for the initial Goss texture, so that decreasing the grain size delays the necking time and leads to the formation of more necks. Namely, the difference in the average necking time is . Moreover, the number of necks for the microstructures with grains varies from to , while for the aggregates with grains ranges from to (the large relative variability in the number of necks obtained in the realizations with the same number of grains is caused by the limited statistical significance of the number of necks since only one-eight of the ring is modeled). On the other hand, note that the curves show a rough profile, similar to that of the simulations with initial isotropic texture (compare Figs. 2 and 6), which is caused by the evolution of the texture during loading (same reason than in the case of the initial isotropic texture). The reorientation of the crystals leads to an irregular localization pattern, and several sections of the ring with localized plastic deformation do not develop into necks (based on the necking criterion introduced in Section 4.1). Moreover, note that the necking pattern is less uniform than in the case of the Goss texture. For instance, the average normalized peak strain of the necks and the corresponding standard deviation for the microstructure N15000-D1 in the case of initial Goss texture is , while in the case of R Goss texture the peak strain decreases and the standard deviation increases (the average normalized peak strain is the average of the normalized maximum strain of all the necks identified in the corresponding curve). Note also that the necking time is significantly greater for the R Goss texture than for the Goss texture and for the initially isotropic texture, namely, and , respectively (these results are obtained considering the average necking time of the three aggregates with grains).
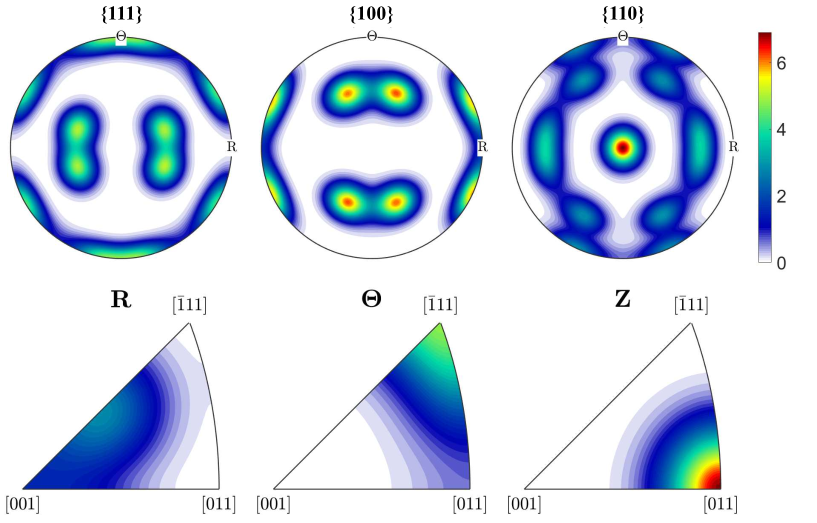
The texture analysis performed for the microstructure N5000-D1 is shown in Fig. 7. The texture index ranges from to in the undeformed configuration, see Fig. 7a, and from to at the necking time, see Fig. 7b, showing a decrease in the texture intensity upon deformation due to the rotation of the crystals during the expansion of the ring. At the necking time, the colored areas of the pole figures are larger, showing grains with orientation other than the initial. For instance, the inverse pole figures bring to light the tendency of the grains to align the crystallographic directions with the circumferential direction of the ring, similarly to the results obtained from the texture analysis on the initially isotropic rings. Notice that, due to the introduced disturbance of the ideal orientation, the initial orientations of the crystals are not stable for the considered loading process, so that during the ring expansion the lattice rotates towards the stability point, so to orient the with circumferential direction, while keeping the directions oriented with the axial direction. This leads to the appearance of the brass-type components in the texture image for the deformed configuration. It should be noted that for the present texture, due to the cross-section anisotropy, uniaxial tension in the circumferential direction is not equivalent to the extrusion process, contrary to previous two cases.
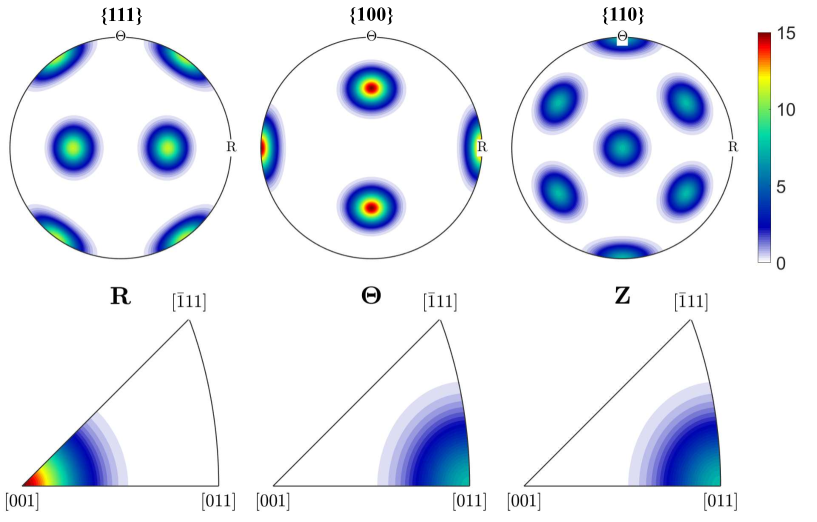
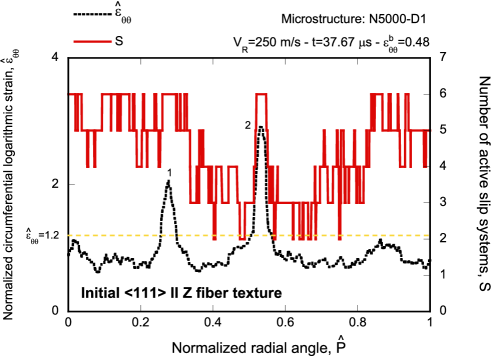
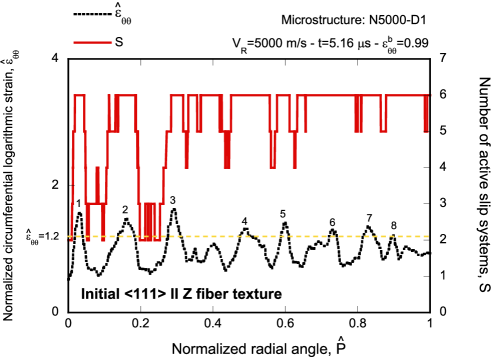
Figs. 8 and 9 include results for the initial Z fiber texture. The grains in polycrystalline materials with such texture have their crystallographic directions generally aligned with (equivalently, crystallographic planes perpendicular to) the ring axial direction Z, while the orientation of the crystallographic planes containing these directions remains random. As a result, the texture displays axial symmetry, so that the ring material is transversely isotropic, with the being the isotropy plane. As already discussed before, the fiber texture is a basic texture component found after extrusion process of initially untextured FCC materials. In such process, grains reorient to align their crystallographic planes (i.e slip planes) perpendicularly to the extrusion direction, so such texture would be observed if the ring is obtained from the extruded tube. The presentation of results follows the same scheme used for the three previous textures investigated.
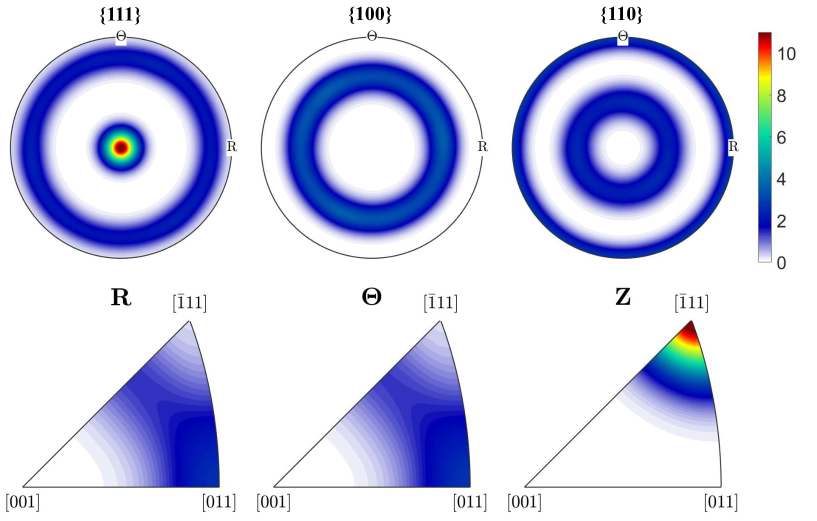
Figs. 8a and 8b show the normalized circumferential logarithmic strain versus the normalized perimeter of the ring for calculations containing and grains, respectively. Decreasing the average grain size increases the number of necks and the necking time, as for the other three initial textures investigated in this paper. The number of necks for the three aggregates with grains is , and for the black, green and red curves, respectively, while excursions of strain meet the necking criterion for the three calculations with grains. We have checked in the field outputs of the simulation N15000-D1 that the two strain peaks in necks and of Fig. 8b correspond to a single neck (local increase of the strain inside the neck due to grains reorientation). Moreover, the average necking time considering the microstructures N5000-D1, N5000-D2 and N5000-D3 is smaller than for the calculations with grains. Note also that the curves show a rough profile, similarly to the calculations with initial isotropic texture and with initial R Goss texture, which indicates that the grains rotate upon deformation of the ring. The change of texture during loading is apparent in the results of the texture analysis which are shown in Figs. 9a and 9b for the undeformed configuration and for the necking time, respectively. For instance, the spherical symmetry of the pole figures in the undeformed configuration turns into reflection symmetry, which is accompanied by a decrease in the texture intensity (the texture index ranges from to in the undeformed configuration, and from to at the necking time). Similarly to the previously analyzed case, the grains tend towards achieving a stable orientation, so to align one of crystal directions with the circumferential ring direction, which in this case is particularly difficult due to initial alignment of one of family with the Z axis. Nevertheless, this trend is visible by a weakening of the texture intensity and spreading of the central pole at pole figure. This trend is also noticeable in the inverse pole figures for the radial and circumferential directions, that were initially the same due to axial symmetry of initial texture, but have evolved differently upon loading, showing a tendency of the crystals to align the crystal direction with the radial ring direction, and the with the circumferential direction. On the other hand, the inverse pole figure for the Z direction looks qualitatively the same before and after deformation. This again illustrates texture evolution towards the stable orientation where here rotation around common direction to align with radial direction precedes the rotation of remaining directions belonging to this family towards circumferential direction. It should be again remarked that, similarly to R Goss texture, due to ring cross-section anisotropy, the uniaxial tension of material volume of the ring in circumferential direction is not in this case equivalent to the extrusion process in this direction.
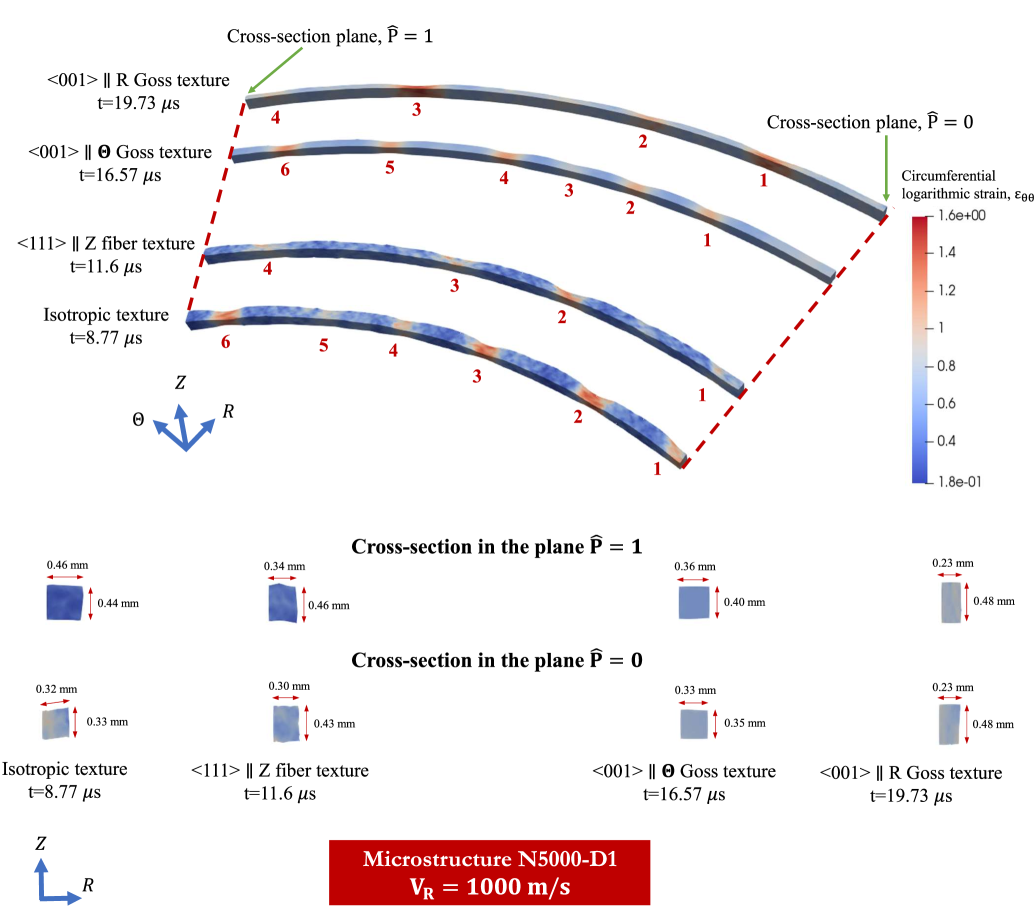
Contours of circumferential logarithmic strain , at the necking time, for the four initial textures investigated, are shown in Fig. 10. The results correspond to the microstructure N5000-D1. The comparison illustrates the differences in necking ductility depending on the initial texture and in the number of necks formed in the ring (the numbering of the necks is the same that in Figs. 2a, 4a, 6a and 8a). Notice that the roughness in the surface of the ring caused by the rotation of the grains upon deformation is especially apparent in the contours corresponding to the initial isotropic texture and the initial Z fiber texture. Moreover, the initial texture also affects the shape of the cross-section of the ring. For instance, for , the cross-section is roughly square for the initial isotropic texture and the initial R Goss texture, and rectangular for the initial Goss texture and the initial Z fiber texture (elongated rectangle along Z direction, dimensions indicated in the contour plots). For , the shape of the ring cross-section for all anisotropic initial textures is very similar to the results obtained for , while in the case of the initially isotropic material, the cross-section is sheared, most likely, due to the neck nucleated at . Note that the deformed shape of the ring cross-section is the manifestation of the intensity of material plastic anisotropy within this plane induced by texture. The more it departs from square shape the more intense induced anisotropy is.
4.3 The effect of loading velocity
The results included in this section correspond to calculations performed with the four initial textures investigated in this paper, with microstructure N5000-D1, and for two different loading velocities, and (which correspond to nominal strain rates of and , respectively).
Fig. 11 shows the normalized circumferential logarithmic strain and the number of active slip systems (among the slip systems of the FCC crystal structure, see Table 1) versus the normalized perimeter of the ring for calculations performed with the initial isotropic texture. A slip system is considered to be active when . The results correspond to the necking time. The calculation for is shown in Fig. 11a. The necking pattern consists of necks that are accompanied by a local increase of the slip activity. Such slip activity is a result of the developed texture in which most of the crystals orient their directions with the circumferential ring axis, what under tension in this direction, leads to the activity of six slip systems. Moreover, minority of crystals which orient directions with loading direction show activity of eight systems. Notice that the lowest values of slip activity appear next to the necks, so that in the transition zones between the unloaded and the strain localization sections of the ring. The number does not drop down to zero because according to the rate dependent power law (5) as soon as there is non-zero resolved shear stress the system will show some slip activity (see the criterion for a slip system to be active introduced above). The calculation for is shown in Fig. 11b. There are necks, showing that the number of necks increases with the loading velocity. This trend is consistent with all experimental, numerical and theoretical results reported in the literature for ductile metallic rings (e.g., Altynova et al. (1996), Rusinek and Zaera (2007) and Mercier and Molinari (2003)), which showed that inertia effects at high strain rates favor the formation of more necks with shorter wavelength. In addition, the necking pattern is more uniform at high loading rate, the average normalized peak strain of the necks and the corresponding standard deviation for and being and , respectively. These results show that inertia favors that the necks grow at similar speed (Vaz-Romero et al., 2019). Note also that the background strain at the necking time increases with the loading rate from for to for due to the stabilizing effect of inertia which delays necking formation. Moreover, the pattern of slip activity is qualitatively very similar that for , with a local increase of the active slip systems at the necks, and local drops next to the necks.
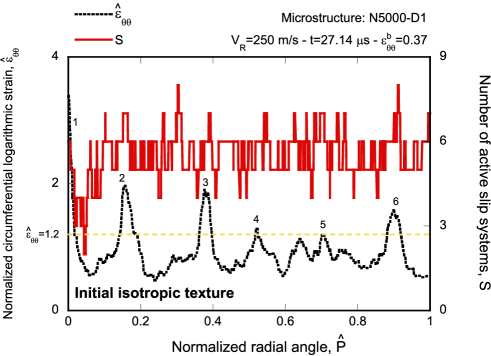
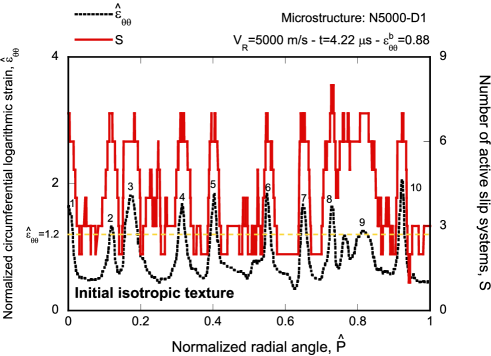
Fig. 12 shows the same results for the initial Goss texture. Similar to the initial isotropic case, increasing the loading rate leads to the nucleation of more necks that grow at similar speed. The pattern of the slip activity also depends on the loading velocity. For there are slip systems active, in agreement with the fact that the circumferential (tension) direction is aligned with the crystal direction throughout the whole process (no lattice reorientation, see Fig. 5b), except at the sections of the ring next to the necks, in which the slip activity drops up to systems for necks and . For there are more drops in the slip activity, because more necks are formed in the ring. Moreover, the background strain at the necking time increases from for to for .
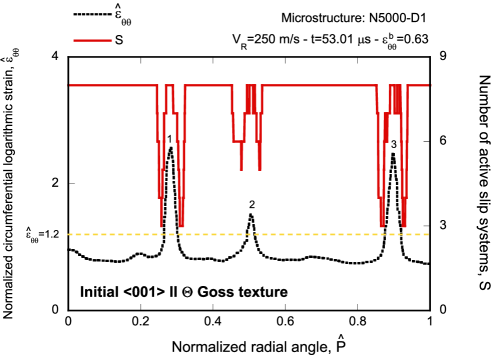
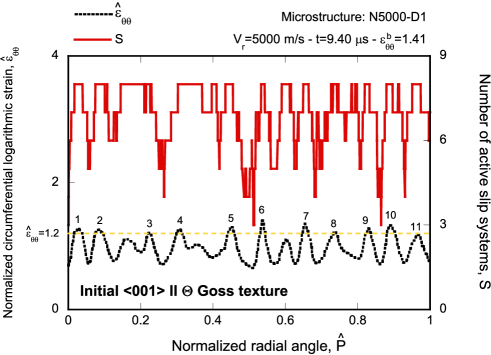
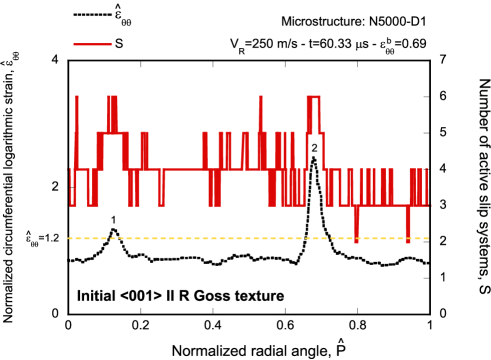
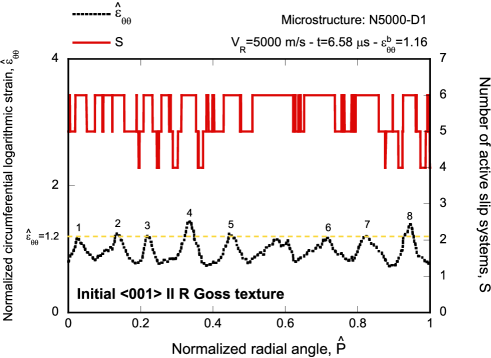
Fig. 13 includes the results corresponding to initial R Goss texture. We have checked that, before necking, due to the initial texture in which crystal axes are aligned with the circumferential (tension) direction, four slip systems are active throughout the ring. Next, when approaching the necking time, due to the lattice reorientation, the number of active slip systems increases to six in the strain localization zones. In general, the patterns of slip activity for R Goss texture are qualitatively similar to the cases of initial isotropic texture and Goss texture, showing a local increase of slip activity at the necks and/or a local decrease next to the necks. Moreover, the number of necks from to increases from to (compare Figs. 13a and 13b), which is slightly more than in the case of Goss texture for which the increase is , and much more than in the case of the initial isotropic texture for which the increase is comparatively modest . This result shows that the increase in the number of necks with the loading rate depends on the initial texture. Similarly, the background strain at the necking time increases with the loading rate depending on the initial texture. Namely, for the initial isotropic texture, the Goss texture and the R Goss texture, the increase in the loading velocity from to leads to an increase of the background strain at the necking time of , and , respectively.
The results corresponding to initial Z fiber texture are included in Figs. 14a and 14b for loading velocities of and , respectively. As in the case of initial R Goss texture, the number of necks increases from to , and the slip activity increases at the necked sections, and drop next to the necks.
5 Concluding remarks
Finite element calculations of ductile metallic rings subjected to dynamic radial expansion have been performed for nominal strain rates varying within the range . The mechanical behavior of the material has been described with the elasto-viscoplastic single crystal constitutive model developed by Marin (2006), with parameters representative of aluminium. The rings have been tessellated into an aggregate of grains using random Voronoi seeds. Two polycrystalline aggregates of and grains have been generated, and for each polycrystalline aggregate three different spatial distributions of grains have been considered. Each grain of the tessellation is allotted with a crystal orientation taken from one of the four different initial textures that have been investigated: isotropic texture, Goss texture, R Goss texture and Z fiber texture. The main conclusions drawn from this research are:
-
1.
The spatial distribution of grains affects the location of the necks.
-
2.
The decrease of the grain size delays the formation of the necking pattern and increases the number of necks.
-
3.
The increase of the loading rate delays necking formation, increases the number of necks and favors the formation of uniform necking patterns with necks that grow at similar speed.
-
4.
The increase in the number of necks with the loading rate depends on the initial texture.
-
5.
The initial texture affects the number of necks, the location of the necks, and the necking time.
-
6.
The development of the necks is generally accompanied by a local increase of the slip activity, while the lowest number of active slip planes appears next to the necks, in the unloaded sections of the ring.
-
7.
For R Goss texture, which has slip activity in the uniform deformation regime smaller than 5, necks formation is generally delayed as compared to Goss texture which shows slip activity equal to (except for the largest loading velocity considered, probably, due to inertia effects).
-
8.
The crystals rotate upon deformation for the initial isotropic texture, the R Goss texture and the Z fiber texture, showing a tendency to align the orientation with the loading direction.
-
9.
The rotation of the grains leads to rough necking patterns due to differences in the local slip resistance of the crystals because of their different lattice orientation.
-
10.
The initial Goss texture does not evolve during loading, leading to smooth necking patterns because all crystals show similar slip resistance which leads to gentle transitions of strain from grain to grain.
The finite element calculations reported in this paper suggest that the initial texture can be tailored to delay dynamic necking localization, and thus to increase the formability and energy absorption capacity of ductile materials at high strain rates. In future works, it would be interesting to consider HCP metals, in which different families of slip systems are active, which are governed by different material parameters. Hexagonal close-packed metals exhibit much stronger anisotropy induced by texture than face-centered cubic metals, and therefore it is expected that the differences in ring expansion and related strain localization observed for FCC metals will be magnified. Another direction for future works is the analysis of microstructures with smaller grain size, as well as constitutive models that include other deformation mechanisms such as twinning. In addition, it would be interesting to determine the link between the initial texture and the macroscopic response of the material to connect the necking ductility of the rings to the initial yield stress and the strain hardening of the polycrystalline aggregate (along the circumferential direction of the ring).
Funding
This work has received funding from the European Union’s Horizon 2020 Programme (Excellent Science, Marie-Skłodowska-Curie Actions) under REA grant agreement 777896 (Project QUANTIFY).
The support of National Science Centre, Poland, through the project 2021/41/B/ST8/03345 is acknowledged.
Conflict of interest
The authors declare that they have no known competing financial interests or personal relationships that could have appeared to influence the work reported in this paper.
Author contributions
K. E. N’souglo: Conceptualization; Data curation; Formal analysis; Investigation; Methodology; Software; Validation; Writing - original draft; Writing - review & editing. K. Kowalczyk-Gajewska: Conceptualization; Formal Analysis; ; Writing - original draft; Writing - review & editing. M. Marvi-Mashhadi: Conceptualization; Methodology; Software; Writing - review & editing. J. A. Rodríguez-Martínez: Conceptualization; Formal analysis; Funding acquisition; Investigation; Methodology; Project administration; Resources; Supervision; Validation; Writing - original draft; Writing - review & editing.
Appendix A Necking time and number of necks
Tables 3-6 include the background circumferential logarithmic strain corresponding to the necking time and the number of necks corresponding to the calculations reported in Section 4.
| Initial isotropic texture | ||||||
| N5000-D1 | 0.37 | 6 | 0.46 | 6 | 0.88 | 10 |
| N5000-D2 | - | - | 0.43 | 7 | - | - |
| N5000-D3 | - | - | 0.46 | 7 | - | - |
| N15000-D1 | - | - | 0.49 | 8 | - | - |
| N15000-D2 | - | - | 0.44 | 7 | - | - |
| N15000-D3 | - | - | 0.50 | 7 | - | - |
| Initial Goss texture | ||||||
| N5000-D1 | 0.63 | 3 | 0.74 | 6 | 1.41 | 11 |
| N5000-D2 | - | - | 0.75 | 5 | - | - |
| N5000-D3 | - | - | 0.73 | 6 | - | - |
| N15000-D1 | - | - | 0.78 | 8 | - | - |
| N15000-D2 | - | - | 0.75 | 7 | - | - |
| N15000-D3 | - | - | 0.76 | 7 | - | - |
| Initial R Goss texture | ||||||
| N5000-D1 | 0.69 | 2 | 0.84 | 4 | 1.16 | 8 |
| N5000-D2 | - | - | 0.85 | 3 | - | - |
| N5000-D3 | - | - | 0.88 | 5 | - | - |
| N15000-D1 | - | - | 0.94 | 5 | - | - |
| N15000-D2 | - | - | 0.93 | 6 | - | - |
| N15000-D3 | - | - | 0.94 | 7 | - | - |
| Initial Z fiber texture | ||||||
| N5000-D1 | 0.48 | 2 | 0.57 | 4 | 0.99 | 8 |
| N5000-D2 | - | - | 0.59 | 5 | - | - |
| N5000-D3 | - | - | 0.61 | 6 | - | - |
| N15000-D1 | - | - | 0.59 | 6 | - | - |
| N15000-D2 | - | - | 0.63 | 6 | - | - |
| N15000-D3 | - | - | 0.65 | 6 | - | - |
References
- ABAQUS/Standard (2019) ABAQUS/Standard, 2019. Abaqus Standard v6.19 User’s Manual. version 6.19 ed., ABAQUS Inc., Richmond, USA.
- Altynova et al. (1996) Altynova, M., Hu, X., Daehn, G.S., 1996. Increased ductility in high velocity electromagnetic ring expansion. Metall Trans A 27, 1837–44.
- Asaro and Needleman (1985) Asaro, R.J., Needleman, A., 1985. Textured development and strain hardening in rate dependent polycrystals. Acta metall. 33, 923–53.
- Beaudoin et al. (1994) Beaudoin, A., Dawson, P., Mathur, K., Kocks, U., Korzekwa, D., 1994. Application of polycrystal plasticity to sheet forming. Computer methods in applied mechanics and engineering 117, 49–70.
- Becker (2002) Becker, R., 2002. Ring fragmentation predictions using the gurson model with material stability conditions as failure criteria. International Journal of Solids and Structures 39, 3555–80.
- Cliche and Ravi-Chandar (2018) Cliche, N., Ravi-Chandar, K., 2018. Dynamic strain localization in magnesium alloy AZ31B-O. Mechanics of Materials 116, 189–201. IUTAM Symposium on Dynamic Instabilities in Solids.
- Dequiedt and Denoual (2021) Dequiedt, J.L., Denoual, C., 2021. Localization of plastic deformation in stretching sheets with a crystal plasticity approach: Competition between weakest link and instable mode controlled process. International Journal of Solids and Structures 210, 183–202.
- Diep et al. (2004) Diep, Q.B., Moxnes, J.F., Nevstad, G., 2004. Fragmentation of projectiles and steel rings using nuerical 3d simulation, in: 21th international symposium of ballistics.
- El Maï (2014) El Maï, S., 2014. Study of the development of instabilities in a dynamically expanding ring. Ph.D. thesis. Université de Lorraine.
- El Maï et al. (2022) El Maï, S., Molinari, A., Mercier, S., 2022. A statistical approach of dynamic necking instabilities. Journal of the Mechanics and Physics of Solids 161, 104798.
- Fyfe and Rajendran (1980) Fyfe, I.M., Rajendran, A.M., 1980. Dynamic pre-strain and inertia effects on the fracture of metals. Journal of the Mechanics and Physics of Solids 28, 17–26.
- Gant et al. (2021) Gant, F., Seisson, G., Longère, P., El Maï, S., Zinszner, J.L., 2021. Plate-impact-driven ring expansion test (pidret) for dynamic fragmentation, in: DYMAT 2021-13th International Conference on Mechanical and Physical Behaviour of Materaisl Under Dynamic Loading-Madrid (Spain)-Sept. 19-24, 2021.
- Golovashchenko et al. (2013) Golovashchenko, S.F., Gillard, A.J., Mamutov, A.V., 2013. Formability of dual phase steels in electrohydraulic forming. Journal of Materials Processing Technology 213, 1191–212.
- Goto et al. (2008) Goto, D., Becker, R., Orzechowski, T., Springer, H., Sunwoo, A., Syn, C., 2008. Investigation of the fracture and fragmentation of explosively driven rings and cylinders. International Journal of Impact Engineering 35, 1547–56.
- Grady and Benson (1983) Grady, D.E., Benson, D.A., 1983. Fragmentation of metal rings by electromagnetic loading. Experimental Mechanics 12, 393–400.
- Grady and Olsen (2003) Grady, D.E., Olsen, M.L., 2003. A statistics and energy based theory of dynamic fragmentation. International Journal of Impact Engineering 29, 293–306.
- Guduru and Freund (2002) Guduru, P.R., Freund, L.B., 2002. The dynamics of multiple neck formation and fragmentation in high rate extension of ductile materials. International Journal of Solids and Structures 39, 5615–32.
- Hassani et al. (2020) Hassani, M., Veysset, D., Nelson, K.A., Schuh, C.A., 2020. Material hardness at strain rates beyond 106 s-1 via high velocity microparticle impact indentation. Scripta Materialia 177, 198–202.
- Hill and Rice (1972) Hill, R., Rice, J.R., 1972. Constitutive analysis of elastic–plastic crystals at arbitrary strain. J. Mech. Phys. Solids 20, 401–13.
- Jacques and Rodríguez-Martínez (2021) Jacques, N., Rodríguez-Martínez, J.A., 2021. Influence on strain-rate history effects on the development of necking instabilities under dynamic loading conditions. International Journal of Solids and Structures 230, 111152.
- Janiszewski (2012) Janiszewski, J., 2012. Ductility of selected metals under electromagnetic ring test loading conditions. International Journal of Solids and Structures 49, 1001–8.
- Kipp and Grady (1985) Kipp, M.E., Grady, D.E., 1985. Dynamic fracture growth and interaction in one dimension. Journal of the Mechanics and Physics of Solids 33, 399–415.
- Kocks et al. (2000) Kocks, U.F., Tomé, C.N., Wenk, H.R., 2000. Texture and Anisotropy. II ed., Cambridge University Press.
- Li (2008) Li, S., 2008. Orientation stability in equal channel angular extrusion. Part I: Face-centered cubic and body-centered cubic materials. Acta Mater. 56, 1018–30.
- Liu et al. (2017) Liu, Q., Li, J., Liu, J., 2017. Paraview visualization of abaqus output on the mechanical deformation of complex microstructures. Computers & Geosciences 99, 135–44.
- Marin (2006) Marin, E.B., 2006. On the formulation of a crystal plasticity model. Technical Report. Sandia National Laboratories.
- Marvi-Mashhadi and Rodríguez-Martínez (2020) Marvi-Mashhadi, M., Rodríguez-Martínez, J.A., 2020. Multiple necking patterns in elasto-plastic rings subjected to rapid radial expansion: The effect of random distributions of geometric imperfections. International Journal of Impact Engineering 144, 103661.
- Marvi-Mashhadi et al. (2021) Marvi-Mashhadi, M., Vaz-Romero, A., Sket, F., Rodríguez-Martínez, J.A., 2021. Finite element analysis to determine the role of porosity in dynamic localization and fragmentation: Application to porous microstructures obtained from additively manufactured materials. International Journal of Plasticity 143, 102999.
- Mercier and Molinari (2003) Mercier, S., Molinari, A., 2003. Predictions of bifurcations and instabilities during dynamic extensions. International Journal of Solids and Structures 40, 1995–2016.
- Mott (1947) Mott, N.F., 1947. Fragmentation of shell cases, Proceedings of the Royal Society, London. pp. 300–8.
- Needleman (1991) Needleman, A., 1991. The effect of material inertia on neck development. In: Yang, W.H. (Ed.), Topics in Plasticity. AM Press, Ann Arbor, MI , 151–60.
- Nieto-Fuentes et al. (2022) Nieto-Fuentes, J.C., Jacques, N., Marvi-Mashhadi, M., N’souglo, K., Rodríguez-Martínez, J.A., 2022. Modeling dynamic formability of porous ductile sheets subjected to biaxial stretching: Actual porosity versus homogenized porosity. International Journal of Plasticity 158, 103418.
- Niordson (1965) Niordson, F.L., 1965. A unit for testing materials at high strain rates. Experimental Mechanics 5, 29–32.
- N’souglo et al. (2021) N’souglo, K.E., Jacques, N., Rodríguez-Martínez, J.A., 2021. A three-pronged approach to predict the effect of plastic orthotropy on the formability of thin sheets subjected to dynamic biaxial stretching. Journal of the Mechanics and Physics of Solids 146, 104189.
- N’souglo et al. (2018) N’souglo, K.E., Srivastava, A., Osovski, S., Rodríguez-Martínez, J.A., 2018. Random distributions of initial porosity trigger regular necking patterns at high strain rates. Proceedings of the Royal Society A: Mathematical, Physical and Engineering Sciences 474, 20170575.
- Padmanabhan et al. (2019) Padmanabhan, K.A., Thangapandian, N., Prabu, S.B., 2019. Effect of temperature on grain size in AA6063 aluminum alloy subjected to repetitive corrugation and straightening. Acta Metallurgica Sinica (English Letters) 32, 835–44.
- Pandolfi et al. (1999) Pandolfi, A., Krysl, P., Ortiz, M., 1999. Finite element simulation of ring expansion and fragmentation: the capturing of length and time scales through cohesive models of fracture. International Journal of Fracture 95, 279–97.
- Patil et al. (2014) Patil, D.C., Venkateswarlu, K., Kori, S.A., Das, G., Das, M., Alhajeri, S.N., Langdon, T.G., 2014. Mechanical property evaluation of an al-2024 alloy subjected to HPT processing. IOP Conference Series: Materials Science and Engineering 63, 012085.
- Perrone (1968) Perrone, N., 1968. On the use of the ring test for determining rate-sensitive material constants. Experimental Mechanics 8, 232–6.
- Quey et al. (2011) Quey, R., Dawson, P., Barbe, F., 2011. Large-scale 3d random polycrystals for the finite element method: Generation, meshing and remeshing. Computer Methods in Applied Mechanics and Engineering 200, 1729–45.
- Rodríguez-Martínez et al. (2013a) Rodríguez-Martínez, J.A., Vadillo, G., Fernández-Sáez, J., Molinari, A., 2013a. Identification of the critical wavelength responsible for the fragmentation of ductile rings expanding at very high strain rates. Journal of the Mechanics and Physics of Solids 61, 1357–76.
- Rodríguez-Martínez et al. (2013b) Rodríguez-Martínez, J.A., Vadillo, G., Zaera, R., Fernández-Sáez, J., 2013b. On the complete extinction of selected imperfection wavelengths in dynamically expanded ductile rings. Mechanics of Materials 60, 107–20.
- Rusinek and Zaera (2007) Rusinek, A., Zaera, R., 2007. Finite element simulation of steel ring fragmentation under radial expansion. International Journal of Impact Engineering 34, 799–822.
- Shankar et al. (2005) Shankar, M.R., Chandrasekar, S., Compton, W.D., King, A.H., 2005. Characteristics of aluminum 6061-T6 deformed to large plastic strains by machining. Materials Science and Engineering: A 410, 364–8.
- Stepanov and Babutskii (1984) Stepanov, G.V., Babutskii, A.I., 1984. Experimental study of the fragmentation of metal rings. Strength of Materials 16, 1199–202.
- Vadillo et al. (2012) Vadillo, G., Rodríguez-Martínez, J.A., Fernández-Sáez, J., 2012. On the interplay between strain rate and strain rate sensitivity on flow localization in the dynamic expansion of ductile rings. International Journal of Solids and Structures 49, 481–91.
- Vaz-Romero et al. (2019) Vaz-Romero, A., Mercier, S., Rodríguez-Martínez, J.A., Molinari, A., 2019. A comparative study of the dynamic fragmentation of non-linear elastic and elasto-plastic rings: The roles of stored elastic energy and plastic dissipation. Mechanics of Materials 132, 134–48.
- Vaz-Romero et al. (2017) Vaz-Romero, A., Rodríguez-Martínez, J.A., Mercier, S., Molinari, A., 2017. Multiple necking pattern in nonlinear elastic bars subjected to dynamic stretching: The role of defects and inertia. International Journal of Solids and Structures 125, 232 –43.
- Wood et al. (2021) Wood, P., Rusinek, A., Platek, P., Janiszewski, J., Sienkiewicz, J., Gunputh, U.F., Rajkowski, K., Miguélez, M.H., 2021. High strain rate effect on tensile ductility and fracture of AM fabricated Inconel 718 with voided microstructures. Materials & Design 208, 109908.
- Xue et al. (2008) Xue, Z., Vaziri, A., Hutchinson, J.W., 2008. Material aspects of dynamic neck retardation. Journal of the Mechanics and Physics of Solids 56, 93–113.
- Zhang and Ravi-Chandar (2006) Zhang, H., Ravi-Chandar, K., 2006. On the dynamics of necking and fragmentation - I. Real-time and post-mortem observations in Al 6061-O. International Journal of Fracture 142, 183–217.
- Zhang and Ravi-Chandar (2008) Zhang, H., Ravi-Chandar, K., 2008. On the dynamics of necking and fragmentation - II. Effect of material properties geometrical constraints and absolute size. International Journal of Fracture 150, 3–36.
- Zhou et al. (2006) Zhou, F., Molinari, J.F., Ramesh, K.T., 2006. An elasto-visco-plastic analysis of ductile expanding ring. International Journal of Impact Engineering 33, 880–91.