Ab initio study of the structure and properties of amorphous silicon hydride from accelerated molecular dynamics simulations
Abstract
This paper presents a large-scale ab initio simulation study of amorphous silicon hydride (a-SiH) with an emphasis on the structure and properties of the material across a range of hydrogen concentration by combining accelerated molecular dynamics (MD) simulations with first-principles density-functional calculations. The accelerated MD scheme relied on classical metadynamics, which enabled the development of 2600+ high-quality structural models of a-SiH, with system sizes ranging from 150 to 6,000 atoms and hydrogen concentrations vary from 6 to 20 at. %. The resulting amorphous networks were found to be completely free from any coordination defects and that they all exhibited a pristine band-gap in their electronic spectrum. The microstructural properties of hydrogen distributions were examined with great emphasis on the presence of isolated and clustered environments of hydrogen atoms. The results were compared with a suite of experimental data obtained from x-ray diffraction, infrared spectroscopy, spectroscopic ellipsometry and nuclear magnetic resonance studies.
I Introduction
Hydrogenated amorphous silicon (a-Si:H) is an important semiconducting material with a range of applications to material devices, especially in photovoltaics [1, 2, 3]. However, the photovoltaic properties of a-Si:H-based solar cells are adversely affected by the so-called Staebler-Wronski effect [4, 5]. The problem involves a gradual degradation of the cell upon prolonged exposure to sunlight and the consequent loss of its photovoltaic efficiency with time. Although the exact cause of this degradation is largely unknown and still a debating issue, it is widely accepted that the light-induced structural changes associated with the breaking of certain Si–H bonds and the subsequent motion of H atoms in the network play a central role in the degradation process. The elucidation of such effects, via computer modeling and theoretical analyses of simulation results, requires large-scale, realistic, device-quality models of a-Si:H, which can produce not only the correct structural [6], electronic [7] and microstructural properties [8, 9] of hydrogen distributions in a-Si:H, but also the dynamics of H atoms in the network [10, 11]
In the last decade, several smart simulation techniques were developed that can outperform the conventional methods [12, 13, 14, 15, 16, 17, 18], based on Monte Carlo and molecular-dynamics simulations, to produce high-quality models of disordered materials. These techniques can be collectively described as data-driven methods, which are thematically related to each other by their ability to employ either training data sets obtained from prior calculations to construct a knowledge-based potential or structural information derived from experiments to develop data-assisted simulation strategies. Examples of these techniques include, but are not limited to, machine-learning (ML) approaches [19] and a number of experimental information based pure [20, 21, 22] and hybrid approaches [23, 6, 24, 25, 26], developed in the context of modeling disordered solids. The so-called ML approaches rely on the availability of accurate training data, which are generally, but not necessarily, obtained from a small number of first-principles calculations on limited system sizes. As such, the success of ML methods largely depends on the quality and quantity of training data, as well as their ability to represent the configuration space of very many structural solutions associated with disordered solids. By contrast, the effectiveness of data-assisted hybrid approaches hinges on the information content of experimental data – from diffraction and other spectroscopic measurements – and the feasibility of employing scalar/vector information in association with approximate force fields or total-energy functionals to form an augmented solution space. The approach then seeks suitable structural solutions in the augmented space in order for the solutions to be satisfied by theory and experiments simultaneously. However, the use of ab initio force fields (in ML methods) or the lack of suitable classical/semi-classical total-energy functionals and adequate experimental data (for hybrid approaches) can restrict these methods from applying to large multicomponent disordered systems, with few exceptions.
In view of the preceding observation, the development of large realistic models of amorphous solids continues to pose a major problem. For a-Si:H, the key difficulties include: 1) the generation of high-quality atomistic configurations of a-Si; 2) the creation of appropriate types and numbers of silicon-hydrogen bonding configurations, which depend on the concentration of hydrogen in the network; and 3) the lack of suitable classical or semi-classical potentials to accurately describe the interaction between Si and H atoms. The last issue is particularly problematic for large systems as it is necessary to hydrogenate a-Si networks to produce a correct hydrogen distribution. Although a number of ad hoc approaches [27] have been developed to hydrogenate a-Si networks with coordination defects, none of these approaches so far can address these issues satisfactorily, especially the creation of a variety of defective structures of a-Si to generate the correct concentration dependent hydrogen microstructure. These issues call for the development of an efficient method that can yield a-Si:H models with all possible silicon-hydrogen bonding configurations across a wide range of hydrogen concentration.
The goal of this study is to develop a structural database of a-Si:H, consisting of thousands of amorphous configurations, with system sizes vary from 150 atoms to 6000 atoms and hydrogen concentrations in the range of 6–20 at. %. The approach adopted here is based on a combination of conventional molecular-dynamics simulations and their accelerated counterpart, known as metadynamics. We have shown that the approach can successfully address the issues mentioned earlier for fairly large systems using ab initio total-energy minimization. Here, we have systematically applied this approach to generate a large ensemble of a-Si:H configurations with varying system sizes and hydrogen concentrations. The efficiency of our approach emanates from its ability to control atomic coordination of Si, and thereby producing a variety of Si–H bonding configurations, the properties of which are found to be in good agreement with experimental data from nuclear magnetic resonances (NMR) [28, 29, 30, 31], infrared (IR) spectroscopy [32, 33], spectroscopic ellipsometry [34], and inelastic neutron scattering measurements [35].
The remainder of this paper is organized as follows. In Sec. II, we describe the simulation method in detail, which comprises the generation of an ensemble of defective a-Si structures via metadynamics, followed by hydrogen passivation of defects and the total-energy minimization of the resulting a-Si:H structures using density functional theory (DFT). Section III discusses the structural and microstructural properties of a-Si:H models and the distribution of H atoms in the networks in relation to the shape of the nuclear magnetic resonance (NMR) line spectra of a-Si:H. The phonon and electro-optical properties of a-Si:H are also discussed and compared with experimental data. Section IV provides information on the structural database that resulted from our study. It incorporates detailed structural, electronic and additional information on a few thousand atomic configurations of a-Si:H. This is followed by conclusions in Sec. V.
II Computational Methodology
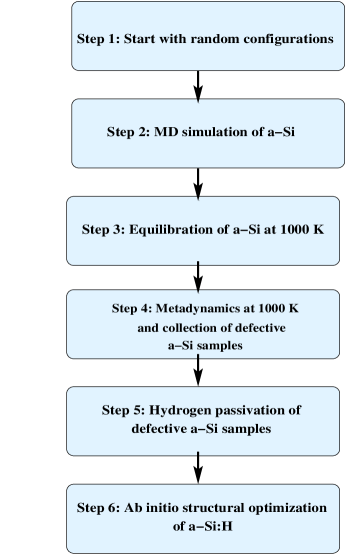
In this study, we employed a combination of conventional molecular-dynamics (MD) simulations and an accelerated MD technique to generate an array of structural configurations of a-Si spanning a wide range of concentrations of coordination defects. The configurations were then passivated with H atoms to produce models of a-Si:H. A flowchart of the entire procedure is depicted in Fig. 1, which lays out the key steps of the method. Below, we give a description of the accelerated MD technique, which is followed by a brief discussion of classical MD simulations of a-Si and the subsequent development of a-Si:H models via hydrogen passivation.
II.1 Accelerated Molecular Dynamics
The primary goal of the accelerated MD technique is to produce representative structural configurations of a-Si with undercoordinated atoms or defects, which play a key role in producing a-Si:H models. The ability to produce a structural configuration with a given number and type of undercoordinated atoms provides a means to generate various silicon-hydrogen bonding configurations that have been experimentally observed in a-Si:H for a wide range of H concentration. The accelerated MD approach used in this study is based on the metadynamics method [36]. Metadynamics is a technique that provides a fast sampling of the free-energy surface associated with an event or mechanism, which is difficult to access via conventional MD. In the present context, we are primarily interested in the low-energy structural configurations of a-Si that correspond to a given number (and type) of undercoordinated Si atoms.
The principles of metadynamics can be summarized
as follows:
(i) First, a small set,
, of differentiable functions, ,
of the system coordinates , is
chosen so that they can describe the mechanism
of interest through
| (1) |
The functions are known
as collective variables. The dimensionality, , of
the collective variables is typically in the range
.
(ii)
Second, a history (i.e., time-dependent) potential,
, is periodically
added to the Hamiltonian of the system during
simulation, where denotes time.
The periodic addition of effectively discourages
the system from visiting regions of the free-energy
surface that have already been visited, and thus
drives the system to explore new regions of the free-energy
surface. As the system evolves, is
periodically updated by adding a -dimensional
function centered on the value of .
To put it more succinctly, suppose that at a given time
during metadynamics simulation, is updated
times at regular time periods
(). If the set of collective variables
at these time periods is specified by ,
then the history potential, ,
for an arbitrary set of collective variables
at time , is defined as
| (2) |
(iii) Third, the basic idea of metadynamics is that, in the presence of bias and true potentials, after a sufficiently long simulation time period, the free energy of the system spanned by the set of collective variables , can be recovered from the history potential
| (3) |
It is customary to approximate the delta function, , in Eq. (2) by a narrow Gaussian function of height (with the dimension of energy) and width (with the dimension of the collective variable), which is centered on
| (4) |
For large system sizes, where thousands of Gaussian functions are required to efficiently sample the energy surface on the fly, Lucy’s function [37] often serves as an accurate but computationally cheaper alternative to Gaussian functions. Writing , Lucy’s function, , is defined as
| (5) |
where is the height of the function [38], is the center, and is the support radius of the function. It can be shown that the Gaussian function, , and Lucy’s function, , in Eqs. (4) and (5), respectively, are computationally equivalent [39] for in the region . In other words, a Gaussian function of height and width , which is centered on , is equivalent to Lucy’s function of height and width , centered on in the interval . In this work, a function is approximated by Lucy’s function. Thus, the history potential in Eq. (2) becomes
| (6) |
In Sec. IIB, we briefly describe how this accelerated MD technique can be effectively combined with conventional MD simulations to obtain a set of desired a-Si configurations for hydrogen passivation.
II.2 Sampling energy landscape of a-Si, hydrogen passivation, and ab initio thermalization and relaxation
We employed classical MD simulations to produce a-Si models. Starting with a set of independent random initial configurations within a cubic supercell, an array of amorphous silicon configurations with a density of 2.25 g cm-3 were generated. The size of the models ranges from 150 to 6,000 atoms and the concentration of atomic hydrogen lies between 6 to 20 at. %. The choice of model sizes and hydrogen concentrations is motivated by our desire to create an accurate structural database of a-Si:H for future use.
Since amorphous silicon is not a glass, direct applications of MD simulations using the so-called melt-quench approach tend to produce too many coordination defects in the networks. To avoid this problem, we adopted a specially developed MD protocol by Atta-Fynn and Biswas [40], which employed the modified Stillinger-Weber potentials (SW) [41, 42] to generate high-quality structural configurations of a-Si. The resulting a-Si configurations were subjected to annealing at 1000 K for a period of 100 ps, and the annealed models were used as the starting configurations of several independent metadynamics runs at 1000 K [43]. To generate different types and numbers of undercoordinated atomic configurations of a-Si, for the purpose of hydrogen passivation, we define a collective variable, , which plays the role of the atomic coordination number at site
| (7) |
Here, , where and are the atomic positions at sites and , respectively, and is a polynomial function that decays smoothly from 1 to 0 for increasing values of from 0 to . The function is given by
with
| (8) |
This definition allows us to use a smooth continuous variable as the coordination number of an atom (without introducing a sharp cutoff value for atomic coordination) during metadynamics runs when the distance between neighboring atoms fluctuate considerably. The constants and correspond to the lower and upper boundaries of the zero region after the first shell in the pair-correlation function of a-Si. In this study, we employed Å and Å. The average coordination number, , of a network at time is obtained by averaging over all sites
| (9) |
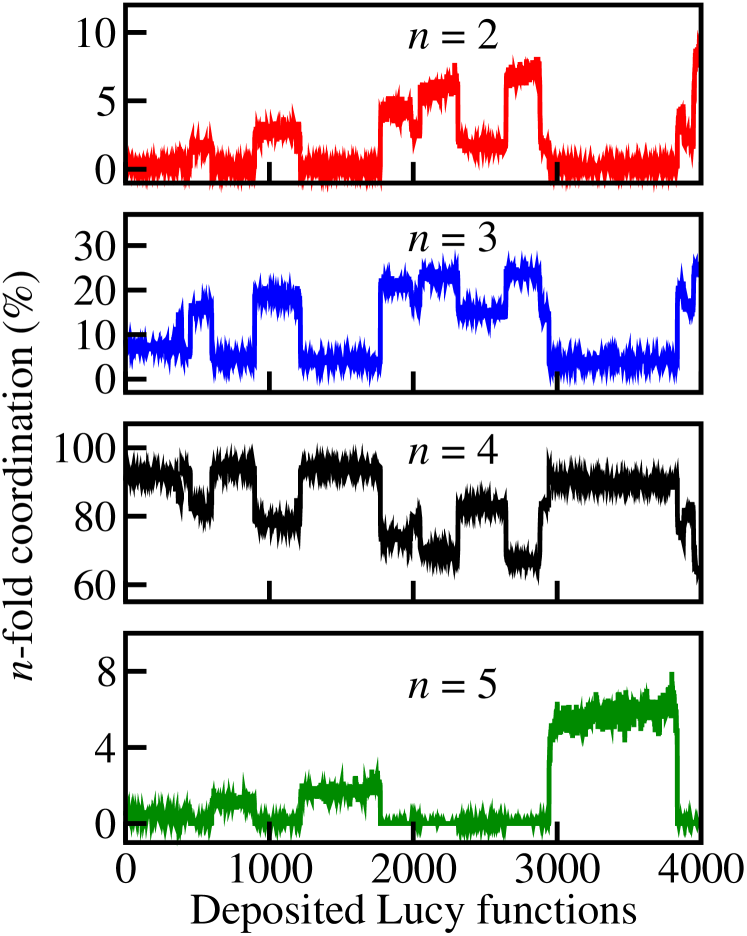
The metadynamics simulations were performed by adding a Lucy’s function of height =0.1 eV and width =0.305 to the bias potential at a periodic interval of ps in order to drive the system through different regions of the free-energy landscape associated with the collective variable . As the system propagates under the influence of on the Stillinger-Weber potential-energy surface, one can track the evolution of the average coordination number, , as a function of time. This is shown in Fig. 2, where the variation of the number of -fold-coordinated atoms (in percent) is plotted against the number of Lucy’s functions deposited at time . Thus, atomic configurations with a given number and type of defects, such as one-fold-, two-fold-, and three-fold-coordinated atoms, can be readily harvested along metadynamic trajectories. The defective configurations of a-Si are so chosen that the concentration of H atoms lies within the range from 6 to 20 at. % after the defects are hydrogenated. Once the defective configurations are in place, the passivation of defects proceeds by inserting H atoms in the vicinity of the defective sites such that the resulting local structure is approximately tetrahedral. The supercell volume is then adjusted to ensure that the mass density of the resultant a-Si:H models agrees with the experimental density of a-Si:H [44].
Although the a-Si:H models obtained from the procedure described above yield a realistic distribution of hydrogen atoms, the inclusion of H atoms near defective sites may induce some strain in amorphous networks. To minimize the effect of this strain on the hydrogen microstructure of a-Si:H, the resulting structures were thermalized at 300 K for 3–5 ps, followed by structural relaxation, using the ab initio DFT code Siesta [45]. The thermalizations and structural relaxations of the models were conducted using both the self-consistent-field (SCF) and non-SCF approximations. For systems consisting of more than 3000 Si atoms, we employed the non-SCF Harris functional approach [46] for solving the Kohn-Sham equation. It has been shown elsewhere [47] that for a-Si the results from the Harris approach are on a par with those from full SCF calculations. The Ceperley-Alder formulation [48] of the local density approximation (LDA) was used to account for the exchange-correlation energy of the system, and the norm-conserving pseudopotentials in the Troullier-Martins form were used to describe the electron-ion interactions [49]. Double-zeta basis functions were used for systems up to 3,000 atoms, whereas systems with more than 3,000 atoms are treated using the single-zeta basis functions. Only the point, =0, was used to perform the Brillouin-zone integration. The relaxation procedure continued until the total force on each atom was found to be less than 10 meV/Å.
III Results and Discussion
This section provides a complete characterization of a-SiH models with hydrogen concentrations in the range from 6 to 20 at. %. Since it is not possible to include a comprehensive discussion of models for all hydrogen concentrations in the limited space, we have restricted our discussion to a set of models with representative low (6–9 at. %), intermediate (10–13 at. %) and high (18–20 at. %) concentration of hydrogen in presenting the results. A similar observation applies to model sizes as well. The models with the low concentration of H are reflective of device-grade samples of a-Si:H, whereas the models with the high concentration of H provide rich microstructural information of hydrogen distribution in amorphous silicon networks involving silicon-hydrogen bonding configurations and isolated/clustered environments of H atoms, as observed in infrared (IR) [32, 50], nuclear magnetic resonance (NMR) [29, 31] and hydrogen-effusion measurements [51]. In some cases, our choice of H concentration was simply dictated by experimental data with given H concentrations. The quality of the models are studied by analyzing the structural, electronic, vibrational and microstructural properties of hydrogen distributions in the networks. The results are compared with available experimental data.
III.1 Structural Properties of a-Si:H
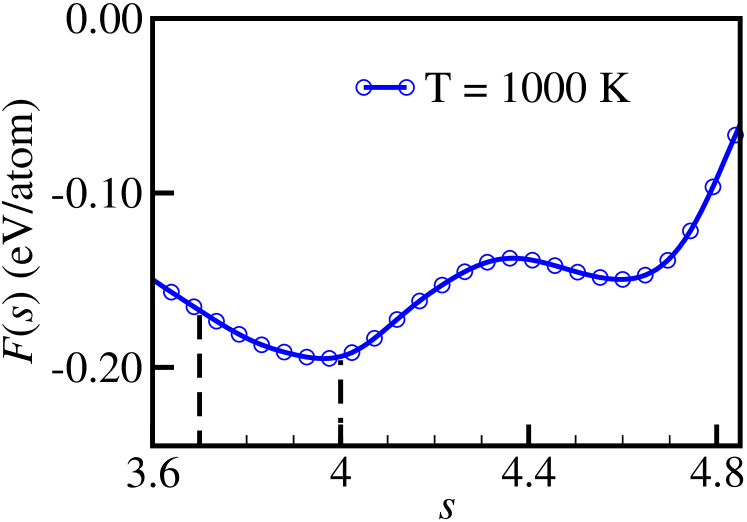
Figure 3 depicts the evolution of the free energy, , with the average coordination number, . A close examination of the plot reveals that the minimum of corresponds to at 1000 K, which is slightly less than the ideal tetrahedral value of 4. This implies that at high temperatures some of the atoms in a-Si models can be undercoordinated. The value of is close to the experimental value of 3.88, obtained from x-ray diffraction measurements on annealed samples of a-Si at 873 K by Laaziri et al. [52] It may be noted that this result is particularly true for bulk samples, which are characterized by the presence of a few vacancy-type defects in the networks. For finite-size computer-generated models, a value of 3.88 at the room temperature (of 293 K) generally indicates the presence of too many isolated dangling bonds, which can produce unwanted defect states in the electronic density of states and lead to a pseudo-gap or gapless spectrum [53]. In the present case, an average coordination value of 3.94 in metadynamical models is indicative of continuous bond formation and dissociation [11] in the network at 1000 K as the system evolves on the high temperature free-energy surface.
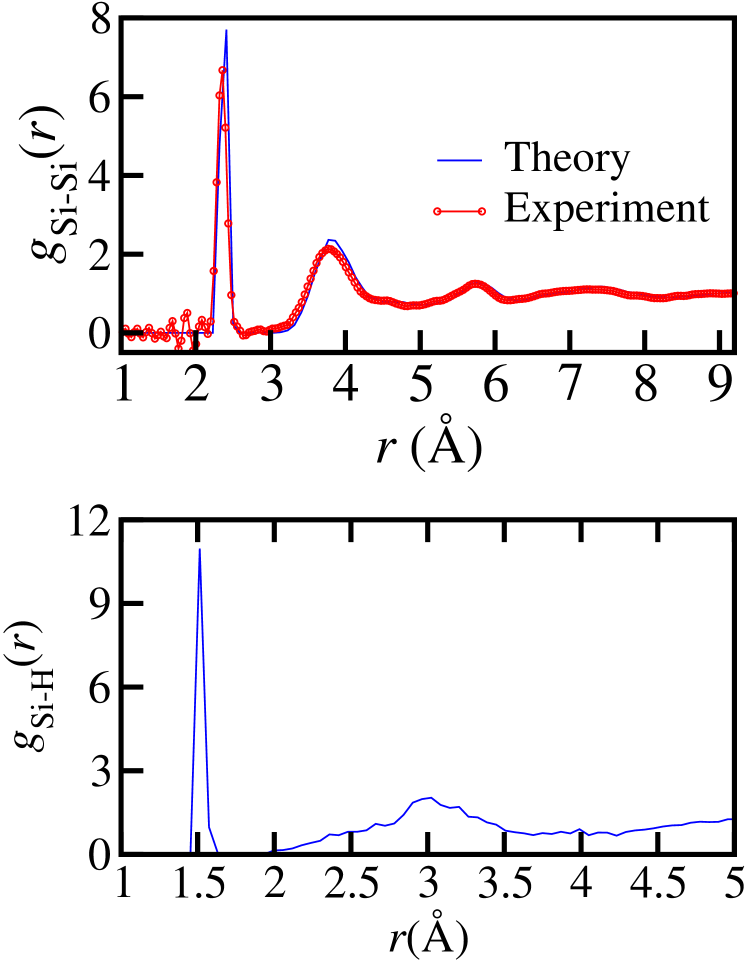
In Table 1, we have listed key structural properties of ab-initio relaxed a-Si:H models for different sizes and hydrogen concentrations. A remarkable feature of the models is that they are free from any coordination defects and the average value of the bond angles, for each size group, is about 109.2∘, which is close to the ideal tetrahedral value of 109.47∘. The standard deviation of the bond angles ranges from 8.5 to 10.6∘. We shall see later that these values are consistent with those extrapolated from Raman measurements. Likewise, the average Si–Si bond length for the models is found to be about 2.37 Å, which is well within one standard deviation of the experimental value of Si–Si bond length of 2.350.065, obtained by Laaziri et al. [54] from high resolution x-ray diffraction measurements on annealed/as-implanted pure a-Si samples. A small difference of 0.02 Å can be attributed partly due to the use of local basis functions in Siesta and in part due to the presence of H atoms in the network. The results for the partial pair-correlation functions, , for a model with 8.4 at. % H, are presented in Fig. 4. The positions of the first Si–Si peak at 2.37 Å and the first Si–H peak at 1.51 Å in the plots are consistent with the results obtained by other researchers and experiments [52, 55, 56].
| Group | |||||||
|---|---|---|---|---|---|---|---|
| (at. %) | (Å) | (Å) | (∘) | (∘) | |||
| 1 | 150 | 379 | 6.25-17.58 | 2.36-2.39 | 1.49-1.52 | 109.2 | 8.5-10.4 |
| 2 | 200 | 391 | 6.54-18.03 | 2.36-2.39 | 1.50-1.53 | 109.2 | 8.7-10.3 |
| 3 | 250 | 378 | 6.02-18.83 | 2.37-2.39 | 1.50-1.52 | 109.2 | 9.0-10.3 |
| 4 | 300 | 360 | 6.25-17.58 | 2.37-2.38 | 1.50-1.52 | 109.2 | 8.9-10.4 |
| 5 | 350 | 352 | 6.42-18.60 | 2.37-2.38 | 1.50-1.52 | 109.1 | 9.1-10.6 |
| 6 | 400 | 329 | 6.10-18.37 | 2.37-2.38 | 1.50-1.52 | 109.2 | 9.1-10.4 |
| 7 | 500 | 297 | 6.02-17.22 | 2.37-2.39 | 1.50-1.52 | 109.1 | 9.2-10.4 |
| 8 | 1000 | 134 | 6.02-17.76 | 2.37-2.38 | 1.50-1.51 | 109.2 | 9.4-10.4 |
| 9 | 3000 | 4 | 7.41-20.5 | 2.41 | 1.52-1.53 | 109.1 | 10 |
| 10 | 6000 | 3 | 8.23-8.59 | 2.38 | 1.52-1.53 | 109.1 | 9.9 |
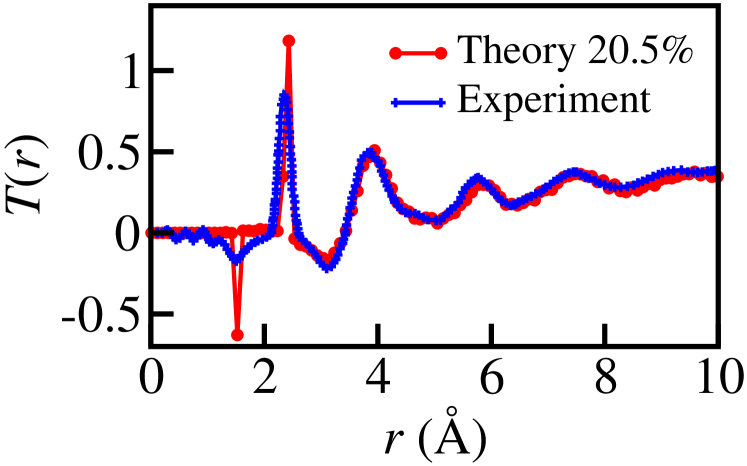
In Fig. 5, the total atomic correlation function, , of an a-Si:H structure, consisting of 3000 Si atoms, with a concentration of 20.5 at.% H is depicted, alongside data from neutron scattering experiments for a-Si:H samples with 22 at. % H [57]. Here, is related to the neutron-weighted conventional atomic pair-correlation function, , by , and is the number density of atoms in the network [58]. The results obtained from our model agree well with those from experiments as shown in Fig. 5. This establishes that the models accurately produce the total two-body pair-correlation function as far as the radial atomic correlations of a-Si:H are concerned from experiments.
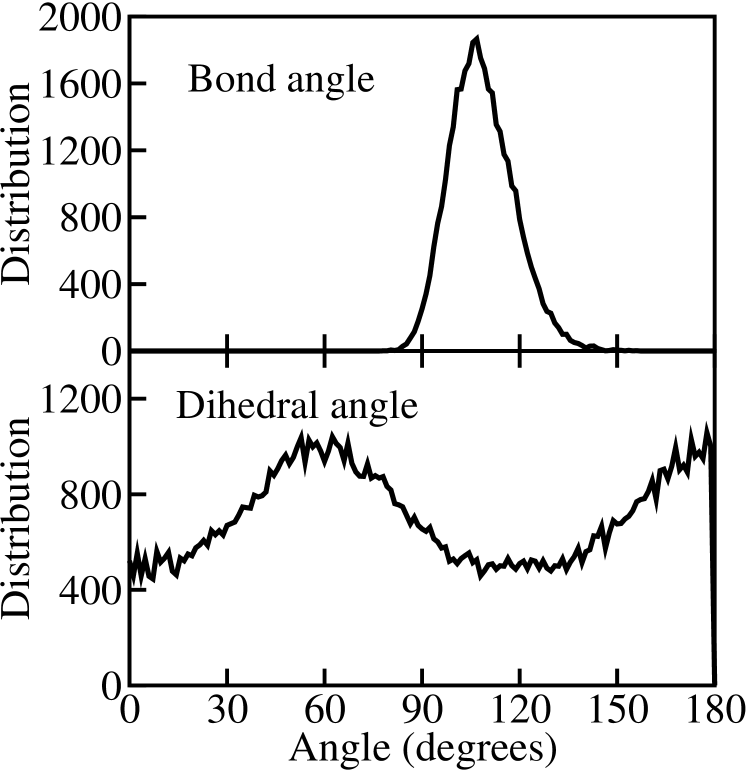
Figure 6 shows the bond-angle and dihedral-angle distributions. The bond-angle distribution, which is a measure of the (reduced) three-body correlations between atoms, appears to be largely Gaussian in its character and it has a root-mean-square width of =8.5–10.5∘. Following Beeman et al. [59], the line width of the Raman ‘optic’ peak intensity, (in cm-1), is related to (in degree) via . This gives the computed values of for the models to be in the range of 66–79 cm-1, which lies well within the range of the experimental values of 64–82 cm-1, obtained from Raman measurements on a-Si [59]. The dihedral-angle distribution, on the other hand, provides information concerning the reduced four-body atomic correlations, involving a set of four consecutive neighboring atoms. The distribution is characterized by the presence of a broad peak in the vicinity of 60∘ angle. This result is unsurprising considering the fact that in diamond-structure c-Si, the angle between two dihedral planes is given by 60∘, which produces a very sharp delta-function peak in the distribution. The presence of disorder in amorphous silicon networks considerably weakens this sharp peak, which appears as a bulge at 60∘ in the dihedral-angle distribution.
The structure of tetrahedral amorphous semiconductors can be further examined by studying the irreducible ring statistics and the distribution of the Voronoi volumes of constituent atoms, which provide a measure of the network connectivity of the atoms and the degree of porosity of the network, respectively. By definition, an irreducible ring of size is the shortest, self-avoiding, irreversible closed path or loop, which starts and ends at the same atom in steps. Irreducibility here refers to the fact that such a ring cannot be further partitioned or reduced into a smaller set of rings without changing the topology/connectivity of the path and the dimensionality of the amorphous network. Crystalline silicon in diamond structure is characterized by the presence of hexagonal rings only. By contrast, amorphous silicon typically has rings of sizes =4–10, with 6-member rings being statistically dominant. To examine how the presence of hydrogen can affect the ring-size distribution in a-Si, we have computed the total number of irreducible rings with sizes =3–10 for three 1000-atom models with a concentration of 0, 8.4 and 17.8 at. % H. The results are shown in Fig. 7 as a histogram. As expected, the dominant rings in all the structures are the 6-member rings. Further, the net ring count is largest for a-Si, which is followed by the structures with 8.4 and 17.8 at. % H in the decreasing order.
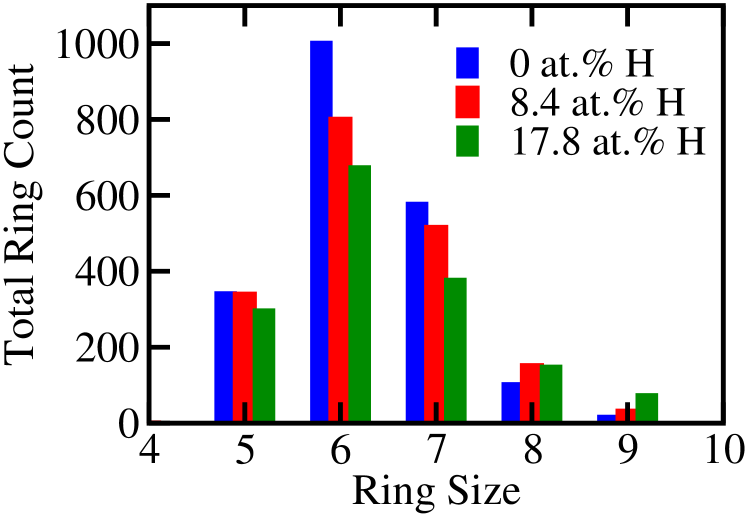
The reduction in the ring count for the models with 8.4 and 17.8 at. % H, relative to the pure amorphous silicon, is due to the presence of too many H atoms in the networks that decreases the number of available self-avoiding closed loops. This is particularly true for Si atoms forming a dihydride SiH2 configuration. A trihydride Si atom cannot form a ring in the network. It may be noted that none of structures we have studied in this work has trigonal or 3-member rings. The presence of 3-member rings in a-Si network is indicative of highly strained atomic sites, which often appear in poorly produced MD models of a-Si, quenched from the molten state of silicon. High quality models of a-Si and its hydrogenated counterpart should not have any 3-member rings.
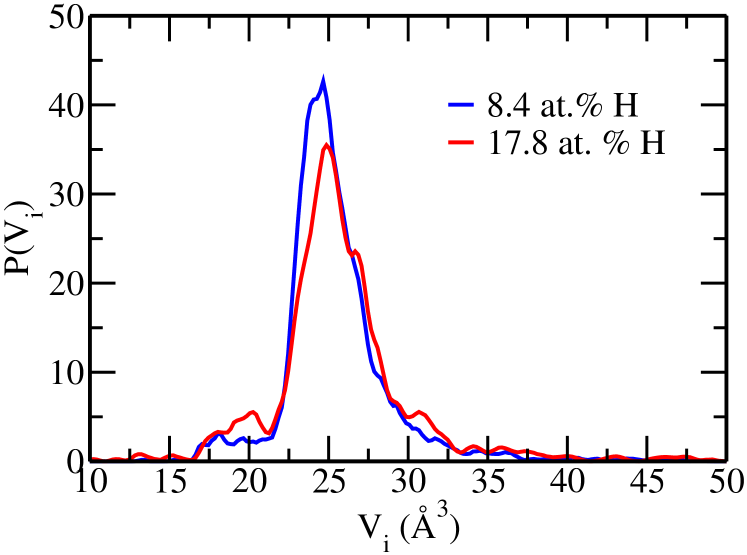
Likewise, the presence of H atoms in a-Si:H can affect the porosity of the network by reducing its effective density with increasing H concentrations. This can be readily seen by computing the Voronoi volume of the region associated with Si sites. The Voronoi volume (of an atom) in a disordered network is essentially the analog of the Wigner-Seitz cell (of an atom) in a crystal. The Voronoi volume of an atom can be calculated from the positions of the atom and its nearest neighbors [60]. The formation of various silicon-hydrogen bonding configurations at high concentration of H can lead to a greater number of silicon monohydrides and dihydrides, which in turn reduce the Voronoi volume of Si atoms that are bonded to H atoms. This is apparent from Fig. 8, where the distributions of Voronoi volumes, versus , for two models with 8.4 and 17.8 at. % H, are plotted for comparison. The results correspond to the configuration averaged values of , at silicon site , obtained from two independent configurations. The primary peak at 25 Å3 corresponds to those Si sites that are bonded to four Si neighbors, whereas the secondary peak near 20 Å3 arises from the hydrogen-bonded Si atoms in the network. The height of the secondary peak thus increases with the increasing number of H atoms at high concentrations.
III.2 Hydrogen microstructure and NMR spectra of a-Si:H
The distribution of hydrogen in a-Si plays an important role in determining electronic and optical properties of a-Si:H. Since pure samples of a-Si almost always contain some coordination defects, mostly in the form of vacancy-type defects and a few dangling bonds, it is necessary to eliminate these defects via hydrogen passivation to obtain device-grade samples of a-Si:H for technological applications. Hydrogen can also break weak Si–Si bonds to form energetically more stable SiH/SiH2 bonding configurations, which minimize local network strain. The presence of weak Si–Si bonds is related to the degree of disorder in the network, which depends on experimental methods and preparation conditions used to produce the samples. A similar observation applies to a-Si:H models obtained from different simulation techniques.
In general, hydrogenation of a-Si leads to a formation of silicon monohydride (SiH) and dihydride (SiH2) configurations at low concentrations of 6–10 at. % H. The resulting samples/models are often described as device-grade quality. Further addition of H atoms in the network can result in a highly clustered environment of SiH/SiH2 bonds, a few SiH3 configurations, and molecular hydrogen (H2) formation inside small cavities at high concentrations of 15–20 at. % H [8, 32]. These aspects of concentration dependent hydrogen microstructure can be studied experimentally by using an array of techniques, such as infrared (IR) spectroscopy [32], nuclear magnetic resonance (NMR) [29, 30] and positron-annihilation spectroscopy (PAS) [61]. Likewise, the hydrogen microstructure of a-Si:H models can be computationally studied by analyzing hydrogen distributions in the network with emphasis on the presence of SiH, SiH2 and SiH3 configurations, and the spatial distribution of hydrogen at low and high concentrations. The line shape of the NMR spectra of a-Si:H provides useful information on the distribution of H atoms in the network.
| SiH | SiH2 | SiH3 | Isolated | Sparse | Clustered | ||
|---|---|---|---|---|---|---|---|
| (%) | (%) | (%) | (%) | (%) | (%) | (%) | |
| 500 | 6.0-7.8 | 80.6 | 19.4 | 0 | 14.6 | 55.8 | 29.6 |
| 500 | 14.1-17.2 | 79.9 | 18.6 | 1.5 | 1.4 | 45.7 | 52.9 |
| 1000 | 6.2-8.8 | 82.6 | 16.2 | 1.2 | 15.3 | 52.7 | 32.3 |
| 1000 | 15.5-17.8 | 82.2 | 15.9 | 1.9 | 2.2 | 43.9 | 53.9 |
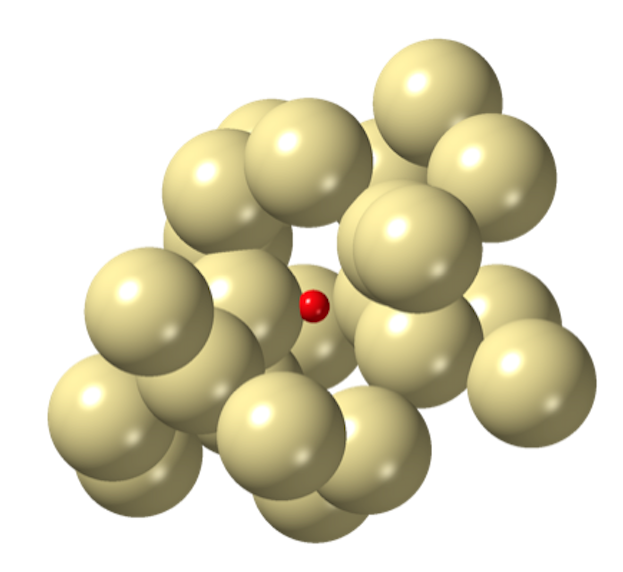
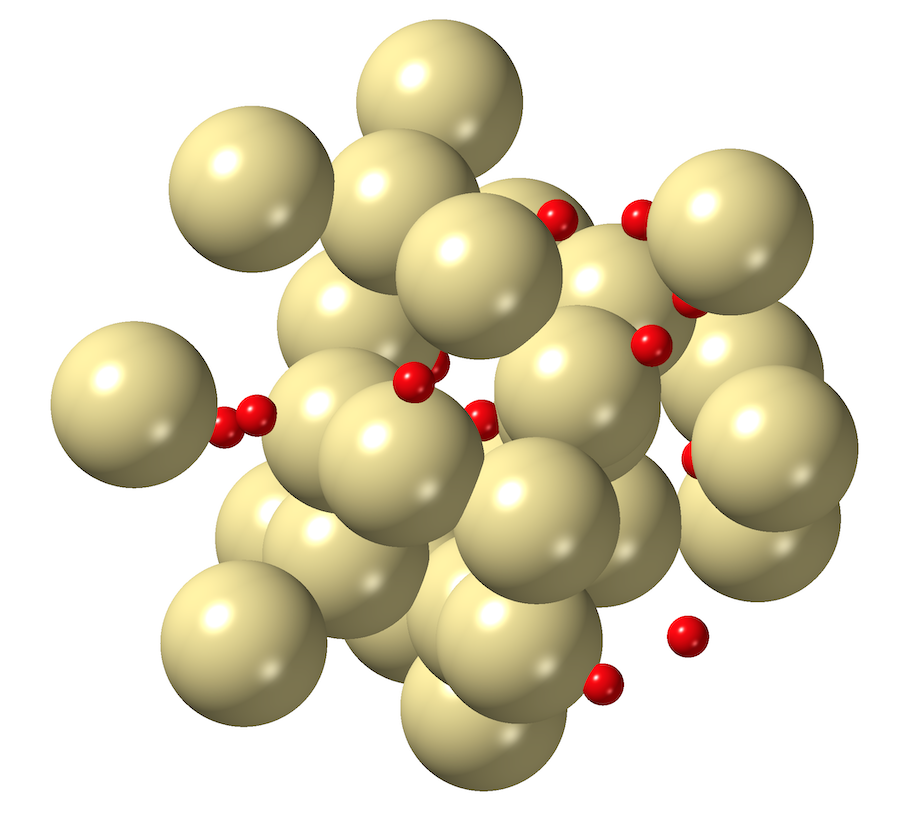
Table 2 lists some characteristic properties of microstructural distributions of H atoms at low and high concentrations of 6–8.8 at. % H and 14.1–17.8 at. % H, respectively. The values listed in the table were obtained by averaging over 10 structures per group. It is apparent from the table that the great majority (about 80 at. %) of H atoms reside in the networks as silicon monohydrides (SiH), which are followed by 16–20 at. % of H atoms as silicon dihydrides (SiH2). A few SiH3 configurations (no more than 2%) are also found to be present in the networks at high concentrations. However, none of the models in our study shows the presence of any H2 molecules even at the high concentration of 18 at. % H. We surmise that this is due to the absence of voids in model a-Si:H networks. It has been shown elsewhere [32, 8, 11, 61] that the presence of voids plays an important role in the formation of non-bonded hydrogen, such as H2 molecules, in a-Si:H. The number of SiHn configurations (with =1, 2, 3) and their spatial distributions in the networks constitute a description of hydrogen microstructure in a-Si:H.
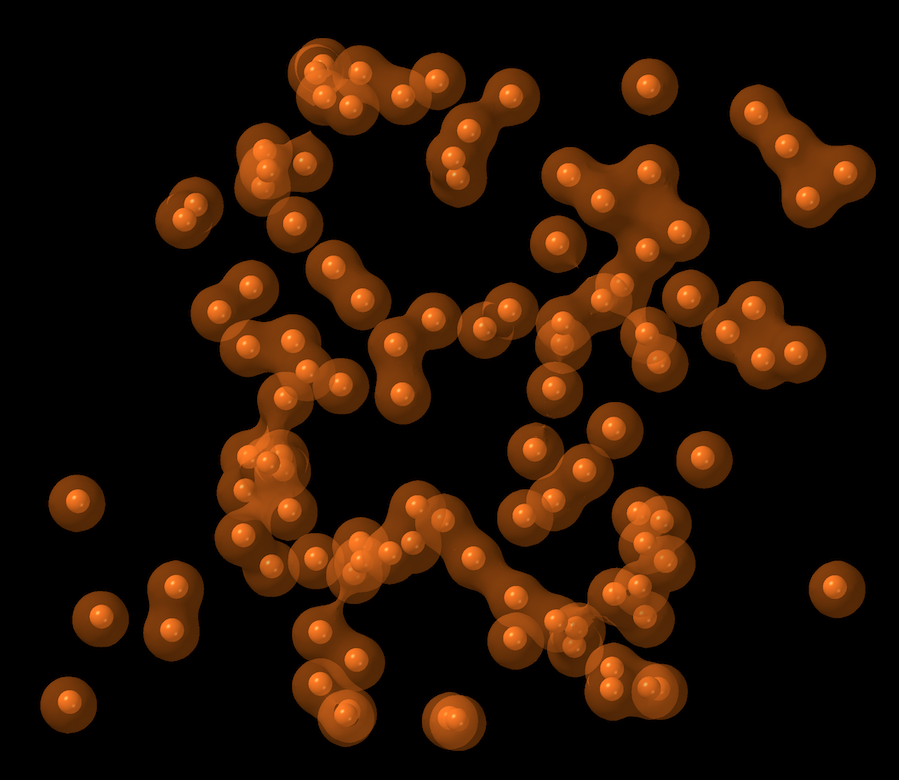
A further characterization of hydrogen microstructure in a-Si:H can be made from the distribution of H atoms within the networks. The spatial distribution of hydrogen in a-Si:H can be characterized by examining the vicinity and abundance of H atoms, and classifying the distribution as a sparse or clustered distribution. Following Baum et al. [31], a hydrogen atom is considered to be isolated if there are no neighboring hydrogen atoms within a sphere of radius of 4–5 Å. Likewise, a hydrogen atom is assumed to be a part of a cluster if the atom has at least 6–8 H neighbors within a radius of 4–5 Å. The remaining H atoms may be counted as sparsely distributed in the network [62]. Figures 9 and 10 show a representative example of an isolated H atom and a clustered distribution of H atoms, respectively, within a spherical region of radius 5 Å, in an a-Si:H network with 17.8 at. % of H. Similarly, the microstructure originated from a sparse distribution of H atoms in an a-Si:H network with 17.8 at. % H is presented in Fig. 11. As shown in Fig. 11, the minimum center-to-center distance between any two H atoms is found to be at least 3 Å. These sparsely distributed H atoms neither belong to any H clusters nor do they satisfy the criterion for being isolated H atoms. Table 2 lists the number of H atoms distributed in isolated, sparse and clustered environments of a-Si:H in a few representative models. Here, the results correspond to a (cluster) radius of 4 Å and the minimum size of H clusters is chosen to be 6, which includes the central H atom. The choice of these values was guided by the experimental results from NMR measurements [29, 30, 31]. We shall see soon that these sparsely distributed H atoms and H clusters play an important role in determining the shape of the NMR line spectra of a-Si:H. Together with Table 2, Figs. 9 to 11 provide a full description of hydrogen microstructure at low and high concentrations of H atoms in a-Si:H networks.
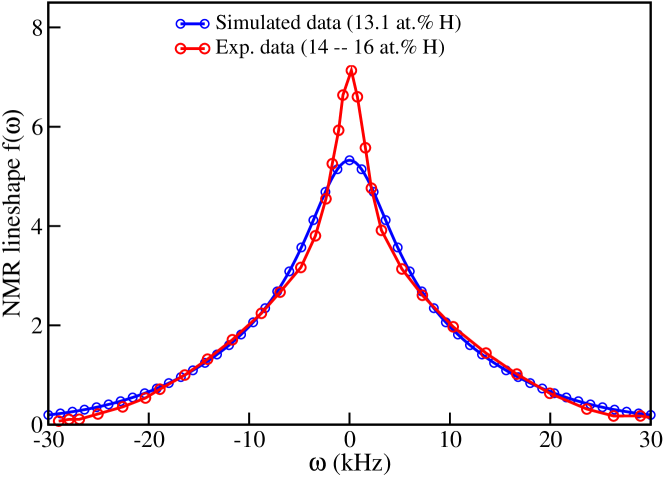
Experimental data from NMR measurements [28, 29, 30] indicate that microstructural distributions of H atoms in a-Si:H networks can play a considerable role in forming the shape of the resonance curve [28, 29, 30]. In particular, the shape of the resonance curve can provide an indirect means to further characterize the distribution of H atoms in a-Si:H networks. However, a direct calculation of the resonance curve is rather complicated, involving quantum-mechanical manybody calculations, and outside the scope of the present study. We thus resort to a simpler approach to construct an approximate form of the resonance curve from moment-based considerations, as discussed by Van Vleck [63] and others [64, 65]. In this approach, one assumes that the resonance curve can be approximated as a linear combination of a suitable Gaussian function and a truncated Lorentzian, which are weighted by the concentration of clustered H atoms and sparsely distributed H atoms (including isolated ones) present in a network, respectively. The approximation relies on theoretical and experimental observations that the dipolar interaction between H atoms at low concentrations produces a narrow Lorentzian-like curve, whereas the presence of small H clusters at high concentrations leads to a broad Gaussian shape of the resonance curve. A detailed theoretical analysis of this approach is given by Van Vleck [63]. Following this approach, we have constructed the resonance curve for a 3000-atom Si model with 13.1 at. % H. The choice of a large model is necessary for this purpose in order to produce a statistically robust value of the first two moments of the hydrogen distribution in the network. Figure 12 shows the approximate shape of the resonance curve, , along with the same from experiments. A comparison of our results with the experimental data from a sample with 14 at. % H in Ref. 28 indicates that the moment-based approach can indeed reproduce the approximate line shape of the experimental resonance curve of a-Si:H.
III.3 Electronic and optical properties of a-Si:H
Although structural properties and the microstructural distribution of H atoms in a-Si:H networks play a crucial role in determining the quality of the models, the most definitive test follows from the electronic properties of the models. The electronic quality of a model is chiefly determined by the electronic density of states (EDOS) and the size of the electronic band gap. The latter depends on a number of factors, such as the degree of bond-length and bond-angle disorder that affect the states near the edges of the band gap, also known as the Urbach tails, and in particular the presence of dangling (and possibly floating) bonds in the networks, leading to midgap and tail states. Furthermore, the application of the local density approximation (LDA) of the exchange-correlation (XC) energy in density functional theory is also known to underestimate the size of the gap.
All a-Si:H models reported in this study exhibit a clean gap in the corresponding EDOS. This is not surprising as the models are characterized by a very narrow bond-angle distribution (see Table 1) and silicon atoms therein are all 100% four-fold-coordinated, with no defects in the networks. The size of the electronic gap can be estimated by computing the energy eigenvalue difference between the highest occupied molecular orbital (HOMO) and the lowest unoccupied molecular orbital (LUMO), also known as the HOMO-LUMO gap, which lies in the range of 1–1.8 eV for the models studied in this work.
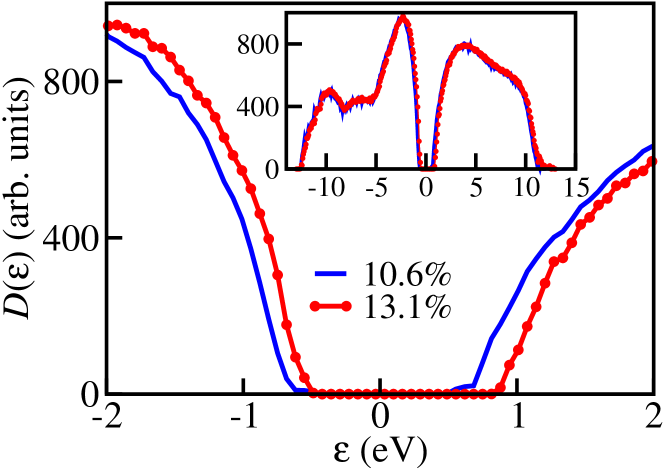
The band-gap regions of the EDOS of two representative a-Si:H models with 3000 Si atoms are plotted in Fig. 13, along with the full EDOS as an inset. The concentrations of H atoms in the models are given by 10.7 and 13.1 at. %, which correspond to 358 and 452 H atoms in the networks, respectively. The EDOS is obtained by writing , where are the single-particle Kohn-Sham eigenvalues, and convoluting each function with a Gaussian distribution centered at . The width of the Gaussian distribution is so chosen that it is a fraction of the average level-spacing distance between two neighboring eigenvalues. It is evident from Fig. 13 that the models produced a pristine electronic gap with no defect-induced localized midgap states. The size of the gap can be seen to be somewhat dependent on the hydrogen content of the models; the presence of more hydrogen leads to a slightly larger gap in Fig. 13. The widening of the band gap with increasing H concentrations can be attributed to the replacement of weak Si–Si bonds by energetically stable Si–H bonds, which reduce the overall strain and local disordering in a network and some of the (tail) states in the vicinity of the gap.
In order to study the variation of the band gap with hydrogen concentrations and to compare the results with experimental data, it is more useful to calculate the optical gap of a model. This can be achieved by using the Tauc model [66, 67], which is based on the following assumptions: (i) The electronic density of states in the vicinity of the valence band edge and the conduction band edge exhibit a parabolic behavior; (ii) The wavevector () selection rules can be relaxed as is no longer a good quantum number in noncrystalline solids; (iii) The weak energy dependence of the transition matrix elements between the valence and conduction band edge states can be ignored. To calculate the optical gap, one writes the integrated joint density of states [68]
| (10) |
where and are the valence and conduction band electronic densities of states, respectively, and the integration is carried out over all pairs of states in the valence and conduction bands that are energetically separated by . The foregoing assumptions lead to the following simplified expression of Eq. (10)
| (11) |
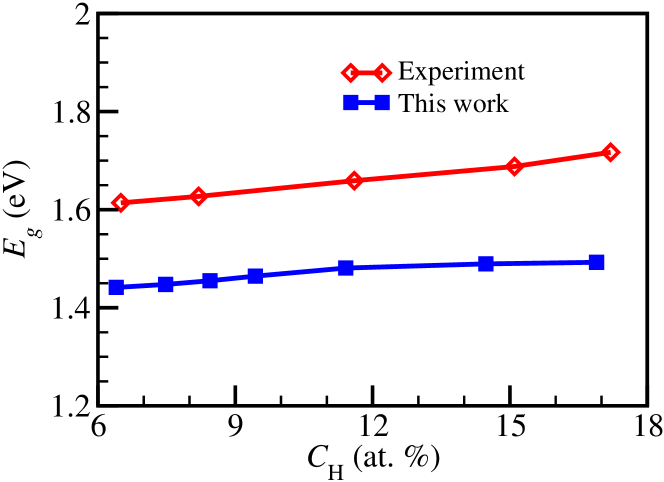
Here, is the absorption coefficient, is a positive constant, and is the so-called Tauc optical gap. Equation (11) suggests that the value of can be extrapolated from the plot of versus . Figure 14 shows the plot of the average optical gap with increasing H concentration . The averaging was done as follows: (i) all 2,627 optical gaps were divided into seven concentration groups, with each group spanning a hydrogen concentration range; (ii) the gaps within each group were averaged to yield a single gap and the corresponding H concentrations within the group were averaged to yield a single concentration . The experimental data obtained by Kageyama et al. [34] are also plotted in Fig. 14 for comparison. It is apparent from the plot that the calculated values of show an approximate linear behavior with the concentration of H atoms from 6 to 17 at. %. This behavior is found to be very consistent with the experimental results obtained by Kageyama et al. [34] It goes without saying that the calculated values of the gap are somewhat smaller than the experimental values. This is partly due to the use of the LDA of the exchange-correlation functional in DFT calculations and in part due to the somewhat limited size of the basis functions employed in our calculations.
III.4 Vibrational properties of a-Si:H
To further characterize the a-Si:H models, one often computes the vibrational density of states (VDOS) and compares the results with those from inelastic neutron-scattering experiments. In solids, the atomic vibrational energy scale is much smaller than its electronic counterpart, and therefore VDOS can provide a finer aspect of the local atomic environment of Si and H atoms, involving atomic vibrations in a disordered environment, which often may not be apparent in structural and electronic properties.
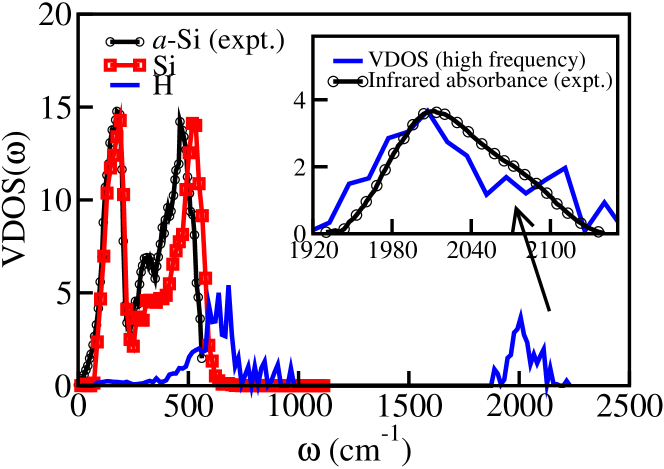
The VDOS of a-Si:H was computed using the harmonic approximation. In the harmonic approximation, the contribution to the total energy of a solid, upon a small displacement from the equilibrium configuration, from cubic and higher-order terms are neglected. Following the theory of small oscillations, one can readily construct a force-constant matrix by displacing one atom at a time along six coordinate directions (, , ). To preserve the harmonic character of atomic vibrations, the displacement of the atoms is typically restricted to 0.005–0.01 Å. The diagonalization of the mass-adjusted force-constant matrix, also known as the dynamical matrix (DM), then yields the squared eigenfrequencies, , and the normalized eigenvectors, , where . The VDOS was computed as and the inverse participation ratio (IPR) of each (normalized) vibrational mode as . The IPR of a normal mode provides a simple measure of the degree of amplitude localization of the mode in real space. A value of IPR1 suggests a highly localized mode around a site, whereas IPR indicates a delocalized mode over sites. The VDOS and IPR calculations were carried out using a 556-atom a-Si:H model with 10.4 at. % of H, and ten independent configurations were used to obtain the configurationally averaged values of the VDOS.
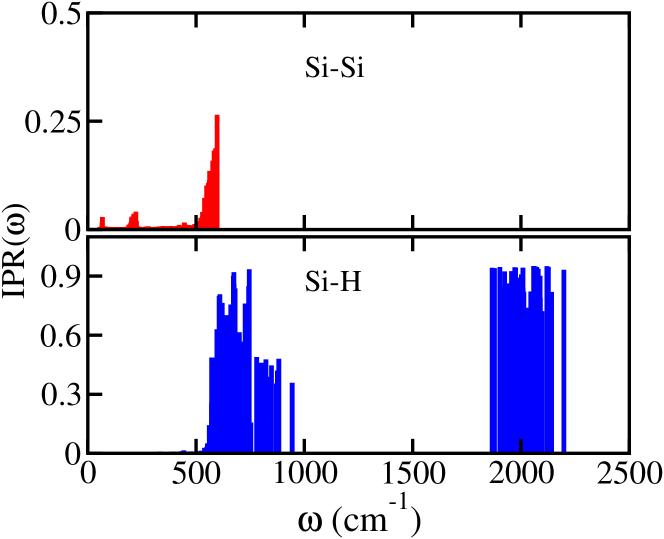
In Figs. 15 and 16, we depict the plots of the VDOS (decomposed into Si and H contributions) and IPR (decomposed in Si–Si and Si–H vibrations), respectively. The VDOS for Si atoms is compared with the results obtained from inelastic neutron scattering measurements on a-Si and the infrared absorbance data for a-Si:H from Refs. 35 and 33, respectively. The VDOS in Fig. 15 shows three well-defined bands: (i) ; (ii) ; (iii) . The low-frequency band mainly comprises delocalized Si–Si modes. The delocalized nature of the modes is evidenced by small values of the IPR (red bars) in Fig. 16. The mid-frequency band essentially consists of Si–H wagging modes in the frequency range of 630–660 and Si–H bending modes in the 830–860 range. Experimental observations in Ref. 35 suggest that the wagging and bending modes primarily originate from SiH2 configurations. An analysis of IPRs and eigenvectors of the DM indeed confirmed that the vibrational amplitudes from SiH2 units dominate the mid-frequency band. By contrast, the high-frequency band is found to be composed of Si–H stretching modes within the frequency range of 2000–2200 . The Si–H modes in the mid- and high-frequency bands are found to be highly localized on H atoms from eigenvector analyses. This observation is also corroborated by IPR values for the respective modes, which are very close to unity in most of the cases [See Fig. 16 (lower panel)].
IV Web site for structural database
A major outcome of the present study is the development of a large structural database of a-Si:H. The study has resulted more than two thousand defect-free, high-quality atomic configurations of a-Si:H. The database consists of atomic configurations of size from 150 to 6000 Si atoms with H concentrations in the range from 6 to 19 at. % H. A provisional database, with several hundreds of a-Si:H configurations, is currently up and functional, which lists the basic structural and electronic properties of the a-Si:H models. The atomic coordinates and associated properties of the a-Si:H configurations are downloadable upon registration from the provisional database located at www.drive.google.com/SiH-models. The complete database will be soon available and hosted at a permanent location in the near future. Atomic configurations and related metadata will be freely available to the public for academic research on request.
V Conclusions
A computationally efficient method for atomistic modeling of hydrogenated amorphous silicon has been presented. A remarkable feature of the method is that it can produce large realistic structures of a-Si:H with a variety of silicon-hydrogen bonding configurations, which are consistent with the associated hydrogen microstructure for varying hydrogen concentrations observed in experiments. The method combines the power of classical metadynamics simulations with density functional theory in generating a large class of models with varying hydrogen contents. Using the method, we have built a large structural database of a-Si:H, consisting of 2,600+ independent a-Si:H configurations, with atomic hydrogen concentrations in the range from 6 to 20 at. % H. All structures are high quality in the sense that they are (a) free from any coordination defects and (b) the structural, electronic, vibrational, and microstructural properties of hydrogen distribution in the structures are in good agreement with experiments. The structural database resulted from this work will provide a direct support to the materials modeling community in studying problems involving the physics of a-Si:H and a-Si:H-based devices.
References
- Taguchi et al. [2014] M. Taguchi, A. Yano, S. Tohoda, K. Matsuyama, Y. Nakamura, T. Nishiwaki, K. Fujita, and E. Maruyama, Record efficiency hit solar cell on thin silicon wafer, Photovoltaics, IEEE Journal of 4, 96 (2014).
- Takatsuka et al. [2006] H. Takatsuka, Y. Yamauchi, K. Kawamura, H. Mashima, and Y. Takeuchi, World’s largest amorphous silicon photovoltaic module, Thin Solid Films 506, 13 (2006).
- Mishima et al. [2011] T. Mishima, M. Taguchi, H. Sakata, and E. Maruyama, Development status of high-efficiency hit solar cells, Solar Energy Materials and Solar Cells 95, 18 (2011).
- Staebler and Wronski [1977] D. L. Staebler and C. R. Wronski, Reversible conductivity changes in discharge‐produced amorphous Si, Applied Physics Letters 31, 292 (1977).
- Staebler and Wronski [1980] D. L. Staebler and C. R. Wronski, Optically induced conductivity changes in discharge‐produced hydrogenated amorphous silicon, Journal of Applied Physics 51, 3262 (1980).
- Biswas et al. [2007] P. Biswas, R. Atta-Fynn, and D. A. Drabold, Experimentally constrained molecular relaxation: The case of hydrogenated amorphous silicon, Phys. Rev. B 76, 125210 (2007).
- Biswas et al. [2016] P. Biswas, R. Atta-Fynn, and S. R. Elliott, Metadynamical approach to the generation of amorphous structures: The case of -Si:H, Phys. Rev. B 93, 184202 (2016).
- Biswas et al. [2017] P. Biswas, D. Paudel, R. Atta-Fynn, D. A. Drabold, and S. R. Elliott, Morphology and number density of voids in hydrogenated amorphous silicon: An ab initio study, Phys. Rev. Applied 7, 024013 (2017).
- Biswas and Timilsina [2011] P. Biswas and R. Timilsina, Vacancies, microstructure and the moments of nuclear magnetic resonance: the case of hydrogenated amorphous silicon, J. Phys.: Cond. Matt. 23, 065801 (2011).
- Biswas et al. [2020] P. Biswas, D. Paudel, R. Atta-Fynn, and S. R. Elliott, Temperature-induced nanostructural evolution of hydrogen-rich voids in amorphous silicon: a first-principles study, Nanoscale 12, 1464 (2020).
- Biswas and Limbu [2021] P. Biswas and D. Limbu, Ab initio hydrogen dynamics and the morphology of voids in amorphous silicon, Physica Status Solidi (b) 258, 2170047 (2021).
- Min et al. [1992] B. J. Min, Y. H. Lee, C. Z. Wang, C. T. Chan, and K. M. Ho, Tight-binding model for hydrogen-silicon interactions, Phys. Rev. B 45, 6839 (1992).
- Holender et al. [1993] J. M. Holender, G. J. Morgan, and R. Jones, Model of hydrogenated amorphous silicon and its electronic structure, Phys. Rev. B 47, 3991 (1993).
- Tuttle and Adams [1998] B. Tuttle and J. B. Adams, Energetics of hydrogen in amorphous silicon: An ab initio study, Phys. Rev. B 57, 12859 (1998).
- Buda et al. [1991] F. Buda, G. L. Chiarotti, R. Car, and M. Parrinello, Structure of hydrogenated amorphous silicon from ab initio molecular dynamics, Phys. Rev. B 44, 5908 (1991).
- Jarolimek et al. [2009] K. Jarolimek, R. A. de Groot, G. A. de Wijs, and M. Zeman, First-principles study of hydrogenated amorphous silicon, Phys. Rev. B 79, 155206 (2009).
- Drabold et al. [1991] D. A. Drabold, P. A. Fedders, S. Klemm, and O. F. Sankey, Finite-temperature properties of amorphous silicon, Phys. Rev. Lett. 67, 2179 (1991).
- Klein et al. [1999] P. Klein, H. M. Urbassek, and T. Frauenheim, Tight-binding molecular-dynamics study of -Si:H: Preparation, structure, and dynamics, Phys. Rev. B 60, 5478 (1999).
- Deringer et al. [2018] V. L. Deringer, N. Bernstein, A. P. Bartók, M. J. Cliffe, R. N. Kerber, L. E. Marbella, C. P. Grey, S. R. Elliott, and G. Csányi, Realistic atomistic structure of amorphous silicon from machine-learning-driven molecular dynamics, J. Phys. Chem. Lett. 9, 2879 (2018).
- Biswas et al. [2004] P. Biswas, R. Atta-Fynn, and D. A. Drabold, Reverse Monte Carlo modeling of amorphous silicon, Phys. Rev. B 69, 195207 (2004).
- Walters and Newport [1996] J. K. Walters and R. J. Newport, Reverse Monte Carlo modeling of amorphous germanium, Phys. Rev. B 53, 2405 (1996).
- Limbu et al. [2020] D. K. Limbu, S. R. Elliott, R. Atta-Fynn, and P. Biswas, Disorder by design: A data-driven approach to amorphous semiconductors without total-energy functionals, Scientific Reports 10, 7742 (2020).
- Biswas et al. [2005] P. Biswas, D. N. Tafen, and D. A. Drabold, Experimentally constrained molecular relaxation: The case of glassy GeSe2, Phys. Rev. B 71, 054204 (2005).
- Pandey et al. [2016] A. Pandey, P. Biswas, and D. A. Drabold, Inversion of diffraction data for amorphous materials, Sci. Rep. 6, 33731 (2016).
- Pandey et al. [2015] A. Pandey, P. Biswas, and D. A. Drabold, Force-enhanced atomic refinement: Structural modeling with interatomic forces in a reverse monte carlo approach applied to amorphous Si and SiO2, Phys. Rev. B 92, 155205 (2015).
- Limbu et al. [2018] D. K. Limbu, R. Atta-Fynn, D. A. Drabold, S. R. Elliott, and P. Biswas, Information-driven inverse approach to disordered solids: Applications to amorphous silicon, Phys. Rev. Materials 2, 115602 (2018).
- Biswas and Elliott [2015] P. Biswas and S. R. Elliott, Nanoscale structure of microvoids in -Si:H: A first-principles study, J. Phys.: Cond. Matt. 27, 435201 (2015).
- Carlos and Taylor [1982] W. E. Carlos and P. C. Taylor, NMR in -Si, Phys. Rev. B 26, 3605 (1982).
- Reimer et al. [1980] J. A. Reimer, R. W. Vaughan, and J. C. Knights, Proton magnetic resonance spectra of plasma-deposited amorphous si: H films, Phys. Rev. Lett. 44, 193 (1980).
- Leopold et al. [1982] D. J. Leopold, J. B. Boyce, P. A. Fedders, and R. E. Norberg, Deuteron and proton magnetic resonance in -Si:(D,H), Phys. Rev. B 26, 6053 (1982).
- Baum et al. [1986] J. Baum, K. K. Gleason, A. Pines, A. N. Garroway, and J. A. Reimer, Multiple-quantum NMR study of clustering in hydrogenated amorphous silicon, Phys. Rev. Lett. 56, 1377 (1986).
- Chabal and Patel [1984] Y. J. Chabal and C. K. N. Patel, Infrared Absorption in -Si:H: First Observation of Gaseous Molecular H2 and Si-H Overtone, Phys. Rev. Lett. 53, 210 (1984).
- Scharff and McGrane [2007] R. J. Scharff and S. D. McGrane, Si-H bond dynamics in hydrogenated amorphous silicon, Phys. Rev. B 76, 054301 (2007).
- Kageyama et al. [2011] S. Kageyama, M. Akagawa, and H. Fujiwara, Dielectric function of -Si:H based on local network structures, Phys. Rev. B 83, 195205 (2011).
- Kamitakahara et al. [1984] W. A. Kamitakahara, H. R. Shanks, J. F. McClelland, U. Buchenau, F. Gompf, and L. Pintschovius, Measurement of phonon densities of states for pure and hydrogenated amorphous silicon, Phys. Rev. Lett. 52, 644 (1984).
- Laio and Parrinello [2002] A. Laio and M. Parrinello, Proc. Natl. Acad. Sci. U.S.A. 99, 12562 (2002).
- Lucy [1977] L. B. Lucy, A numerical approach to the testing of the fission hypothesis, The Astronomical Journal 82, 1013 (1977).
- [38] If is normalized (that is in 1D, in 2D, and in 3D), then in 1D, in 2D, and in 3D.
- [39] The relation between and is based on the condition that and both have the same full width at half maximum (FWHM).
- Atta-Fynn and Biswas [2018] R. Atta-Fynn and P. Biswas, Nearly defect-free dynamical models of disordered solids: The case of amorphous silicon, J. Chem. Phys. 148, 204503 (2018).
- Stillinger and Weber [1985] F. H. Stillinger and T. A. Weber, Computer simulation of local order in condensed phases of silicon, Phys. Rev. B 31, 5262 (1985).
- Vink et al. [2001] R. L. C. Vink, G. T. Barkema, W. F. van der Weg, and N. Mousseau, Fitting the stillinge-weber potential to amorphous silicon, Journal of Non-Crystalline Solids 282, 248 (2001).
- [43] Since metadynamics is a nonequilibrium simulation technique, one cannot define simulation temperatures as in conventional MD using the classical equipartition theorem. It is more appropriate to regard the temperature as a simulation parameter that determines the degree of ruggedness of a free-energy landscape defined by a given set of collective variables. A high temperature corresponds to a less rugged landscape, and vice versa.
- Smets and van de Sanden [2007] A. H. M. Smets and M. C. M. van de Sanden, Relation of the Si-H stretching frequency to the nanostructural SiH bulk environment, Phys. Rev. B 76, 073202 (2007).
- Soler et al. [2002] J. M. Soler, E. Artacho, J. D. Gale, A. Garciá, J. Junquera, P. Ordejón, and D. Sánchez-Portal, The siesta method for ab initio order- n materials simulation, J. Phys. Condens. Matter 14, 2745 (2002).
- Harris [1985] J. Harris, Simplified method for calculating the energy of weakly interacting fragments, Phys. Rev. B 31, 1770 (1985).
- Atta-Fynn et al. [2004] R. Atta-Fynn, P. Biswas, P. Ordejón, and D. A. Drabold, Systematic study of electron localization in an amorphous semiconductor, Phys. Rev. B 69, 085207 (2004).
- Ceperley and Alder [1980] D. M. Ceperley and B. J. Alder, Ground state of the electron gas by a stochastic method, Phys. Rev. Lett. 45, 566 (1980).
- Troullier and Martins [1991] N. Troullier and J. L. Martins, Efficient pseudopotentials for plane-wave calculations, Phys. Rev. B 43, 1993 (1991).
- Ouwens and Schropp [1996] J. D. Ouwens and R. E. I. Schropp, Hydrogen microstructure in hydrogenated amorphous silicon, Phys. Rev. B 54, 17759 (1996).
- Beyer [2003] W. Beyer, Diffusion and evolution of hydrogen in hydrogenated amorphous and microcrystalline silicon, Solar Energy Materials and Solar Cells 78, 235 (2003).
- Laaziri et al. [1999a] K. Laaziri, S. Kycia, S. Roorda, M. Chicoine, J. L. Robertson, J. Wang, and S. C. Moss, High-energy x-ray diffraction study of pure amorphous silicon, Phys. Rev. B 60, 13520 (1999a).
- [53] In the literature of a-Si, one occasionally compares the experimental value of the average coordination number of 3.88 from Ref. 52 with the calculated value obtained from integrating the first peak of the PCF of computer-generated models. However, for finite-size models, such a comparison is ill-advised as it leads to a considerable presence of isolated dangling bonds in amorphous networks, which results in a pseudo-gap or gapless electronic spectrum.
- Laaziri et al. [1999b] K. Laaziri, S. Kycia, S. Roorda, M. Chicoine, J. L. Robertson, J. Wang, and S. C. Moss, High resolution radial distribution function of pure amorphous silicon, Phys. Rev. Lett. 82, 3460 (1999b).
- Street [1991] R. A. Street, Hydrogenated Amorphous Silicon (Cambridge University Press, 1991).
- Dahal et al. [2022] D. Dahal, S. R. Elliott, and P. Biswas, Extended-range order in tetrahedral amorphous semiconductors: The case of amorphous silicon, Phys. Rev. B 105, 115203 (2022).
- Wright et al. [2007] A. C. Wright, A. C. Hannon, R. N. Sinclair, T. M. Brunier, C. A. Guy, R. J. Stewart, M. B. Strobel, and F. Jansen, Neutron scattering studies of hydrogenated, deuterated and fluorinated amorphous silicon, J. Phys.: Cond. Matt. 19, 415109 (2007).
- [58] For a binary system, the neutron-weighted total PCF, , is given by , where are the scale factors involving concentrations and neutron scattering factors of the constituent atoms of the system. See Ref. 69 for details.
- Beeman et al. [1985] D. Beeman, R. Tsu, and M. F. Thorpe, Structural information from the raman spectrum of amorphous silicon, Phys. Rev. B 32, 874 (1985).
- [60] Care must be taken to calculate the Voronoi volume associated with an undercoordinated Si atom that subtends a very narrow/wide bond angle with its given neighbors. In some cases, the Voronoi volume of such a site is ill-defined and a suitable alternative definition is needed to obtain an estimate of the volume.
- Sekimoto et al. [2016] T. Sekimoto, M. Matsumoto, A. Sagara, M. Hishida, and A. Terakawa, Changes in the vacancy size distribution induced by non-bonded hydrogens in hydrogenated amorphous silicon, J. Non-Cryst. Solids 447, 207 (2016).
- [62] The radius and the number of H atoms used here to define a hydrogen cluster are somewhat arbitrary. One typically chooses a value of 4–5 Å for radius and 5–7 H atoms to define a cluster. Although the clusters are not unique, the total number of H atoms in a clustered environment remains more or less the same for a given radius and a minimum cluster size.
- Van Vleck [1948] J. H. Van Vleck, The dipolar broadening of magnetic resonance lines in crystals, Phys. Rev. 74, 1168 (1948).
- Abragam [1994] A. Abragam, Principles of Nuclear Magnetism (Oxford Science Publications, 1994).
- Timilsina and Biswas [2013] R. Timilsina and P. Biswas, A study of hydrogen microstructure in amorphous silicon via inversion of nuclear magnetic resonance spectra, J. Phys.: Cond. Matt. 25, 165801 (2013).
- Tauc et al. [1966] J. Tauc, R. Grigorovici, and A. Vancu, Optical properties and electronic structure of amorphous germanium, Physica Status Solidi B 15, 627 (1966).
- Tauc [1968] J. Tauc, Optical properties and electronic structure of amorphous Ge and Si, Materials Research Bulletin 3, 37 (1968).
- Morigaki [1991] K. Morigaki, Physics of Amorphous Semiconductors (Imperial College Press, 1991).
- Elliott [1988] S. R. Elliott, Physics of Amorphous Materials (Longman Higher Education, 1988).