Starbursts driven by central gas compaction
Abstract
Starburst (SB) galaxies are a rare population of galaxies with star formation rates (SFRs) greatly exceeding those of the majority of star-forming galaxies with similar stellar mass. It is unclear whether these bursts are the result of either especially large gas reservoirs or enhanced efficiencies in converting gas into stars. Tidal torques resulting from gas-rich galaxy mergers are known to enhance the SFR by funneling gas towards the centre. However, recent theoretical works show that mergers do not always trigger a SB and not all SB galaxies are interacting systems, raising the question of what drives a SB. We analyse a large sample of SB galaxies and a mass- and redshift-matched sample of control galaxies, drawn from the FIREbox cosmological volume at . We find that SB galaxies have both larger molecular gas fractions and shorter molecular depletion times than control galaxies, but similar total gas masses. Control galaxies evolve towards the SB regime by gas compaction in their central regions, over timescales of , accompanied by an increase in the fraction of ultra-dense and molecular gas. The driving mechanism behind the SB varies depending on the mass of the galaxy. Massive () galaxies undergoing intense, long-lasting SBs are mostly driven by galaxy interactions. Conversely, SBs in non-interacting galaxies are often triggered by a global gravitational instability, that can result in a ‘breathing’ mode in low-mass galaxies.
keywords:
methods: numerical – galaxies: starburst – galaxies: evolution – galaxies: star formation – galaxies: ISM1 Introduction
The star formation rate (SFR) of galaxies scales with their stellar mass (), both at low- (Brinchmann et al., 2004; Salim et al., 2007) and high-redshift (Daddi et al., 2007). This relation is often referred to as the star-forming main-sequence (SFMS). The normalisation of the SFMS increases with redshift, as gas fractions are higher at earlier epochs (Daddi et al., 2010a; Leslie et al., 2020). The slope and scatter only mildly change with redshift and stellar mass (Noeske et al., 2007; Whitaker et al., 2012; Speagle et al., 2014; Schreiber et al., 2015).
Starburst (SB) galaxies are the most intensely star-forming outliers above the SFMS (e.g., Sanders & Mirabel, 1996). The fractional contribution of SB galaxies to the population of star-forming galaxies increases with redshift (e.g., Rodighiero et al., 2011; Sargent et al., 2012; Caputi et al., 2017), from about at (e.g., Bergvall et al., 2016) to about at (Bisigello et al., 2018; Rinaldi et al., 2022).
The nature and origin of SBs is still debated. Two main, possibly concurrent, scenarios have been proposed to explain their enhanced star forming nature: (i) a larger molecular gas reservoir to fuel star formation (e.g., Combes et al., 1994; Casasola et al., 2004; Scoville et al., 2016, 2017; Tacconi et al., 2018); and (ii) an increased efficiency in converting molecular gas into stars, or, equivalently, shorter (molecular gas) depletion times, i.e the time it would take to convert the available molecular gas into stars given the current SFR (e.g., Sofue et al., 1993; Solomon & Sage, 1988; Sargent et al., 2014; Michiyama et al., 2016; Silverman et al., 2015, 2018; Feldmann, 2020). In fact, SB galaxies are often thought to form a separate sequence to normal star-forming disc galaxies, with systematically shorter depletion times, related to having a larger SFR surface density () at fixed gas surface density () (Schmidt, 1959; Kennicutt, 1998; Daddi et al., 2010b; Genzel et al., 2010; Kennicutt & Evans, 2012; Kennicutt & De Los Reyes, 2021). However, selection biases and the use of different conversion factors for SB galaxies with respect to normal star-forming discs, to retrieve the content from molecular tracers (e.g., CO), could lead to an apparent bimodality in depletion times. In fact, unbiased observations of the local Universe reveal continuously distributed depletion times, from values that are typical for normal star-forming disc galaxies to SB galaxies (e.g., Saintonge et al., 2011a, b; Feldmann, 2020). Furthermore, Krumholz et al. (2012) argue that local, normal discs and SB galaxies obey a universal star formation law, where the difference between the two regimes is set by how decoupled giant molecular clouds are from the average density of the interstellar medium (ISM).
High-resolution simulations provide a powerful theoretical framework to probe these scenarios and to investigate the nature of SB galaxies and their triggering mechanisms. Recent simulations demonstrated that galaxy mergers and interactions can drive SBs through tidal torques (e.g., Cox et al., 2008; Capelo et al., 2015; Renaud et al., 2014; Moreno et al., 2015; Hopkins et al., 2018), that can funnel the gas toward the centre, and enhance both the density (Genzel et al., 2010; Moreno et al., 2019; Renaud et al., 2019; Moreno et al., 2021; Segovia Otero et al., 2022) and total mass of (Ellison et al., 2013; Pan et al., 2018). Local ultra-luminous infrared galaxies (ULIRGs) are a class of intensely star-forming galaxies (e.g., Sanders & Mirabel, 1996) that is typically associated with strongly interacting systems, because of the presence of clear tidal features and disturbed morphologies, with depletion times found that are times shorter than in normal star-forming galaxies (e.g., Gao & Solomon, 2004; García-Burillo et al., 2012; Hung et al., 2013; Pereira-Santaella et al., 2021). However, non-interacting ULIRGs have depletion times comparable to those of interacting ones (Violino et al., 2018). Indeed, recent theoretical and observational works suggest that mergers do not always trigger a SB, (e.g., Bergvall et al., 2003; Di Matteo et al., 2007, 2008; Sparre & Springel, 2016; Pearson et al., 2019), especially at high redshift (e.g., Fensch et al., 2017; Shah et al., 2020), and not all SBs are associated with merging systems (e.g., Wilkinson et al., 2018; Díaz-García & Knapen, 2020; Wilkinson et al., 2022; Li et al., 2023).
In this paper, we analyse SB galaxies and non-starbursting (control) galaxies from the FIREbox cosmological volume (Feldmann et al., 2023), over a wide range in masses and redshifts. FIREbox captures the multi-phase structure of the ISM, unlike previous works on SB galaxies in modern cosmological simulations, like, e.g., SIMBA (Rodríguez Montero et al., 2019), Illustris (Wilkinson et al., 2018), and IllustrisTNG (Patton et al., 2020). The high spatial and mass resolution of FIREbox and its accurate treatment of the physics of the interstellar medium (e.g., stellar feedback and gas cooling down to 10 K), make it ideally suited to explore the nature of SB events. The paper is structured as follows. In Section 2, we describe the simulation and our samples. In Section 3, we report the properties of SB galaxies, also comparing to control galaxies, analyse the temporal evolution of galaxies in the period preceding the SB, and investigate the role of interactions in triggering SBs and the driving mechanism in non-interacting systems. Finally, in Section 4, we summarize and discuss our results.
2 Methods
2.1 FIREbox
In this work, we make use of the FIREbox cosmological volume simulation (Feldmann et al., 2023). This volume has a length of per side and is part of the Feedback In Realistic Environments111https://FIRE.northwestern.edu (FIRE) project (Hopkins et al., 2014, 2018). Initial conditions at were created with MUlti Scale Initial Conditions (MUSIC; Hahn & Abel, 2011) using cosmological parameters consistent with Planck 2015 results (Alves et al., 2016): , , , , , and a transfer function calculated with camb222http://camb.info (Lewis et al., 2000, 2011).
The simulation is run with gizmo (Hopkins, 2015). Gravitational forces between particles are calculated with a heavily modified version of the parallelisation and tree gravity solver of GADGET-3 (Springel, 2005) allowing for adaptive force softening, while hydrodynamics is solved with the meshless-finite-mass method introduced in Hopkins (2015).
FIREbox is run with the FIRE-2 model that includes gas cooling and heating, star formation, and stellar feedback (Hopkins et al., 2018). Feedback from supermassive black holes is not included. Gas cooling down to 10 K naturally results in a multi-phase interstellar medium with a cold component. Star formation occurs in dense ( cm-3), self-shielding, self-gravitating, and Jeans-unstable gas, with an instantaneous, expected star formation rate:
| (1) |
where is the mass of the gas particle, is the fraction of molecular gas in the particle, and is the free-fall time, i.e., the time it would take for the gas particle to collapse under its self-gravity:
| (2) |
where is the local mass density of the gas particle and is Newton’s gravitational constant. The gas to star conversion takes place on a local free-fall time with a efficiency. Due to stellar feedback, the integrated local star formation efficiency is lower, consistent with the Schmidt relation (Schmidt, 1959; Kennicutt, 1998; Orr et al., 2018). Stellar feedback includes energy, momentum, mass, and metal injections from supernovae (type II and type Ia) and stellar winds (OB and AGB stars). Radiative feedback (photo-ionisation and photo-electric heating) and radiation pressure from young stars is accounted for in the Locally Extincted Background Radiation in Optically thin Networks (LEBRON) approximation (Hopkins et al., 2012). The FIRE-2 model has been extensively validated in a number of publications analysing properties of galaxies across a range in stellar masses and numerical resolutions (Wetzel et al., 2016; Hopkins et al., 2018; Ma et al., 2018a, b). Specifically, FIREbox reproduces key observed galaxy properties (see Feldmann et al., 2023, for further details) and has been further validated in several recent studies (e.g., Bernardini et al., 2022; Rohr et al., 2022; Gensior et al., 2023).
At the initial redshift, FIREbox contains gas and dark matter particles, corresponding to a mass resolution of for baryonic (gas and star) particles and for dark matter particles. The minimum gas softening length is fixed to (physical, up to ; comoving for ) for stars and for dark matter. The force softening of gas particles is adaptive and coupled to their smoothing length down to a minimum of , which is reached only in the dense ISM. The force resolution is set such that the highest density we formally resolve is 1000 times the star formation threshold (see Hopkins et al., 2018, Section 2.2 for more details).
In the following, we analyse galaxies in the redshift range , to have a representative, mass-complete sample of both low- and high-redshift galaxies after cosmic noon.
2.2 Definitions
To identify dark matter haloes we employ the AMIGA Halo Finder (AHF)333http://popia.ft.uam.es/AHF/Download.htmlTable (Gill et al., 2004; Knollmann & Knebe, 2009). We only consider haloes containing at least 100 particles of any type, which corresponds to a minimum halo mass of . The halo radius is defined based on the virial overdensity criterion, so that the halo virial mass is:
| (3) |
where is the critical density at a given redshift, is the overdensity parameter, and , are the cosmological parameters at redshift (Bryan & Norman, 1998). Halo centres are defined as the loci with the highest total matter density (AHF’s maximum density (MAX) setting). To compute galaxy sizes, we assume the total galaxy radius to be of the halo virial radius (Price et al., 2017). The galaxy stellar mass , as well as other galaxy properties such as total gas masses and SFRs, are then calculated by collecting all particles within . We can then compute half-mass radii for different components (e.g., stars, molecular gas, neutral gas) by linearly interpolating between log-binned radii and the cumulative mass. We compute the SFR as
| (4) |
where is the sum of the at-birth masses of stars that formed within the past time interval . Different values for the averaging time can be associated with different observational tracers for SFR (e.g., Sparre et al., 2017; Flores Velázquez et al., 2021). We choose , approximating the characteristic timescales probed by the most extensively employed SFR tracers: nebular emission and IR/UV continuum from dust and young stars (e.g., Calzetti, 2013). We refer to galaxies with a total as having negligible or zero SFR, where is the fixed mass resolution for star particles.
A non-zero SFR computed by means of equation (1) is associated with self-gravitating, Jeans-unstable, self-shielding gas particles with densities (see Section 2.1). The total instantaneous SFR of a galaxy is thus given by the sum of all SFRs of its gas particles:
| (5) |
where is a binary function being 1 in case the th particle is eligible to form stars and 0 otherwise. The molecular gas fraction of each particle is modelled as a function of its metallicity and dust optical depth for Lyman-Werner photons (Krumholz et al., 2008; McKee & Krumholz, 2010; Krumholz & Gnedin, 2011). The model assumes photo-dissociation and two-phase equilibrium. The dust optical depth is calculated via a local Sobolev-length approximation, estimating the inter-particle separation using the kernel length of the particle (Hopkins, 2015; Hopkins et al., 2018).
In our simulation, all gas particles have approximately the same mass . Moreover, if we suppose to have star-forming particles444Note that ., then we can write:
| SFR | (6) | |||
| (7) |
where represents the average restricted to star-forming particles only. Let us introduce the fraction of star-forming gas mass , where is the sum of the masses of all gas particles belonging to the galaxy and is the total mass of star-forming particles particles, i.e., satisfying all star formation criteria. The galaxy total (instantaneous) SFR can thus be written as follows:
| (8) |
From equation (8) follows the expression for the galaxy (molecular) depletion time (or, equivalently, for the star formation efficiency ), where is the mass of molecular gas, that accounts for any mechanism that leads to a change in SFR without affecting the total molecular gas budget in the galaxy:
| (9) |
where is the fraction of molecular gas in the galaxy. While there are multiple criteria that a gas particle has to satisfy in order to be eligible to form stars, the most stringent is the density threshold criterion, given its high value of in FIREbox. Particles above are typically also self-gravitating, self-shielded, and Jeans-unstable. Therefore, any change in the implies a change in the mass of gas with high-enough density to be eligible for star formation.
2.3 Sample selection
In this work, we only consider FIREbox galaxies with stellar masses in the redshift range , in order to avoid potential spurious effects related to the resolution of the simulation and have a representative, mass-complete sample of low- and high-redshift galaxies after cosmic noon.
We assume that the SFMS is a linear relation555Considering either a bending or an additional constant to the SFMS fit function as in, e.g., Lee et al. (2015); Daddi et al. (2022) would not improve the fit results. between and , with an explicit dependence on the cosmological redshift :
| (10) |
We estimate the free-parameters by fitting equation (10) to the mode of the distribution in each 2D bin of the -space. Using the ridge-line of the distribution we are not biased by low-SFR galaxies and SBs, that would instead affect the median and the moments of the distribution. In Table 1, we report the SFMS fit results for different choices of , with bootstrapped -errors. The fit parameters weakly depend on the choice of , with a steeper relation for . Figure 1 shows the resulting SFMS as a function of stellar mass and colour-coded according to the redshift. The data points refer to the mode sSFR to which we fit equation (10) in the corresponding stellar mass and redshift bin, for all choices of .
| [Myr] | ||
|---|---|---|
| [Myr] | ||
|---|---|---|

We define SB galaxies as having a main-sequence offset of , where, is the expected value on the SFMS, given their redshift and . This definition for SB galaxies is designed to select galaxies lying well above (at least of a factor of 2) the typical SFMS scatter of about dex (Noeske et al., 2007; Daddi et al., 2007; Whitaker et al., 2012; Speagle et al., 2014; Wilkinson et al., 2018). We also create a redshift- and mass-matched control sample of non-starbursting galaxies: for each SB galaxy, we select its control counterpart by randomly picking a galaxy with , at the same redshift, that matches the stellar mass of the SB galaxy within 0.1 dex.
2.4 Interactions
We classify the galaxies in our samples as interacting, if another galaxy with a similar stellar mass approached them within the past . Specifically, for each galaxy in the SB and control samples (referred to as the central galaxy, in this section), we collected all other galaxies (satellites, in this section) within a distance from its centre, as the impact of galaxy interactions can manifest even at these large separations (e.g., Moreno, 2012; Moreno et al., 2013; Patton et al., 2013; Patton et al., 2016). The coordinates of galaxies’ centres are those given by the halo finder. We followed each satellite back in time until it first approached a distance from the central galaxy. The ratio between the stellar masses of each satellite and its corresponding central galaxy, when the satellite first approached defines its original mass-ratio . Furthermore, we also collected and traced all satellites that are found at within the last 100 Myr. Therefore, we additionally account for galaxies that have already merged with the central galaxy. We also account for those satellites that entered and then escaped the neighbourhood of radius in the past 100 Myr (i.e., ‘backsplash galaxies’ and ‘fly-bys’ , Benavides et al., 2021; Haggar et al., 2021), potentially influencing the present observed properties of the central galaxy. Galaxies are followed back in time through their most similar progenitor, based on their position and stellar mass. A central galaxy is classified as interacting if it has at least one satellite with , as SFR can be enhanced as a result of these low-mass ratio galaxy interactions (e.g., Cox et al., 2008; Jackson et al., 2019). Otherwise, the galaxy is classified as non-interacting. Changing either the or the threshold on , would affect the fraction of interacting galaxies the same way in both the SB and the control sample, but does not strongly affect our conclusions when comparing the SB and control sample.
2.5 Starburst duration
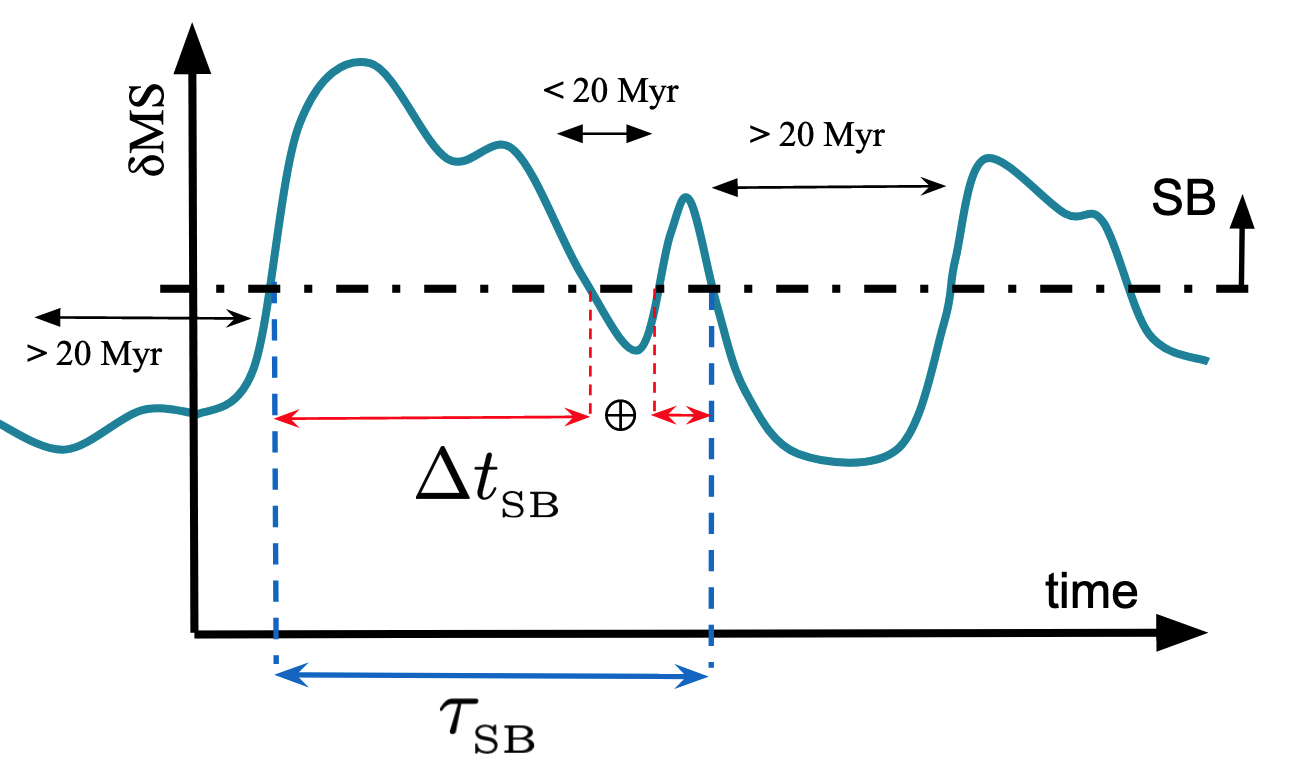
In order to calculate the duration of SB events, we track our galaxies in time through their most similar progenitors and successors. By interpolating the archaeological SFRs between snapshots as a function of cosmic time, we can recover the star formation history of any galaxy, which is then smoothed by taking the rolling average with an averaging time window equal to the chosen . Since the typical stars with a measurable ionising photon flux are O/B stars with main-sequence lifetimes , we define a SB to end whenever for a period of time . In other words, a galaxy undergoes multiple SB events if the periods are separated by with . Conversely, if the SFMS offset of the galaxy drops below 0.6 dex for less than , before rising to again, this event is classified as a single SB. The beginning of the SB event is defined as the time at which the interpolated star formation history satisfies , prior to the snapshot at which the galaxy is first identified as a SB. The end of the SB is defined as the time at which for , after the time at which the galaxy is identified as a SB. We refer to the period of time between the effective beginning and end of the SB event as the SB-phase, that lasts for a time . As an alternative measure of the SB duration, we consider the time that the galaxy has during the SB-phase. Figure 2 illustrates the employed definitions for the duration of a SB, by showing a fictitious star formation history (as the time-series for ) including a SB event.
3 Results
3.1 Starburst sample
Figure 3 shows the the probability distribution function (PDF) for , for different choices of . The area of the grey bars equals the fraction of non-star-forming galaxies, defined as having . The blue-shaded area corresponds to SBs, i.e., those galaxies with (blue, dashed vertical line). The SB population contributes to the total galaxy population with between for . The fraction of SB galaxies decreases with increasing to and for and , respectively. Longer are less sensitive to bursts of star formation on short timescales, thus leading to a smaller fraction of galaxies identified as SB. The fraction of SBs over the total number of galaxies with and is , for , respectively.
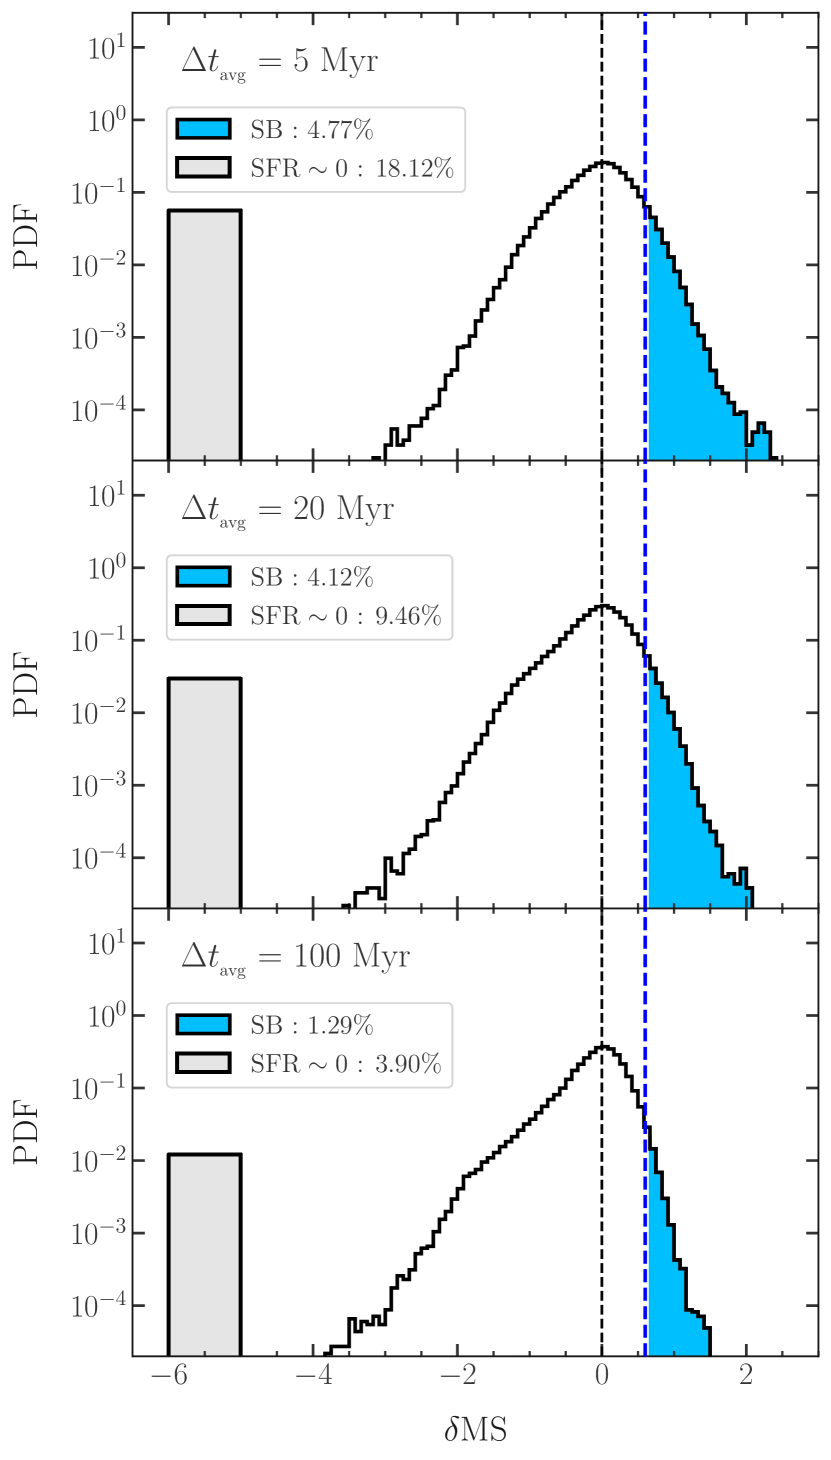
Figure 4 shows the fractional contribution of SBs to the total number of galaxies per stellar mass bin, colour-coded by redshift bin. Different panels correspond to different choices of , from (top panel) to (bottom panel). The SB fraction generally decreases with increasing , for , whereas it remains at a constant value of independent of stellar mass for . The SB fraction shows a moderate redshift dependence, especially in the low-mass regime, with more SBs at higher redshift (note that our SB definition does depend on redshift, accounting for the increased normalisation of the SFMS at higher redshifts). This is in agreement with the observed higher gas content and SFRs of higher redshift galaxies (see e.g., Tacconi et al., 2020, and references therein). For , the SB fraction remains constant at , independent of redshift.
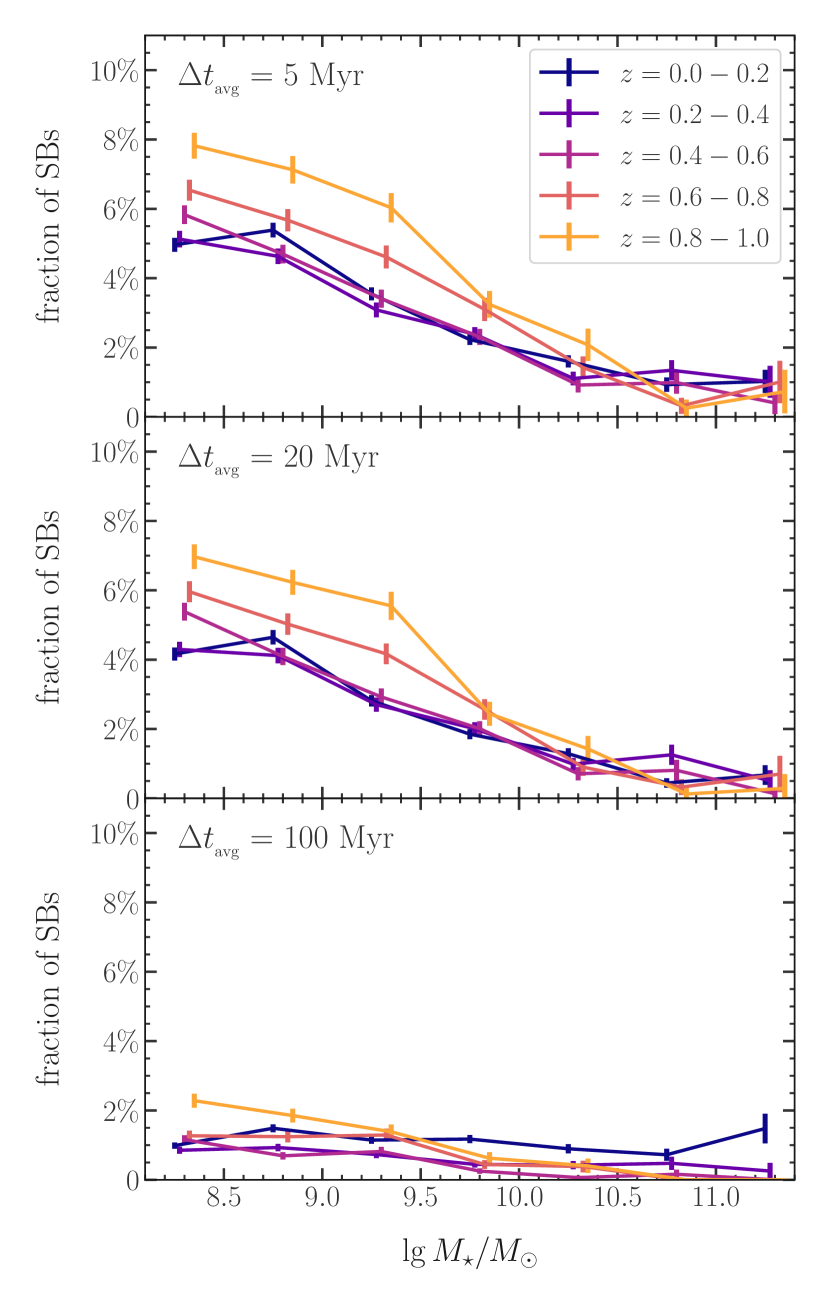
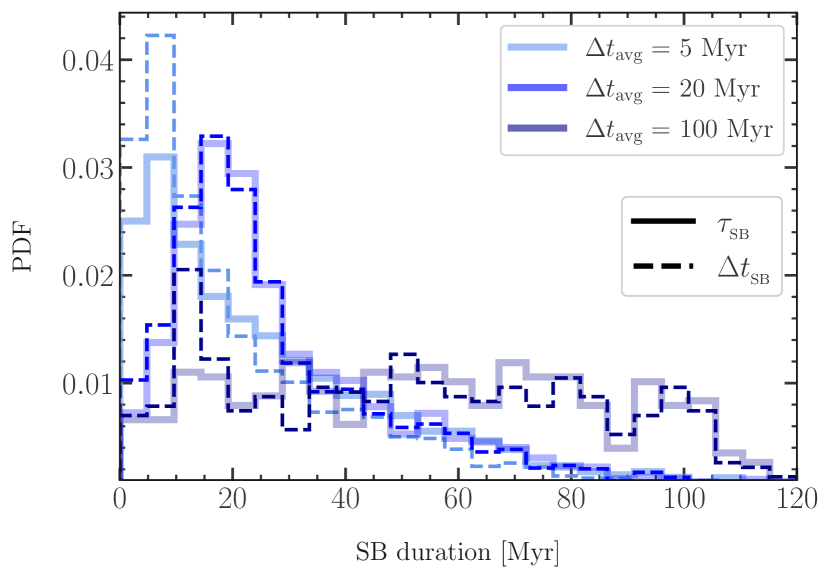
Figure 5 shows the PDFs for the SB duration, colour-coded by . We show the distributions for both the measures for the SB duration, and , defined in Section 2.5 (see Figure 2). The PDFs for peak at SB durations that are approximately the employed averaging time scale, and sharply decline towards longer durations. The PDF for is essentially flat, with a similar contribution from long SBs and those lasting for only . The distributions for and are qualitatively similar. By definition, , implying that the distribution for have a larger contribution from short SB durations, especially for . As we move to a longer , some short-duration SBs might be ‘washed-out’ when averaging the SFR over long timescales. In general, a longer is biased toward longer SBs. We expect that the duration of a SB is positively correlated with the star-forming gas availability and the duration of the driving-mechanism. For instance, tidal features arising from torques during galaxy interactions could persist up to about (see, e.g., Lotz et al., 2008), implying that interactions might affect the galaxy dynamics over relatively long time-scales. We investigate this aspect of interactions in Section 3.5 (see Figure 13).
3.2 Molecular gas masses and depletion times
In this section, we address the question whether it is the star formation efficiency (or, equivalently, the gas depletion time) or the total gas content of a galaxy that characterise SB galaxies when compared to control galaxies. Here, we only consider the sample with , but we find that choosing does not qualitatively change our results. We use as fiducial averaging time because (i) we want to exclude galaxies that briefly enter the SB regime due to stochastic noise in their bursty star formation histories; (ii) it is generally of the order of the lifetime of typical massive stars with significant ionising flux.
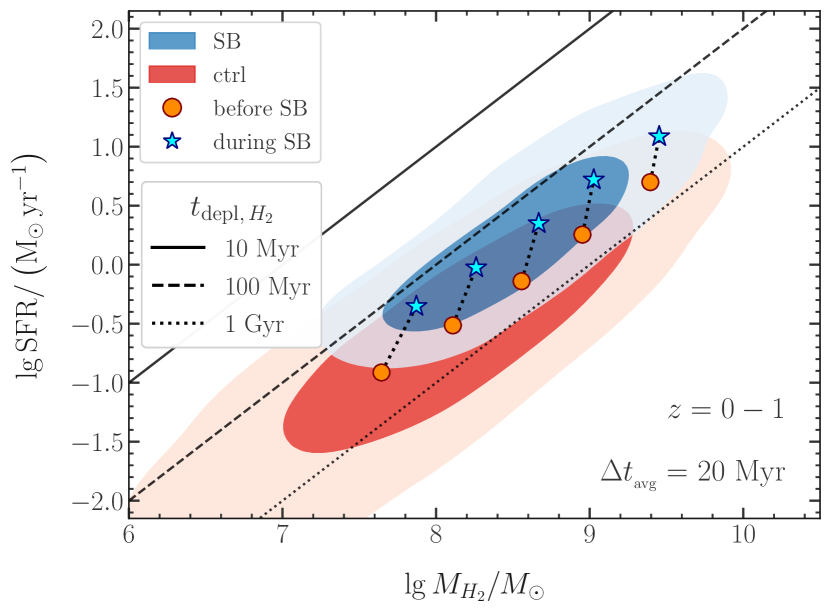
Figure 6 shows the 1 and 2 contours of the 2D-distributions of all SB and control galaxies in the -plane, for . Both samples show a close to linear correlation between SFR and , implying approximately constant molecular depletion times . SB galaxies have , whereas control galaxies exhibit longer , implying that SB galaxies are more efficient at transforming their gas into stars, at fixed , in agreement with observations (e.g., Feldmann, 2020). SB galaxies occupy a narrower range of masses () compared to the control sample (), although both samples extend to similarly large molecular gas masses (considering the 1 contours). This implies that a large is a necessary but not sufficient condition for having a SB. We show the median value of and SFR at prior to the beginning of the SB (orange circles), connected (dotted lines) to the median values during the SB event (cyan stars). From left to right, the different points correspond to increasing 0.5 dex stellar mass (at the beginning of the SB) bins in the range . While star-forming galaxies transition to the SB regime by increasing both their molecular star formation efficiency (i.e., shortening their molecular depletion time) and total molecular gas content, the decrease in appears overall to be the dominant driver for the enhanced SFR in SB galaxies.
3.3 Fraction of high-density gas
Equation (8) and (9) show that the main quantities governing the SFR and depletion time of a galaxies are: the total gas mass, ; the fraction of gas mass that is eligible for star formation in our model; the average fraction of molecular-in-neutral gas divided by the local free-fall time for particles that are eligible for star formation, ; the fraction of molecular gas in the galaxy, . In the following, we explore how these quantities differ in our SB galaxies with respect to control galaxies, and which ones are a good predictor for whether a galaxy is a SB.
In Figure 7, we compare the SB and control samples for , by displaying the PDFs of the main quantities related to a difference in SFR, i.e., those highlighted by equations (8) and (9). Panel A shows the PDF for the total gas mass, . SB galaxies have slightly larger gas masses, with a difference of dex in their median with respect to the one of control galaxies. Panel B shows the fraction gas that is eligible for star formation according to our model, . This fraction is significantly larger in SB galaxies by dex. Panel C shows the molecular gas fraction, . Both the median and the shape of the PDF for differ between the SB and control sample. The distribution for control galaxies is much broader, ranging from , with a median value of . By contrast, SB galaxies display a narrower distribution, ranging from , and with a median at . Thus, the median fraction of molecular gas is larger by dex in SB galaxies with respect to that in control galaxies. Again, a high fraction of molecular gas appears to be a necessary, but not sufficient SB criterion. Finally, panel D shows the distributions of , that span a narrow range of values of dex, with little difference between SB and control galaxies. The choice of does not qualitatively affect any of the aforementioned results. Furthermore, binning galaxies based on either stellar mass or redshift would not affect our conclusions.
The ratio of total gas masses, , of SB and control galaxies is a factor of 2-3 smaller than their ratio of and , making a poor predictor to distinguish SB galaxies from control galaxies. Star-forming particles with densities above the density threshold for star formation have similar free-fall times. Furthermore, we expect for all star-forming particles. Therefore, it is expected that is not significantly different in SB galaxies, as shown in the Figure. We conclude that the main quantities characterising SB galaxies are and . These results highlight that the molecular gas content alone is not sufficient for driving a SB. We therefore seek for a mechanism that can increase the fraction of both molecular and high-density gas in the galaxy, at approximately fixed total gas mass.
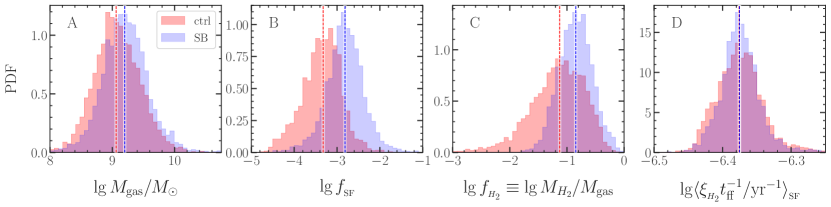
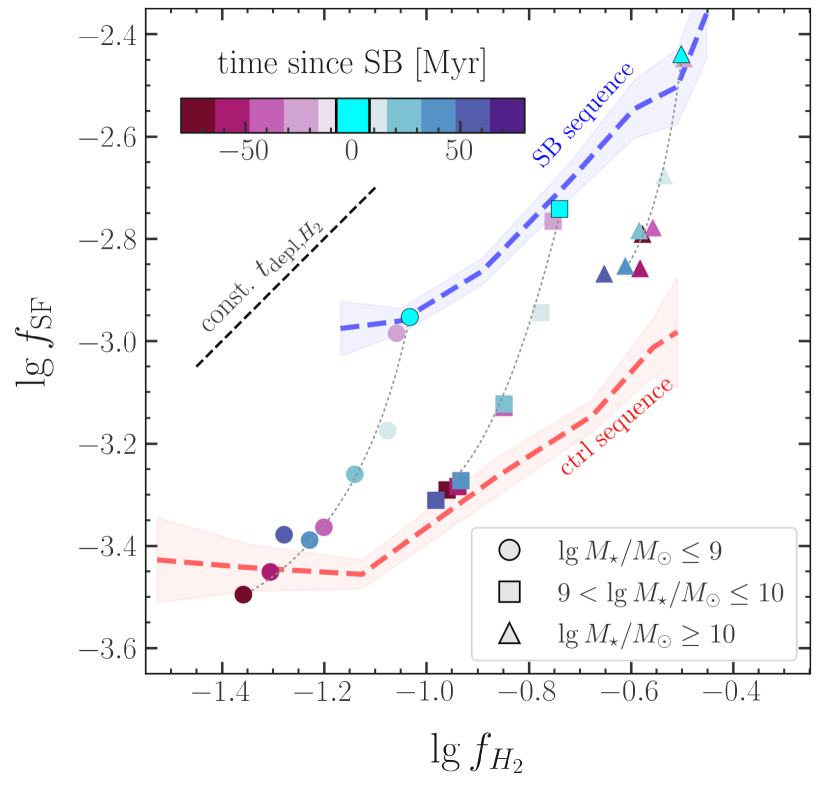
Figure 8, shows the median path of SB galaxies for a time period of centred around the time when the galaxies are identified as a SB, in the -plane. The blue and red dashed curves represent the median trends for SB and control galaxies, respectively, parameterised by their , i.e., connecting the median values for SB and control galaxies in this plane in different mass bins. In general, galaxies evolve from the control sequence to the SB sequence by increasing both their and . The net increase in ( dex) and ( dex) over the time period prior to the SB depends on the mass bin considered. However, the increase in is larger than the one in by dex, independent of the mass bin. From equation (9), we know that the molecular depletion time scales with the ratio of to , assuming for all galaxies. Therefore, a larger change in compared to implies that SB galaxies have on average shorter depletion times with respect to control galaxies. At first ( prior to the SB), low and intermediate-mass galaxies () proceed by increasing and at a similar rate, retaining a nearly constant , while increasing their . Approaching the SB event, the increase in becomes steeper than the increase in . Hence, galaxies with evolve towards significantly shorter and large . More massive galaxies exhibit a much steeper increase in with respect to , indicating that the decrease in dominates over the increase in in driving the enhanced SFR. After the SB event, galaxies reduce both their and , following the same track (but reversed) that brought them to the SB sequence.
In the time period of prior to the SB, massive () SB galaxies are offset ( dex) from the corresponding control sequence. This offset suggests that the most massive SB galaxies could be predominantly driven by a different mechanism compared to the lower mass galaxies. As we will demonstrate in Section 3.5, the main driver for SBs in the high-mass () regime are interactions. Indeed, restricting the analysis to non-interacting SB galaxies (see Appendix A) results in a similar trend as the ones observed for lower mass galaxies, i.e., departure from and then return to the control sequence over a period of encompassing the SB event, starting with only a dex offset from the control sequence. We therefore conclude that interactions in galaxies can enhance prior to the before the SB, such that at prior to the SB is already, on average, dex higher than the median value for control galaxies.
Our model for star-formation requires gas to be self-gravitating, Jeans-unstable, self-shielding, and above a certain density threshold ( in FIREbox). As discussed earlier, in our model, dense-enough gas is also typically eligible for star formation. This implies that is closely related to the fraction of gas with densities above . Therefore, a shift in the gas density PDF towards higher densities would accordingly increase . Furthermore, gas that is dense-enough to form stars in our model is essentially fully molecular. The emerging picture is that a shift in the gas density PDF towards higher densities can explain the increase in both and . In order to produce a SB, the molecular depletion time has to reduce significantly. Hence, since , the fraction of high-density gas must increase more than the fraction of molecular gas. The result is that SB galaxies have shorter molecular depletion times and larger molecular gas masses than control galaxies.
3.4 Gas compaction in the central kpc
To identify the best predictor for classifying galaxies as SB/control we performed a Random Forest classification (Ho, 1995). The features we consider for each galaxy are the gas masses (different phases), stellar masses, angular momenta, and velocity dispersion computed within the galaxy (assumed to be within ) and few fixed apertures of 1, 3, 5, and 10 kpc. We find that the gas (all phases) within the central kpc is the best predictor of whether a galaxy is starbursting. Gas compaction events increase the gas density in the centres of galaxies by increasing the mass in the central regions without significantly changing the total gas mass in the galaxy, leading to a reservoir of dense, molecular gas. We therefore explore the properties of the central region of our SB and control galaxies. In the following, we only show the results relative to the fiducial sample with since our conclusions do not qualitatively change for . Figure 9 shows a comparison between the distributions of SFR and gas masses within the central kpc of SB and control galaxies. We show the SFR averaged over , the total gas mass (), and the fraction of total gas mass that is eligible for star formation in our model (i.e., high-density gas, ), computed within and outside the central kpc. In general, SB galaxies exhibit an enhanced SFR both within and outside their central regions, with a median difference of dex and dex, respectively, compared to control galaxies. In SB galaxies, the SFR within the central kpc is comparable to the SFR in their outer regions, whereas control galaxies display lower values of SFR in their centres compared to their outer parts. Binning galaxies based on either stellar mass or redshifts does not affect our conclusions.
The median of SB galaxies in their central regions is higher by dex with respect to control galaxies. However, outside the central kpc is comparable in SB and control galaxies, within dex.
The median fraction of high-density gas is dex higher in SB galaxies than in control galaxies, both within and outside their central kpc. Therefore, an increase in in the central kpc is required, together with the increased fraction of high-density gas, to explain the higher median SFR in the central regions of SB galaxies compared to control galaxies. On the other hand, the larger SFR outside the central kpc is mostly explained by the enhanced fraction of high-density gas. We conclude that SB galaxies in FIREbox have more concentrated gas reservoirs than control galaxies, supporting the hypothesis of nuclear SB events (e.g., Barnes &
Hernquist, 1991; Wilkinson et al., 2018; Ellison
et al., 2018).
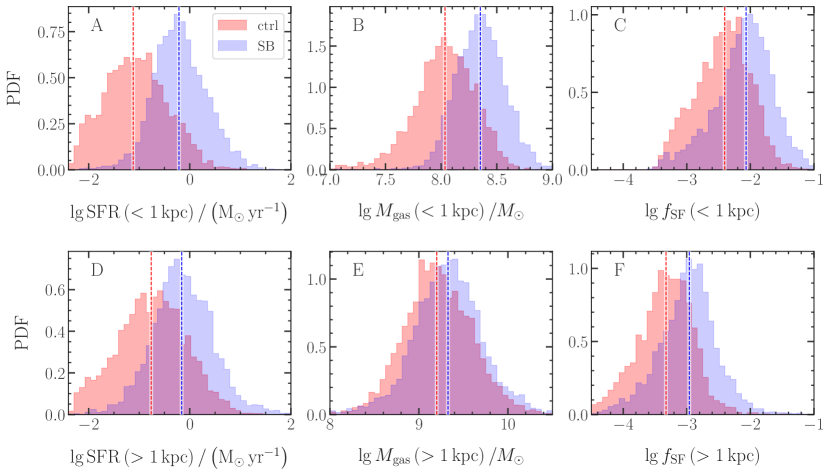
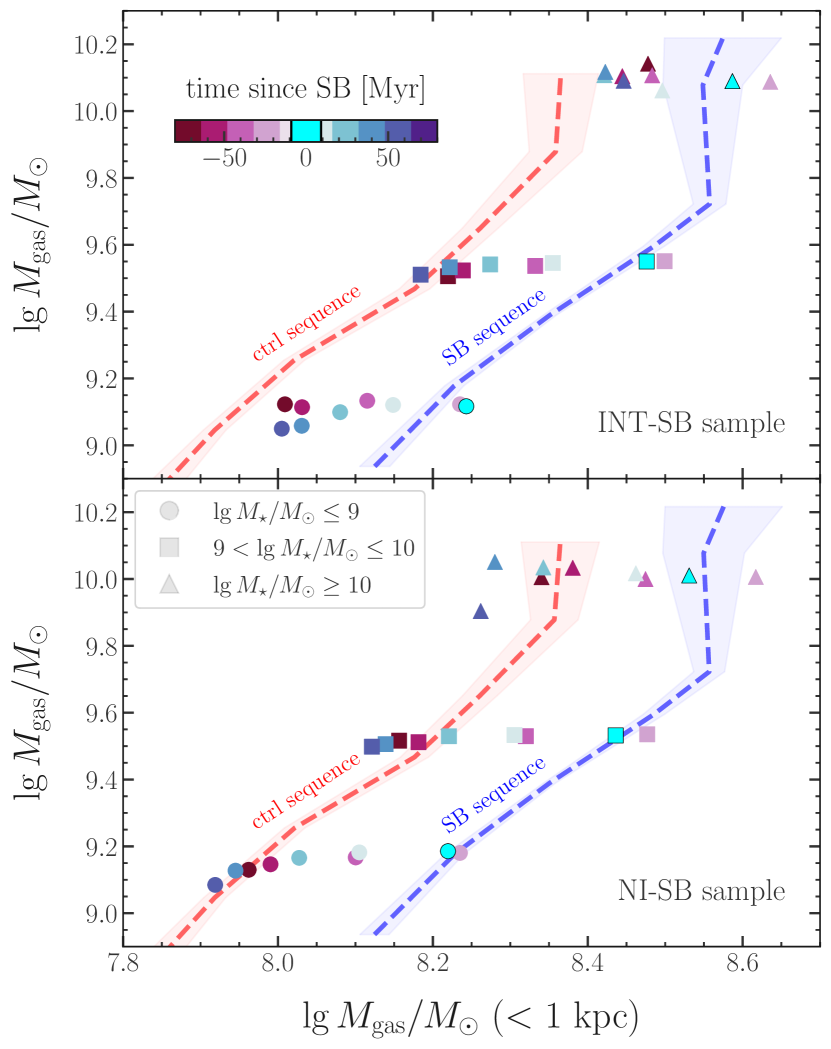
Figure 10 shows the median evolution of the total gas mass and the gas mass within the central kpc for SB galaxies in different stellar mass bins and identified with , in a period of time centred around the time when the galaxies are identified as a SB. All SB galaxies exhibit a similar trend, regardless of their : the total gas mass remains essentially constant, whereas the mass within the central kpc increases significantly ( dex), moving galaxies from the control to the SB median sequence in this plane. We conclude that SB galaxies experienced a compaction event in the last (comparable to the galaxy free-fall timescale), enhancing the gas mass in their central regions, at fixed total . After the SB event, galaxies move back to the former control sequence over . Massive galaxies () have slightly larger gas masses within their central kpc with respect to control galaxies in the period of time of from the SB event. Again, as in the previous Section 3.3, this effect can be explained by making a distinction between interacting and non-interacting SB galaxies (see the next Section 3.5 and Appendix A). In the prior to the SB, non-interacting SB galaxies have gas masses within their central kpc that are close to the median value for control galaxies.
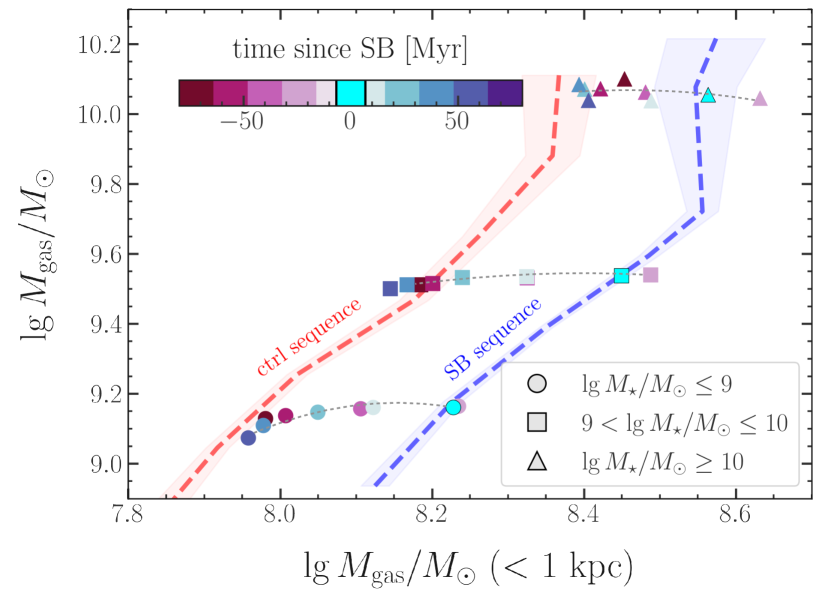
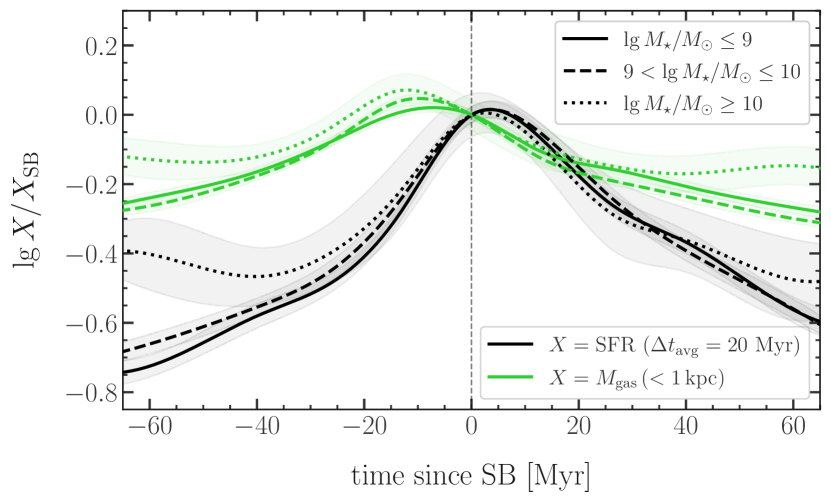
Figure 11 shows the median evolution of the SFR and the gas mass within the central kpc in SB galaxies, with respect to their values at the beginning of the SB event, from about prior to until about after the beginning of the SB. The the gas mass within the central kpc increases together with the SFR, reaching its maximum about before the SFR does and before the beginning of the SB event, for all of the considered stellar masses. This suggests that the gas compaction event is driving the SB across the entire mass range we considered, rather than just correlate with the increase in the SFR. Massive galaxies display a milder median enhancement in their SFR and gas mass within their central kpc, implying that they have pre-enhanced gas reservoirs and star formation activity.
3.5 The role of galaxy interactions
In this section, we study the connection between galaxy interactions and SBs, to understand in which regimes interactions can be considered the main SB-driving mechanism. By collecting the neighbouring galaxies of all our SB and control galaxies, we classified them as interacting/non-interacting (see Section 2.4 for details).
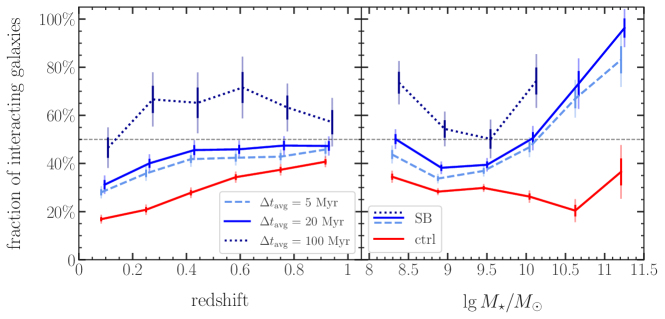
Figure 12 shows the fraction of interacting galaxies as a function of redshift and stellar mass, among SB and control galaxies, for different . Control galaxies are shown as a single, cumulative curve including all different since the interacting fraction is effectively independent of the choice of . In general, at any redshift and stellar mass, SB galaxies are more likely to be interacting than control galaxies. The differences between SB and control galaxies are the largest at low-redshift and for massive () galaxies.
The behaviour of the fraction of interacting SB galaxies for is consistent with that for control galaxies. For these averaging times, the fraction of interacting SB galaxies is similar to the one for control galaxies at high-redshift () and slowly decreases to moving to low-redshift, with a slower pace with respect to control galaxies ( at ). For , the fraction of interacting SB galaxies is systematically higher by than in the samples with a shorter , independent of redshift and stellar mass. Therefore, we conclude that observational tracers that are sensitive to SFR on time-scales of the order of will preferentially select SBs driven by interactions and thus overpredict the fraction of interacting SB galaxies.
The interacting fraction for control galaxies is almost constant () over the whole mass range, whereas it strongly depends on stellar mass for SB galaxies, increasing from to for . Interactions can enhance the SFR and drive SB events through tidal torques that funnel gas toward the centre of the galaxy (e.g., Renaud et al., 2014; Hopkins et al., 2018; Moreno et al., 2019). Hence, we conclude that galaxy interactions in FIREbox are the dominant cause of SBs at high galaxy stellar masses (), especially at low-redshift. Furthermore, for , the interacting fraction of SB galaxies displays an increase from in the low-mass regime, increasing with decreasing . This behaviour is related to the systematically larger fraction of satellite (i.e., non-central) galaxies in the SB sample, compared to the samples of SB galaxies with shorter and control galaxies. Therefore, the preferred channel to drive long SBs (i.e., selected with ) in low-mass galaxies is galaxy interactions. Satellite galaxies are generally less massive and more likely interacting than centrals. Moreover, during galaxy interactions, satellites are more likely to experience a significant enhancement in their SFR (e.g., Moreno et al., 2021). The low-mass SB galaxies selected with in FIREbox are indeed dominated by satellite galaxies.
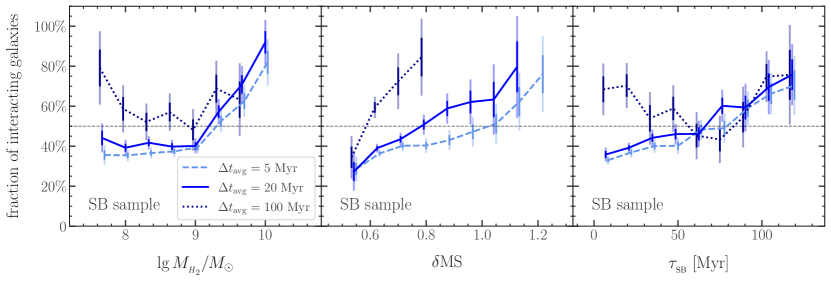
In Figure 13, we further investigate the role of galaxy encounters in driving SBs by showing the fraction of interacting SB galaxies as a function of their molecular gas masses, offset from the SFMS, and duration (for different ). In general, the fraction of interacting SB galaxies is the highest in -rich SB galaxies with prolonged and intense SBs (i.e., with larger positive main-sequence offset ). The fraction of interacting SB galaxies increases strongly with (left panel), independent of , from , likely because more massive SB galaxies are both more likely to be interacting (see the previous Figure 12) and to have higher . For , the fraction of interacting SB galaxies also increases from for decreasing molecular gas mass from , whereas for it remains constant at in the same mass regime. The fraction of interacting SB galaxies increase with increasing (middle panel), from , with a strong dependence on the employed averaging time. Specifically, longer averaging times result in a steeper dependency of the fraction of interacting SB galaxies on . The longer SB duration (; right panel) present in interacting systems is associated with a longer period over which the mechanism driving gas to high densities is effective, as expected for mergers and fly-bys. For , the fraction of interacting SB galaxies increases from , independent of . For , the fraction of interacting SB galaxies increases from with decreasing SB duration for , whereas, for , it decreases from for decreasing in the same range. Short SBs are generally not selected in the sample, unless they are intense (i.e., with a large ) enough to be identified as SBs when smoothing the star formation history over 100 Myr. Since strong SBs are more likely interacting (see middle panel) than less intense ones, a large fraction of short () SBs in the sample is interacting.
We find that a significant fraction () of SB galaxies is non-interacting at all redshifts , especially in the low-mass regime (). In the next sections, we investigate the behaviour of non-interacting SBs and possible SB driving mechanisms in these galaxies.
3.6 Breathing mode in non-interacting SB galaxies
In this section, we explore the mechanisms that could drive gas compaction and SBs in isolated (non-interacting) systems. Low-mass galaxies () have relatively shallow potential wells and are thus likely to experience periods of strong fluctuations with periodic gas displacement. This process is associated with the bursty and stochastic star formation and the efficient stellar feedback in low-mass galaxies in simulations run with FIRE physics: for galaxies, the SFR derived with can vary by an order of magnitude in a time interval of (Sparre et al., 2017). The in-falling gas gets denser and eventually form stars, likely resulting in a SB event. Stellar feedback heats the gas, that expands to larger radii at velocities that are typically below the escape velocity, temporarily halting SFR by gas depletion in the central regions. The out-flowing gas cools over short time-scales and eventually turns-around and re-accretes onto the galaxy, restarting the cycle. This ‘breathing’ process has already been studied in previous theoretical works (e.g., Stinson et al., 2007; Christensen et al., 2016; El-Badry et al., 2016). Stellar feedback is capable of displacing large amounts of gas, especially in low-mass galaxies (with mass-loading factors increasing by a factor for decreasing galaxy stellar mass in the range ; see e.g., Muratov et al. 2015; Anglés-Alcázar et al. 2017; Pandya et al. 2021), and triggers a breathing mode that involves a large fraction of the gas in the galaxy (e.g., El-Badry et al., 2016). We investigate the properties of FIREbox galaxies in order to identify breathing galaxies and understand whether they form a separate class of systems with a specific SB triggering mechanism.
We randomly select 125 non-interacting SB galaxies (random NI-SB sample) in the sample with , uniformly distributed in stellar mass and redshift (5 randomly selected galaxies in each stellar mass and redshift bins: 5 equally spaced log stellar mass bins from with 0.5 dex width and 5 equally spaced redshift bins from ). We then classify them as breathing/non-breathing by visually inspecting the evolution of their (total) gas maps in a period of time of around the SB event. In the gas maps of breathing galaxies, we expect a clear signature of a cycle of gas compaction and subsequent outflow, involving a large fraction of the gas reservoir. Moreover, we expect these global breathing modes to eventually destroy any disc structure in the gas component.
To clarify this point, Figure 14 shows the evolution of total gas surface-density maps of four non-interacting galaxies from this sample. For sake of simplicity, we only show the total gas maps at specific snapshots that helped the classification, during a time interval from before to after the beginning of the SB event. In Table 2 we report the redshift, stellar mass, total gas mass, fraction of stellar mass within the central kpc, and main-sequence offset (for ) of these four example galaxies, at the time when they are selected as SB. The galaxies in panel A and B are classified as non-breathing, whilst those in panel C and D are classified as breathing. The breathing galaxies in panel C and D undergo an episode of compaction leading to the SB and subsequently experiencing quasi-isotropic expansion of a gas shell (clearly visible in both the face-on and edge-on projections) that removes the gas supply for star formation in the centre of the galaxy. The galaxy in the panel B exhibits a clear, although disturbed, gaseous disc in the edge-on projection and is thus classified as non-breathing. Its face-on projection reveals that the central gas compaction, leading to the SB and subsequently an expanding shell/ring of gas in the central , akin to the behaviour of breathing galaxies. This could be related to its poorly centrally concentrated potential that would potentially allow for global breathing modes to develop (see e.g., Hopkins et al., 2023), as shown by the fraction of stellar mass within its central kpc similar to that of the breathing galaxies in panel C and D (see Table 2). The massive, non-breathing galaxy in panel A preserves its disc structure during the SB, due to its deeper potential and well defined disc structure (see the discussion below on the role of angular momentum).
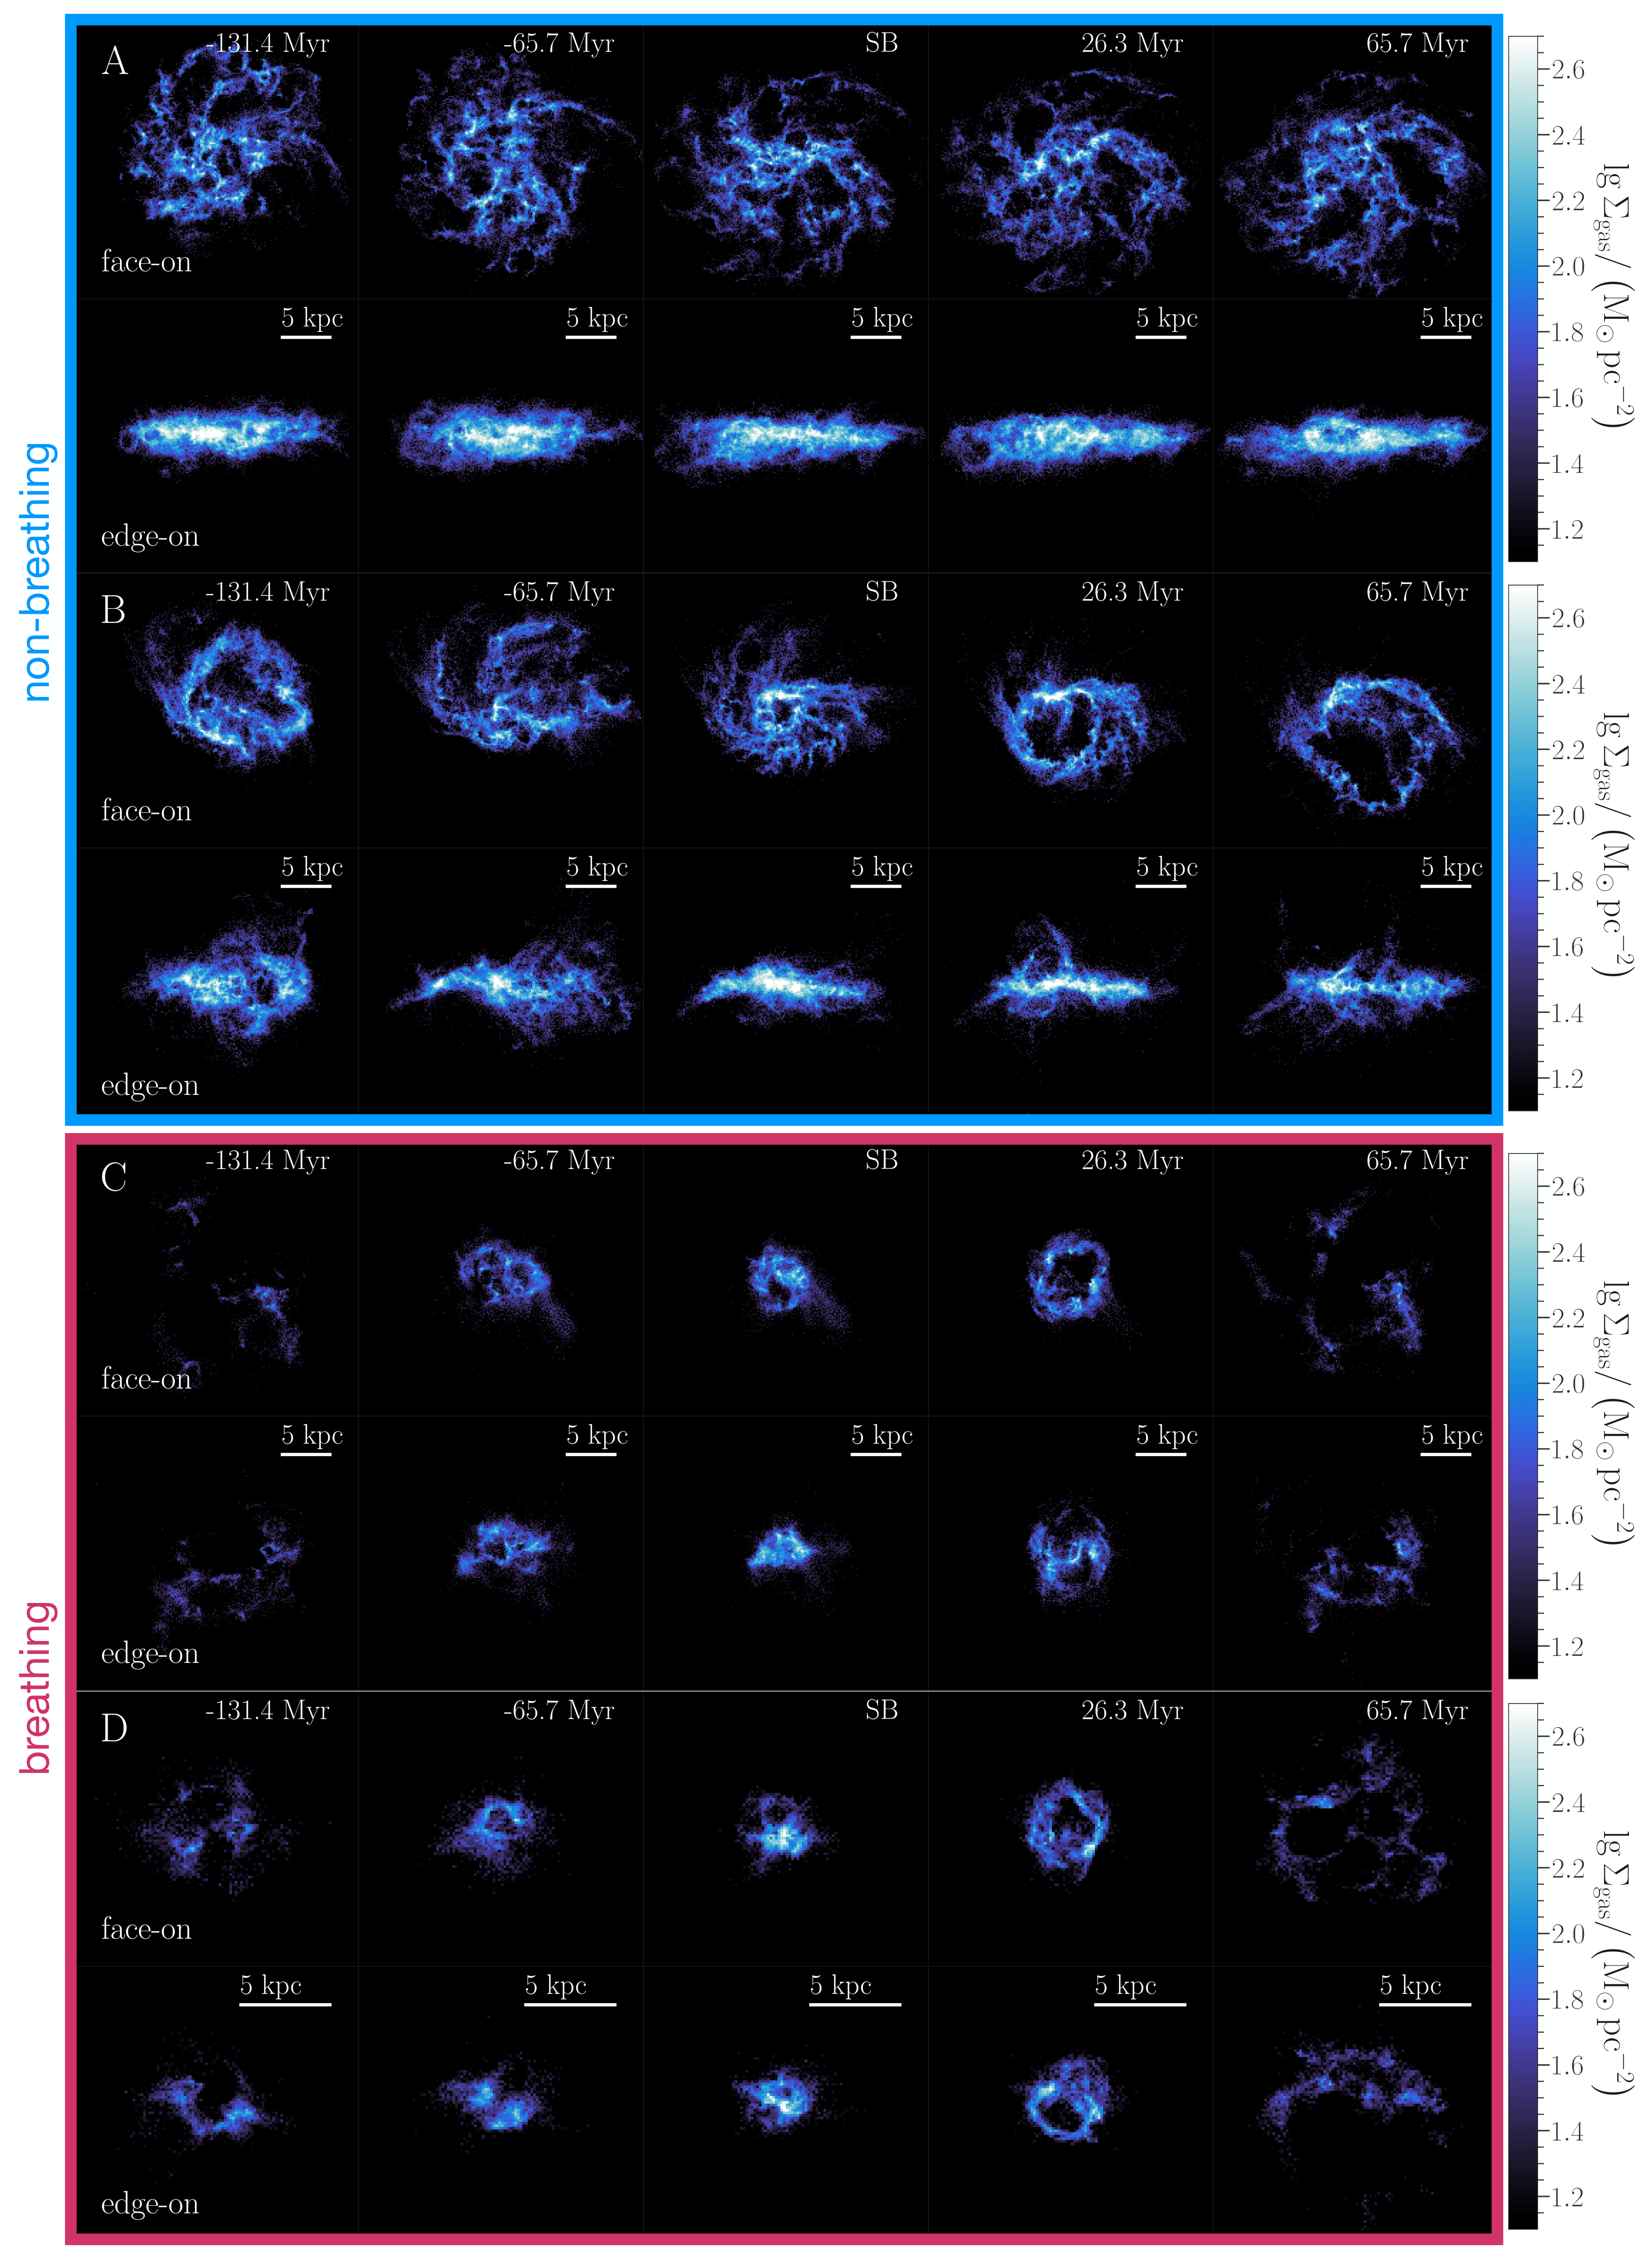
| Figure 14 | Breathing? | redshift | [dex] | |||
|---|---|---|---|---|---|---|
| panel A | No | 0.12 | 10.13 | 10.14 | -1.71 | 0.61 |
| panel B | No | 0.61 | 10.27 | 10.03 | -0.80 | 0.62 |
| panel C | Yes | 0.94 | 8.87 | 9.47 | -0.73 | 1.22 |
| panel D | Yes | 0.86 | 8.43 | 9.02 | -0.60 | 0.89 |
We expect the breathing mode to preferentially take place in low-mass galaxies and with low rotational support for their gas component, related to a low specific gas angular momentum and therefore a less well-defined disc structure. Moreover, we expect breathing galaxies to have a relatively small gas reservoir with respect to non-breathing galaxies, in order for stellar feedback to effectively alter the dynamics of a large fraction of the total gas reservoir, i.e., allowing the SB in the central regions to easily displace most of the gas.
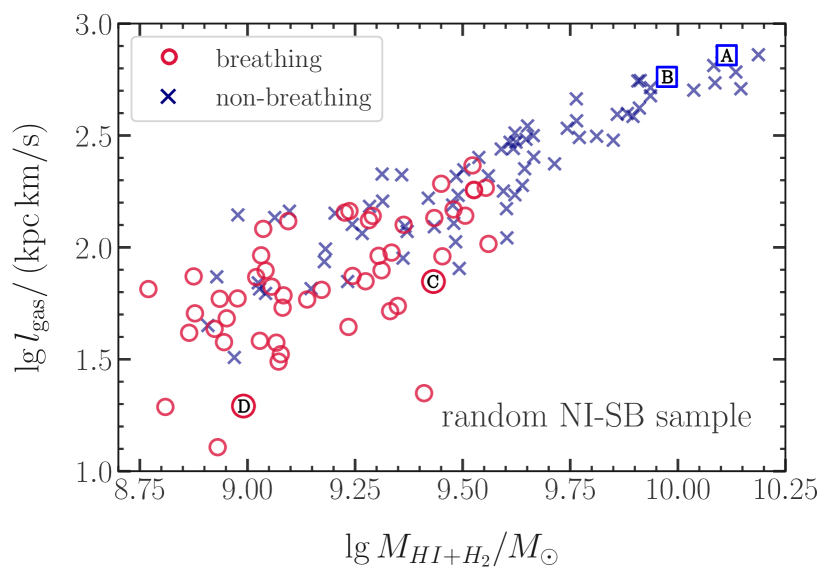
Figure 15 shows the sample of 125 randomly selected non-interacting SB (random NI-SB sample) galaxies in the plane of total gas specific angular momentum and total neutral gas mass. Galaxies that are visually-classified as breathing (red circles) have on average smaller total neutral gas masses and specific gas angular momenta, compared to non-breathing galaxies (blue crosses).
To further test our hypothesis that gas content and gas specific angular momentum are the best predictors to classify breathing galaxies, we made use of a Random Forest classifier. The employed features include the mass, angular momentum, and velocity dispersion of different components (stars, dark matter and gas at different phases), computed within the galaxy size (assumed to be ) and fixed apertures of 1, 3, 5, and 10 kpc. From the feature importance, the total neutral gas mass, and the total gas specific angular momentum, , where is the total angular momentum of the gas in the galaxy, are indeed the best predictors to determine whether a non-interacting SB galaxy is experiencing a breathing mode.
We also run a linear discriminant analysis (LDA, Fisher, 1936) to find the combination of and that best separates the two classes of breathing/non-breathing galaxies. The result is the axis defined by a quantity . The overlap between the two classes (breathing/non-breathing) in the -plane, or, equivalently, the absence of a clear bimodality, suggests that the breathing mode is not a distinct channel to trigger (as well as triggered by) the SB event through central gas compaction, but rather an extreme case where the stellar feedback is effectively displacing a large fraction of the total gas reservoir of the galaxy. As a galaxy increases in mass and angular momentum, it becomes consistently harder to trigger an evident breathing mode. Therefore, a similar mechanism could drive SBs in all non-interacting galaxies.
3.7 You too can become a starburst: occurrence of SBs in former control galaxies
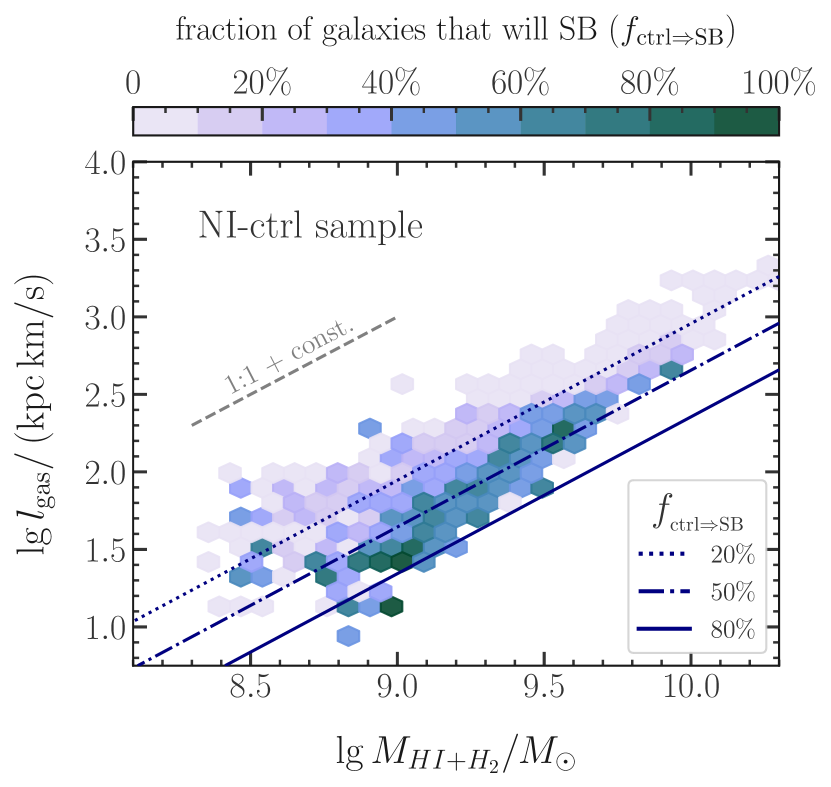
We showed that neutral gas mass and specific gas angular momentum are the best predictors for whether galaxies experience breathing, based on the properties of their gas and stellar content. The lack of a strong rotational support (low ) and a relatively small gas reservoir seems to favour strong fluctuations in the SFR that lead to one or multiple SBs in non-interacting galaxy. We will now investigate where non-interacting, control galaxies in the sample with (NI-ctrl sample) fall within this parameter space and how it relates to the probability of these galaxies undergoing a SB in the future.
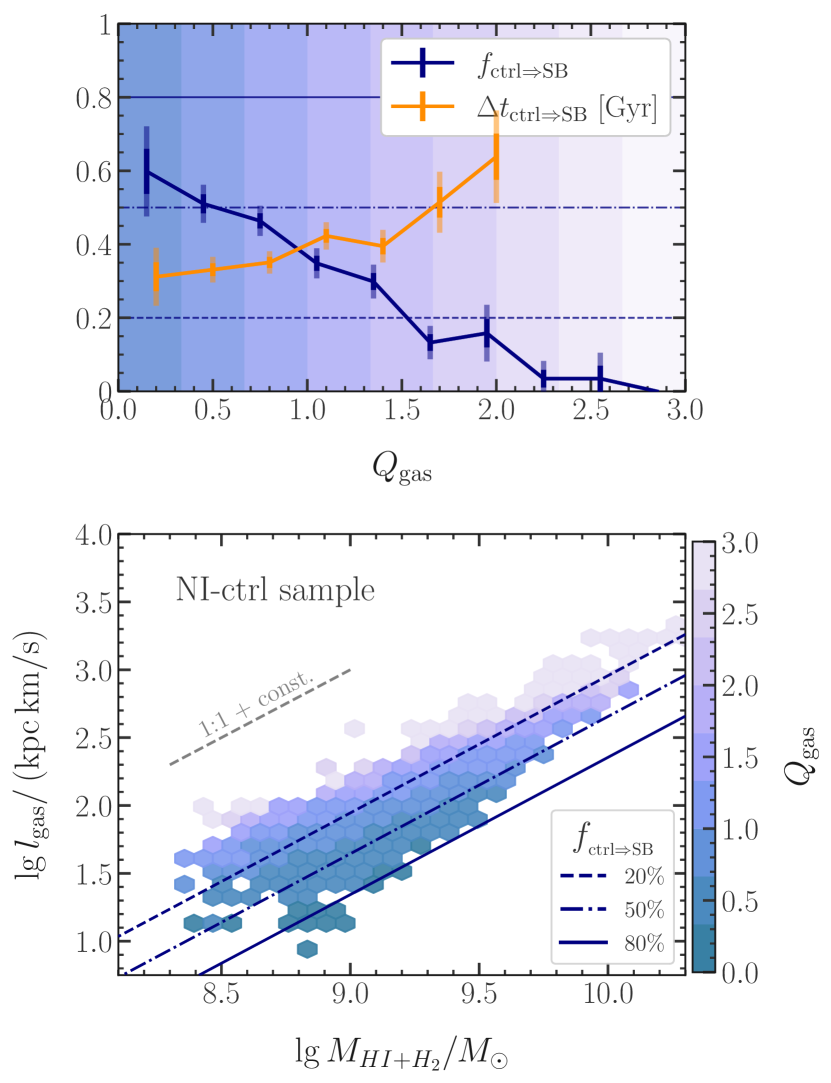
Figure 16 shows the specific angular momentum of the total gas () as a function of total neutral gas mass () for the non-interacting control galaxies, colour-coded by the fraction of galaxies that will undergo a SB within the next Gyr. Galaxies with the lowest angular momentum at a given have the highest likelihood of becoming a SB. This can be understood in the context of gas compaction in the central kpc triggering starbursts. To funnel gas to the centre, effective rotational support is crucial, thus galaxies with lower specific angular momentum are more likely to host a SB in the next Gyr. Only galaxies with are likely to become a SB (where galaxies with higher can become a SB with larger ), because large amounts of gas are required to sustain . The fraction of non-interacting, control galaxies that will become a SB, , increases in a direction that is almost orthogonal to the 1:1 relation. To show this more clearly, we report the resulting contours for (dark blue lines)666Specifically, we performed a multi-linear regression fit of as a function of both and : . Hence, NI-ctrl galaxies that will become a SB are characterized by a lower gas specific angular momentum at fixed neutral gas mass, such that the likelihood of becoming a SB in the next Gyr scale as .
The Toomre (1964) parameter measures the susceptibility of gas discs to axisymmetric gravitational instability. Galaxies with are globally unstable against gravitational collapse (Safronov, 1960; Toomre, 1964), thus we expect gas to move to the galactic centre and their central gas reservoir to compactify over a dynamical timescale, rendering them likely to become a SB. Let us consider for the gas component only, namely:
| (11) |
where is the gas velocity dispersion in the galaxy and is Newton’s gravitational constant. For a fixed velocity dispersion, will scale as . The upper panel of Figure 17 shows the fraction of NI-ctrl galaxies that will undergo a SB in the next Gyr () and the average time until the next SB (; among galaxies that will undergo a SB in the next Gyr), as a function of . In the lower panel, we show the total neutral hydrogen mass () and gas specific angular momentum () for NI-ctrl galaxies, colour-coded by their average . The fraction increases with decreasing , going from essentially zero for up to for . Moreover since for , we conclude that only galaxies with a gravitationally unstable gas reservoir will be able to undergo a SB, meaning that is a necessary, although not sufficient condition to have a SB. For NI-ctrl galaxies that will undergo a SB in the next Gyr, the average decreases for decreasing , going from for to for . Therefore, on average, the more gravitationally unstable is the gas reservoir, the sooner the galaxy will undergo a SB.
4 Summary and discussion
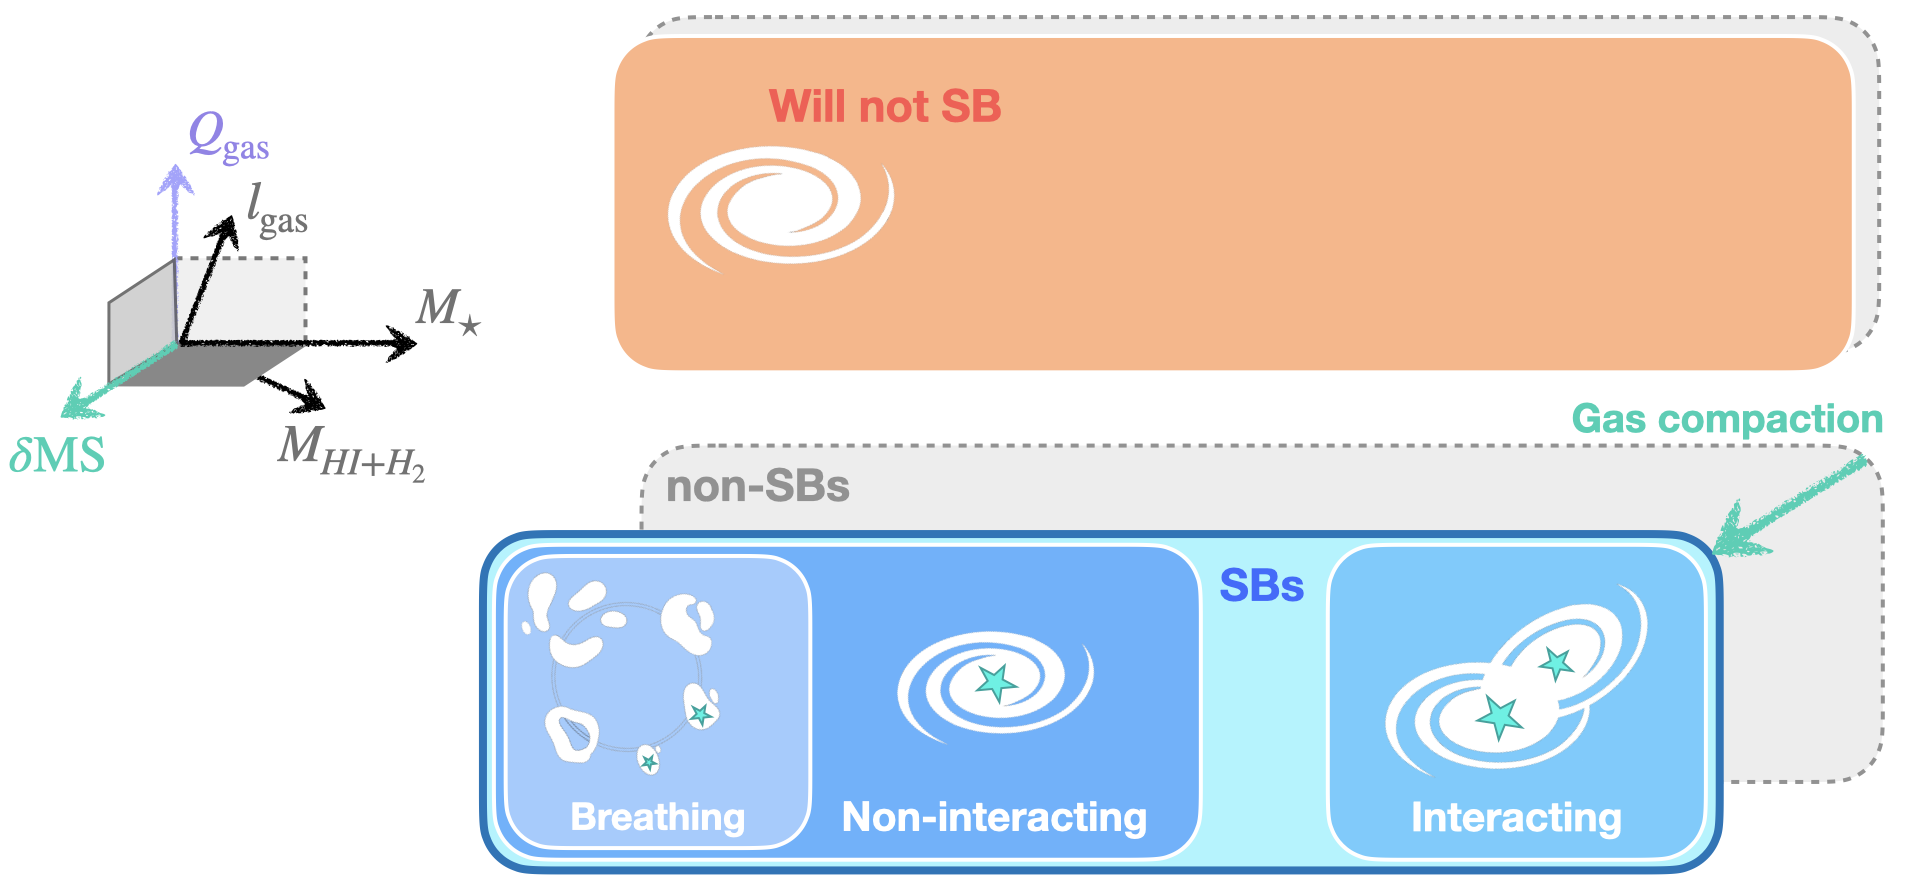
We analysed galaxies with , at redshift , from the FIREbox cosmological volume (Feldmann et al., 2023), to understand the mechanisms driving starbursts (SBs). We defined a starburst galaxy as having an SFR offset from the star-forming main-sequence exceeding 0.6 dex and we compiled a redshift- and stellar mass-matched control sample. We employed different SFR averaging times to mimic different star formation tracers. For all galaxies in our SB and control samples, we computed the properties of their stellar and gas content and, specifically for SB galaxies, the duration of the SB event. Furthermore, we classified all SB and control galaxies as interacting/non-interacting, based on the mass-ratio of other galaxies that came within 200 kpc of the galaxy centre in the past 100 Myr. In the following, we summarize our findings (see also Figure 18 for a schematic overview):
-
•
SB galaxies make up of the entire galaxy population analysed in this work, for SFR averaging timescale of , respectively (see Figure 4).
-
•
At , the SB fraction increases from about to about for decreasing stellar mass from to . The SB fraction increases with redshift, increases from about at , to about at , for .
-
•
SB galaxies have molecular gas depletion times that are on average shorter () than in control galaxies () across the whole range of masses and redshifts considered, implying larger global star-forming efficiencies (see Figure 6). The average molecular gas reservoir hosted by SB galaxies is larger than in control galaxies.
-
•
The median total gas mass in SB galaxies is only slightly larger (by dex) than in control galaxies, whereas their median fractions of molecular and high-density gas, are and dex larger, respectively (see Figure 7). The distribution of the molecular gas fraction for control galaxies exhibits a tail towards low molecular gas fractions, extending to fractions of , whereas SB galaxies have a larger lower limit of . The SFR enhancement in SB galaxies is accompanied by a shortening of their gas depletion times and an increase in their molecular gas masses, as a consequence of an increase in both the fraction of molecular and high-density star-forming gas (as per our model definition) at fixed total gas mass (see equations 8-9)
-
•
Galaxies become SB by shortening their molecular gas depletion time and, less significantly, by increasing their molecular gas mass over the prior to the SB (see Figure 6). In the prior to the SB, the fractions of both molecular and high-density, star-forming gas increase on average by dex and dex, respectively, depending on stellar mass (see Figure 8), from values that are typical of control galaxies to those for SB galaxies. On average, the fraction of high-density, star-forming gas increases more than the fraction of molecular gas, resulting in the shortening of the molecular depletion time (see equation (9)), especially in the prior to the SB, and an increase of the molecular gas mass at fixed total gas mass. After the SB, the fractions of molecular and high-density, star-forming gas reduce to typical values for control galaxies in , reversing the path they followed prior to the SB.
-
•
SB events are accompanied by a significant increase ( dex) in the gas mass in the central kpc, at fixed total gas mass (see Figure 10). The gas mass in the central regions of SB galaxies reaches its maximum prior to the beginning of the SB event, suggesting the gas compaction events causally result in SBs (see Figure 11).
-
•
SB galaxies display more concentrated SFRs, with the median SFR within the central kpc of SB galaxies being comparable to their median global SFR and significantly larger than in control galaxies (see Figure 9). The higher median global SFR of SB galaxies is explained by the larger median fraction of high-density, star-forming gas, whereas, within their central kpc, also an increase in their median total gas mass has to be accounted for to explain the higher median SFR.
-
•
The fraction of SB galaxies that are interacting increases from to with increasing galaxy stellar masses , i.e., SBs in massive () galaxies are predominantly driven by galaxy interactions including mergers and flybys (see Figure 12). Long and intense SBs are more likely to be interacting. The fraction of interacting SB galaxies increases with the SB duration (), increasing from to for . Interacting SB galaxies also display the most extreme SFR offset from the SFMS SFR, , increasing from to for (see Figure 13). The observational tracers for star formation that are sensitive to SFR on relatively long time-scales of systematically overpredict the number of interacting SB galaxies in FIREbox, and consequently reduce the observed contribution of non-interacting systems to the SB population. A large fraction () of low-mass () SB galaxies at is non-interacting, implying that SBs are not always triggered by interactions.
-
•
Non-interacting SB galaxies with a poor rotational support (i.e., with low gas specific angular momentum) and low neutral gas masses can exhibit a ‘breathing’ mode (see, e.g., Christensen et al., 2016; El-Badry et al., 2016), since in this regime stellar feedback by the nuclear SB is able to displace a large fraction of the gas reservoir in a quasi-isotropic, spherical fashion, evacuate the central region of the galaxy of gas, and destroy the gas disc (see Figure 15). The smooth transition between breathing and non-breathing galaxies in the properties of their gas and stellar content, and star formation histories suggests that they share a common SB-driving mechanism, instead of pointing to a separate physical process triggering the breathing mode.
-
•
The fraction of non-interacting, control galaxies that will undergo a SB in the next Gyr increases up to for a global Toomre parameter (see Figure 17). Galaxies with have a low chance of undergoing a SB in the next Gyr. Moreover, the lower the , the shorter is the average time until the next SB, ranging from for . Massive galaxies have on average larger and therefore likely require galaxy interactions to funnel gas towards the central regions and initiate a nuclear SB.
The fractional contribution of SB galaxies in FIREbox is in agreement with recent observations, increasing from about at to about at (e.g., Bergvall et al., 2016; Rinaldi et al., 2022). However, the reported fractions depend on the exact definition of SB galaxies. Bisigello et al. (2018) report the SB fraction in a similar redshift and mass range as presented here. They find that SB galaxies constitute of all galaxies with , with SFRs estimated using either mid/far-IR or rest-UV photometry (to be compared to our estimates of for ). They also show that the SB fraction increases with redshift, especially at , in agreement with our results.
Gas compaction drives SBs in FIREbox, as evidenced by the increase in the fraction of total gas mass in the central regions of SB galaxies over prior to the beginning of the SB event. The fractions of molecular and high-density gas increase in the process of funnelling gas towards the centre, resulting in a global increase of both the molecular gas mass and SFR. The disproportional increase in the fraction of high-density gas compared to the fraction of molecular gas results in a more important shortening of the molecular depletion time with respect to the increase in molecular gas mass. This behaviour in FIREbox owes to a shift of the gas density PDF towards high densities (as it is the case in SBs triggered by interactions, e.g., in Renaud et al., 2014). In the case of the SB galaxies studied here, the increase in the amount of gas dense enough to be eligible for star-formation in our model does not imply, on average, a proportional increase in the amount of molecular gas (see, e.g., Moreno et al., 2021). On the other hand, the turbulent nature of the ISM can also result in the opposite scenario, where only a small fraction of dense gas being star-forming, resulting in low star-forming efficiencies as in the Milky Way’s central molecular zone (e.g., Moreno et al., 2019; Orr et al., 2021). To summarize, our results favour a scenario where the SBs are driven mainly by enhanced star-forming efficiencies rather that more massive gas reservoirs (e.g., Ellison et al., 2020; Feldmann, 2020), and support the hypothesis of a mainly nuclear, rather than a uniform, global SB event (e.g., Barnes & Hernquist, 1991; Wilkinson et al., 2018; Ellison et al., 2018).
Galaxy interactions can trigger gas compaction by tidal torques (see ,e.g., Pan et al., 2018; Moreno et al., 2021; Garay-Solis et al., 2023; He et al., 2023). Results from observations of local ultra-luminous infrared galaxies and recent high-resolution simulations demonstrated that SBs can be driven by interactions (e.g., Hopkins et al., 2018; Renaud et al., 2019). We found that interactions play a major role in driving SBs in galaxies, aligned with the findings by Hung et al. (2013) for Herschel-selected galaxies at . However, a large fraction () of SB galaxies in FIREbox are non-interacting. This finding is consistent with an analysis of the Illustris simulation (Vogelsberger et al., 2014) by Wilkinson et al. (2018), who report that SB galaxies are not triggered by mergers in of the cases. Our results are also in agreement with recent observational work by Wilkinson et al. (2022), who report a (lower limit) merger fraction of about 10 to 40 per cent (depending on the exact methods employed for the selection and classification) for the observed post-starburst galaxies at , with stellar masses mostly at (see also, e.g., Zabludoff et al., 1996; Blake et al., 2004; Goto, 2005; Pawlik et al., 2018).
Non-interacting galaxies are more likely to undergo a SB in the future if their gas reservoir is globally gravitationally unstable (as measured by their global Toomre ), allowing for massive gas inflows towards the central regions (e.g., Dekel & Burkert, 2014; Danovich et al., 2015; Zolotov et al., 2015). Our work extends previous findings on the role of gas compaction events in the SFMS scatter (e.g., Tacchella et al., 2016). This is also consistent with theoretical work on high-redshift galaxies, on the existence of a ‘blue nugget’ phase caused by wet gas compaction (e.g., Tacchella et al., 2016; Lapiner et al., 2023). This scenario is especially akin to what we found for our non-interacting, breathing, SB galaxies.
We found that the lower the the sooner a galaxy will undergo a SB. This aligns with recent observations of a small number of local SB galaxies with from the DYNAMO (DYnamics of Newly-Assembled Massive Object) survey (Fisher et al., 2014, 2017a, 2017b, 2022). Local, non-starbursting spirals are commonly found to have (e.g., Leroy et al., 2008). Furthermore, observations of a nearby star-forming galaxy (LARS 8; Östlin et al., 2014; Hayes et al., 2014) with a stellar mass of reveal a highly globally unstable disk of gas that triggers the formation of massive, dense molecular clumps (Puschnig et al., 2023), thus corroborating our findings.
We showed that SB galaxies move back to the main-sequence of star-forming galaxies after the SB event, whilst hosting a significant amount of molecular gas. Recent studies revealed that some post-SB galaxies might lie on the star-forming main-sequence and have relatively large molecular gas fractions, despite their low rate of star formation inferred from UV indicators (e.g., French, 2021; Baron et al., 2022; Smercina et al., 2022; Baron et al., 2023). Hence, our predictions on the fate of SB galaxies might have important implications for future research on the nature an origin of post-SB galaxies (e.g., Kriek et al., 2010; Suess et al., 2019, and references therein).
In this work, we showed that global gravitational instabilities driving central gas compaction are the main cause for SBs in FIREbox. To validate this theoretical prediction, high-resolution studies of the gas properties and kinematics in star-forming galaxies are crucial, e.g., with the PHANGS (Physics at High Angular resolution in Nearby GalaxieS) survey (e.g., Leroy et al., 2021; Emsellem et al., 2022; He et al., 2023). Furthermore, upcoming data from the James Webb Space Telescope (JWST) (Gardner et al., 2006) will help unveiling the connection between the stability and properties of the dense interstellar medium in local and high-redshift galaxies in unprecedented detail.
Acknowledgements
EC thanks Papa IV for His countless blessings. EC thanks Guochao Sun for inspiring discussions and helpful comments. RF, LB acknowledge financial support from the Swiss National Science Foundation (grant no PP00P2194814). EC, RF, MB acknowledge financial support from the Swiss National Science Foundation (grant no 200021188552). JG gratefully acknowledges financial support from the Swiss National Science Foundation (grant no CRSII5193826). JM is supported by the Hirsch Foundation. We acknowledge PRACE for awarding us access to MareNostrum at the Barcelona Supercomputing Center (BSC), Spain. This research was partly carried out via the Frontera computing project at the Texas Advanced Computing Center. Frontera is made possible by National Science Foundation award OAC-1818253. This work was supported in part by a grant from the Swiss National Supercomputing Centre (CSCS) under project IDs s697 and s698. We acknowledge access to Piz Daint at the Swiss National Supercomputing Centre, Switzerland, under the University of Zurich’s share with the project ID uzh18. This work made use of infrastructure services provided by S3IT (www.s3it.uzh.ch), the Service and Support for Science IT team at the University of Zurich. All plots were created with the matplotlib library for visualization with Python (Hunter, 2007). This project is part of the FIRE simulation collaboration.
Data Availability
The data supporting the plots within this article are available on reasonable request to the corresponding author. A public version of the gizmo code is available at http://www.tapir.caltech.edu/~phopkins/Site/GIZMO.html.
References
- Alves et al. (2016) Alves J., Combes F., Ferrara A., Forveille T., Shore S., 2016, Astronomy and Astrophysics, 594
- Anglés-Alcázar et al. (2017) Anglés-Alcázar D., Faucher-Giguère C.-A., Kereš D., Hopkins P. F., Quataert E., Murray N., 2017, MNRAS, 470, 4698
- Barnes & Hernquist (1991) Barnes J. E., Hernquist L. E., 1991, ApJ, 370, L65
- Baron et al. (2022) Baron D., Netzer H., Lutz D., Prochaska J. X., Davies R. I., 2022, MNRAS, 509, 4457
- Baron et al. (2023) Baron D., Netzer H., French K. D., Lutz D., Davies R. I., Prochaska J. X., 2023, MNRAS, 524, 2741
- Benavides et al. (2021) Benavides J. A., et al., 2021, Nature Astronomy, 5, 1255
- Bergvall et al. (2003) Bergvall N., Laurikainen E., Aalto S., 2003, A&A, 405, 31
- Bergvall et al. (2016) Bergvall N., Marquart T., Way M. J., Blomqvist A., Holst E., Östlin G., Zackrisson E., 2016, A&A, 587, A72
- Bernardini et al. (2022) Bernardini M., Feldmann R., Anglés-Alcázar D., Boylan-Kolchin M., Bullock J., Mayer L., Stadel J., 2022, MNRAS, 509, 1323
- Bisigello et al. (2018) Bisigello L., Caputi K. I., Grogin N., Koekemoer A., 2018, A&A, 609, A82
- Blake et al. (2004) Blake C., et al., 2004, MNRAS, 355, 713
- Brinchmann et al. (2004) Brinchmann J., Charlot S., White S. D. M., Tremonti C., Kauffmann G., Heckman T., Brinkmann J., 2004, MNRAS, 351, 1151
- Bryan & Norman (1998) Bryan G. L., Norman M. L., 1998, The Astrophysical Journal, 495, 80
- Calzetti (2013) Calzetti D., 2013, in Falcón-Barroso J., Knapen J. H., eds, , Secular Evolution of Galaxies. p. 419
- Capelo et al. (2015) Capelo P. R., Volonteri M., Dotti M., Bellovary J. M., Mayer L., Governato F., 2015, MNRAS, 447, 2123
- Caputi et al. (2017) Caputi K. I., et al., 2017, ApJ, 849, 45
- Casasola et al. (2004) Casasola V., Bettoni D., Galletta G., 2004, A&A, 422, 941
- Christensen et al. (2016) Christensen C. R., Davé R., Governato F., Pontzen A., Brooks A., Munshi F., Quinn T., Wadsley J., 2016, ApJ, 824, 57
- Combes et al. (1994) Combes F., Prugniel P., Rampazzo R., Sulentic J. W., 1994, A&A, 281, 725
- Cox et al. (2008) Cox T. J., Jonsson P., Somerville R. S., Primack J. R., Dekel A., 2008, MNRAS, 384, 386
- Daddi et al. (2007) Daddi E., et al., 2007, ApJ, 670, 156
- Daddi et al. (2010a) Daddi E., et al., 2010a, ApJ, 713, 686
- Daddi et al. (2010b) Daddi E., et al., 2010b, ApJ, 714, L118
- Daddi et al. (2022) Daddi E., et al., 2022, A&A, 661, L7
- Danovich et al. (2015) Danovich M., Dekel A., Hahn O., Ceverino D., Primack J., 2015, MNRAS, 449, 2087
- Dekel & Burkert (2014) Dekel A., Burkert A., 2014, MNRAS, 438, 1870
- Di Matteo et al. (2007) Di Matteo P., Combes F., Melchior A. L., Semelin B., 2007, A&A, 468, 61
- Di Matteo et al. (2008) Di Matteo P., Bournaud F., Martig M., Combes F., Melchior A. L., Semelin B., 2008, A&A, 492, 31
- Díaz-García & Knapen (2020) Díaz-García S., Knapen J. H., 2020, A&A, 635, A197
- El-Badry et al. (2016) El-Badry K., Wetzel A., Geha M., Hopkins P. F., Kereš D., Chan T. K., Faucher-Giguère C.-A., 2016, ApJ, 820, 131
- Ellison et al. (2013) Ellison S. L., Mendel J. T., Patton D. R., Scudder J. M., 2013, MNRAS, 435, 3627
- Ellison et al. (2018) Ellison S. L., Sánchez S. F., Ibarra-Medel H., Antonio B., Mendel J. T., Barrera-Ballesteros J., 2018, MNRAS, 474, 2039
- Ellison et al. (2020) Ellison S. L., Thorp M. D., Pan H.-A., Lin L., Scudder J. M., Bluck A. F. L., Sánchez S. F., Sargent M., 2020, MNRAS, 492, 6027
- Emsellem et al. (2022) Emsellem E., et al., 2022, A&A, 659, A191
- Feldmann (2020) Feldmann R., 2020, Communications Physics, 3, 226
- Feldmann et al. (2023) Feldmann R., et al., 2023, MNRAS, 522, 3831
- Fensch et al. (2017) Fensch J., et al., 2017, MNRAS, 465, 1934
- Fisher (1936) Fisher R. A., 1936, Annals of Eugenics, 7, 179
- Fisher et al. (2014) Fisher D. B., et al., 2014, ApJ, 790, L30
- Fisher et al. (2017a) Fisher D. B., et al., 2017a, MNRAS, 464, 491
- Fisher et al. (2017b) Fisher D. B., et al., 2017b, ApJ, 839, L5
- Fisher et al. (2022) Fisher D. B., Bolatto A. D., Glazebrook K., Obreschkow D., Abraham R. G., Kacprzak G. G., Nielsen N. M., 2022, ApJ, 928, 169
- Flores Velázquez et al. (2021) Flores Velázquez J. A., et al., 2021, MNRAS, 501, 4812
- French (2021) French K. D., 2021, PASP, 133, 072001
- Gao & Solomon (2004) Gao Y., Solomon P. M., 2004, ApJ, 606, 271
- Garay-Solis et al. (2023) Garay-Solis Y., Barrera-Ballesteros J. K., Colombo D., Sánchez S. F., Lugo-Aranda A. Z., Villanueva V., Wong T., Bolatto A. D., 2023, ApJ, 952, 122
- García-Burillo et al. (2012) García-Burillo S., Usero A., Alonso-Herrero A., Graciá-Carpio J., Pereira-Santaella M., Colina L., Planesas P., Arribas S., 2012, A&A, 539, A8
- Gardner et al. (2006) Gardner J. P., et al., 2006, Space Sci. Rev., 123, 485
- Gensior et al. (2023) Gensior J., Feldmann R., Mayer L., Wetzel A., Hopkins P. F., Faucher-Giguère C.-A., 2023, MNRAS, 518, L63
- Genzel et al. (2010) Genzel R., et al., 2010, MNRAS, 407, 2091
- Gill et al. (2004) Gill S. P. D., Knebe A., Gibson B. K., 2004, MNRAS, 351, 399
- Goto (2005) Goto T., 2005, MNRAS, 357, 937
- Haggar et al. (2021) Haggar R., Pearce F. R., Gray M. E., Knebe A., Yepes G., 2021, MNRAS, 502, 1191
- Hahn & Abel (2011) Hahn O., Abel T., 2011, Monthly Notices of the Royal Astronomical Society, 415, 2101
- Hayes et al. (2014) Hayes M., et al., 2014, ApJ, 782, 6
- He et al. (2023) He H., Bottrell C., Wilson C., Moreno J., Burkhart B., Hayward C. C., Hernquist L., Twum A., 2023, ApJ, 950, 56
- Ho (1995) Ho T. K., 1995, in Proceedings of 3rd International Conference on Document Analysis and Recognition. pp 278–282 vol.1, doi:10.1109/ICDAR.1995.598994
- Hopkins (2015) Hopkins P. F., 2015, Monthly Notices of the Royal Astronomical Society
- Hopkins et al. (2012) Hopkins P. F., Quataert E., Murray N., 2012, Monthly Notices of the Royal Astronomical Society, 421, 3488
- Hopkins et al. (2014) Hopkins P. F., Kereš D., Oñorbe J., Faucher-Giguère C. A., Quataert E., Murray N., Bullock J. S., 2014, Monthly Notices of the Royal Astronomical Society
- Hopkins et al. (2018) Hopkins P. F., et al., 2018, Monthly Notices of the Royal Astronomical Society, 480, 800
- Hopkins et al. (2023) Hopkins P. F., et al., 2023, MNRAS,
- Hung et al. (2013) Hung C.-L., et al., 2013, ApJ, 778, 129
- Hunter (2007) Hunter J. D., 2007, Computing in Science and Engineering, 9, 90
- Jackson et al. (2019) Jackson R. A., Martin G., Kaviraj S., Laigle C., Devriendt J. E. G., Dubois Y., Pichon C., 2019, MNRAS, 489, 4679
- Kennicutt (1998) Kennicutt Jr. R. C., 1998, The Astrophysical Journal, 498, 541
- Kennicutt & De Los Reyes (2021) Kennicutt Robert C. J., De Los Reyes M. A. C., 2021, ApJ, 908, 61
- Kennicutt & Evans (2012) Kennicutt R. C., Evans N. J., 2012, ARA&A, 50, 531
- Knollmann & Knebe (2009) Knollmann S. R., Knebe A., 2009, Astrophysical Journal, Supplement Series, 182, 608
- Kriek et al. (2010) Kriek M., et al., 2010, The Astrophysical Journal Letters, 722, 64
- Krumholz & Gnedin (2011) Krumholz M. R., Gnedin N. Y., 2011, Astrophys. J., 729, 36
- Krumholz et al. (2008) Krumholz M. R., McKee C. F., Tumlinson J., 2008, Astrophys. J., 689, 865
- Krumholz et al. (2012) Krumholz M. R., Dekel A., McKee C. F., 2012, ApJ, 745, 69
- Lapiner et al. (2023) Lapiner S., et al., 2023, MNRAS, 522, 4515
- Lee et al. (2015) Lee N., et al., 2015, ApJ, 801, 80
- Leroy et al. (2008) Leroy A. K., Walter F., Brinks E., Bigiel F., de Blok W. J. G., Madore B., Thornley M. D., 2008, AJ, 136, 2782
- Leroy et al. (2021) Leroy A. K., et al., 2021, ApJS, 257, 43
- Leslie et al. (2020) Leslie S. K., et al., 2020, ApJ, 899, 58
- Lewis et al. (2000) Lewis A., Challinor A., Lasenby A., 2000, The Astrophysical Journal, 538, 473
- Lewis et al. (2011) Lewis A., Challinor A., Hanson D., 2011, Journal of Cosmology and Astroparticle Physics, 2011
- Li et al. (2023) Li Y. A., Ho L. C., Shangguan J., 2023, arXiv e-prints, p. arXiv:2307.13462
- Lotz et al. (2008) Lotz J. M., Jonsson P., Cox T. J., Primack J. R., 2008, MNRAS, 391, 1137
- Ma et al. (2018a) Ma X., et al., 2018a, Monthly Notices of the Royal Astronomical Society, 477, 219
- Ma et al. (2018b) Ma X., et al., 2018b, Monthly Notices of the Royal Astronomical Society, 478, 1694
- McKee & Krumholz (2010) McKee C. F., Krumholz M. R., 2010, Astrophys. J., 709, 308
- Michiyama et al. (2016) Michiyama T., et al., 2016, PASJ, 68, 96
- Moreno (2012) Moreno J., 2012, MNRAS, 419, 411
- Moreno et al. (2013) Moreno J., Bluck A. F. L., Ellison S. L., Patton D. R., Torrey P., Moster B. P., 2013, MNRAS, 436, 1765
- Moreno et al. (2015) Moreno J., Torrey P., Ellison S. L., Patton D. R., Bluck A. F. L., Bansal G., Hernquist L., 2015, MNRAS, 448, 1107
- Moreno et al. (2019) Moreno J., et al., 2019, MNRAS, 485, 1320
- Moreno et al. (2021) Moreno J., et al., 2021, MNRAS, 503, 3113
- Muratov et al. (2015) Muratov A. L., Kereš D., Faucher-Giguère C.-A., Hopkins P. F., Quataert E., Murray N., 2015, MNRAS, 454, 2691
- Noeske et al. (2007) Noeske K. G., et al., 2007, ApJ, 660, L43
- Orr et al. (2018) Orr M. E., et al., 2018, Monthly Notices of the Royal Astronomical Society, 478, 3653
- Orr et al. (2021) Orr M. E., et al., 2021, ApJ, 908, L31
- Östlin et al. (2014) Östlin G., et al., 2014, ApJ, 797, 11
- Pan et al. (2018) Pan H.-A., et al., 2018, ApJ, 868, 132
- Pandya et al. (2021) Pandya V., et al., 2021, MNRAS, 508, 2979
- Patton et al. (2013) Patton D. R., Torrey P., Ellison S. L., Mendel J. T., Scudder J. M., 2013, MNRAS, 433, L59
- Patton et al. (2016) Patton D. R., Qamar F. D., Ellison S. L., Bluck A. F. L., Simard L., Mendel J. T., Moreno J., Torrey P., 2016, MNRAS, 461, 2589
- Patton et al. (2020) Patton D. R., et al., 2020, MNRAS, 494, 4969
- Pawlik et al. (2018) Pawlik M. M., et al., 2018, MNRAS, 477, 1708
- Pearson et al. (2019) Pearson W. J., et al., 2019, A&A, 631, A51
- Pereira-Santaella et al. (2021) Pereira-Santaella M., et al., 2021, A&A, 651, A42
- Price et al. (2017) Price S. H., Kriek M., Feldmann R., Quataert E., Hopkins P. F., Faucher-Giguère C.-A., Kereš D., Barro G., 2017, ApJ, 844, L6
- Puschnig et al. (2023) Puschnig J., et al., 2023, MNRAS, 524, 3913
- Renaud et al. (2014) Renaud F., Bournaud F., Kraljic K., Duc P. A., 2014, MNRAS, 442, L33
- Renaud et al. (2019) Renaud F., Bournaud F., Agertz O., Kraljic K., Schinnerer E., Bolatto A., Daddi E., Hughes A., 2019, A&A, 625, A65
- Rinaldi et al. (2022) Rinaldi P., Caputi K. I., van Mierlo S. E., Ashby M. L. N., Caminha G. B., Iani E., 2022, ApJ, 930, 128
- Rodighiero et al. (2011) Rodighiero G., et al., 2011, ApJ, 739, L40
- Rodríguez Montero et al. (2019) Rodríguez Montero F., Davé R., Wild V., Anglés-Alcázar D., Narayanan D., 2019, MNRAS, 490, 2139
- Rohr et al. (2022) Rohr E., et al., 2022, MNRAS, 510, 3967
- Safronov (1960) Safronov V. S., 1960, Annales d’Astrophysique, 23, 979
- Saintonge et al. (2011a) Saintonge A., et al., 2011a, MNRAS, 415, 32
- Saintonge et al. (2011b) Saintonge A., et al., 2011b, MNRAS, 415, 61
- Salim et al. (2007) Salim S., et al., 2007, ApJS, 173, 267
- Sanders & Mirabel (1996) Sanders D. B., Mirabel I. F., 1996, ARA&A, 34, 749
- Sargent et al. (2012) Sargent M. T., Béthermin M., Daddi E., Elbaz D., 2012, The Astrophysical Journal Letters, 747, 31
- Sargent et al. (2014) Sargent M. T., et al., 2014, Astrophysical Journal, 793, 19
- Schmidt (1959) Schmidt M., 1959, The Astrophysical Journal, 129, 243
- Schreiber et al. (2015) Schreiber C., et al., 2015, A&A, 575, A74
- Scoville et al. (2016) Scoville N., et al., 2016, The Astrophysical Journal, 820, 83
- Scoville et al. (2017) Scoville N., et al., 2017, The Astrophysical Journal, 837, 150
- Segovia Otero et al. (2022) Segovia Otero Á., Renaud F., Agertz O., 2022, arXiv e-prints, p. arXiv:2206.08379
- Shah et al. (2020) Shah E. A., et al., 2020, ApJ, 904, 107
- Silverman et al. (2015) Silverman J. D., et al., 2015, Astrophysical Journal Letters, 812
- Silverman et al. (2018) Silverman J. D., et al., 2018, The Astrophysical Journal, 867, 92
- Smercina et al. (2022) Smercina A., et al., 2022, ApJ, 929, 154
- Sofue et al. (1993) Sofue Y., Wakamatsu K.-I., Taniguchi Y., Nakai N., 1993, PASJ, 45, 43
- Solomon & Sage (1988) Solomon P. M., Sage L. J., 1988, ApJ, 334, 613
- Sparre & Springel (2016) Sparre M., Springel V., 2016, MNRAS, 462, 2418
- Sparre et al. (2017) Sparre M., Hayward C. C., Feldmann R., Faucher-Giguère C.-A., Muratov A. L., Kereš D., Hopkins P. F., 2017, MNRAS, 466, 88
- Speagle et al. (2014) Speagle J. S., Steinhardt C. L., Capak P. L., Silverman J. D., 2014, ApJS, 214, 15
- Springel (2005) Springel V., 2005, The cosmological simulation code GADGET-2, doi:10.1111/j.1365-2966.2005.09655.x
- Stinson et al. (2007) Stinson G. S., Dalcanton J. J., Quinn T., Kaufmann T., Wadsley J., 2007, ApJ, 667, 170
- Suess et al. (2019) Suess K. A., Kriek M., Price S. H., Barro G., 2019, The Astrophysical Journal, 877, 103
- Tacchella et al. (2016) Tacchella S., Dekel A., Carollo C. M., Ceverino D., DeGraf C., Lapiner S., Mandelker N., Primack Joel R., 2016, MNRAS, 457, 2790
- Tacconi et al. (2018) Tacconi L. J., et al., 2018, The Astrophysical Journal, 853, 179
- Tacconi et al. (2020) Tacconi L. J., Genzel R., Sternberg A., 2020, ARA&A, 58, 157
- Toomre (1964) Toomre A., 1964, ApJ, 139, 1217
- Violino et al. (2018) Violino G., Ellison S. L., Sargent M., Coppin K. E. K., Scudder J. M., Mendel T. J., Saintonge A., 2018, MNRAS, 476, 2591
- Vogelsberger et al. (2014) Vogelsberger M., et al., 2014, Monthly Notices of the Royal Astronomical Society
- Wetzel et al. (2016) Wetzel A. R., Hopkins P. F., Kim J.-h., Faucher-Giguere C.-A., Keres D., Quataert E., 2016, The Astrophysical Journal
- Whitaker et al. (2012) Whitaker K. E., van Dokkum P. G., Brammer G., Franx M., 2012, ApJ, 754, L29
- Wilkinson et al. (2018) Wilkinson C. L., Pimbblet K. A., Stott J. P., Few C. G., Gibson B. K., 2018, MNRAS, 479, 758
- Wilkinson et al. (2022) Wilkinson S., Ellison S. L., Bottrell C., Bickley R. W., Gwyn S., Cuillandre J.-C., Wild V., 2022, MNRAS, 516, 4354
- Zabludoff et al. (1996) Zabludoff A. I., Zaritsky D., Lin H., Tucker D., Hashimoto Y., Shectman S. A., Oemler A., Kirshner R. P., 1996, ApJ, 466, 104
- Zolotov et al. (2015) Zolotov A., et al., 2015, MNRAS, 450, 2327
Appendix A Difference in the evolution of interacting and non-interacting SB galaxies
In this section, we investigate the different behaviour of interacting and non-interacting SB galaxies before and after the beginning of SB event, expanding what explored in Section 3.5 on the role of interactions in driving SBs. Figure 19 shows the median evolution of both the fraction of molecular gas () and fraction of high-density gas that is eligible for star formation in our model () in interacting (top panel; INT-SB sample) and non-interacting (bottom panel; NI-SB sample) SB galaxies, for a time period of centred around the beginning of the SB. The blue and red dashed curves represent the median trends for all (i.e., irrespective of whether they are interacting or non-interacting) SB and control galaxies, respectively, parameterised by their , i.e., connecting the median values for SB and control galaxies in this plane in different mass bins. In general, by moving towards the SB sequence, SB galaxies increase both their and , as previously noted in Section 3.3. NI-SB galaxies evolve from the control sequence to the SB sequence in the prior to the beginning of the SB event. Conversely, INT-SB galaxies at prior to the SB are offset from the control sequence by dex, for increasing stellar mass, exhibiting higher median and . The same behaviour is also visible in the after the SB. Hence, interactions in galaxies can drive SBs only if these are already in excess of high-density and molecular gas, compared to control galaxies. This result combined with the increasing fraction of INT-SB galaxies with stellar mass (see Figure 12) results in the trends observed in Figure 8, where massive () and hence likely interacting SB galaxies, exhibit large median values of and at prior to and after the SB, compared to control galaxies.
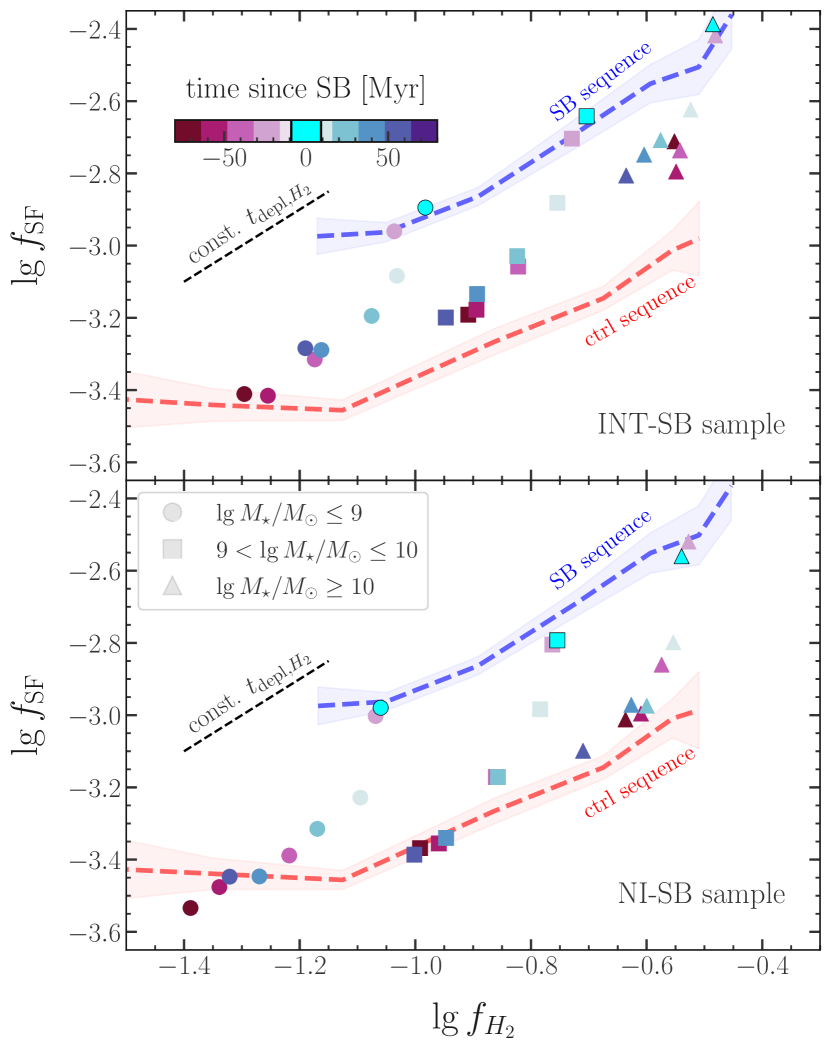
Figure 20,shows the median evolution of the total (all phases) gas mass within the central kpc () and within the galaxy radius (i.e., within ; ) in interacting (top panel; INT-SB sample) and non-interacting (bottom panel; NI-SB sample) SB galaxies, for a time period of centred around the beginning of the SB. As in Figure 19, the blue and red dashed curves represent the median trends for all SB and control galaxies, respectively, parameterised by their . In general, INT-SB galaxies have a median that is larger by dex than the median values for NI-SB galaxies. Interactions are therefore slightly more effective in driving SBs in galaxies with an already relatively large amount of gas concentrated in their central regions, whereas NI-SB galaxies can experience larger fluctuations in . Combining this result with the dependency of the fraction of INT-SB galaxies on stellar mass we can recover the behaviour in Figure 10.