Uncertainties too large to predict tipping times of major Earth system components
Abstract
Observations are increasingly used to detect critical slowing down (CSD) in potentially multistable components of the Earth system in order to warn of forthcoming critical transitions in these components. In addition, it has been suggested to use the statistical changes in these historical observations to extrapolate into the future and predict the tipping time. Here we argue that this extrapolation is too sensitive to uncertainties to give robust results. In particular, we raise concerns regarding (1) the modelling assumptions underlying the approaches to extrapolate results obtained from analyzing historical data into the future, (2) the representativeness of individual time series representing the variability of the respective Earth system components, and (3) the effect of uncertainties and preprocessing of the employed observational datasets, with focus on non-stationary observational coverage and the way gaps are filled. We explore these uncertainties both qualitatively and quantitatively for the Atlantic Meridional Overturning Circulation (AMOC). We argue that even under the assumption that these natural systems have a tipping point that they are getting closer to, the different uncertainties are too large to be able to estimate the time of tipping based on extrapolation from historical data.
Introduction
In recent years there has been increasing focus on Earth system components that can potentially undergo abrupt transitions in response to anthropogenic forcing. In particular, research has focused on so-called "tipping elements", which are systems that have been suggested to exhibit bistability, implying they could abruptly transition between multiple stable equilibrium states when a critical forcing threshold is passed (Mckay et al., 2022, Boers et al., 2022). Such systems are, for example, the Amazon rainforest, the Antarctic ice sheets, the Greenland ice sheet (GIS), or the Atlantic Meridional Overturning Circulation (AMOC). The collapse of these tipping elements would have severe impacts on the climate from local to regional scales, and their research is thus of high priority. However, both the probability of tipping and the degree of warming under which it might happen remain highly uncertain for these tipping elements (IPCC, 2022, Wang et al., 2023). This is in part due to the lack of such abrupt transitions in the recent observational records, and in part due to the difficulty of modelling such non-linear systems using comprehensive coupled climate models. However, paleoclimate evidence suggests that abrupt transitions in the climate system have occurred in the longer-term past (Boers et al., 2022).
Despite the lack of critical transitions in the observational record, historical observations can still be used to inform us on the changes in stability of Earth system components. When changes in forcing lead multistable systems to approach a transition to a different state, they typically exhibit so-called critical slowing down (CSD), in which their response to perturbations changes in a characteristic manner (Dakos et al., 2008). Statistical changes indicating CSD have been identified in many systems, including the GIS (Boers and Rypdal, 2021), the AMOC (Boers, 2021, Michel et al., 2022), the Amazon rainforest, (Boulton et al., 2022), as well as other parts of global vegetation (Smith et al., 2022b, a). As CSD occurs when a system is becoming less stable and approaching a critical transition, the identification of these changes can be seen as a warning of approaching transitions, and so they are often called early warning signals (EWS) (Scheffer et al., 2009).
It may seem natural to take an extra step and use the statistical changes in historical data not only to show an ongoing destabilization, but also to extrapolate into the future and predict a time of tipping. For example, Ditlevsen & Ditlevsen 2023 (Ditlevsen and Ditlevsen (2023), hereafter DD23) recently predicted that the AMOC would tip around mid-century. They introduced a novel and sophisticated maximum likelihood estimator (MLE) based approach to predict the tipping time and applied it to a sea-surface temperature (SST) based fingerprint of the AMOC. Whilst such approaches are theoretically interesting, their robustness to extrapolate tipping times has come under question.
Though the utility of such predictions, if robust, would be undeniable, the problem lies in the multiple levels of uncertainty inherent to such extrapolations from historical data. In this work, we focus on the example of DD23’s prediction for the AMOC tipping time to demonstrate the effects of three types of uncertainties: (1) the modelling assumptions underlying DD23’s MLE method, (2) the representativeness of the SST fingerprint for the AMOC, and (3) the effect of uncertainties and preprocessing in SST datasets, with focus on non-stationary observational coverage and the way gaps are filled (Ben-Yami et al., 2023). Whilst it is impossible to fully quantify these uncertainties, we use DD23’s MLE-based method to give quantitative examples of how the different factors influence the predicted tipping time. Although the quantitative results of this work are specific to the AMOC, these types of uncertainties will be present in any attempt to extrapolate a future tipping time from historical data.
We note that Boers & Rypdal 2021 (Boers and Rypdal (2021), hereafter BR21) found that parts of the central-western Greenland ice sheet may have already passed its critical threshold. BR21 reconstructed the regional height changes from ice-core-derived melt rate data from the Jakobasvn Isbrae glacier (Trusel et al., 2018) and derived the potential landscape of the ice-sheet height by fitting a previously introduced non-linear model (Levermann and Winkelmann, 2016) to the reconstructions. While the critical slowing down detected in the fluctuations around the fixed point of the fitted model suggests that the stability of the central-western Greenland ice sheet has been declining, one might be tempted to interpret the position of the bifurcation point of the fitted model (red vertical dashed line in Fig. 3 of BR21) as a sign that the critical threshold in terms of regional air temperatures may have already been crossed in the last years. However, this latter point is subject to large uncertainties stemming from the simplifying model assumptions and the height reconstructions based on annual ice-core derived melt rates. The estimated bifurcation point of the simple model should thus not be understood as an estimate of the actual critical threshold in regional air temperatures and should certainly not be translated into a time of tipping Boers and Rypdal (2021).
Modelling assumptions
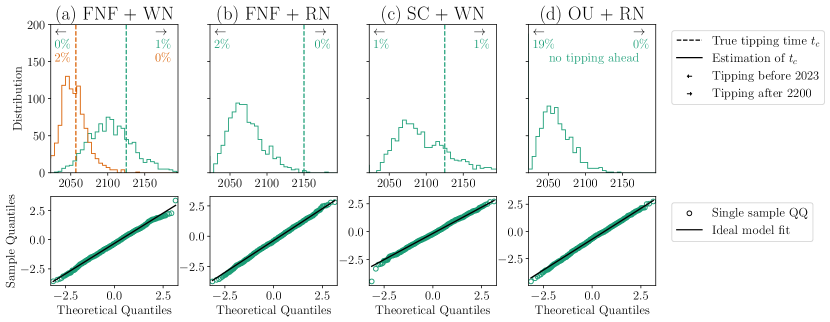
DD23 present a novel, innovative and statistically optimal approach for the extrapolation of the time of AMOC tipping via maximum-likelihood methods (for details, see Ditlevsen and Ditlevsen (2023)). This approach explicitly builds on the assumption that the AMOC is well-modelled as a one-dimensional system undergoing a fold bifurcation in normal form, forced by white Gaussian noise. DD23 give a confidence interval of their assessment of the AMOC tipping time using parametric bootstrapping on the aforementioned model. However, the uncertainties associated with the mechanistic simplification of the system have not been investigated. We find that for a selection of established conceptual AMOC models, the estimation of the time of tipping is biased toward earlier times and, in some cases, constitutes a false alarm.
Suitability of the normal-form fold bifurcation model. There has long been a discussion about whether the AMOC, when investigated as a complex system under external forcing of e.g. global mean temperature (but better regional freshwater forcing), exhibits multiple stable states (Stommel, 1961, Rahmstorf et al., 2005, Lohmann et al., 2023). Transitions between such stable states could be bifurcation-induced, and thus abrupt and irreversible. The so-called fold bifurcation constitutes a minimal example of such behaviour. For instance, the conceptual Stommel-Cessi model of the AMOC features a fold bifurcation (Cessi, 1994). Taking this reasoning another step further, DD23 propose that the one-dimensional observable of AMOC strength is well represented by the following model:
where is the external control parameter.
They argue this by remarking that all fold bifurcations are topologically equivalent to this model. This, however, is only true locally, in potentially very close proximity to the bifurcation point, while the proposed estimation method banks on the assumption that it would hold in arbitrary distance to the bifurcation point. Based on the arguments brought forth, we do not see a direct constraint on the dynamics away from the tipping point. DD23 further motivate the model choice by arguing for a good fit of model data from (Rahmstorf et al., 2005) with respect to the posited square root behaviour of . Given that the fitting constraints on the square root curves are weak, allowing for "noise-induced tipping" at any point along the curve, this good fit, which is not quantified, might be expected. We also note that these visual fits are based on a comparably old collection of simulations, and the square root fit does not seem to hold for more recent model data (see Figure 4 in (Lohmann et al., 2023)). When performing the same estimation of tipping time according to DD23 on data of the closely related Stommel-Cessi AMOC model, one obtains a considerable bias in tipping time estimates towards earlier times (Figure 1(c)). This should be seen as an indication that even models with an underlying fold bifurcation structure, yet not following the very specific normal form model equation above, produce time series which, when applying the method of DD23, yield biased tipping time estimates.
Linearity of forcing. DD23 introduce the notion of a multistable AMOC forced by a single linearly increasing external control parameter . We argue that this does not give a complete picture of anthropogenic forcings and their effects. Human-induced global warming is not the only significant factor altering the conditions supporting the AMOC. Several studies show that radiative anomalies due to aerosol pollution likely attenuated the AMOC weakening of the past decades (Hassan et al., 2021, Menary et al., 2020). Such time-varying influences cannot be represented by a linearly evolving control parameter. Moreover, the GMT forcing itself influences the AMOC due to many different, nonlinear mechanisms, e.g. via thermal expansion, a strengthening hydrological cycle, sea-ice and ice sheet melt (with the influence of the latter in the historical period still under debate) (Swingedouw et al., 2022, Devilliers et al., 2021). It is, therefore, not sufficient to observe an approximately linear ramping in the logarithm of CO2 emissions to argue for linear forcing. As DD23 say, the effective freshwater flux would serve as a better forcing parameter (Rahmstorf et al., 2005, Hofmann and Rahmstorf, 2009), and there is no evidence that it would linearly depend on GMT; e.g., Greenland runoff increases nonlinearly over time (Bamber et al., 2018, Trusel et al., 2018). While the conceptual view of only one external control parameter evolving linearly towards a critical value is sufficient to describe the sign of trends in AMOC strength and associated changes in stability, we argue that it is too simplistic to allow for an estimate of the time of collapse.
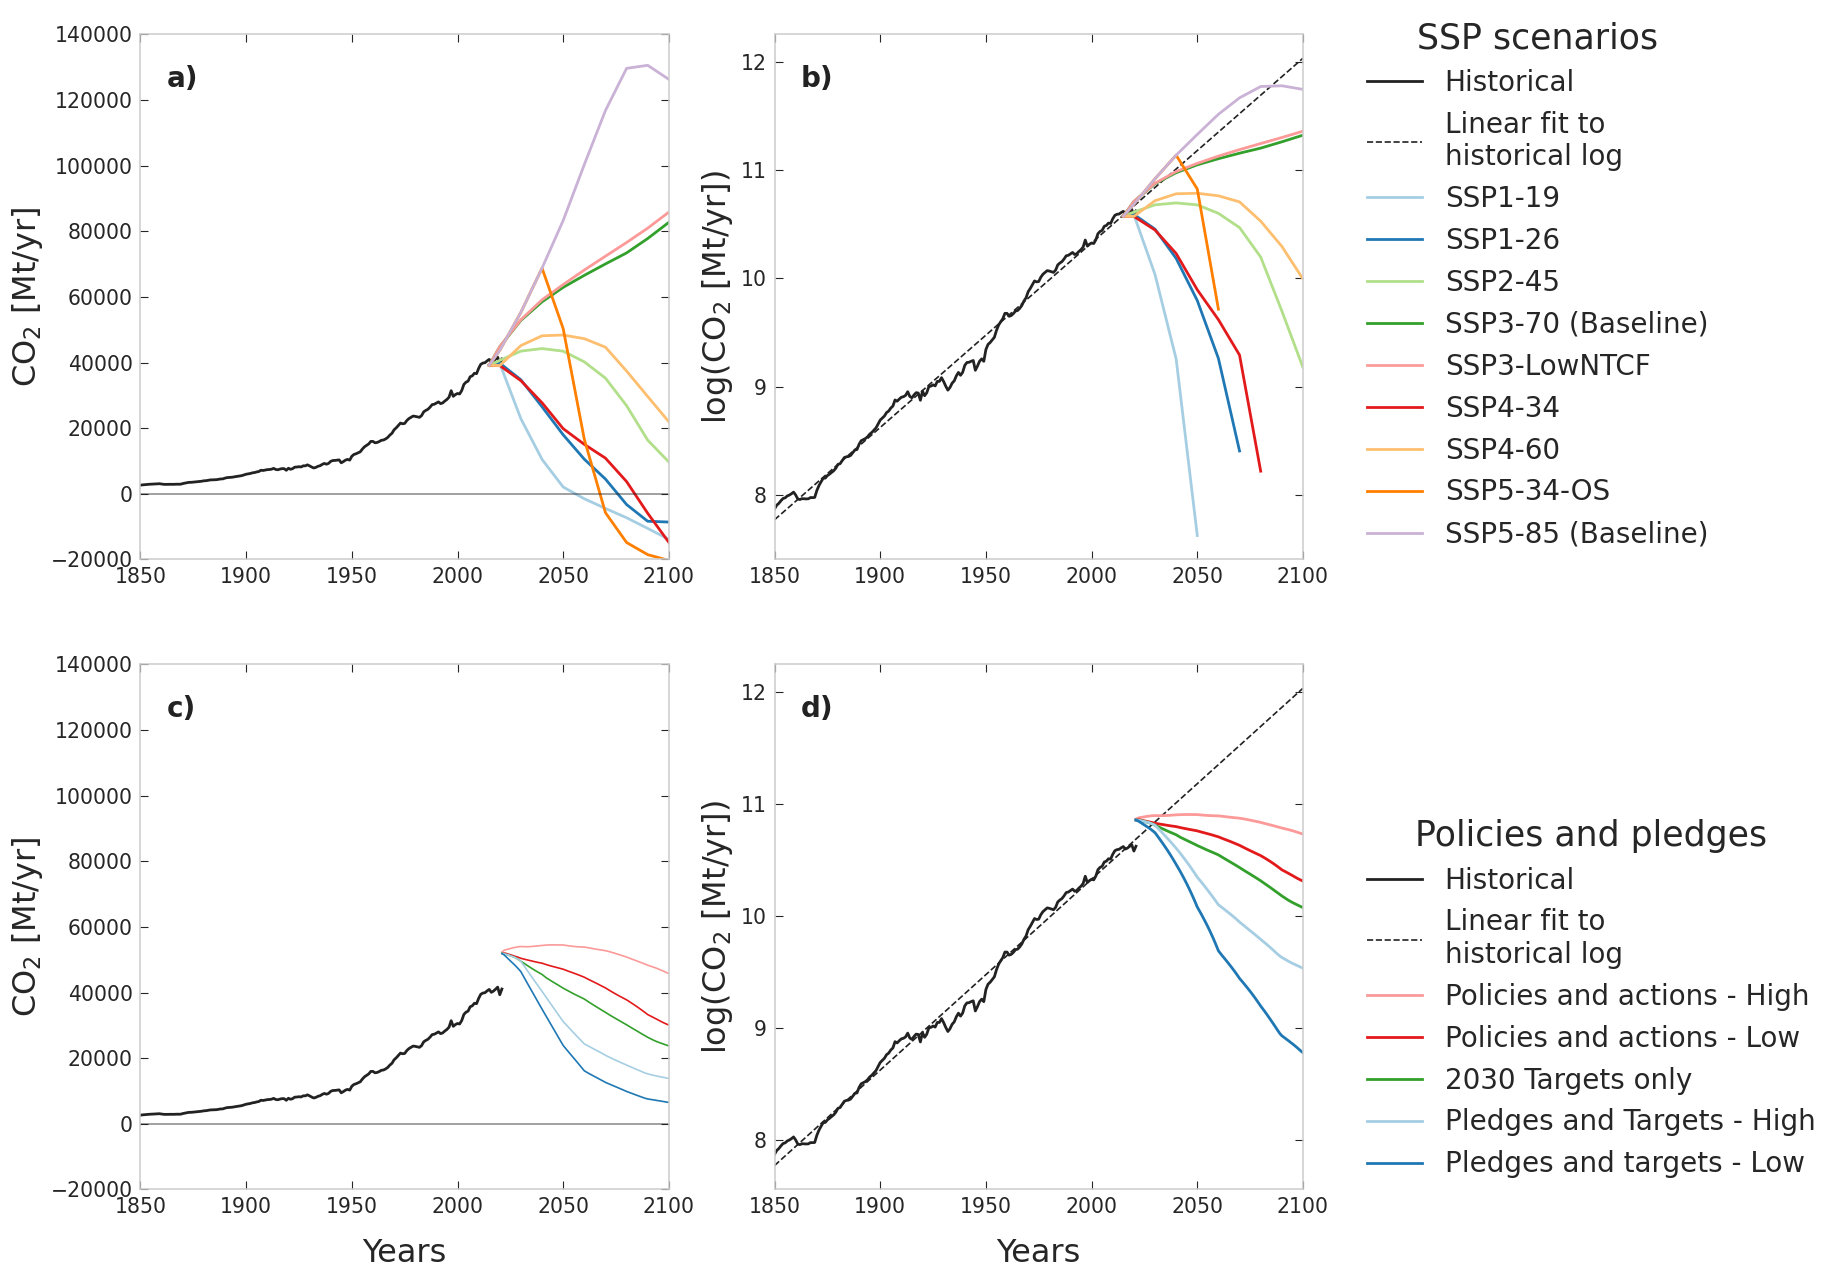
Even if the AMOC is indeed approaching a fold bifurcation, the possibility of the forcing being non-linear means any extent of bias is possible in the estimation of tipping time, as extrapolation would be unwarranted. This is particularly relevant with respect to the future evolution of the control parameter in case of the AMOC, since the only scenario under which log(CO2) would continue to increase linearly is the extreme SSP5.85 (Figure S1); a scenario in which there is not only no climate mitigation but also a rapidly growing fossil fuel-based economy (Riahi et al., 2017).
Time scales, internal variability, and assumptions on the noise. The AMOC is known to exhibit pronounced internal variability (Latif et al., 2022) that is, in contrast to DD23’s assumption, not well-represented by white noise. To address the issue of non-stationary, non-white forcing for CSD analysis, the restoring rate was estimated in Boers (2021) in a way that is robust against changes in the correlation strength of the driving noise. Moreover, the AMOC exhibits decadal internal variability that is also not represented by DD23’s assumption of white noise forcing. Before the commencing of the destabilisation at time , DD23 assume the AMOC to resemble paths of a stationary stochastic process defined by
where is the external control parameter and is a time scale parameter. They estimate a value of , corresponding to a characteristic correlation time of . In contrast, frequency spectra of AMOC evolutions in General Circulation Models (GCMs) show strongest variability around years (Figure 6 in Medhaug and Furevik (2011)). Such pronounced additional variability on long time scales is not captured by the above Ornstein-Uhlenbeck model. Internal variability independent from the model noise will thus cause large excursions from the transient mean. The proposed method is not equipped to incorporate the impact of these excursions on the estimated tipping time, since they may be misinterpreted as trends towards a tipping point (Figure 1(d)).
Moreover, for quantitative extrapolations as attempted by DD23, any simplifying assumptions on the driving noise would need to be carefully checked. Since disturbances to the equilibrium state are themselves of atmospheric and oceanic origin, time-correlation of the noise should be taken into consideration, e.g. via a red noise model (Boers, 2021). Non-stationary red noise present in the system can incur substantial biases in the estimation of the tipping time and even result in false alarms of an approaching bifurcation (Figure 1(b) and (d)).
Representativeness of the SPG index for AMOC
The above modelling uncertainties arise when one assumes that the time series used by DD23 is a direct representation of the AMOC. DD23 use an AMOC fingerprint based on the sea-surface temperatures (SSTs) in the sub-polar gyre (SPG). This fingerprint is based on the assumption that the so-called "warming hole" in the North Atlantic, an area which is cooling as opposed to the global warming trend detected essentially everywhere else, is caused by a weakening of the AMOC (Rahmstorf et al., 2015, Drijfhout et al., 2012, Menary and Wood, 2018, Liu et al., 2020). The fingerprint itself (defined as the SSTs averaged over the SPG area minus the global SST mean, hereafter SPG index) has been supported by two lines of evidence: first, across models the historical trends in the SPG index in CMIP6 models correlate with the trends in the AMOC stream-function (at various latitudes) (Caesar et al., 2018, Menary et al., 2020); second, the SPG index time series itself is correlated with the AMOC streamfunction time series at various lag times (depending on the study either the maximum of the streamfunction is taken, or its value at different latitudes) (Rahmstorf et al., 2015, Jackson and Wood, 2018, Zhu et al., 2023, Little et al., 2020). However, both these correlations have been shown to be highly non-stationary, and are sensitive to the time period, to the forcing scenario and to the underlying processes (Little et al., 2020, Jackson and Wood, 2018). This is likely due to the fact that the warming hole is not driven solely by the AMOC, but is a result of both changes in ocean heat transport and changes in atmospheric forcing (Li et al., 2022, He et al., 2022, Ferster et al., 2022, Ghosh et al., 2022). This partial connection of the SPG to the AMOC is supported by recent studies using the Overturning in the Subpolar North Atlantic Program (OSNAP), which have shown that the Labrador Sea and the SPG play a smaller role in North-Atlantic deep water formation than previously thought (Lozier et al., 2019, Chafik et al., 2022).
The non-stationarity of the correlation between AMOC streamfunction and the SPG index does not imply that the SPG index is not useful for studying the stability of the AMOC, as the SPG still plays a crucial role in the AMOC and would thus be sensitive to its stability changes (Swingedouw et al., 2022, Menary et al., 2015, Sun et al., 2021). Signs of CSD in the SPG thus still likely indicate a destabilization of the AMOC. However, the non-stationarity of the fingerprint does reduce its usefulness for exact predictions such as those done by DD23. We think that for predictive purposes, including those based on extrapolation, it is problematic to fit a simple bifurcation model representing the AMOC to a fingerprint whose correlation with the AMOC changes over the time period under consideration.
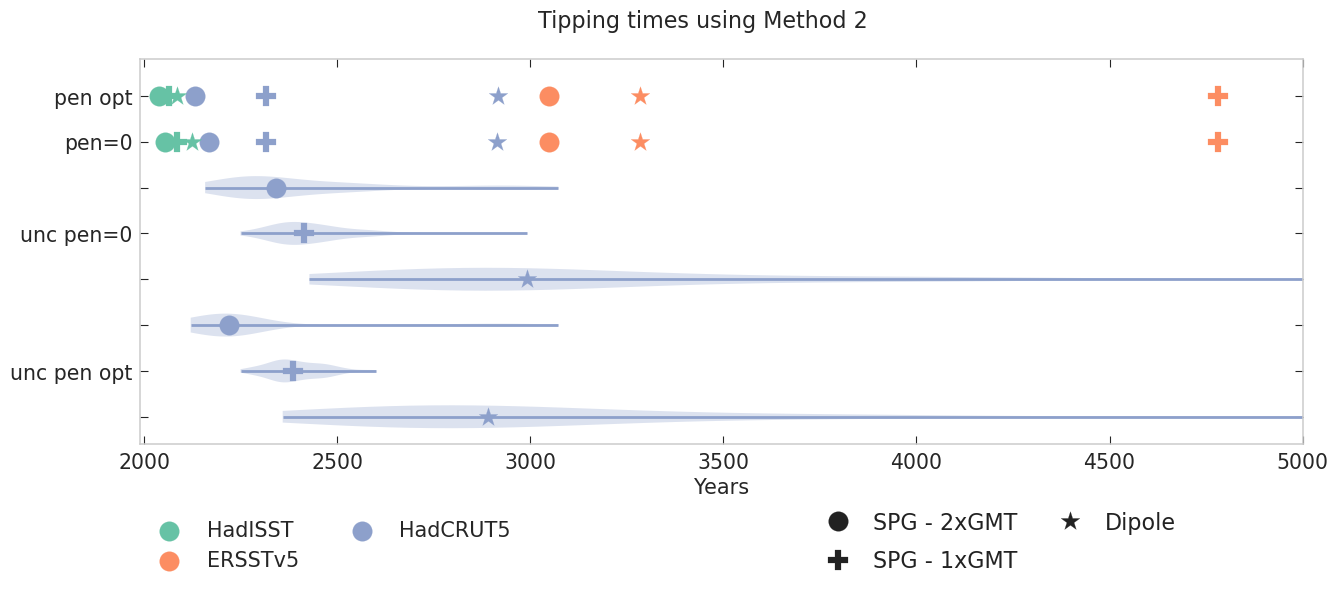
To obtain a better representation of the AMOC, different proposed fingerprints should be compared. The uncertainty in fitting a model to the SPG index alone can then be inferred by comparing the results of the CSD analysis and extrapolation for the different fingerprints. There is a long list of identified AMOC fingerprints in the literature, many of them as robust and commonly used as the SPG index (Jackson and Wood, 2020, Zhu et al., 2023). When one applies the same analysis as DD23 to one of these other fingerprints, the so-called dipole fingerprint (Roberts et al., 2013), the estimated tipping time varies considerably, and sometimes even goes to infinity (Figure 3 and Tables S2 and S1). As there is currently no reason to believe that one of these fingerprints represents the AMOC better than any other, this spread in the estimated tipping time shows that there is substantial uncertainty in such an estimation.
It should also be noted that there has been increasing evidence for the SPG as a potential tipping point separate from the AMOC (Sgubin et al., 2017, Swingedouw et al., 2021, McKay et al., 2022). Although this SPG collapse occurs only in some coupled climate models under future warming scenarios, these models are in fact amongst the best in representing the stratification in the SPG (Sgubin et al., 2017, Swingedouw et al., 2021). We cannot, therefore, disregard the possibility that CSD in the SPG index is in reality an indication of an approaching SPG tipping point and not an AMOC tipping point. The only way to avoid this uncertainty is to include additional AMOC fingerprints which do not rely on SPG SSTs (Boers, 2021).
Effect of dataset preprocessing and underlying uncertainties / non-stationary coverage
In addition to the uncertainties arising from the modelling approach and the choice of AMOC fingerprint, there are also substantial uncertainties in CSD indicators that originate in the dataset preprocessing steps and in the non-stationarity of SST data coverage (Ben-Yami et al., 2023). The number of SST observations has increased exponentially since 1850, and in earlier times the spatial coverage was highly inhomogeneous. This is dealt with in observational datasets in one of two ways: either the monthly grid cells without observations are left empty, or some method is used to fill the gaps. Both of these approaches can affect the statistics of the data: in the former, averaging more datapoints in later times artificially reduces the variance, and in the latter the infilling method can affect the statistics by e.g. artificially smoothing earlier times.
DD23 use the HadISST1 dataset, which has been infilled using reduced space optimal interpolation (RSOI) (Rayner et al., 2003). RSOI uses a set of global empirical orthogonal functions (EOFs), and includes regularizing terms when fitting the EOFs to the data. This is done to avoid spurious large amplitudes in data-scarce regions and times, but means that the fit tends to the zero anomaly where there is no information. Although non-interpolated in-situ data is subsequently added to the RSOI reconstruction, this only improves the variance where there is enough data - in data-scarce times and regions the variability is damped by RSOI. Together with other steps of the preprocessing, this causes the variance in HadISST1 to artificially increase (see Rayner et al. (2003), Ben-Yami et al. (2023)).
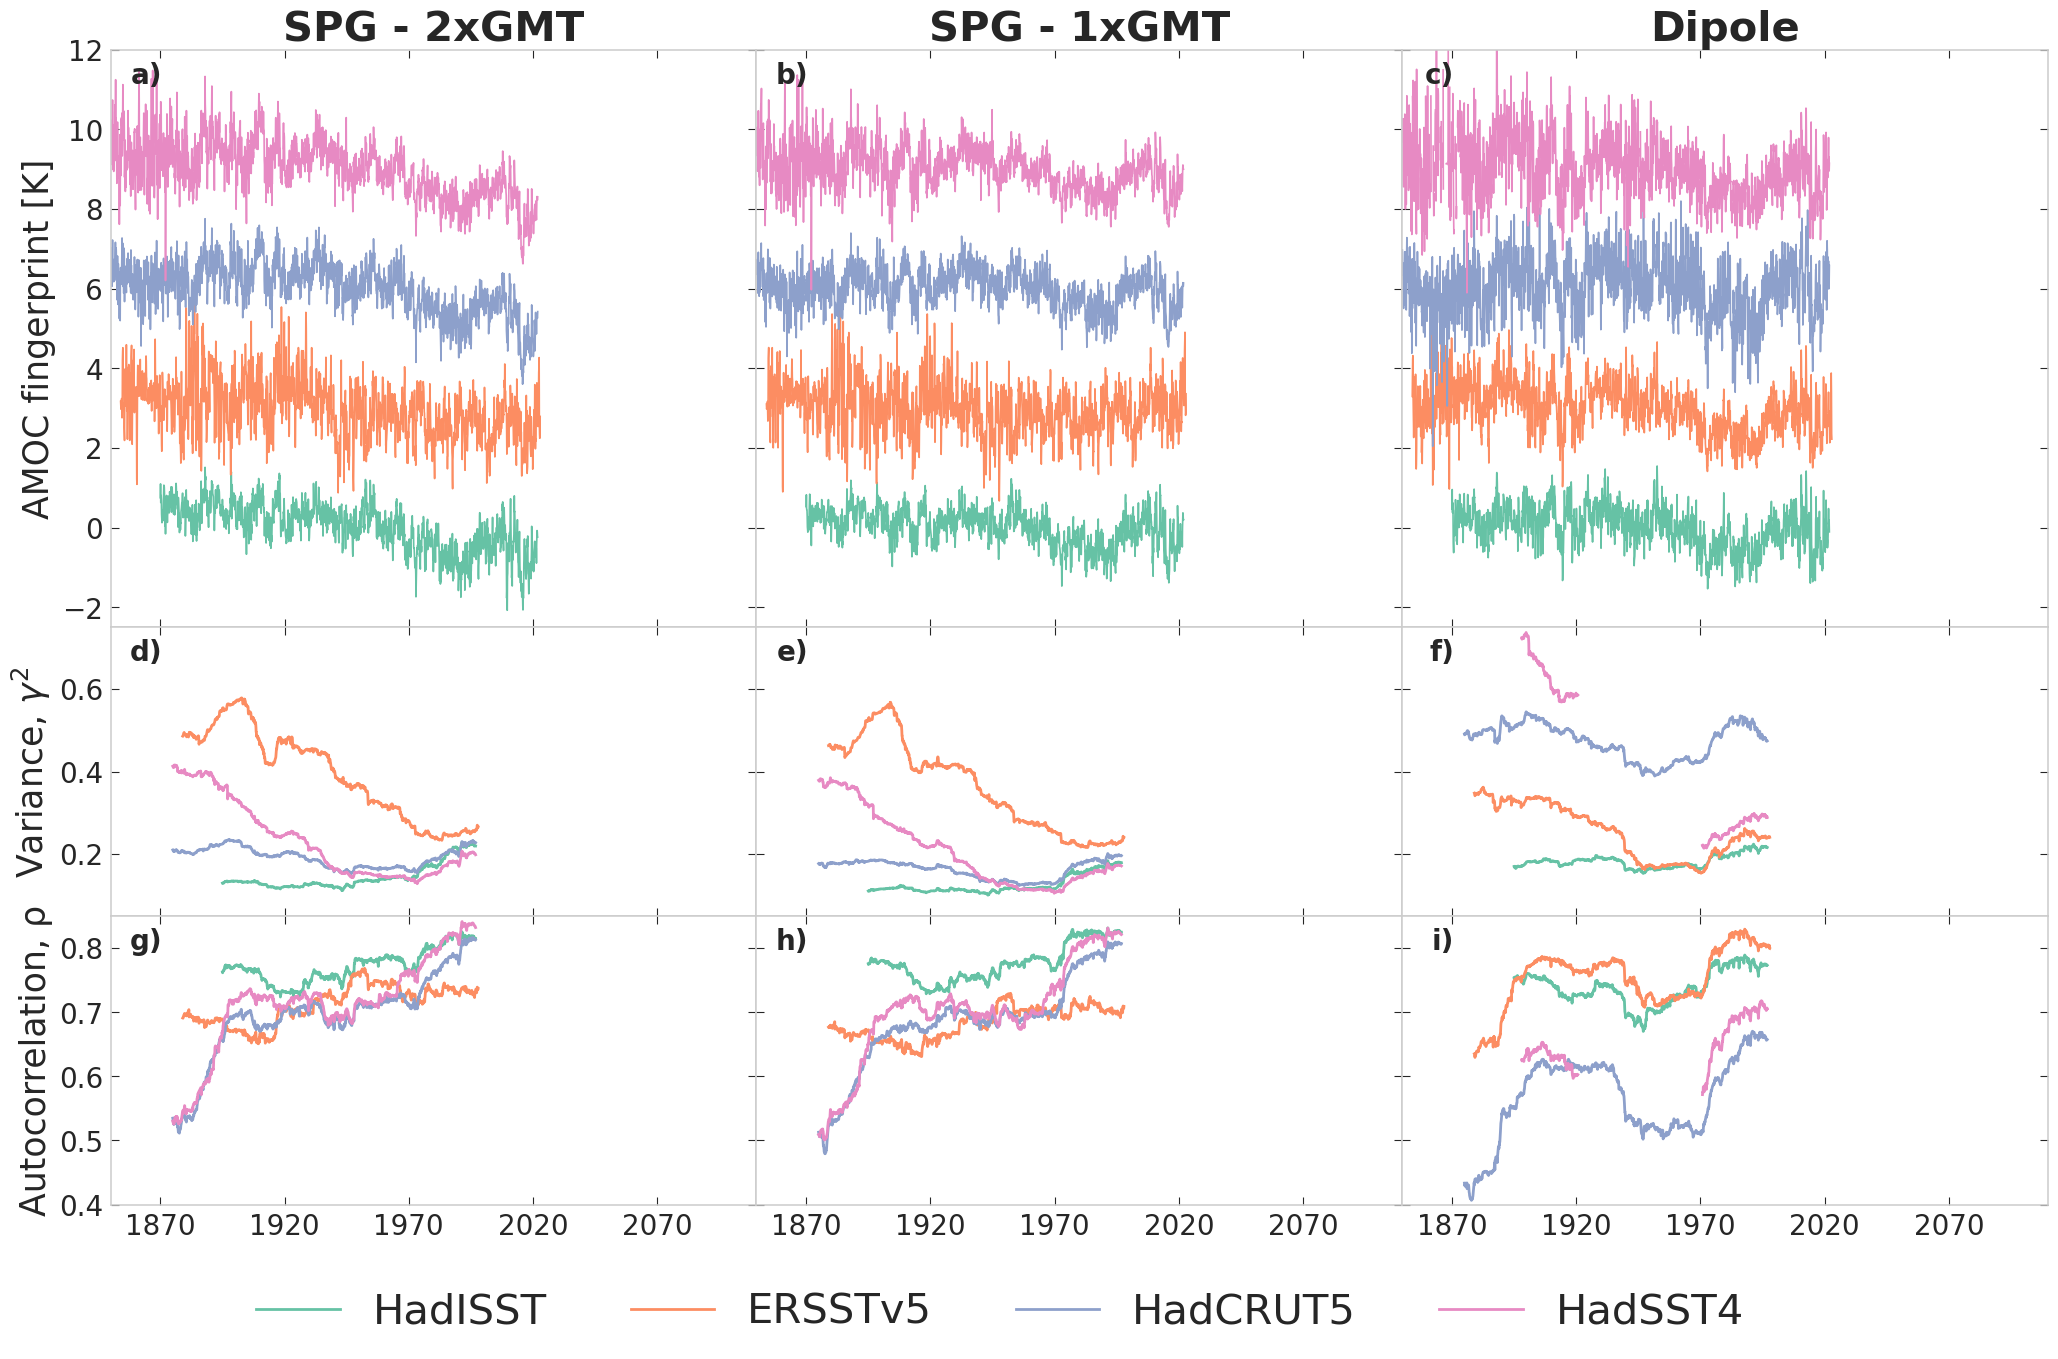
We first calculate the same AMOC fingerprint that DD23 use from four SST datasets: the infilled HadISST1 (Rayner et al., 2003), the non-infilled HadSST4 (Kennedy et al., 2019), HadCRUT5 (Morice et al., 2021), which uses a Gaussian-process-based statistical method for infilling, and ERSSTv5 (Huang et al., 2017), which uses empirical orthogonal teleconnections for infilling. All of these methods results in different variance and autocorrelation time series (see Figure 2). The variance is especially affected by the different preprocessing methods of the different datasets - only in HadISST1 does the variance increase over the whole time period – and as noted above, this increase is at least partly artificial.
It is therefore not possible to determine the actual variance trend of north Atlantic SSTs before the 1970s. Whilst the autocorrelation and the restoring rate are arguably still functional indicators given the dataset properties (see Ben-Yami et al. (2023)), DD23’s analysis relies on the variance, and does not take these uncertainties and especially the non-stationary observational coverage and different gap filling procedures into account.
If one applies DD23’s MLE method (their “method 2”) to their AMOC fingerprint calculated from other SST datasets, using the code provided by DD23, one gets tipping times ranging from the 2000s for HadISST to the 3000s for ERSSTv5. If this analysis is extended to different AMOC fingerprints (see above), the tipping times range from the 2000s to beyond the year 4700 for ERSStv5 (Table S2). Finally, if we apply the method to HadCRUT5’s 200-member uncertainty ensemble, we get multi-milennial uncertainty ranges with for some cases almost a quarter of the tipping times going to infinity (Table S1). This shows that the fingerprint definition and the dataset choice can cause huge uncertainties.
Conclusions
With the AMOC as an example, we have discussed multiple sources of uncertainty in the prediction of future tipping times. In particular for DD23:
-
1.
The modelling assumptions underlying their approach for tipping time predictions are too simple and do not necessarily hold for the AMOC. We have shown that breaking these assumptions by e.g. changing the dynamical model for the AMOC or the model for the forcing introduces large biases in the tipping time estimation (Figure 3).
-
2.
Extrapolating statistical results obtained from historical data to predict the time of tipping, DD23 make too strong assumptions on the stationarity of past trends.
-
3.
The connection of the SST-based SPG fingerprint to the AMOC is non-stationary, and therefore is problematic for exact predictions of tipping times. Using different SST fingerprints with the HadISST dataset can change the predicted tipping time by 50 years with optimal penalization, and 70 years with no penalization (Table S2).
-
4.
The inherent uncertainties of SST datasets and the preprocessing methods used to fill in missing data can be non-stationary, and thus affect higher-order statistics such as the variance or autocorrelation. In particular, the HadISST dataset used by DD23 is known to have an artificial variance increase. Using different SST datasets and their uncertainty ensembles, the tipping time varies by thousands of years both with or without penalization, and with penalization often goes to infinity (Tables S2 and S1).
Whilst point 1 above could possibly be addressed by improvements to the prediction method, points 2, 3 and 4 are essentially impassable barriers to predicting the time of a future AMOC collapse from historical data. The available historical data is simply not accurate or precise enough to allow us to make such an extrapolation.
Unfortunately, it is inevitable that these types of uncertainties will arise when attempting to extrapolate from past historical data, more or less regardless of the system under consideration. First, simplified modelling assumptions will almost always be necessary for extrapolation, since the future behaviour of the system will be different depending on the governing dynamics. Past data can inform us about the relevant model, but typically many different models can match the data, as seen above. This is also true for the case of fitting a simplified model to reconstructed central-western Greenland ice sheet height changes in BR21. Second, the problem of finding a timeseries that accurately represents the dynamics of the system is also not exclusive to the AMOC. All tipping elements are extended three dimensional systems, and we usually only have observations for a specific part of it. In BR21 the change in ice sheet height is calculated from average annual melt rates obtained from three ice cores in central-western Greenland, and in addition to uncertainties in the underlying data that are difficult to quantify, it is highly uncertain how well this location represents the whole ice sheet (Trusel et al., 2018). For vegetation systems, we can only observe them in full through satellites, and vegetation indices such as normalized difference vegetation index (NDVI) or vegetation optical depth (VOD) may not capture nuances in vegetation dynamics that would be important for robust extrapolation, alongside known issues with data pre-processing and merging procedures (Smith et al., 2023). Finally, the problems caused by non-stationary data coverage and data-processing methods described above are not unique to SST datasets. Data-processing is always necessary to assimilate and calibrate observations and proxies especially for longer records, and these methods usually focus on the accuracy of the long term trend and not on the higher-order statistics. For vegetation systems it has recently been shown that using multi-instrument timeseries can cause biases in CSD indicators, especially for aggregated time series (Smith et al., 2022b).
However, it is important to emphasize that the criticisms in this work apply to attempts to predict the exact tipping time of tipping elements such as the AMOC based on extrapolating from uncertain data. CSD detection in terms of trends in robust indicators such as the autocorrelation or the restoring rate (Boers, 2021) is much less sensitive to the discussed uncertainties. For example, CSD is applicable to any sort of dynamical system that is approaching an abrupt transition under the assumption that it is associated with a co-dimension one bifurcation. In addition, fingerprints that are not an exact representation of a dynamical system will still show CSD as long as the stability of the subsystem they represent is connected to the stability of the overall system. Crucially, the uncertainties presented in this work can be taken into account by using multiple different fingerprints and propagating the dataset uncertainties to the CSD analysis. To understand the difference in the effect of these uncertainties for CSD detection and tipping time predictions, we can look at the AMOC. Ben-Yami et al. (2023) took into account all the dataset uncertainties described in this work, and more, and found that CSD in AMOC fingerprints in terms of a restoring rate tending toward zero, is still significant even though the trends in the CSD indicators have a large spread (for example, 40% and 14% spread in the slope of the restoring rate in the HadCRUT5 and ERSSTv5 SPG Index, respectively). But taking into account the same observational uncertainty spread for the tipping time gives times ranging from 2050 to infinity, practically making this prediction non-informative. This is because the tipping time prediction is not only more sensitive to uncertainties, but it also needs to be a lot more specific to be reliable - the assumptions made in the calculation already presume that there will be a tipping time in the future, so the predicted time needs to be precise to provide additional information. Detection of CSD does not make statements about future tipping, only about the fact that the system is currently less stable than it was in the past. In this sense, the dashed lines in Fig. 3 of Boers (2021) were only shown to demonstrate that there has been a positive linear trend in the restoring rate , interpreted as a stability decline, during the historical period investigated. It should be emphasized that these dashed lines do not represent any sort of extrapolation to the future and the time when these dashed lines cross the line should not be mistaken of estimates of the time of tipping.
In conclusion, we showed that the uncertainties discussed in this work are too large to allow for reliable estimates of the time of tipping of major Earth system tipping elements, including the AMOC, the polar ice sheets or tropical rainforests, based on extrapolating results from historical data. We emphasize that these uncertainties, originating from underlying modelling or mechanistic assumptions as well as from the employed empirical data, need to be taken into account and propagated thoroughly before attempting to estimate a future tipping time of any potential Earth system tipping element.
Data availability The HadISST1, HadSST4, and HadCRUT5 datasets are all available at https://www.metoffice.gov.uk/hadobs/. The ERSSTv5 operational data is available at https://psl.noaa.gov/data/gridded/data.noaa.ersst.v5.html. CO2 emissions from the SSP scenarios can be found at https://tntcat.iiasa.ac.at/SspDb/, and historical CO2 emission data at https://ourworldindata.org/CO2-emissions. CO2 emissions expected from current policies and targets can be found at https://climateactiontracker.org/.
Code availability All code used to analyse the data and generate figures will be uploaded to https://github.com/TUM-PIK-ESM/DD23_matters_arising.
Author contributions MBY, AM, SB and NB conceived and designed the study. AM carried out the analysis for the section “Modelling Assumptions” and MBY carried out the analysis for the sections “Rrepresentativeness of the SPG index for AMOC” and “Effect of dataset preprocessing and underlying uncertainties / non-stationary coverage”. All authors contributed to writing the manuscript.
Competing interests The authors declare that they have no competing interests.
Acknowledgments MBY and NB acknowledge funding by the European Union’s Horizon 2020 research and innovation programme under the Marie Sklodowska-Curie grant agreement No.956170. NB and SB acknowledge funding by the Volkswagen foundation. This is TiPES contribution #X; the TiPES (‘Tipping Points in the Earth System’) project has received funding from the European Union’s Horizon 2020 research and innovation programme under grant agreement No. 820970. NB acknowledges further funding by the German Federal Ministry of Education and Research under grant No. 01LS2001A.
Methods
AMOC fingerprints
For each of the four employed SST datasets we compute three different SST-based fingerprints of the AMOC. First, the index introduced by DD, which is obtained by averaging SST over the SPG region and then subtracting twice the global mean SSTs. Here, the SPG region is defined as in (Caesar et al., 2018). Second, the original version of this index, introduced by Caesar et al. (2018), where the global mean SSTs are only subtracted once. Third, we employ the so-called dipole fingerprint, which is obtained by subtracting average SSTs of a large region in the southern-hemisphere Atlantic ocean (0–45°S, 70°W-30°E) from average SSTs in a large region in the northern-hemisphere Atlantic (45–80°N, 70°W-30°E). For computing the spatial averages for the HadISST data, we mask out all values of grid cells covered by sea ice following Caesar et al. (2018), Boers (2021), and also use a weighted mean to account for the dependence of the grid cell size on the latitude.
Formulae for toy models
As we have laid out in detail in Section 2, a thorough investigation of the robustness of estimations should also include their application to data stemming from other plausible models. Here we give their formulae, which have been integrated to obtain time series data for the subsequent analysis in Figure 1.
The original fold bifurcation normal form model with linear forcing and white noise as discussed by DD23 reads
| (1) | ||||
| (2) |
As for all of the following models, it was integrated using the Euler-Mayurama scheme to obtain time series data.
Instead of the fold bifurcation normal form, a specialised model might be more suitable to represent AMOC dynamics. To this end, we include the reduced form of the Stommel-Cessi model given by
| (3) |
where and the parameter was chosen such that the absolute decrease of AMOC strength in advance of the bifurcation at is the same as for the fold normal form. decreases linearly from to . The time series is also inverted vertically and shifted appropriately.
We also explore time series data from a model with no inherent bifurcation. Instead, a square root trend is introduced, again taking all parameters from DD23:
| (4) |
Instead of the white noise term , we also investigated non-stationary red noise in the form of , where the Ornstein-Uhlenbeck process is generated by
| (5) |
The characteristic correlation time of the noise, , increases linearly:
| (6) |
References
- (1) Climate action tracker 2100 warming projections: Emissions and expected warming based on pledges and current policies. november 2022. https://climateactiontracker.org/global/temperatures/. Copyright ©2022 by Climate Analytics and NewClimate Institute. All rights reserved.
- Bamber et al. (2018) J. L. Bamber, A. J. Tedstone, M. D. King, I. M. Howat, E. M. Enderlin, M. R. van den Broeke, and B. Noel. Land ice freshwater budget of the arctic and north atlantic oceans: 1. data, methods, and results. Journal of Geophysical Research: Oceans, 123(3):1827–1837, 2018.
- Ben-Yami et al. (2023) M. Ben-Yami, V. Skiba, S. Bathiany, and N. Boers. Uncertainties in critical slowing down indicators of observation-based fingerprints of the Atlantic Overturning Circulation. 2023. URL http://arxiv.org/abs/2303.06448.
- Boers (2021) N. Boers. Observation-based early-warning signals for a collapse of the Atlantic Meridional Overturning Circulation. Nature Climate Change, 11(8):680–688, 2021. ISSN 17586798. 10.1038/s41558-021-01097-4. URL http://dx.doi.org/10.1038/s41558-021-01097-4.
- Boers and Rypdal (2021) N. Boers and M. Rypdal. Critical slowing down suggests that the western Greenland Ice Sheet is close to a tipping point. Proceedings of the National Academy of Sciences of the United States of America, 118(21):1–7, 2021. ISSN 10916490. 10.1073/pnas.2024192118.
- Boers et al. (2022) N. Boers, M. Ghil, and T. F. Stocker. Theoretical and paleoclimatic evidence for abrupt transitions in the Earth system. Environmental Research Letters, 17(9), 2022. ISSN 17489326. 10.1088/1748-9326/ac8944.
- Boulton et al. (2022) C. A. Boulton, T. M. Lenton, and N. Boers. Pronounced loss of Amazon rainforest resilience since the early 2000s. Nature Climate Change, 12(March), 2022. ISSN 17586798. 10.1038/s41558-022-01287-8.
- Caesar et al. (2018) L. Caesar, S. Rahmstorf, A. Robinson, G. Feulner, and V. Saba. Observed fingerprint of a weakening Atlantic Ocean overturning circulation. Nature, 556(7700):191–196, 2018. ISSN 14764687. 10.1038/s41586-018-0006-5.
- Cessi (1994) P. Cessi. A simple box model of stochastically forced thermohaline flow. Journal of Physical Oceanography, 24(9):1911 – 1920, 1994. https://doi.org/10.1175/1520-0485(1994)024<1911:ASBMOS>2.0.CO;2. URL https://journals.ametsoc.org/view/journals/phoc/24/9/1520-0485_1994_024_1911_asbmos_2_0_co_2.xml.
- Chafik et al. (2022) L. Chafik, N. P. Holliday, S. Bacon, and T. Rossby. Irminger Sea Is the Center of Action for Subpolar AMOC Variability. Geophysical Research Letters, 49(17):1–11, 2022. ISSN 19448007. 10.1029/2022GL099133.
- Dakos et al. (2008) V. Dakos, M. Scheffer, E. H. Van Nes, V. Brovkin, V. Petoukhov, and H. Held. Slowing down as an early warning signal for abrupt climate change. Proceedings of the National Academy of Sciences of the United States of America, 105(38):14308–14312, 2008. ISSN 00278424. 10.1073/pnas.0802430105.
- Devilliers et al. (2021) M. Devilliers, D. Swingedouw, J. Mignot, J. Deshayes, G. Garric, and M. Ayache. A realistic Greenland ice sheet and surrounding glaciers and ice caps melting in a coupled climate model. Climate Dynamics, 57(9-10):2467–2489, 2021. ISSN 14320894. 10.1007/s00382-021-05816-7. URL https://doi.org/10.1007/s00382-021-05816-7.
- Ditlevsen and Ditlevsen (2023) P. D. Ditlevsen and S. Ditlevsen. Warning of a forthcoming collapse of the Atlantic meridional overturning circulation. (March):1–12, 2023. 10.1038/s41467-023-39810-w. URL http://arxiv.org/abs/2304.09160.
- Drijfhout et al. (2012) S. Drijfhout, G. J. van Oldenborgh, and A. Cimatoribus. Is a decline of AMOC causing the warming hole above the North Atlantic in observed and modeled warming patterns? Journal of Climate, 25(24):8373–8379, 2012. ISSN 08948755. 10.1175/JCLI-D-12-00490.1.
- Ferster et al. (2022) B. S. Ferster, A. Simon, A. Fedorov, J. Mignot, and E. Guilyardi. Slowdown and Recovery of the Atlantic Meridional Overturning Circulation and a Persistent North Atlantic Warming Hole Induced by Arctic Sea Ice Decline. Geophysical Research Letters, 49(16), 2022. ISSN 19448007. 10.1029/2022GL097967.
- Ghosh et al. (2022) R. Ghosh, D. Putrasahan, E. Manzini, K. Lohmann, P. Keil, R. Hand, J. Bader, D. Matei, and J. H. Jungclaus. Two distinct phases of North Atlantic Eastern Subpolar Gyre and Warming Hole evolution under Global Warming. Journal of Climate, 36(6):1–31, 2022. ISSN 0894-8755. 10.1175/JCLI-D-22-0222.1.
- Gidden et al. (2019) M. J. Gidden, K. Riahi, S. J. Smith, S. Fujimori, G. Luderer, E. Kriegler, D. P. Van Vuuren, M. Van Den Berg, L. Feng, D. Klein, K. Calvin, J. C. Doelman, S. Frank, O. Fricko, M. Harmsen, T. Hasegawa, P. Havlik, J. Hilaire, R. Hoesly, J. Horing, A. Popp, E. Stehfest, and K. Takahashi. Global emissions pathways under different socioeconomic scenarios for use in CMIP6: A dataset of harmonized emissions trajectories through the end of the century. Geoscientific Model Development, 12(4):1443–1475, 2019. ISSN 19919603. 10.5194/gmd-12-1443-2019.
- Hassan et al. (2021) T. Hassan, R. J. Allen, W. Liu, and C. A. Randles. Anthropogenic aerosol forcing of the atlantic meridional overturning circulation and the associated mechanisms in cmip6 models. Atmospheric Chemistry and Physics, 21(8):5821–5846, 2021.
- He et al. (2022) C. He, A. C. Clement, M. A. Cane, L. N. Murphy, J. M. Klavans, and T. M. Fenske. A North Atlantic Warming Hole Without Ocean Circulation. Geophysical Research Letters, 49(19), 2022. ISSN 19448007. 10.1029/2022GL100420.
- Hofmann and Rahmstorf (2009) M. Hofmann and S. Rahmstorf. On the stability of the atlantic meridional overturning circulation. Proceedings of the National Academy of Sciences, 106(49):20584–20589, 2009.
- Huang et al. (2017) B. Huang, P. W. Thorne, V. F. Banzon, T. Boyer, G. Chepurin, J. H. Lawrimore, M. J. Menne, T. M. Smith, R. S. Vose, and H. M. Zhang. Extended reconstructed Sea surface temperature, Version 5 (ERSSTv5): Upgrades, validations, and intercomparisons. Journal of Climate, 30(20):8179–8205, 2017. ISSN 08948755. 10.1175/JCLI-D-16-0836.1.
- IPCC (2022) IPCC. Climate Change 2022, Mitigation of Climate Change Summary for Policymakers (SPM). Number 1. 2022. ISBN 9781107415416. URL https://www.ipcc.ch/report/ar6/wg2/.
- Jackson and Wood (2018) L. C. Jackson and R. A. Wood. Hysteresis and Resilience of the AMOC in an Eddy-Permitting GCM. Geophysical Research Letters, 45(16):8547–8556, 2018. ISSN 19448007. 10.1029/2018GL078104.
- Jackson and Wood (2020) L. C. Jackson and R. A. Wood. Fingerprints for early detection of changes in the AMOC. Journal of Climate, 33(16):7027–7044, 2020. ISSN 08948755. 10.1175/JCLI-D-20-0034.1.
- Kennedy et al. (2019) J. J. Kennedy, N. A. Rayner, C. P. Atkinson, and R. E. Killick. An Ensemble Data Set of Sea Surface Temperature Change From 1850: The Met Office Hadley Centre HadSST.4.0.0.0 Data Set. Journal of Geophysical Research: Atmospheres, 124(14):7719–7763, 2019. ISSN 21698996. 10.1029/2018JD029867.
- Latif et al. (2022) M. Latif, J. Sun, M. Visbeck, and M. Hadi Bordbar. Natural variability has dominated atlantic meridional overturning circulation since 1900. Nature Climate Change, 12(5):455–460, 2022.
- Levermann and Winkelmann (2016) A. Levermann and R. Winkelmann. A simple equation for the melt elevation feedback of ice sheets. Cryosphere, 10(4):1799–1807, 2016. ISSN 19940424. 10.5194/tc-10-1799-2016.
- Li et al. (2022) L. Li, M. S. Lozier, and F. Li. Century-long cooling trend in subpolar North Atlantic forced by atmosphere: an alternative explanation. Climate Dynamics, 58(9-10):2249–2267, 2022. ISSN 14320894. 10.1007/s00382-021-06003-4. URL https://doi.org/10.1007/s00382-021-06003-4.
- Little et al. (2020) C. M. Little, M. Zhao, and M. W. Buckley. Do Surface Temperature Indices Reflect Centennial-Timescale Trends in Atlantic Meridional Overturning Circulation Strength? Geophysical Research Letters, 47(22):1–10, 2020. ISSN 19448007. 10.1029/2020GL090888.
- Liu et al. (2020) W. Liu, A. V. Fedorov, S. P. Xie, and S. Hu. Climate impacts of a weakened Atlantic meridional overturning circulation in a warming climate. Science Advances, 6(26):2–10, 2020. ISSN 23752548. 10.1126/sciadv.aaz4876.
- Lohmann et al. (2023) J. Lohmann, H. A. Dijkstra, M. Jochum, V. Lucarini, and P. D. Ditlevsen. Multistability and intermediate tipping of the atlantic ocean circulation, 2023.
- Lozier et al. (2019) M. S. Lozier, F. Li, S. Bacon, F. Bahr, A. S. Bower, S. A. Cunningham, M. F. De Jong, L. De Steur, B. DeYoung, J. Fischer, S. F. Gary, B. J. Greenan, N. P. Holliday, A. Houk, L. Houpert, M. E. Inall, W. E. Johns, H. L. Johnson, C. Johnson, J. Karstensen, G. Koman, I. A. Le Bras, X. Lin, N. Mackay, D. P. Marshall, H. Mercier, M. Oltmanns, R. S. Pickart, A. L. Ramsey, D. Rayner, F. Straneo, V. Thierry, D. J. Torres, R. G. Williams, C. Wilson, J. Yang, I. Yashayaev, and J. Zhao. A sea change in our view of overturning in the subpolar North Atlantic. Science, 363(6426):516–521, 2019. ISSN 10959203. 10.1126/science.aau6592.
- McKay et al. (2022) D. I. McKay, A. Staal, J. F. Abrams, R. Winkelmann, B. Sakschewski, S. Loriani, I. Fetzer, S. E. Cornell, J. Rockström, and T. M. Lenton. Exceeding 1.5∘C global warming could trigger multiple climate tipping points. Science, 377(6611), 2022. ISSN 10959203. 10.1126/science.abn7950.
- Mckay et al. (2022) D. I. A. Mckay, A. Staal, J. F. Abrams, R. Winkelmann, B. Sakschewski, S. Loriani, I. Fetzer, S. E. Cornell, J. Rockström, and T. M. Lenton. multiple climate tipping points. 1171(September), 2022. 10.1126/science.abn7950.
- Medhaug and Furevik (2011) I. Medhaug and T. Furevik. North atlantic 20th century multidecadal variability in coupled climate models: sea surface temperature and ocean overturning circulation. Ocean Science, 7(3):389–404, 2011.
- Menary and Wood (2018) M. B. Menary and R. A. Wood. An anatomy of the projected North Atlantic warming hole in CMIP5 models. Climate Dynamics, 50(7-8):3063–3080, 2018. ISSN 14320894. 10.1007/s00382-017-3793-8.
- Menary et al. (2015) M. B. Menary, D. L. Hodson, J. I. Robson, R. T. Sutton, and R. A. Wood. A mechanism of internal decadal Atlantic Ocean variability in a high-resolution coupled climate model. Journal of Climate, 28(19):7764–7785, 2015. ISSN 08948755. 10.1175/JCLI-D-15-0106.1.
- Menary et al. (2020) M. B. Menary, J. Robson, R. P. Allan, B. B. Booth, C. Cassou, G. Gastineau, J. Gregory, D. Hodson, C. Jones, J. Mignot, M. Ringer, R. Sutton, L. Wilcox, and R. Zhang. Aerosol-Forced AMOC Changes in CMIP6 Historical Simulations. Geophysical Research Letters, 47(14), 2020. ISSN 19448007. 10.1029/2020GL088166.
- Michel et al. (2022) S. L. L. Michel, D. Swingedouw, P. Ortega, G. Gastineau, J. Mignot, G. Mccarthy, and M. Khodri. Early warning signal for a tipping point suggested by a millennial Atlantic Multidecadal Variability reconstruction. pages 2–4, 2022. 10.1038/s41467-022-32704-3.
- Morice et al. (2021) C. P. Morice, J. J. Kennedy, N. A. Rayner, J. P. Winn, E. Hogan, R. E. Killick, R. J. Dunn, T. J. Osborn, P. D. Jones, and I. R. Simpson. An Updated Assessment of Near-Surface Temperature Change From 1850: The HadCRUT5 Data Set. Journal of Geophysical Research: Atmospheres, 126(3):1–28, 2021. ISSN 21698996. 10.1029/2019JD032361.
- Rahmstorf et al. (2005) S. Rahmstorf, M. Crucifix, A. Ganopolski, H. Goosse, I. Kamenkovich, R. Knutti, G. Lohmann, R. Marsh, L. A. Mysak, Z. Wang, and A. J. Weaver. Thermohaline circulation hysteresis: A model intercomparison. Geophysical Research Letters, 32(23), 2005.
- Rahmstorf et al. (2015) S. Rahmstorf, J. E. Box, G. Feulner, M. E. Mann, A. Robinson, S. Rutherford, and E. J. Schaffernicht. Exceptional twentieth-century slowdown in Atlantic Ocean overturning circulation. Nature Climate Change, 5(5):475–480, 2015. ISSN 17586798. 10.1038/nclimate2554.
- Rayner et al. (2003) N. A. Rayner, D. E. Parker, E. B. Horton, C. K. Folland, L. V. Alexander, D. P. Rowell, E. C. Kent, and A. Kaplan. Global analyses of sea surface temperature, sea ice, and night marine air temperature since the late nineteenth century. Journal of Geophysical Research: Atmospheres, 108(14), 2003. ISSN 01480227. 10.1029/2002jd002670.
- Riahi et al. (2017) K. Riahi, D. P. van Vuuren, E. Kriegler, J. Edmonds, B. C. O’Neill, S. Fujimori, N. Bauer, K. Calvin, R. Dellink, O. Fricko, W. Lutz, A. Popp, J. C. Cuaresma, S. KC, M. Leimbach, L. Jiang, T. Kram, S. Rao, J. Emmerling, K. Ebi, T. Hasegawa, P. Havlik, F. Humpenöder, L. A. Da Silva, S. Smith, E. Stehfest, V. Bosetti, J. Eom, D. Gernaat, T. Masui, J. Rogelj, J. Strefler, L. Drouet, V. Krey, G. Luderer, M. Harmsen, K. Takahashi, L. Baumstark, J. C. Doelman, M. Kainuma, Z. Klimont, G. Marangoni, H. Lotze-Campen, M. Obersteiner, A. Tabeau, and M. Tavoni. The Shared Socioeconomic Pathways and their energy, land use, and greenhouse gas emissions implications: An overview. Global Environmental Change, 42:153–168, 2017. ISSN 09593780. 10.1016/j.gloenvcha.2016.05.009.
- Roberts et al. (2013) C. D. Roberts, F. K. Garry, and L. C. Jackson. A multimodel study of sea surface temperature and subsurface density fingerprints of the Atlantic meridional overturning circulation. Journal of Climate, 26(22):9155–9174, 2013. ISSN 08948755. 10.1175/JCLI-D-12-00762.1.
- Scheffer et al. (2009) M. Scheffer, J. Bascompte, W. A. Brock, V. Brovkin, S. R. Carpenter, V. Dakos, H. Held, E. H. Van Nes, M. Rietkerk, and G. Sugihara. Early-warning signals for critical transitions. Nature, 461(7260):53–59, 2009. ISSN 00280836. 10.1038/nature08227. URL http://dx.doi.org/10.1038/nature08227.
- Sgubin et al. (2017) G. Sgubin, D. Swingedouw, S. Drijfhout, Y. Mary, and A. Bennabi. Abrupt cooling over the North Atlantic in modern climate models. Nature Communications, 8, 2017. ISSN 20411723. 10.1038/ncomms14375.
- Smith et al. (2022a) T. Smith, D. Traxl, and N. Boers. Empirical evidence for recent global shifts in vegetation resilience. Nature Climate Change, 12(5):477–484, 2022a. ISSN 17586798. 10.1038/s41558-022-01352-2.
- Smith et al. (2022b) T. Smith, R.-m. Zotta, C. A. Boulton, T. M. Lenton, and W. Dorigo. Reliability of Resilience Estimation based on Multi-Instrument Time Series. (August):1–14, 2022b.
- Smith et al. (2023) T. Smith, R. M. Zotta, C. A. Boulton, T. M. Lenton, W. Dorigo, and N. Boers. Reliability of resilience estimation based on multi-instrument time series. Earth System Dynamics, 14(1):173–183, 2023. ISSN 21904987. 10.5194/esd-14-173-2023.
- Stommel (1961) H. Stommel. Thermohaline Convection with Two Stable Regimes of Flow. Tellus, 13(2):224–230, 1961. ISSN 0040-2826. 10.3402/tellusa.v13i2.9491.
- Sun et al. (2021) J. Sun, M. Latif, and W. Park. Subpolar gyre–AMOC–atmosphere interactions on multidecadal timescales in a version of the Kiel climate model. Journal of Climate, 34(16):6583–6602, 2021. ISSN 15200442. 10.1175/JCLI-D-20-0725.1.
- Swingedouw et al. (2021) D. Swingedouw, A. Bily, C. Esquerdo, L. F. Borchert, G. Sgubin, J. Mignot, and M. Menary. On the risk of abrupt changes in the North Atlantic subpolar gyre in CMIP6 models. Annals of the New York Academy of Sciences, 1504(1):187–201, 2021. ISSN 17496632. 10.1111/nyas.14659.
- Swingedouw et al. (2022) D. Swingedouw, M. N. Houssais, C. Herbaut, A. C. Blaizot, M. Devilliers, and J. Deshayes. AMOC Recent and Future Trends: A Crucial Role for Oceanic Resolution and Greenland Melting? Frontiers in Climate, 4(April), 2022. ISSN 26249553. 10.3389/fclim.2022.838310.
- Trusel et al. (2018) L. D. Trusel, S. B. Das, M. B. Osman, M. J. Evans, B. E. Smith, X. Fettweis, J. R. McConnell, B. P. Y. Noël, and M. R. van den Broeke. Nonlinear rise in greenland runoff in response to post-industrial arctic warming. Nature, 564(7734):104–108, 2018.
- Wang et al. (2023) S. Wang, A. Foster, E. A. Lenz, J. D. Kessler, J. C. Stroeve, L. O. Anderson, M. Turetsky, R. Betts, S. Zou, W. Liu, W. R. Boos, and Z. Hausfather. Mechanisms and Impacts of Earth System Tipping Elements. Reviews of Geophysics, 61(1):1–81, 2023. ISSN 8755-1209. 10.1029/2021rg000757.
- Zhu et al. (2023) C. Zhu, Z. Liu, S. Zhang, and L. Wu. Likely accelerated weakening of Atlantic overturning circulation emerges in optimal salinity fingerprint. Nature Communications, 14(1):1–9, 2023. ISSN 20411723. 10.1038/s41467-023-36288-4.
Extended data
| p=0 | optimal p | |
|---|---|---|
| SPG-2xGMT | 2158.3-3072.8 | 2120.9-3072.8 |
| SPG-1xGMT | 2249.8-2992.6 | 2249.8-2600.7 |
| Dipole | 2428.2-8065.1 | 2359.1-inf |
| optimal p | p=0 | |
|---|---|---|
| SPG-2xGMT HadISST | 2037.5 | 2053.7 |
| SPG-2xGMT ERSSTv5 | 3047.7 | 3047.7 |
| SPG-2xGMT HadCRUT5 | 2131.6 | 2168.9 |
| SPG-1xGMT HadISST | 2064.7 | 2084.2 |
| SPG-1xGMT ERSSTv5 | 4780.9 | 4780.9 |
| SPG-1xGMT HadCRUT5 | 2314.6 | 2314.6 |
| Dipole HadISST | 2085.2 | 2123.9 |
| Dipole ERSSTv5 | 3285.4 | 3285.4 |
| Dipole HadCRUT5 | 2915.5 | 2914.3 |