Present address: ]Laboratório Nacional de Luz Síncrotron, Centro Nacional de Pesquisa em Energia e Materiais, 13083-100 Campinas, SP, Brazil
Using quantitative magneto-optical imaging to reveal why the ac susceptibility of superconducting films is history-independent
Abstract
Measurements of the temperature-dependent ac magnetic susceptibility of superconducting films reveal reversible responses, i.e., irrespective of the magnetic and thermal history of the sample. This experimental fact is observed even in the presence of stochastic and certainly irreversible magnetic flux avalanches which, in principle, should randomly affect the results. In this work, we explain such an apparent contradiction by exploring the spatial resolution of magneto-optical imaging. To achieve this, we successfully compare standard frequency-independent first harmonic ac magnetic susceptibility results for a superconducting thin film with those obtained by ac-emulating magneto-optical imaging (acMOI). A quantitative analysis also provides information regarding flux avalanches, reveals the presence of a vortex-antivortex annihilation zone in the region in which a smooth flux front interacts with pre-established avalanches, and demonstrates that the major impact on the flux distribution within the superconductor happens during the first ac cycle. Our results establish acMOI as a reliable approach for studying frequency-independent ac field effects in superconducting thin films while capturing local aspects of flux dynamics, otherwise inaccessible via global magnetometry techniques.
I Introduction
The last years have seen superconducting materials be positioned as a vital part of an ongoing quantum revolution [1, 2, 3, 4, 5] and serving as a fertile playground for the development of several nanoscale technological applications [6, 7, 8, 9, 10, 11, 12, 13]. Particularly, understanding, controlling, and exploring the interaction of different superconductors with distinct properties and structures with a low-frequency ac magnetic field has been an active research topic [14, 15, 16, 17, 18, 19, 20, 21, 22].
In a type-II superconductor, it may be energetically favorable for the sample to allow flux penetration in the form of vortices [23, 24]. For a given direction of the applied magnetic field, vortices may either be of positive or negative polarity, the latter being commonly referred to as antivortices. Whereas vortices with the same polarity interact repulsively [25], vortices and antivortices attract each other, which eventually leads to mutual annihilation when two such entities come in close proximity [26, 27].
On a mesoscopic scale, ordinary flux distributions in type-II specimens are described by critical state models [28, 29]. In this case, the magnetic field gradually penetrates toward the center of the sample as a smooth flux front originating from the edges of the material, a consequence of vortex motion being hampered by pinning centers [30, 31]. The exact distribution profile depends on sample geometry and its magnetic history [32, 33, 34]. Moreover, the depth of the flux front penetration is tied to the sample critical current density , as further penetration indicates a lower magnetic shielding capability [32]. In short, the actual flux distribution usually depends on external thermodynamic parameters such as the temperature, , and the applied magnetic field, , i.e., .
The inevitable vortex displacement during flux penetration represents an energy dissipating process [24]. Then, if the superconductor is not able to swiftly assimilate the heat generated by moving vortices in order to accommodate for further vortex movement, a thermomagnetic instability may be triggered. In a given interval of magnetic fields and temperatures, these events lead to the onset of a positive feedback process in which superconducting properties are locally suppressed, allowing for abrupt flux penetration known as flux avalanches [35, 36, 37]. In thin films, flux avalanches take remarkable dendritic patterns as they propagate through the material with velocities up to the scale of hundreds of km/s [38, 39, 40, 41, 42, 43, 44, 45].
The abrupt flux penetration during a flux avalanche event results in well-known flux jumps in the global magnetization hysteresis loop of superconductors [46, 47, 48, 49, 31]. Another signature of avalanches in the magnetic properties of superconducting materials is a paramagnetic reentrance observed in the temperature dependence of the first harmonic ac magnetic susceptibility, [50, 51, 52]. The in-phase component is related to an inductive response and measures the superconductor ability to shield magnetic flux [53, 54]. The so-called paramagnetic reentrance is observed as a decrease in for temperatures lower than the superconducting critical temperature . On its turn, the out-of-phase component gauges the energy losses related to flux motion in type-II superconductors [53, 54]. Hence, an increase in accompanying the decrease in reveals the occurrence of flux avalanches. Although ac susceptibility studies are a ubiquitous approach for characterizing the magnetic dynamics of superconducting systems [55, 53, 54, 56, 57, 58, 19, 59, 60, 61], a technique with the micrometric spatial resolution of magneto-optical imaging, has remained little explored in this effort.
In this work, we investigate the effects of ac magnetic fields in a 100-nm-thick amorphous MoSi (a-MoSi) film by employing ac-emulating magneto-optical imaging (acMOI). Comparing the results with measurements obtained by conventional global ac magnetometry, we demonstrate that acMOI is a reliable technique for the quantitative study of the ac magnetic susceptibility of superconductors. Moreover, as magneto-optical imaging allows to spatially resolve individual flux avalanches, acMOI is used to explain an observed thermomagnetic history-independent paramagnetic reentrance in for the a-MoSi film. Quantitative acMOI also allows us to visualize how an incoming smooth flux front overrides the flux distribution of pre-established avalanches, revealing a vortex-antivortex annihilation zone separating regions permeated by magnetic flux with opposing polarities.
This paper is organized as follows: Section II details the experimental methods used to fabricate and investigate the a-MoSi thin film; Section III describes typical measurements conducted in a standard ac magnetometer, demonstrating the history-independent paramagnetic reentrance in the investigated sample; Section IV qualitatively explores the nature of ac susceptibility measurements using acMOI both in the smooth penetration and avalanche regimes and quantifies the magnetic imprint of individual avalanches; Section V demonstrates how acMOI may be used to quantitatively gauge for superconducting samples; Section VI further explores the spatial resolution of MOI to investigate how an incoming flux front interacts with an already established avalanche region; finally, Section VII summarizes the results and outlines perspectives on the use of acMOI.
II Experimental details
A square a-MoSi film with lateral size of 2.5 mm and thickness of 100 nm was deposited onto a silicon substrate at 77 K by dc magnetron sputtering at a pressure of 1.2 Pa in dynamical equilibrium under argon flow, similarly to the protocol described in Ref. [62]. Amorphous MoSi films typically present critical temperatures above 7 K, low intrinsic pinning, and correspondingly low critical current densities [63, 64]. Application-wise, a-MoSi is a prominent material choice for superconducting nanowire single-photon detectors [65, 66, 67].
The complex ac magnetic susceptibility of the a-MoSi sample was investigated as a function of temperature using standard global magnetometry which captures the magnetic behavior of the sample as a whole. A SQUID-based magnetometer model MPMS-5S from Quantum Design (MPMS) was employed to measure both the in-phase () and out-of-phase () components of . Probe ac magnetic fields of frequencies = 0.05 Hz or 1 Hz and amplitudes varying from 0.1 Oe to 3.8 Oe were applied perpendicularly to the plane of the film during the experiments. Before measuring, the magnetic history of the dc field-generating superconducting coil of the MPMS was erased, and all measurements were performed under remanent magnetic field, 1 Oe. In other words, no external dc field was intentionally applied to the sample.
The magneto-optical imaging technique allows us to locally resolve the magnetic flux distribution within the sample on the micrometric scale [30]. By placing a Bi-doped yttrium iron garnet—a Faraday-active material [68]—directly on top of our superconducting film, MOI allows inspection of the deviation of the polarization angle of light in the presence of a magnetic field due to the Faraday effect. Thus, we are able to detect subtle nuances in the local field induced in the investigated material as a variation in the intensity captured by a CCD camera.
We perform a pixel-by-pixel calibration procedure implemented on MATLAB to obtain quantitative information from magneto-optical images [69]. In other words, we extract the out-of-plane magnetic flux density from the intensity data , where defines the position of a given pixel within the image. Possible drifts in sample position relative to the sensors due to thermal dilation of the cold finger in the experimental setup are corrected within a precision of two pixels using the StackReg plugin [70] with ImageJ [71]. As a consequence of its lower , a-MoSi also presents an intrinsic advantage for quantitative MO studies, as it inhibits unwanted magnetic domain wall switching in the garnet layer [72], which could otherwise compromise the -to- transformation.
III Ac susceptibility: MPMS measurements
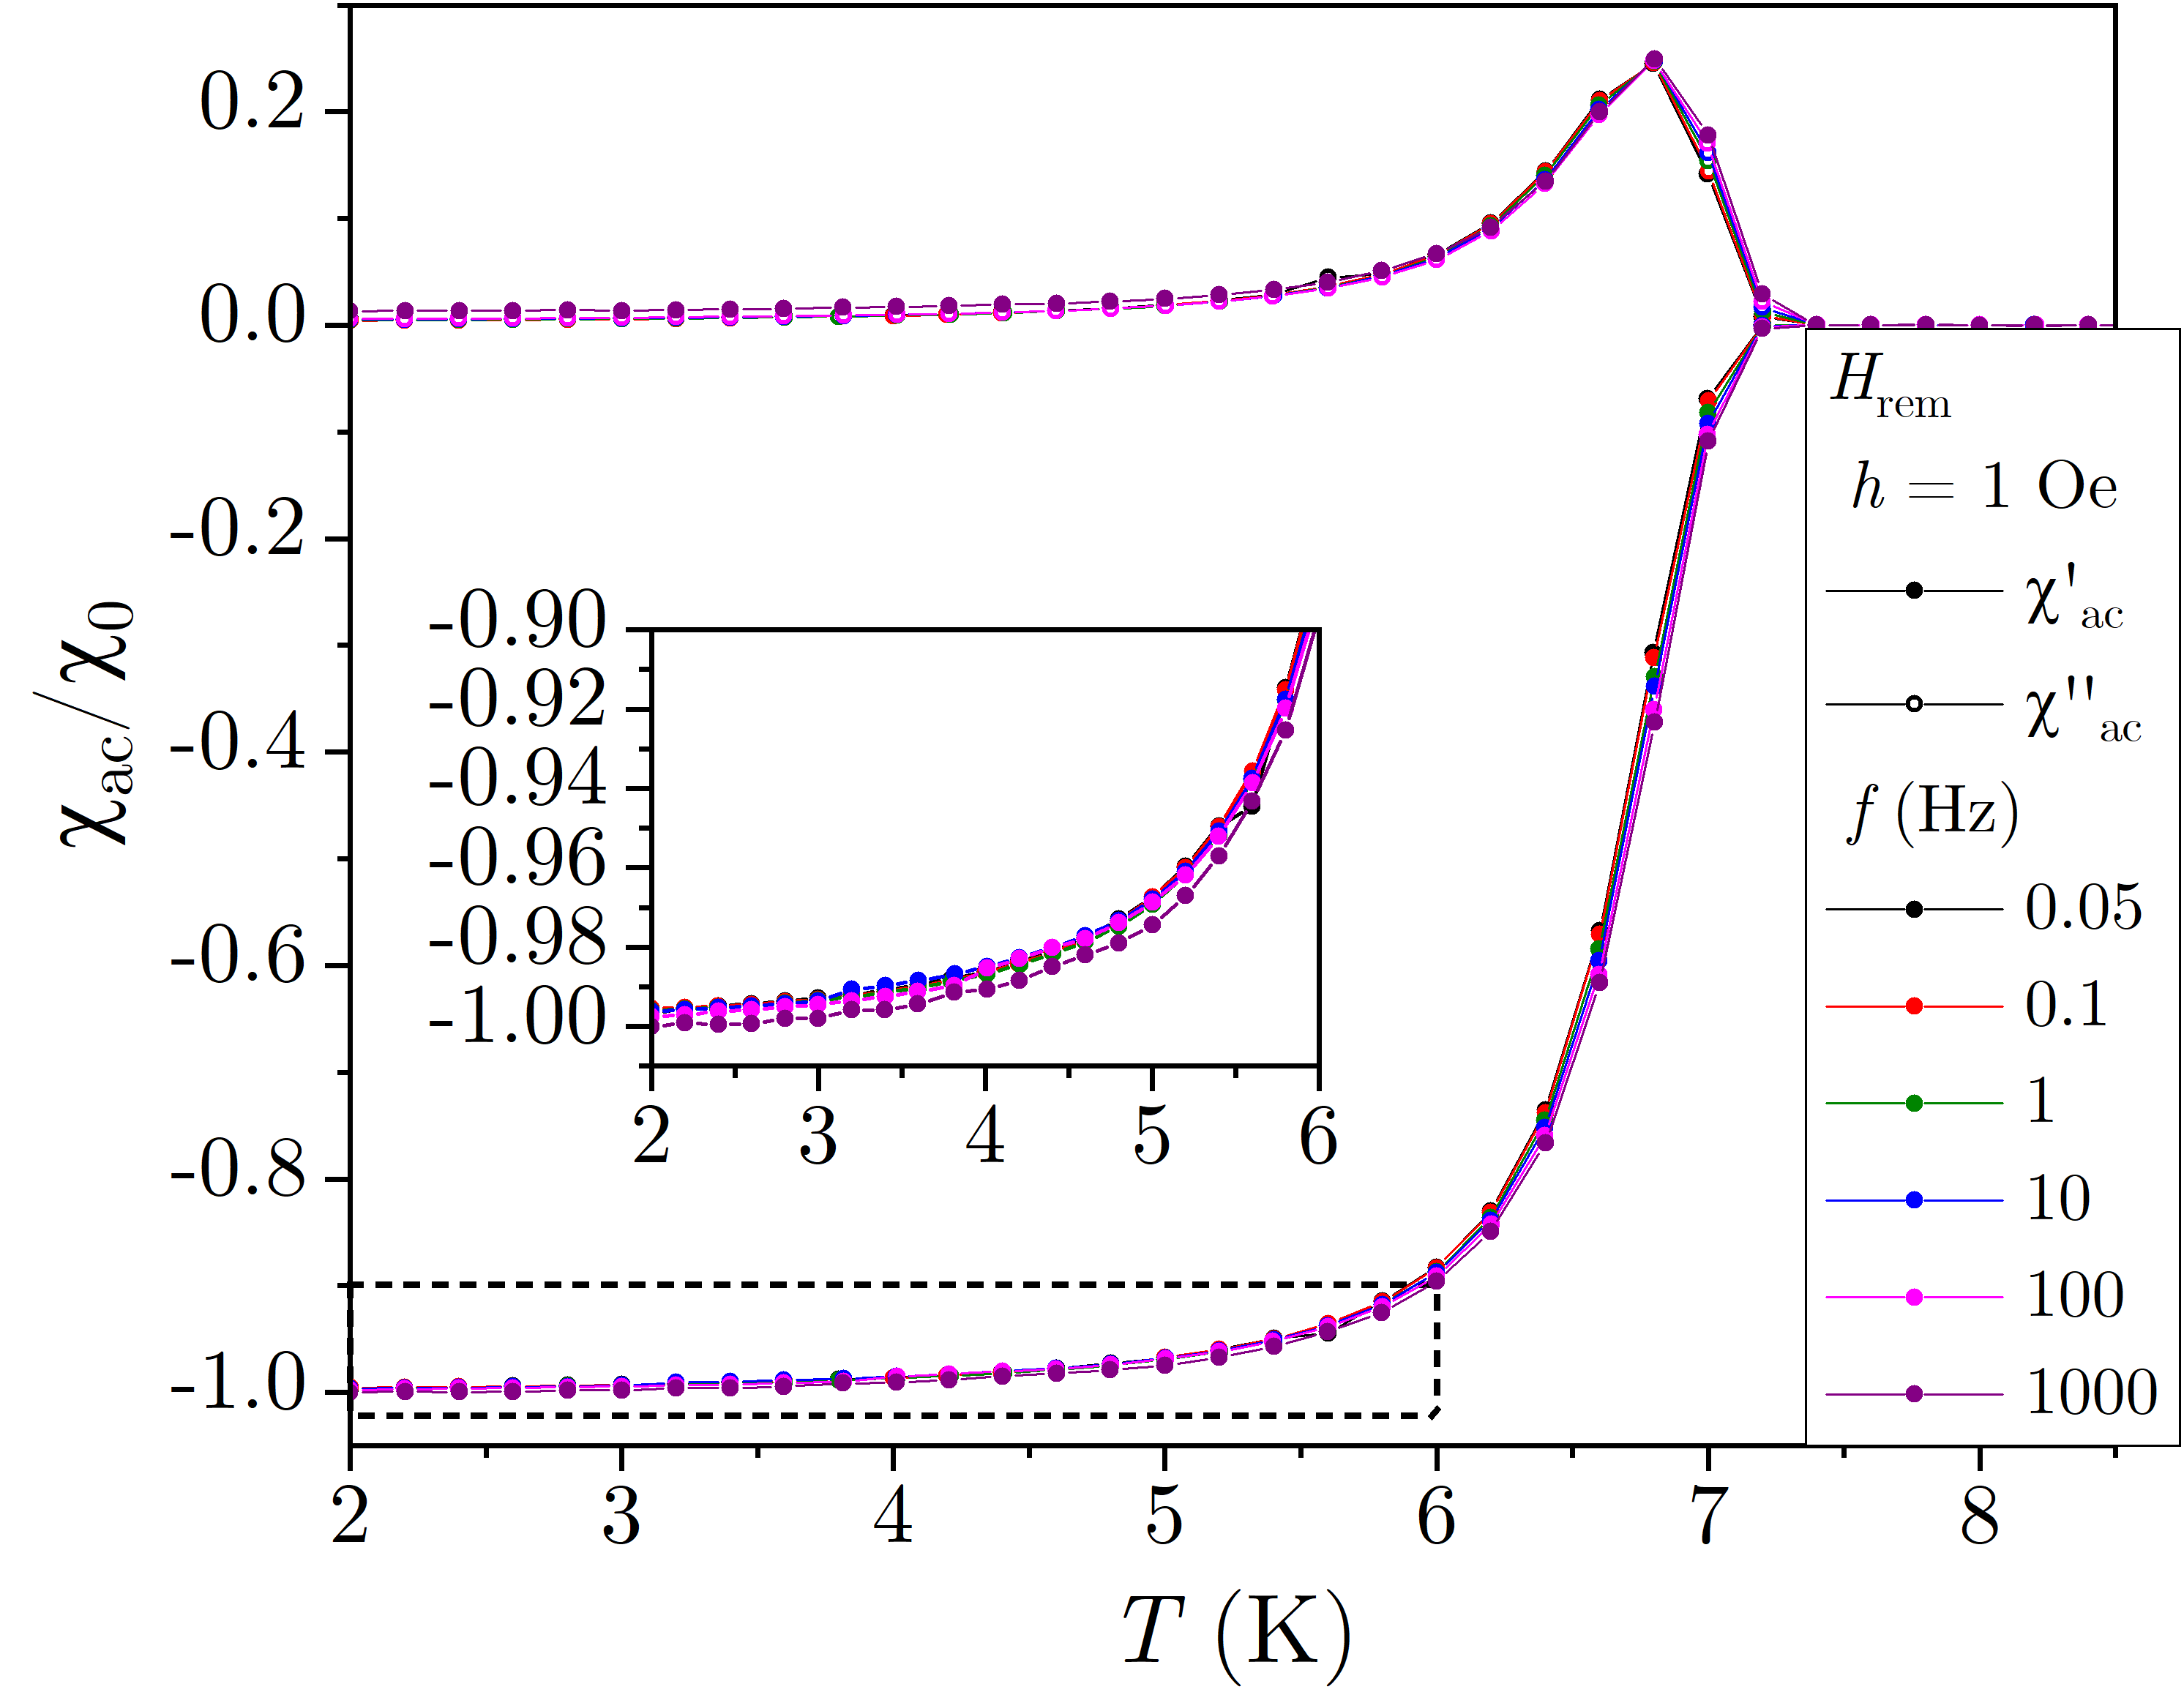
Typical temperature-dependent ac susceptibility results for superconducting films are illustrated in Fig. 1 for the 100-nm-thick a-MoSi sample. The curves depicted are obtained using the MPMS and show both and normalized by the Meissner state plateau of the measurement conducted with the lowest and . Figure 1(a) highlights the effects of in . In all measurements, the sample is first subjected to zero-field-cooling (ZFC) down to 2 K. Then, is measured as the temperature is increased using a probe field with = 1 Hz and varying values from 0.1 Oe to 3.5 Oe. As we demonstrate in Appendix A, the choice of has almost no impact on the behavior in the frequency range explored in this work. For the smallest field amplitude (black points), we observe a near constant close to at low temperatures. This is a signature of superconductors’ perfect diamagnetism, showing that the sample initially shields its interior from magnetic flux very efficiently. Then, as the sample approaches its critical temperature (), a sharp increase in is observed, as the film is no longer shielded from flux penetration. Signatures of the superconducting-normal state transition are also found in the out-of-phase component, as a peak in accompanies the increase in . Thus, the dissipative motion of vortices entering the sample is consistently captured by , which is greatly enhanced during flux penetration. Therefore, for the a-MoSi sample, we define K as the first experimental point for which both and depart from zero in measurements.
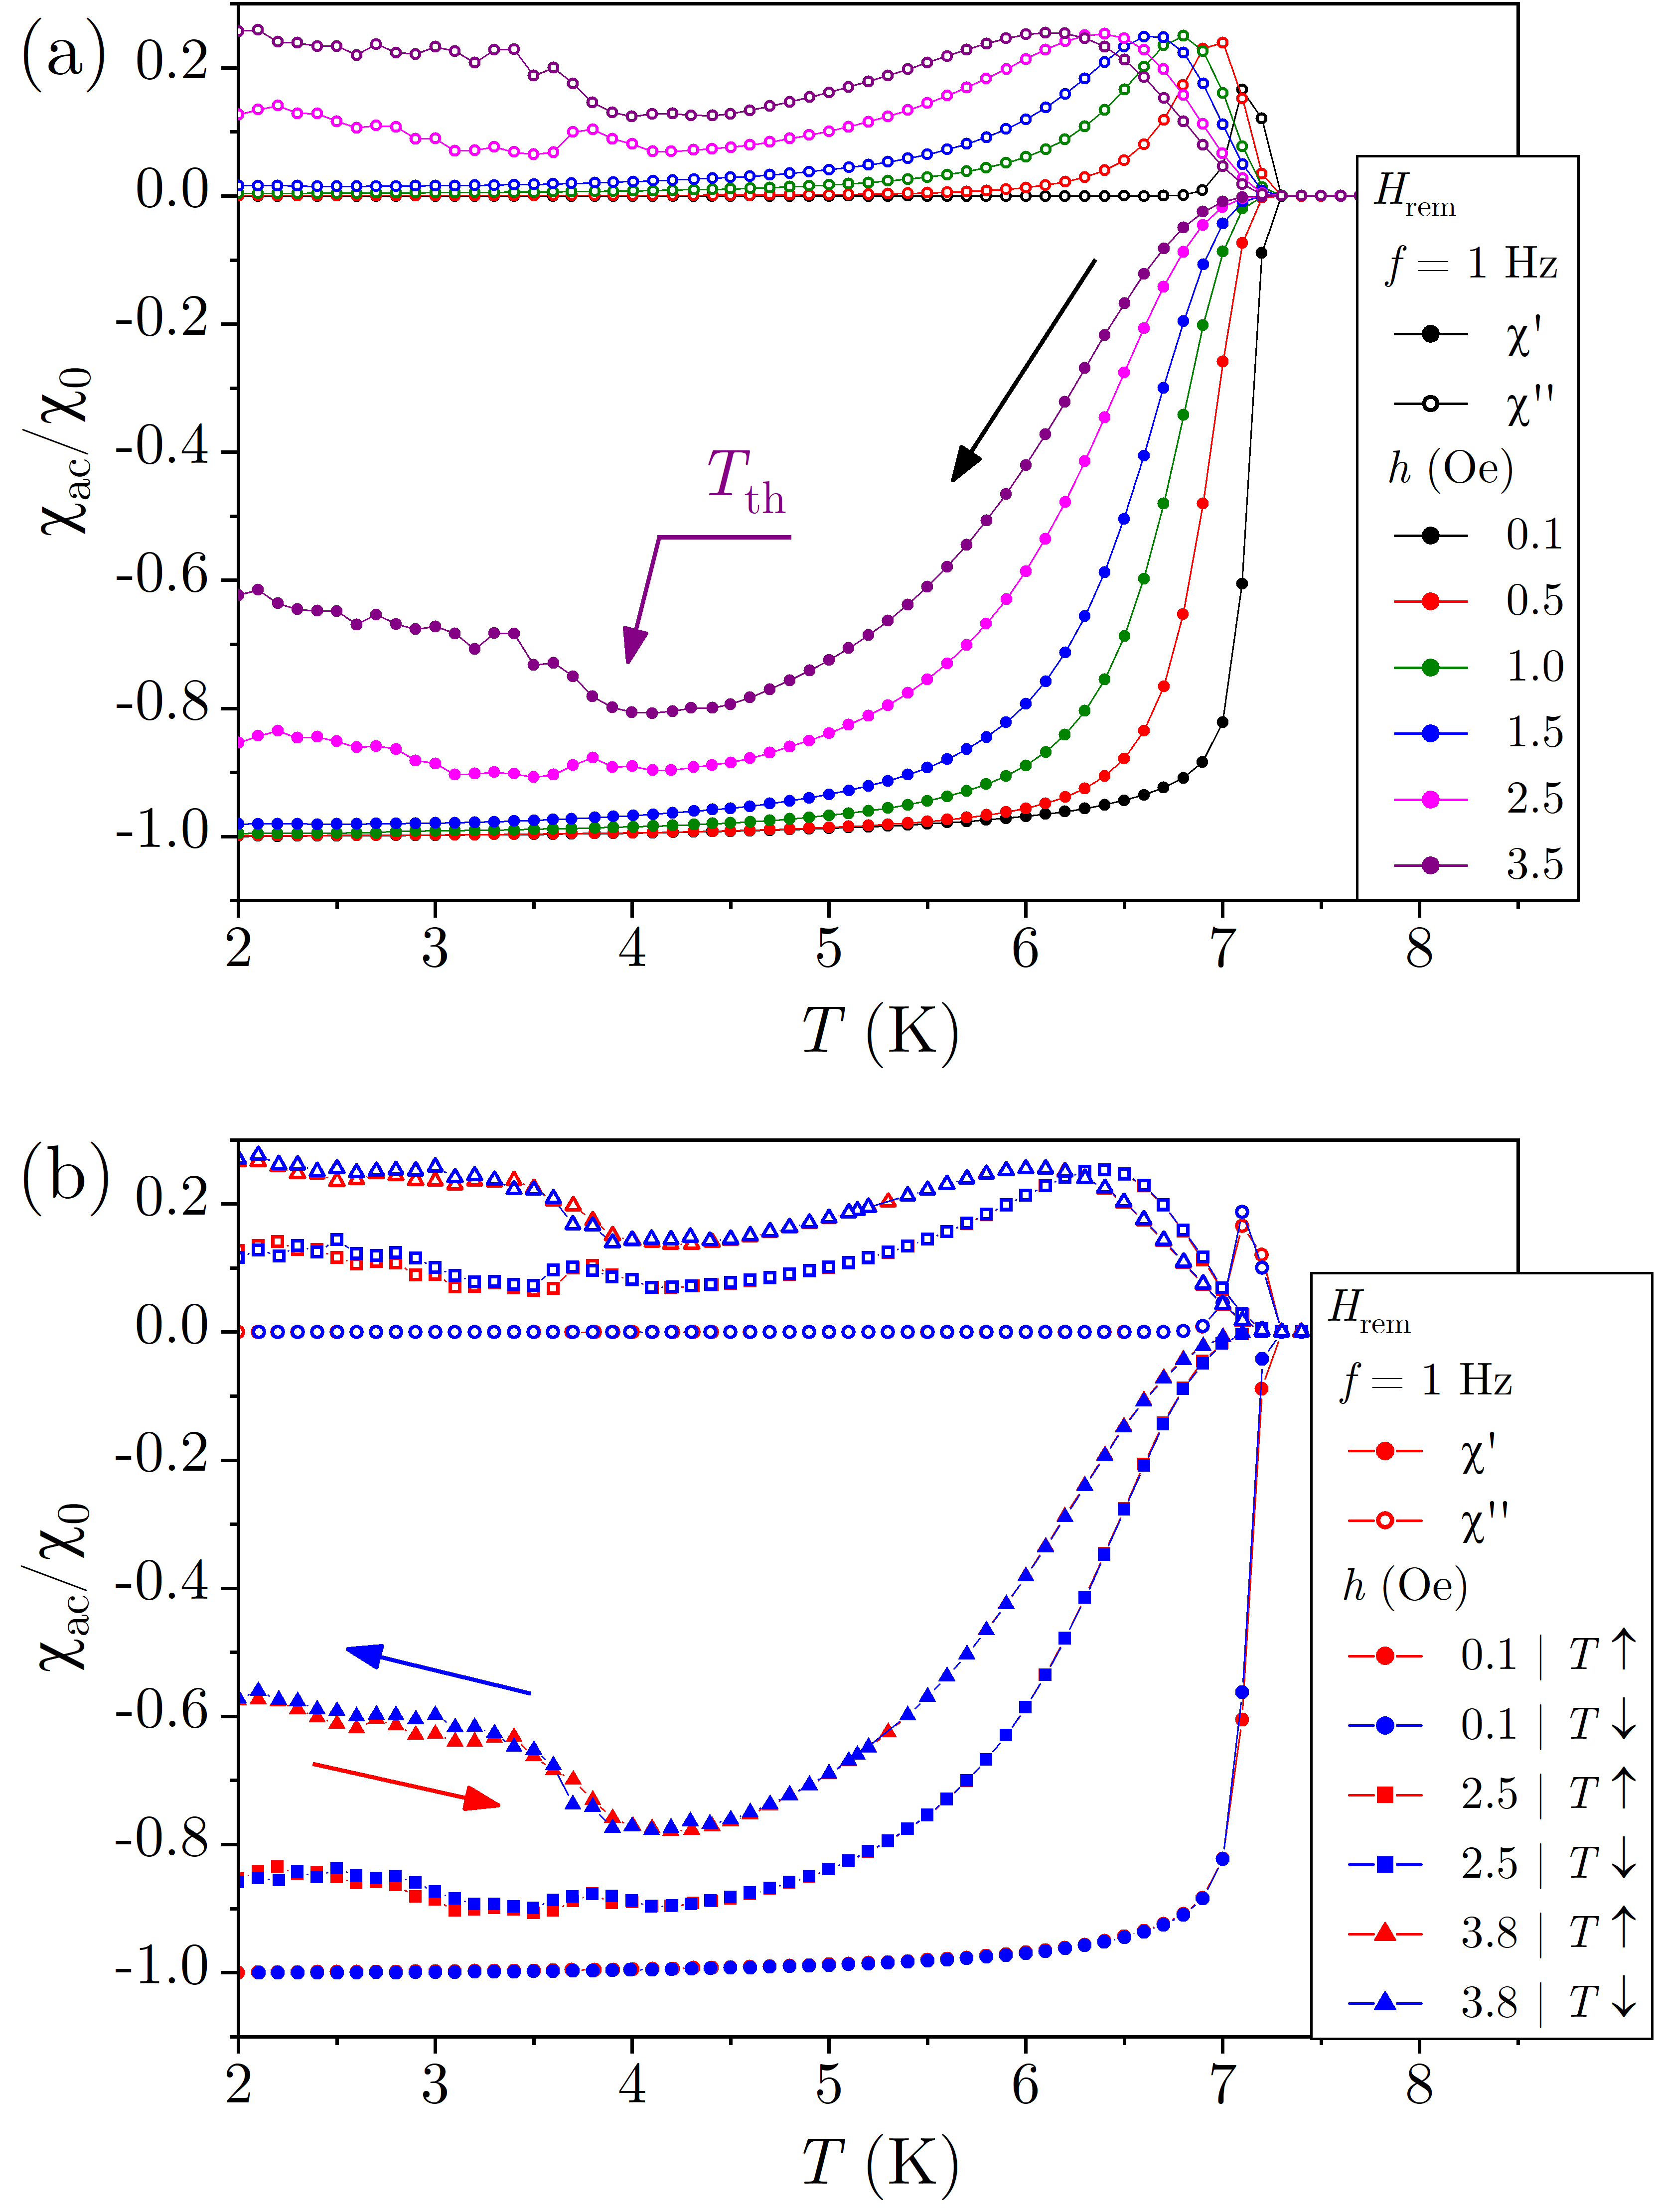
If is now increased to 0.5 Oe (red points), a very similar behavior is observed in Fig. 1(a). However, flux exclusion becomes less complete as the temperature and field are increased in accordance with critical state models. Therefore, although is unchanged, the onset of the superconducting-normal state transition occurs for lower temperatures, as is increased from 2 K. This trend continues as is further increased to 1.0 Oe and 1.5 Oe, represented in Fig. 1(a) by green and blue points, respectively. For all measurements with 1.5 Oe, the a-MoSi film is in the smooth penetration regime and all flux penetration occurs gradually and uniformly from the edges toward the center of the sample, as described by critical state models. For = 2.5 Oe, however, a radically different behavior is observed: the pink points in Fig.1(a) sharply differ from those observed in the smooth regime. For the lowest temperatures, an apparently noisy response is observed in both components while shielding becomes much less effective. The purple points reveal the same trend for measurements carried out with a probe field of 3.5 Oe. As we will demonstrate in this paper using MOI, these characteristics are signs of the occurrence of magnetic flux avalanches in the film [73]. Such variations in and are then explained by a reduction of the volume of the film free from flux penetration as avalanches advance throughout the sample. Eventually, as is increased above 4 K, the noisy behavior in is no longer present for both the 2.5 Oe and 3.5 Oe curves. This occurs because the temperature is increased beyond that for which avalanches can be triggered (), keeping the sample in a thermomagnetically stable condition, as described by the thermomagnetic model [74]. As such, flux will now only penetrate the sample smoothly, although frozen imprints of previous avalanches may remain in the flux patterns observed in the film.
Flux avalanches are of a stochastic nature. It is therefore not possible to accurately predict their shape or size, nor to precisely pinpoint the moment or the position at which an avalanche will be triggered [37, 44]. In spite of this fact, Fig. 1(b) reveals an interesting feature of measurements: the results are not only largely reproducible but also independent of the thermomagnetic history both in the smooth and in the unpredictable avalanche regime. To illustrate that, we conduct measurements for the a-MoSi film after ZFC to 2 K using a probe field with = 1 Hz and = 0.1 Oe. The red circles represent the results as is gradually increased through up to 9 K. Then, is recorded as the temperature is lowered from the normal state back to 2 K, as shown by the blue circles. A close inspection of both curves reveals essentially no difference in in the smooth regime, independently of the direction of the temperature variation. If now is increased to 2.5 Oe and the experiment is repeated, the sample is in the avalanche regime for K. In this temperature range, the red and blue squares in Fig. 1(b) are no longer indistinguishable, although they remain very close to each other. More precisely, the observed ups and downs in gauged as is increased mirror those obtained as is decreased. The red and blue triangles in Fig. 1(b) reveal the same behavior in the avalanche regime for a higher probe field amplitude = 3.8 Oe.
IV Ac susceptibility: MOI measurements
We now turn to magneto-optical imaging to explain why there appears to be to a large extent a reversible response in the noisy ac susceptibility behavior caused by stochastic avalanche events. To do so, it is instructive to first recall the working principle of how is obtained in magnetometers such as the MPMS. An applied zero-mean probe ac field with an amplitude and frequency , such that , induces a time-dependent magnetic moment in the investigated sample. Hence, a detectable electric current is induced in the magnetometer’s superconducting pickup coils, connected to the SQUID sensor, allowing the determination of the magnetic moment . After averaging measurements performed for successive probe field cycles, is fitted to an equation of the form [75, *QD-IntroAC]
| (1) |
where represents any dc offset or drift in field or temperature, and and are respectively related to and as
| (2) |
Recalling that , if the total applied magnetic field is , then . Hence, the above measurement protocol can be used in combination with a dc applied magnetic field to gauge the sample susceptibility in different points of the curve.
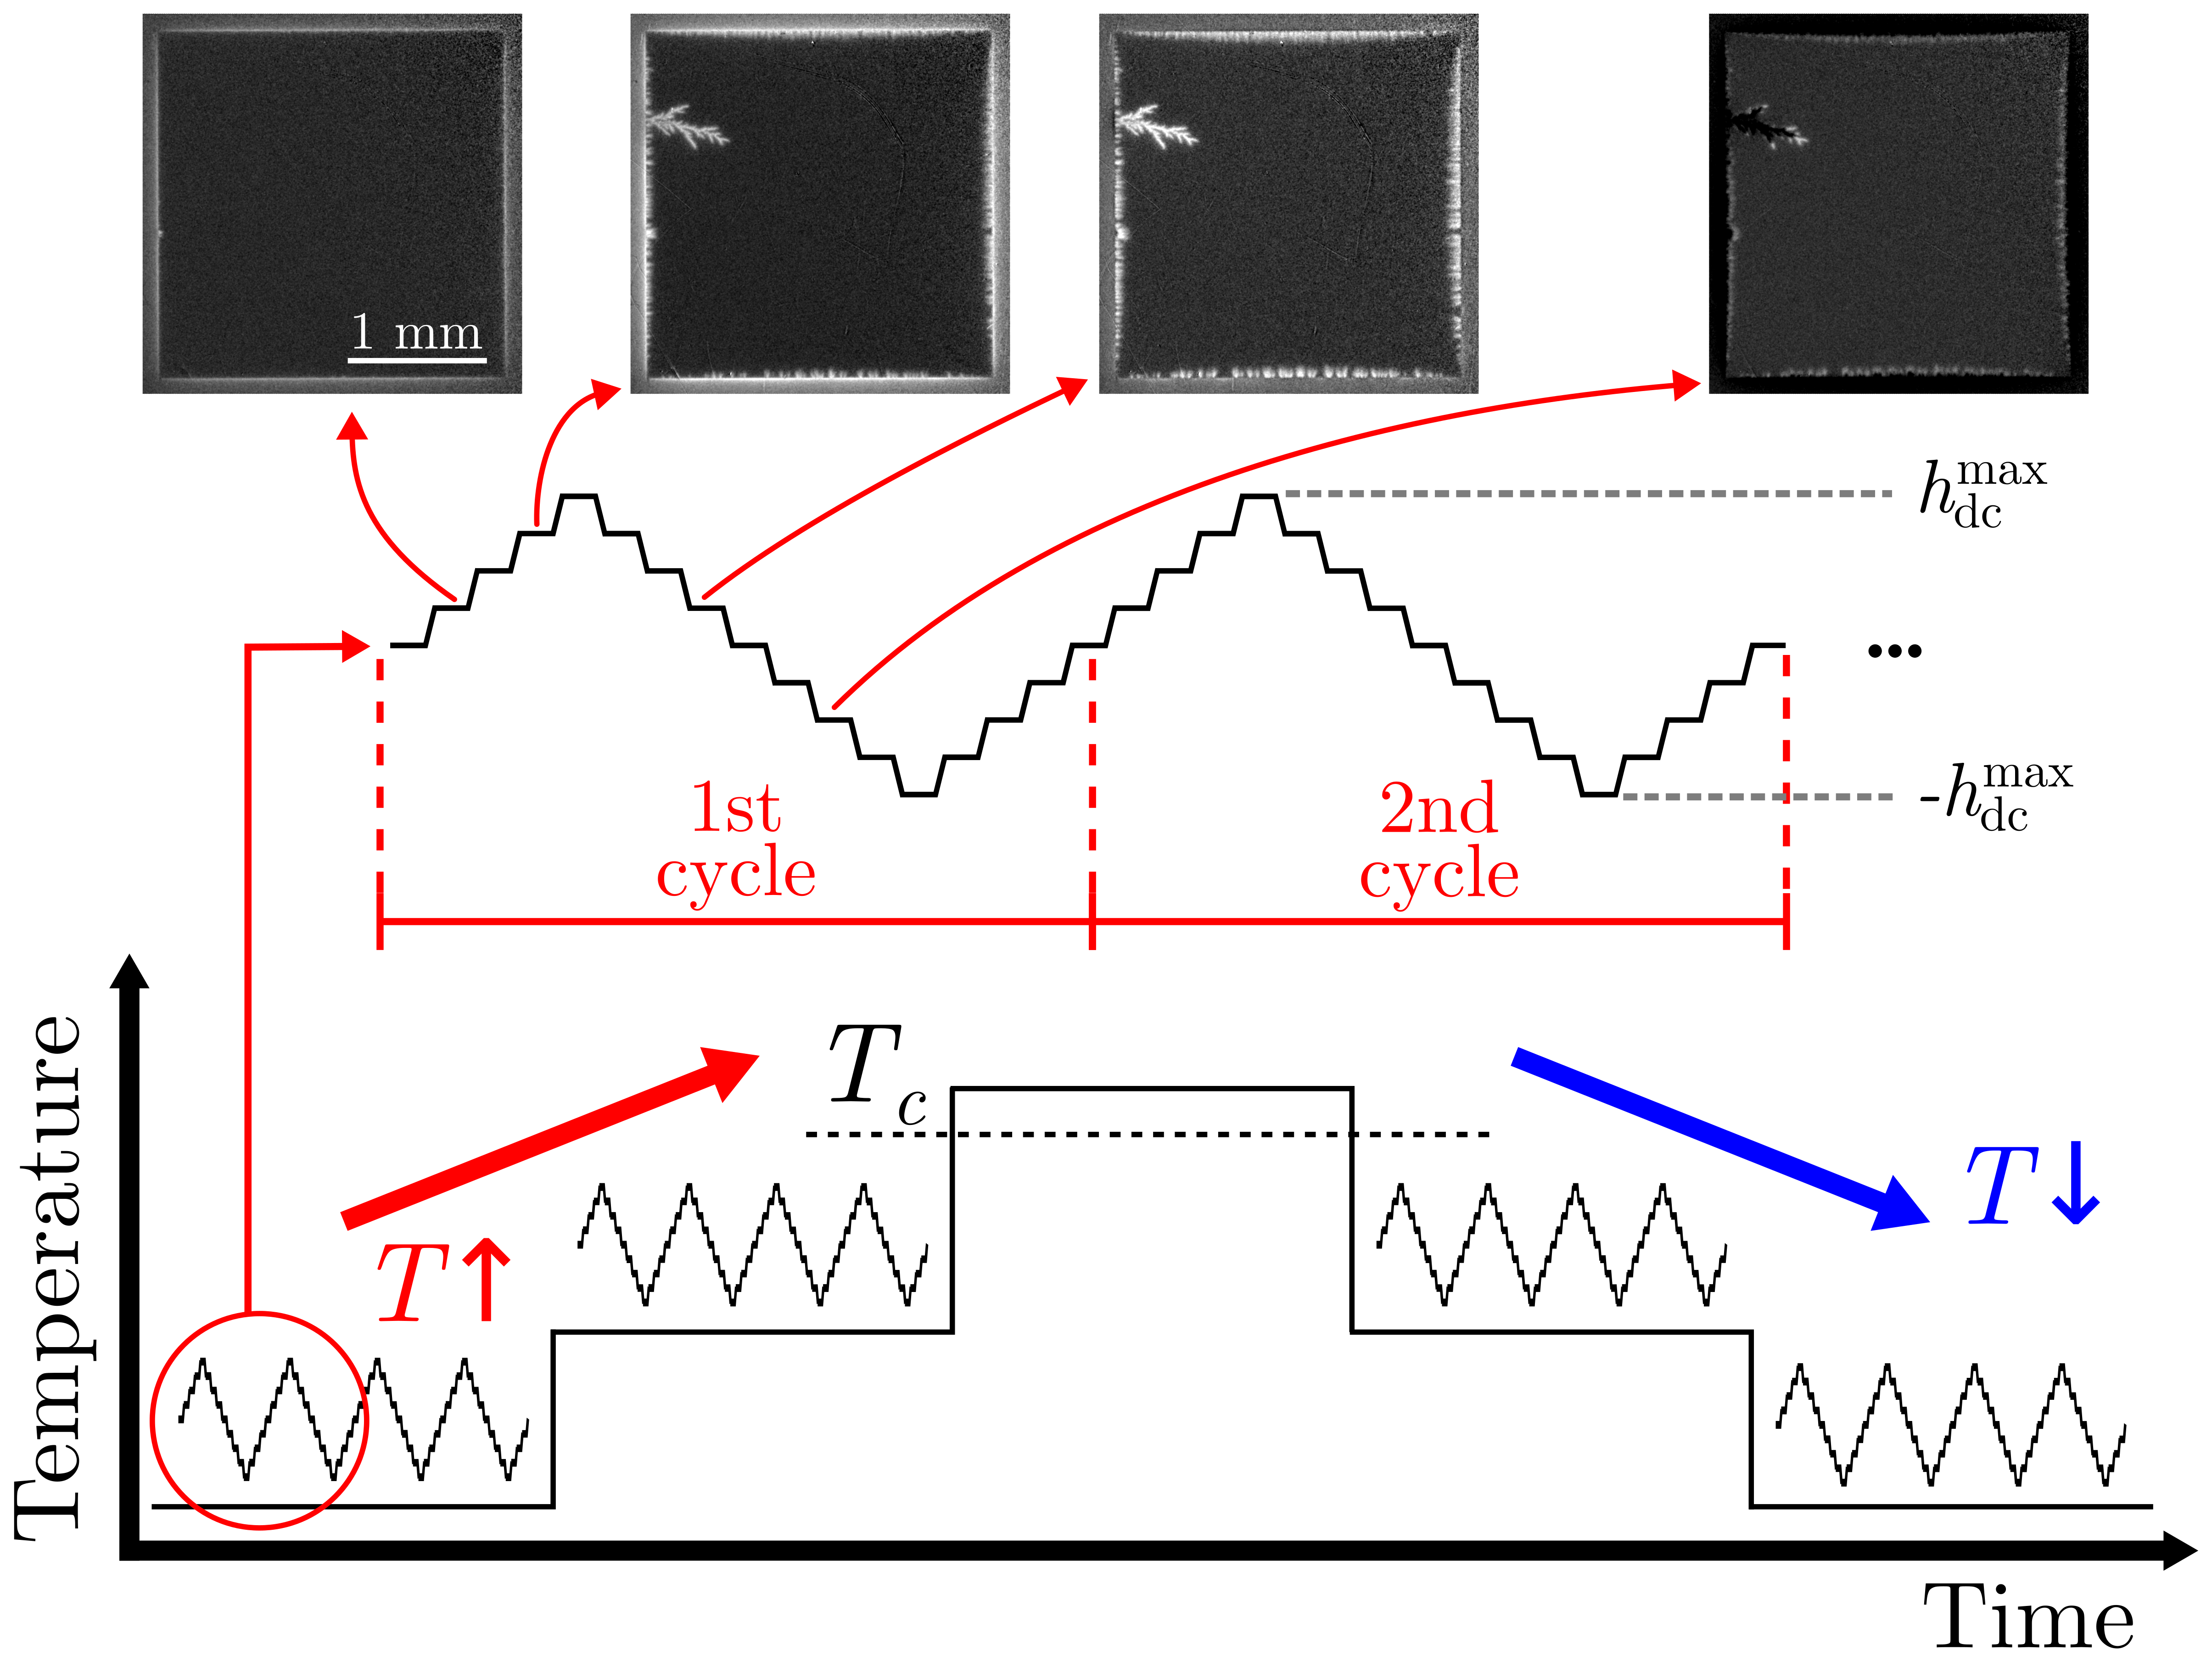
The process to emulate ac measurements using a magneto-optical imaging setup equipped with a dc magnetic field source was first introduced by Ref. [52]. Here, we refer to such measurements as acMOI. To summarize the process, the dc field is incremented in stair-like steps until it reaches a preset maximum amplitude . After each field step, a MO image is recorded. Then, keeping the same step size, the applied field is reduced to and, finally, increased to zero. This routine reproduces one ac field cycle and it is schematically presented in Fig. 2. Although the data acquisition rate of the acMOI technique is substantially slower than the MPMS ac magnetic field source, by successively repeating the above routine, we may take advantage of the frequency-independent nature of the first harmonic to capture ac effects in the investigated sample. We are also capable of varying external parameters, such as the temperature or an additional dc field, allowing investigations of their effects on the sample. Following, we will explore this ability to qualitatively visualize how magnetic flux penetrates the superconducting a-MoSi film during typical temperature-dependent ac susceptibility measurements, both in the smooth and in the avalanche regimes.
IV.1 Smooth penetration regime
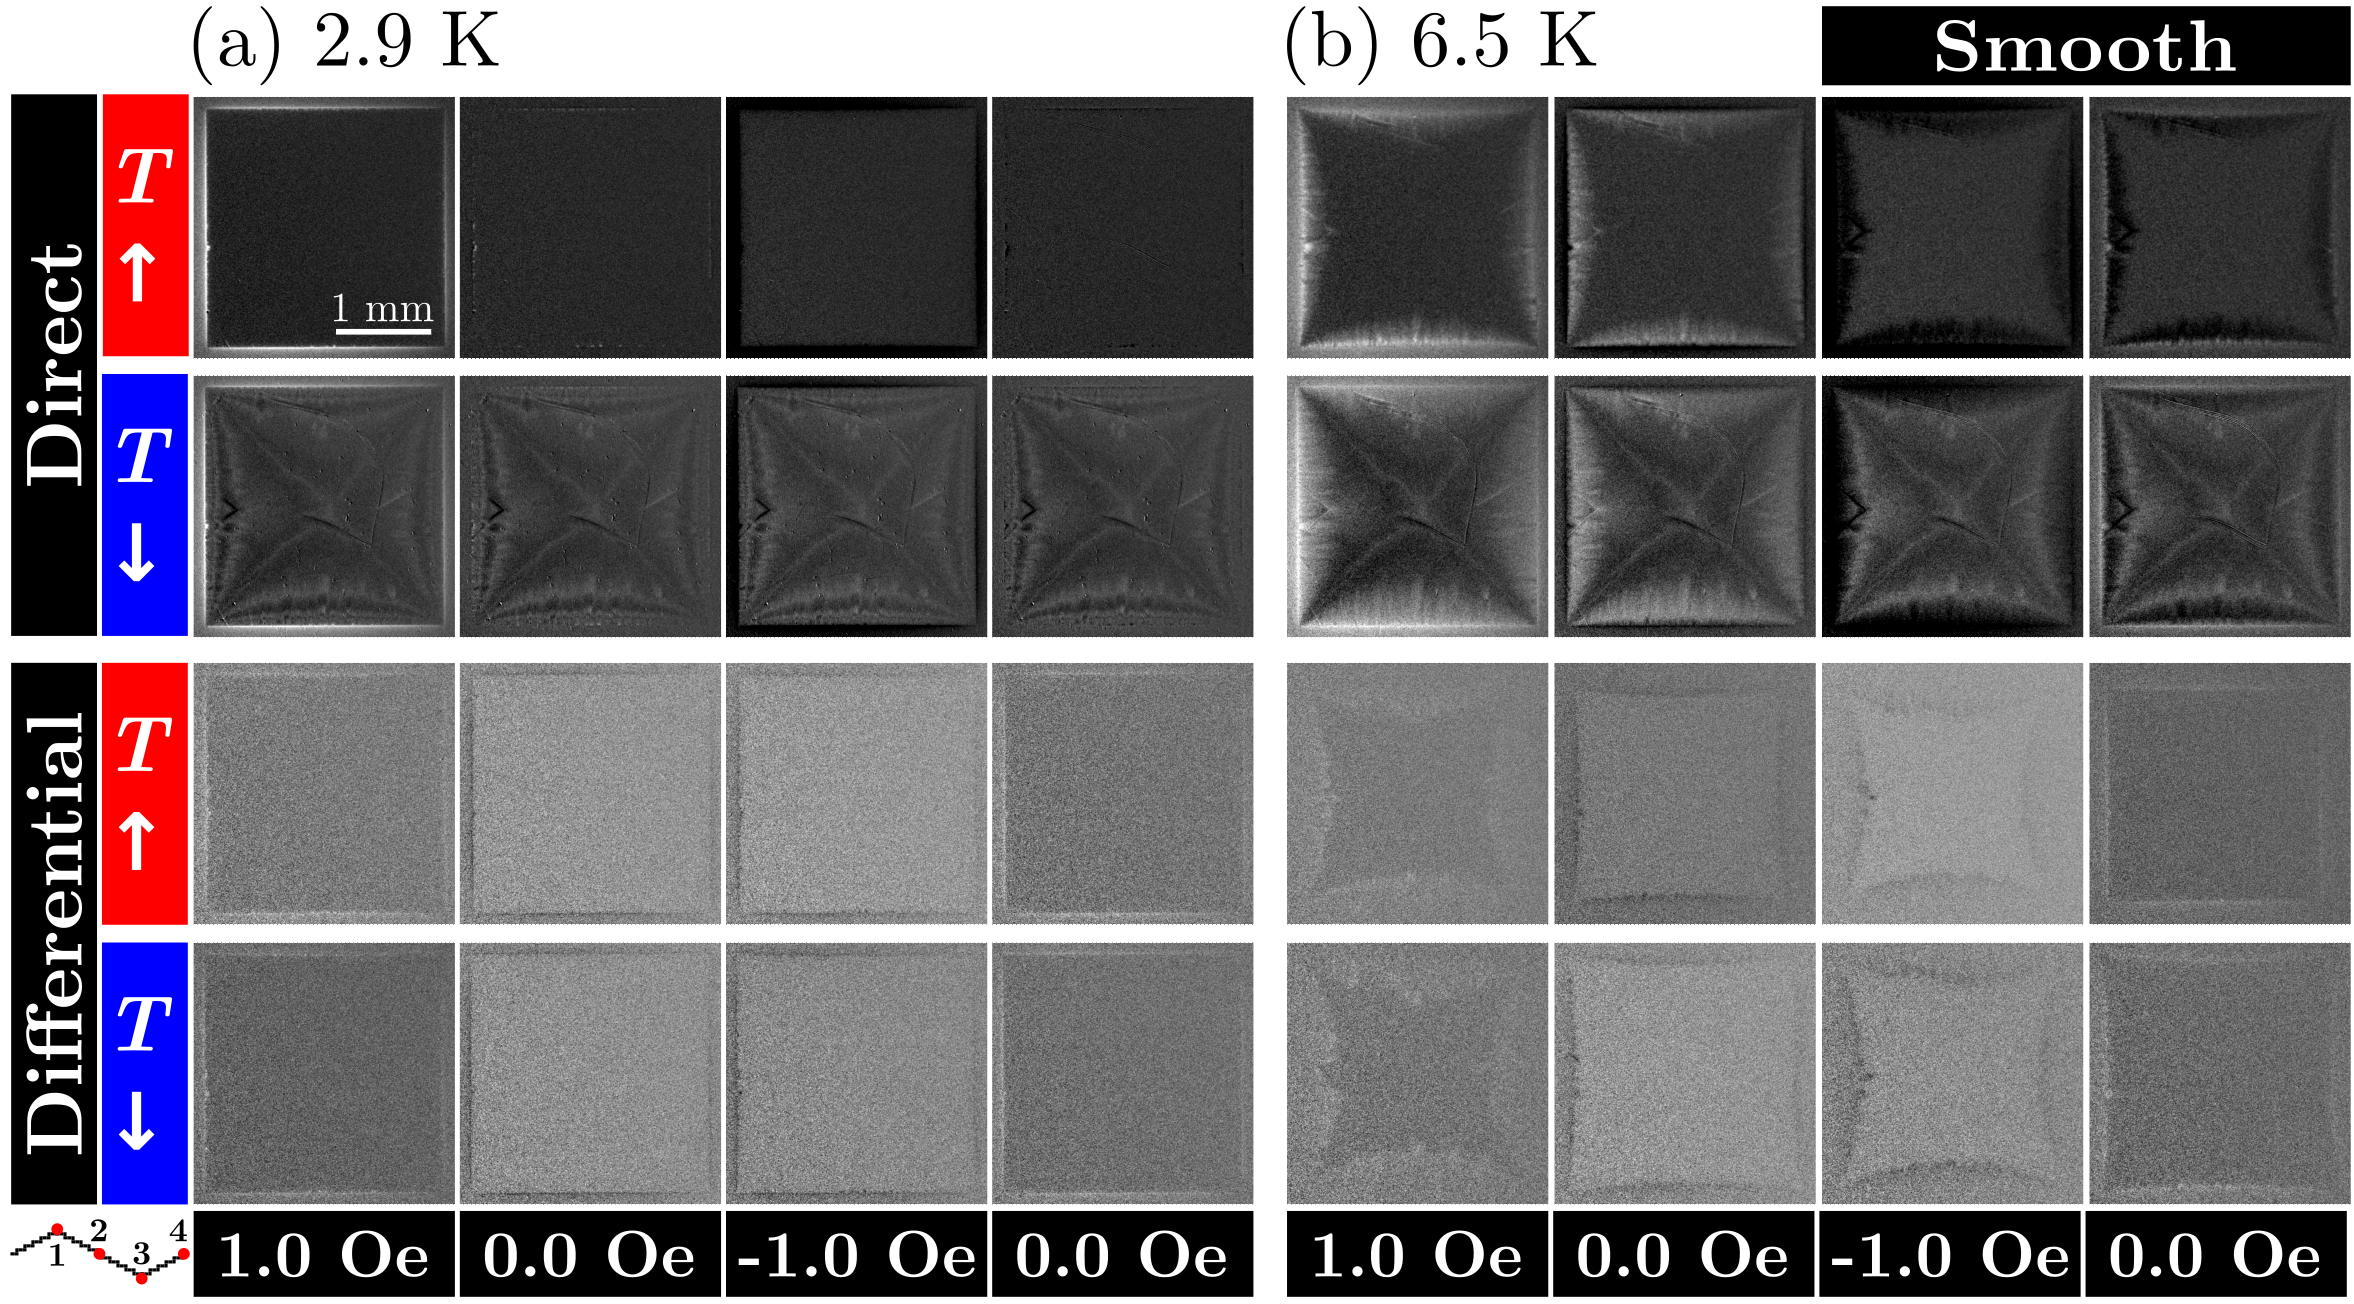
Figure 3 exemplifies results obtained for the a-MoSi film following the acMOI procedure. In this case, = 1.0 Oe, corresponding to the situation in which the film remains in the smooth regime for all temperatures below , as revealed by Fig. 1(a). The first row of Fig. 3(a) shows MO images as directly obtained during the first field cycle after the sample was zero-field-cooled to the base temperature of 2.9 K. A schematic representation of the point in the field cycle at which each of the four images is captured is presented at the lower left corner of Fig. 3. The first image reveals a shallow bright region surrounding the darker inner region of the square film at 1.0 Oe. As discussed previously, such a bright region represents the small flux front able to penetrate the superconductor at lower temperatures and ac field amplitudes, due to its elevated shielding capacities. As the field cycle continues, the second image, taken at 0 Oe, reveals that some positive flux remains trapped in the sample, but the edges of the film no longer appear in bright contrast as the flux polarity is being reversed in that region. In the third image, taken at Oe, the flux inside the superconductor has completely reversed its sign and appears now in dark contrast, signaling its negative intensity. Finally, the fourth image, at 0 Oe, reveals some trapped negative flux in the interior of the sample, but the edges again indicate the reversal of the applied field. The ac-emulated field cycle is repeated a total of four times before the temperature is increased and set to 3.5 K, 4.0 K, 4.5 K, 5.0 K, 5.5 K, 6.0 K, 6.5 K, and 7.0 K, every time repeating the field cycle four times and collecting a MO image after each field step of 0.1 Oe. We will refer to this data as the experiment. The first row of images of Fig. 3(b) shows results obtained at 6.5 K as the temperature is increased after ZFC. They are analogous to those obtained at 2.9 K, however, the flux front penetrates deeper into the film due to its reduced shielding capability near .
Then, the temperature is risen above in the absence of an applied magnetic field, erasing the magnetic history of the sample. After that, is progressively reduced back to the base temperature while subjecting the sample to four ac-emulating field cycles at the same set temperatures listed before. This is the experiment. The second row in Fig. 3(a) shows the MO images recorded at 2.9 K during this experiment, i.e., after was reduced from above . Although the temperature is the same, the flux landscapes inside the superconductor in the first and second rows of Fig. 3(a) are completely different. For the images taken during the experiment, the complete magnetic history of the sample due to the successive field cycles is retained by the film. This happens because higher temperatures enable further flux penetration, therefore the flux trapped in the most inner regions of the sample is not superimposed by new field cycles at lower temperatures. Accordingly, the MO images obtained at 6.5 K as is reduced, shown in the second row of Fig. 3(b), differ from those presented in the first row. In this case, the sample was previously subjected to four ac-emulating field cycles at 7.0 K, resulting in the observed trapped flux in the interior of the film.
After these observations, it may be natural to ask why such different flux distributions lead to the indistinguishable observed in the smooth regime in Fig. 1(b) for increasing and decreasing temperatures. To understand this, it is necessary to remember that ac susceptibility is a measurement of the flux variation in the material as the applied field is changed, rather than its total magnetic moment. To gauge flux variation due to the variation of an applied field using MOI, we may turn to what is called differential MOI [77]. This approach consists of subtracting the measured flux density distribution in a given MO image from that obtained in the previous field step. In other words, , where represents the MO image number, chronologically increasing from the first to the last image obtained in a given data set.
The third and fourth rows of Figs. 3(a) and (b) show differential MO images of the same images represented in the first two rows of each figure. The results demonstrate that, although the flux distribution in the superconductor is vastly different depending on its thermomagnetic history, the flux variation within an ac field cycle does not present significant differences for measurements conducted while increasing or decreasing the sample temperature—given that the probe field amplitude and frequency are kept the same. This notion explains why does not depend on the sample’s thermomagnetic history in the smooth regime. In the Supplemental Material [[SeeSupplementalMaterialat][forvideoshighlightingaspectsofthefluxpenetrationdynamicsrevealedinthemaintext.]supp], a video highlights this behavior for all MO images obtained during the four field cycles at temperatures of 2.9 K, 3.8 K, 4.5 K, 5.5 K, and 6.5 K.
IV.2 Flux avalanches regime
Figure 4 presents results obtained by acMOI for an applied field with amplitude of = 2.4 Oe. As revealed in Fig. 1, such a probe field will lead to the nucleation of flux avalanches in the a-MoSi film for temperatures lower than . These abrupt, non-critical-state-like flux penetration events have a characteristic dendritic morphology observable in several MO images in Fig. 4. Such a strong flux variation leads to the paramagnetic reentrance region in measurements. The acMOI results in the avalanche regime were obtained using a field step of 0.2 Oe and values of 2.9 K, 3.5 K, 3.8 K, 4.5 K, 5.0 K, 5.5 K, 6.0 K, 6.5 K, and 7.0 K.
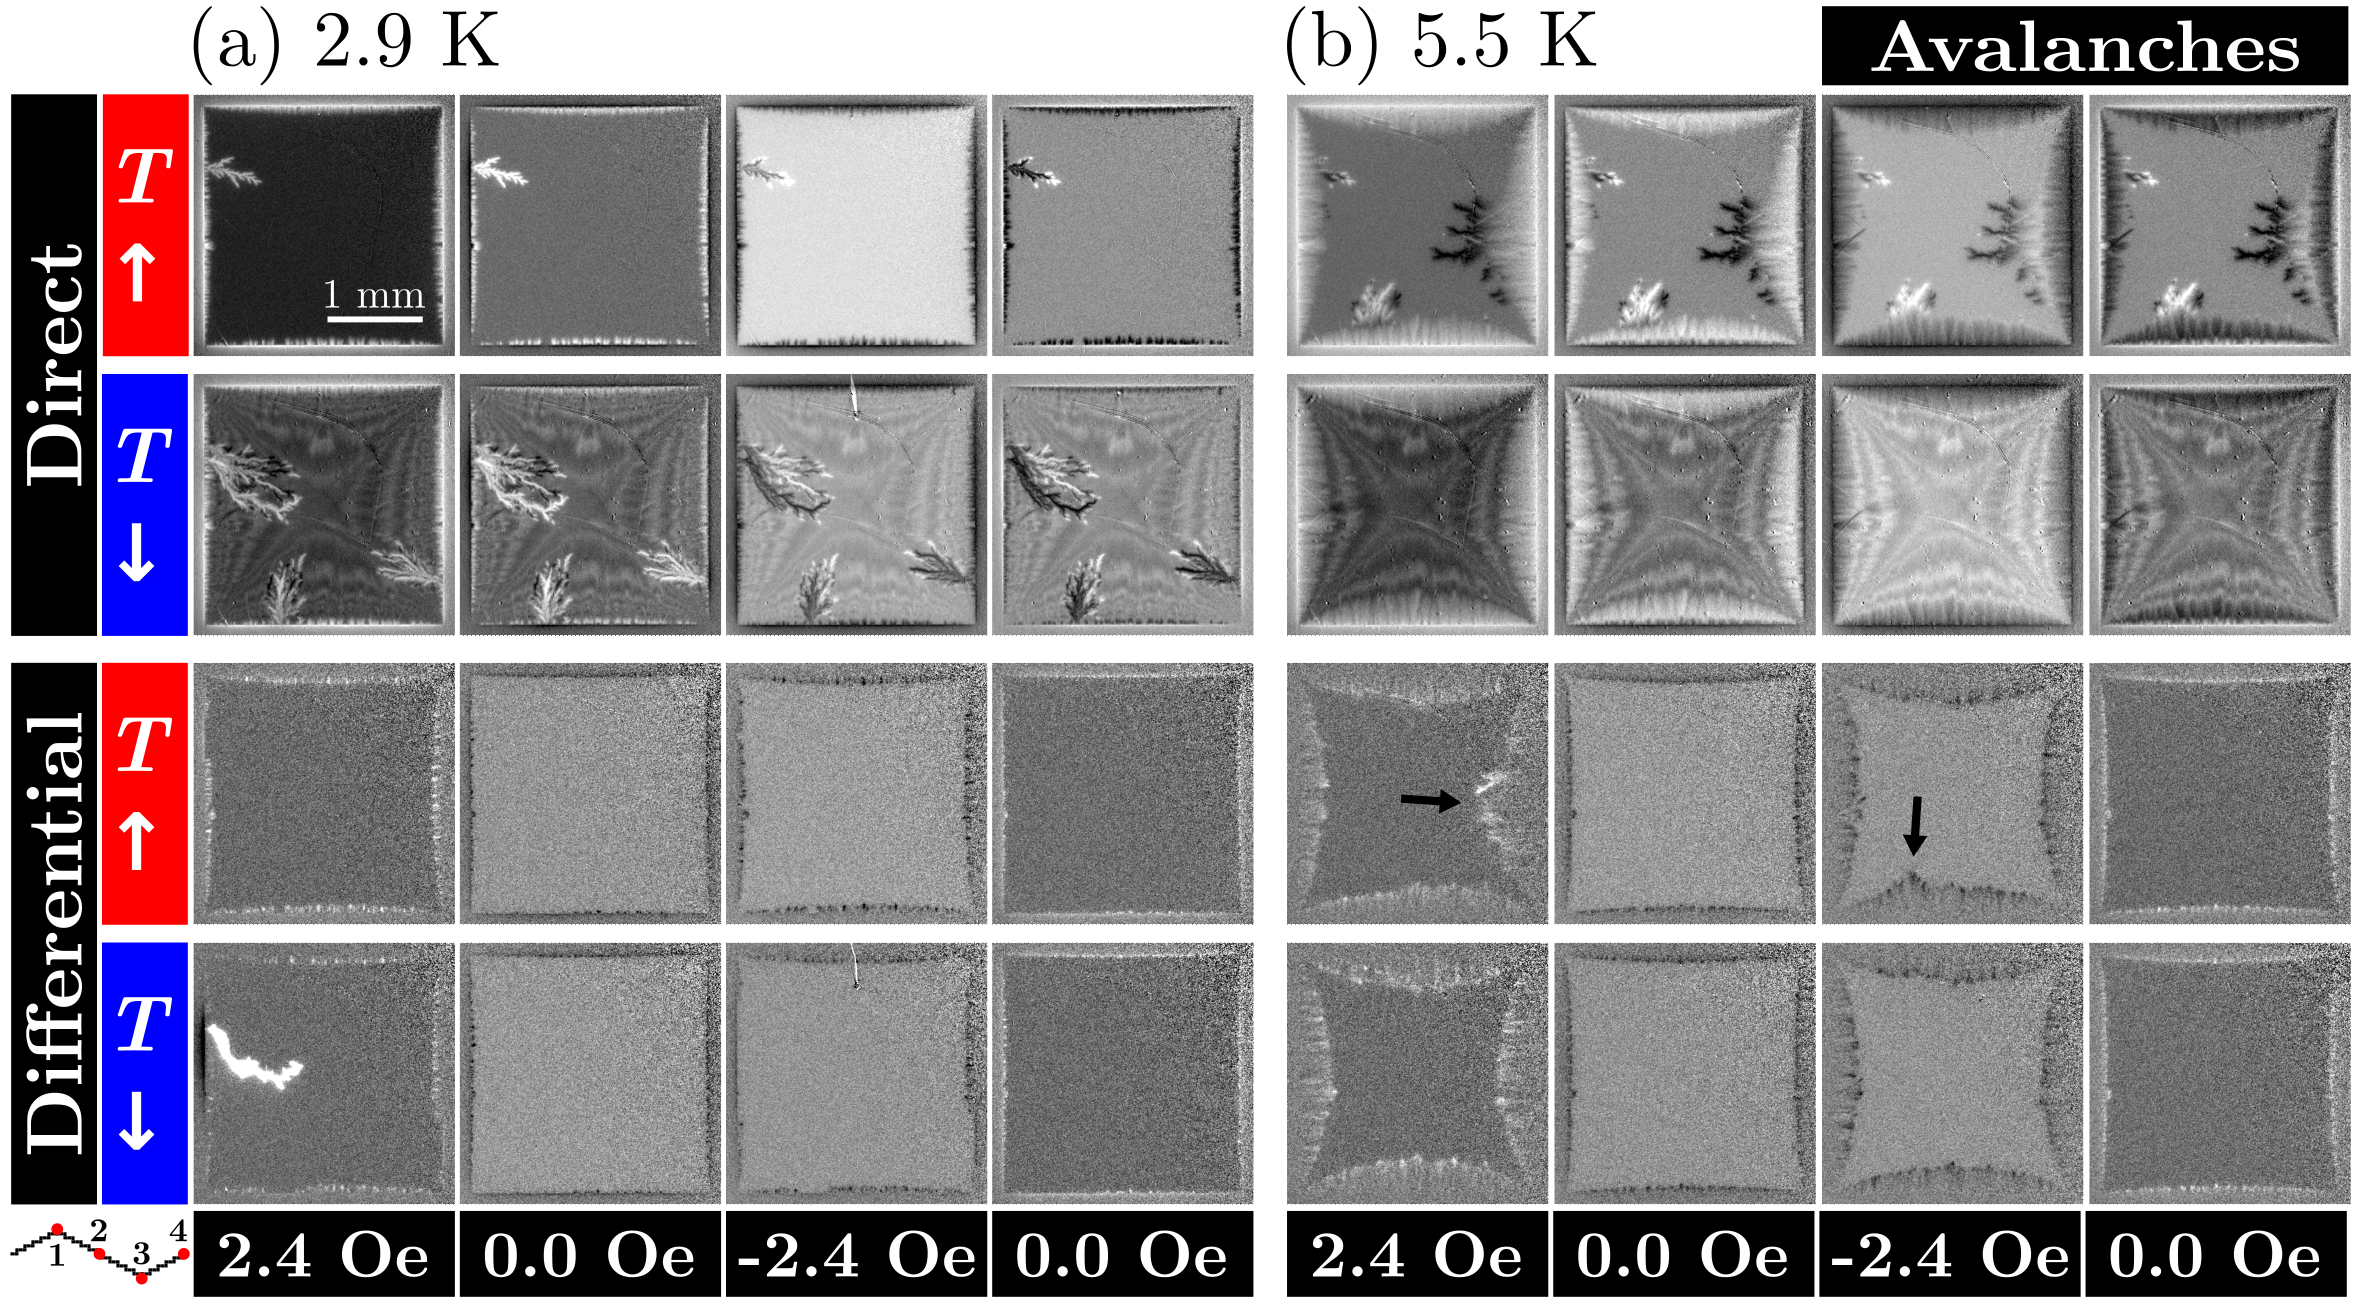
The interpretation of Fig. 4 is analogous to that of Fig. 3. A series of MO images are taken within the same ac-emulating field cycle both as is increased after ZFC to 2.9 K and as is decreased after the magnetic history of the sample is erased above . Figure 4(a) shows images taken at 2.9 K and, hence, below . In the first row, the first image reveals that a positive flux avalanche was triggered in the film, advancing further into the interior of the sample than the shallow critical-state-like bright flux front. Then, as revealed by the third image, a new, negative flux avalanche, or anti-avalanche, was triggered, reusing the flux channel created by the first positive avalanche [52, 79]. The differential MOI analysis on the third row of Fig. 4(a) allows us to conclude that the avalanches appearing in the first row were not triggered on the depicted images, but as was ramped from zero to 2.4 Oe and, then, from 2.4 Oe to Oe. This is the case because the differential flux distributions do not show any signs of abrupt flux intake by the sample. On the other hand, analysis of the second and fourth rows of Fig. 4(a) reveals that a positive flux avalanche was triggered in the sample at 2.4 Oe. The differential image allows us to clearly distinguish this specific penetration event from the complex flux landscape presented by the sample.
In the case depicted in Fig. 4(b), = 5.5 K . Even though previously triggered avalanches are visible in the first row of images, all flux penetration at this temperature occurs smoothly from the edges of the film. Hence, the very different flux landscapes in the first and second rows lead to similar differential flux patterns, shown in the third and fourth rows of Fig. 4(b). These results are compatible with those in Fig. 1, as the sample is in the smooth regime above . However, if we now compare the differential images below at 2.9 K, we see that, contrary to the smooth penetration regime, there is not a match between each corresponding image due to the nucleation of flux avalanches. In the Supplemental Material, a video highlights this fact, showing distinct differential flux distributions each time an avalanche occurs in the film either as is increased or decreased and at different temperatures.
Such a difference in behavior in the avalanche regime, coupled with the unpredictable nature of these events, seems to indicate that there should not be a match between independent measurements. Nevertheless, we do observe in Fig. 1(b) very similar behaviors as varies up or down. To understand why this happens, we will rely on the potential of MOI as a quantitative analysis tool, as its spatial resolution allows the study of individual avalanches in a manner that is not possible with standard magnetometers like the MPMS.
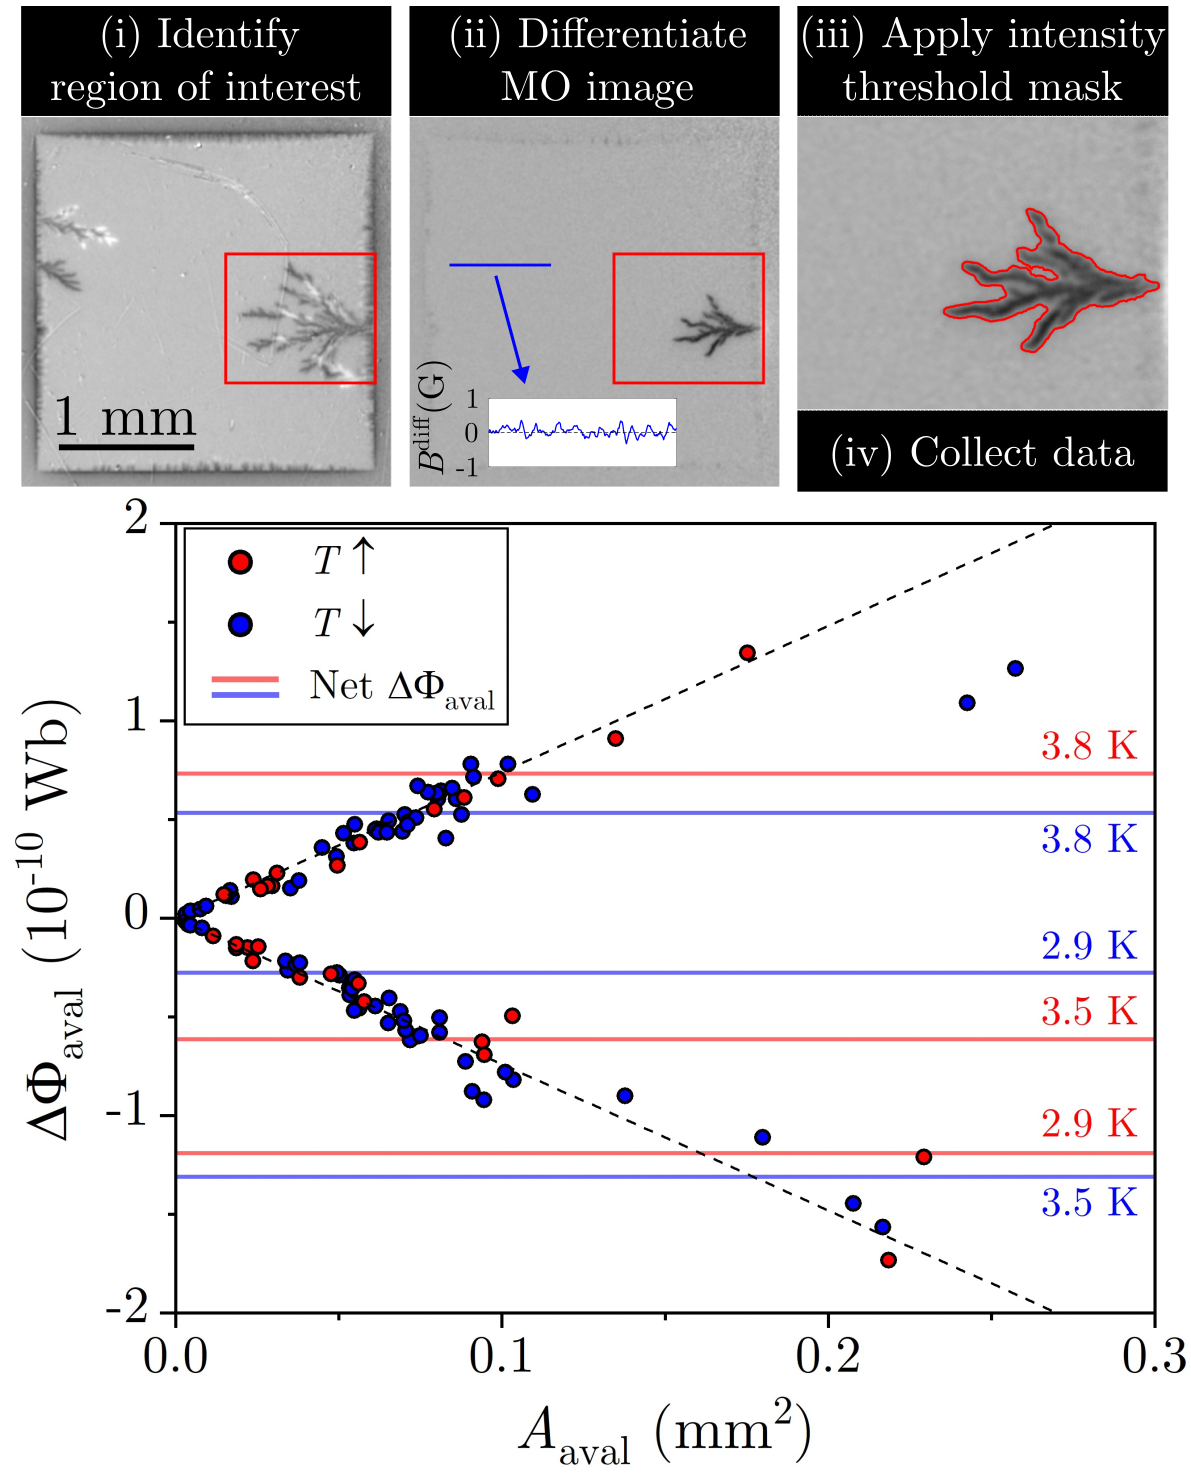
The first image of the forth row of Fig. 4(a) indicates how we may extract information on individual avalanches. By differentiating an image in which an avalanche event occurs, we are able to highlight it from the rest of the sample’s flux landscape. To harness this possibility and study all avalanches triggered in the a-MoSi film during our measurements, we implemented an algorithm in MATLAB, schematically represented in the top row of Fig. 5. As multiple avalanches may occur simultaneously in different parts of the sample, we first select the region of the film which will be analyzed. Then, we differentiate the MO images, resulting in a distribution around zero outside of the smooth flux front and the avalanches. However, avalanches result in much more intense flux variation than critical-state-like penetration. This allows the algorithm to identify every image in which an avalanche was triggered. Moreover, it is possible to clearly separate the avalanches from the rest of the image by applying an intensity threshold mask over the selected avalanche region. This mask can be used either on the directly obtained MO image or on the differential flux distribution, allowing the investigation of different quantities.
Using this algorithm, we analysed all 3474 MO images obtained using the ac-emulated field cycles with = 2.4 Oe. In those, a total of 105 flux avalanches were triggered. Table 1 specifies the distribution of these avalanches between different temperatures. It also highlights if the avalanches were triggered while increasing or decreasing as well as if they are comprised of positive or negative flux. These statistics reveal that many more avalanches occur when the temperature is being reduced from above . This difference is related to the established flux landscape within the sample, clearly visible on the second image row in Fig. 4. As the sample is fully penetrated by vortices, the probability of triggering thermomagnetic instabilities increases [80, 81].
| 2.9 K | 3.5 K | 3.8 K | 4.5 K | |
|---|---|---|---|---|
| — Positive flux | 8 | 3 | 3 | 0 |
| — Negative flux | 8 | 6 | 1 | 0 |
| — Positive flux | 19 | 9 | 10 | 1 |
| — Negative flux | 21 | 10 | 6 | 0 |
Once all avalanches were identified, we may calculate the magnetic flux difference in the sample due to each avalanche, , by numerically integrating . Figure 5 shows as is increased and decreased as a function of the avalanche area, . Noticeably, the data reveals a temperature-independent linear relationship between and , as highlighted by the sloped guides to the eye. This may be understood considering the microscopic nature of the mixed state in type-II superconductors, in which quantized flux vortices permeate the sample. The vortex core size is proportional to the coherence length of the material, , whereas the intervortex spacing is related to the penetration depth, [24]. In turn, these quantities evolve in temperature as , which implies that they only vary significantly for temperatures close to . Therefore, the density of vortices is nearly constant in the temperature range for which the film is in the avalanche regime, leading to the behavior observed in Fig. 5. The slope of the linear relationship is roughly equal to 0.75 mT, indicating fields slightly above the ones used to trigger the avalanches. This difference is explained by the higher flux concentration along the edges of the thin film due to demagnetization effects [32].
Moreover, the solid horizontal lines in Fig. 5 represent the net calculated by summing for all avalanches that occur at a given set temperature when is increased (red lines) or decreased (blue lines). Although many more avalanches happen during the experiment, the blue lines reveal that the net flux variation they cause in the sample is comparable to that caused by a single avalanche. The same is true during the temperature increase, as shown by the red lines. This fact is associated with the effects of an ac field cycle on the superconducting film. As can be observed in Fig. 4, there is a tendency for new avalanches to reuse the flux channel created by previously nucleated avalanches of opposite polarity. Note that bright and dark contrast avalanches are superimposed in the MO images. This same trend has been previously reported both experimentally [52] and numerically [79]. Such behavior is explained by the attractive nature of the interaction between vortices and antivortices, as well as by the fact that the existing avalanche creates an easy channel of locally reduced critical current density inside the film, facilitating the propagation of magnetic flux. A Supplemental Material video demonstrates that most new avalanches reuse previously existing flux channels. Therefore, these dynamics tend to balance out positive and negative flux variations arising from abrupt penetration events. As the ac susceptibility is measured by averaging the flux variation captured throughout several ac field cycles, the avalanche contributions become very similar in both directions of temperature variation, resulting in the remarkably similar measurements as is increased and decreased, as shown in Fig. 1(b).
V Quantitative ac susceptibility analysis from MOI
In Section IV, we qualitatively discussed the link between differential MO images and ac susceptibility measurements conducted in the MPMS. In this Section, we demonstrate how MOI can be further utilized as a tool for quantitatively studying ac field-induced effects on superconducting films. The in-phase and out-of-phase components of are obtained by acMOI as a function of , which can then be compared to MPMS measurements.
To achieve that, let us first be reminded that is associated with the superconductor inductive response to shield magnetic flux from its interior. Therefore, captures the evolution of the sample magnetization with an applied magnetic field. On the other hand, is associated with a resistive response arising from energy losses, caused by the dissipative flux motion within the superconductor. As discussed in Ref. [82], this energy can be gauged by evaluating the area of the loop, , defined by the application of one ac field cycle. This way, we may obtain the components from ac-emulating MOI cycles as [52]
| (3) |
where the mean magnetization is obtained from the out-of-plane flux density distribution within the sample on a MO image as [52]
| (4) |
where is the number of pixels which correspond to the sample within the MO image. These quantities are calculated for each ac-emulating field cycle at a given temperature in SI units as exemplified in Fig. 6(a-b), which shows typical loops. The results are then averaged for the four cycles to obtain the evolution for the sample.
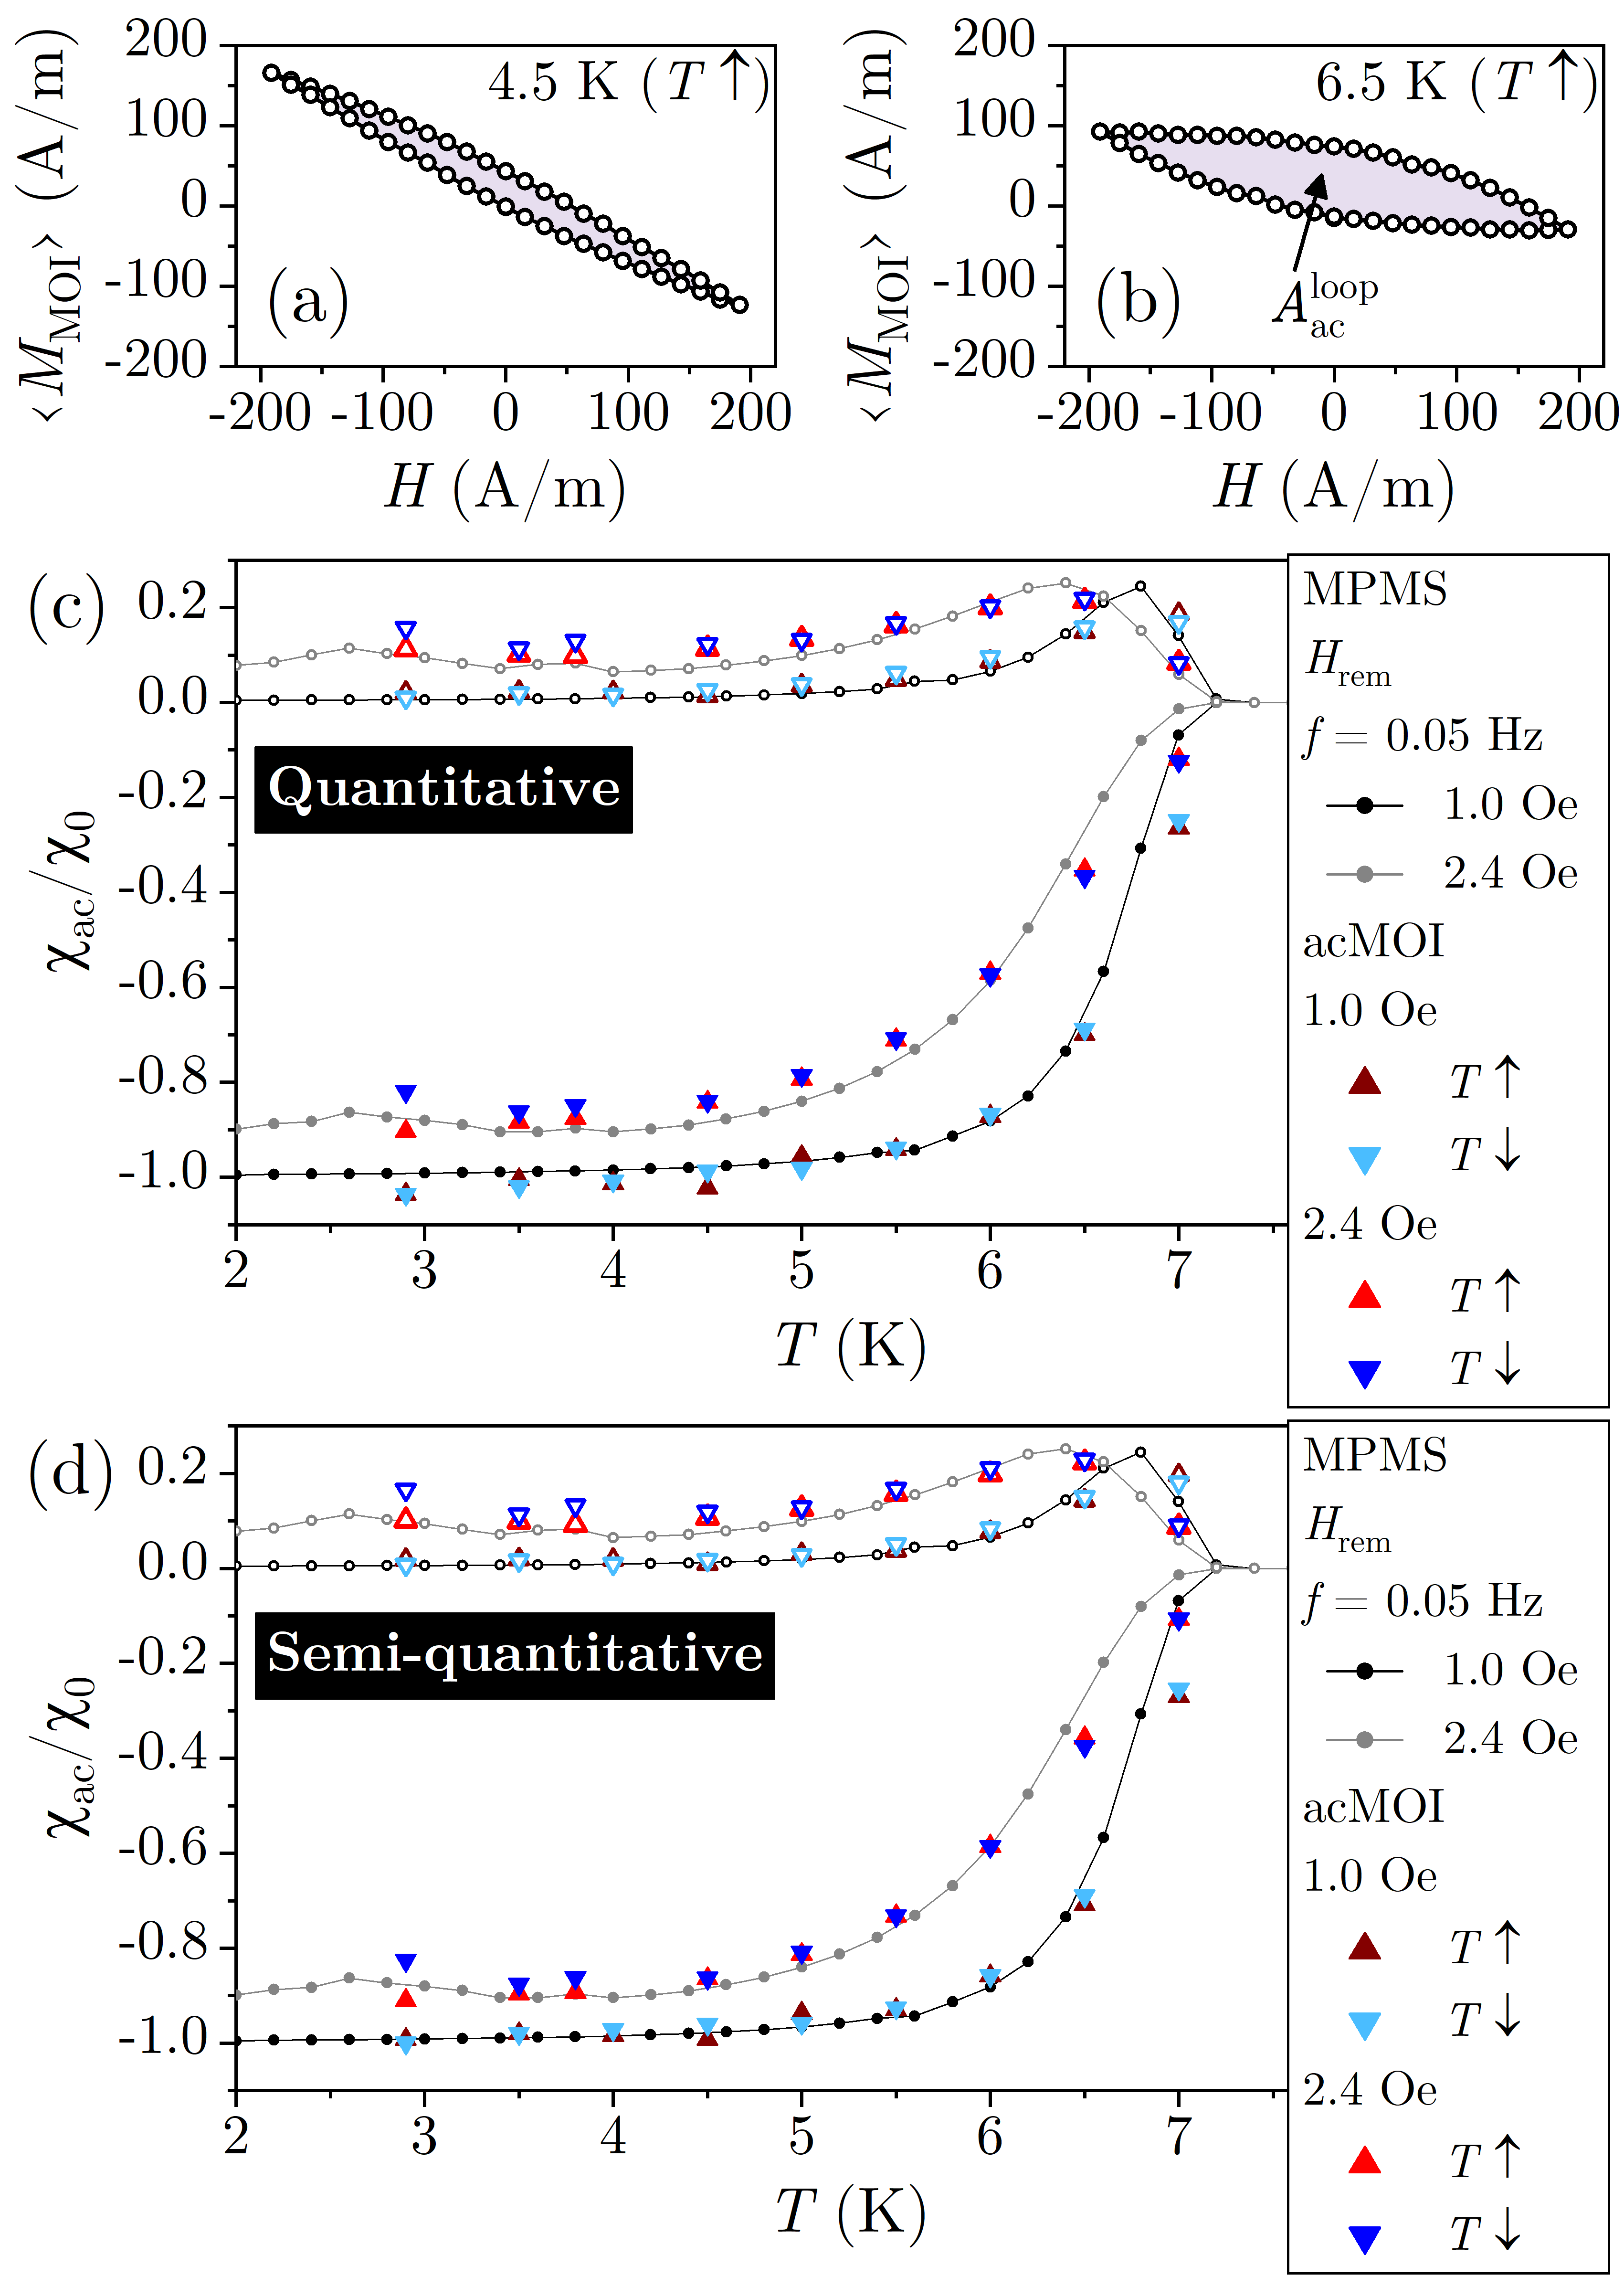
Figure 6(c-d) displays MPMS measurements of for the a-MoSi film using probe fields with = 0.05 Hz and = 1.0 Oe and 2.4 Oe, hence in the smooth and avalanche regimes, respectively. Although the analysis is frequency-independent, this value is chosen to match an “effective” frequency estimated considering a light exposure time of 200 ms during the acMOI measurements, which, in turn, is used to optimize the image contrast. The MPMS data in Fig. 6 is averaged from eight successive field cycles [see Eqs. (1) and (2)]. Although this differs from the four cycles used in the acMOI measurements, Appendix B demonstrates that MPMS results are equivalent for measurements conducted with these numbers of field cycles. Thus, in Fig. 6(c), the MPMS measurements are compared to and quantitatively obtained from the acMOI measurements using Eq. (3), both as the temperature is increased after ZFC and as is decreased from above . There are two main observations in Fig. 6(c). The first is that, despite limitations in the measurement resolution in comparison to SQUID magnetometers and the presence of defects on the MO indicator which could compromise the result, acMOI captures with high fidelity the behavior of both components of , specially at the lower temperatures and ac field amplitudes. When approaches , however, the lower contrast of the MO images induce larger errors, therefore, the acMOI data points at 7 K are detached from those obtained using the MPMS. The second observation is that acMOI captures exceptionally well the independence of on thermomagnetic history in the smooth regime, as and are mostly superimposed in Fig. 6(c). When the film is in the avalanche regime, acMOI also captures the paramagnetic reentrance observed in the MPMS measurements. However, it appears that the technique is more susceptible to differences in the flux landscape in the sample, as measurements conducted as the temperature was decreased resulted in slightly lower values of . Nonetheless, within the natural limitations of the technique, it is possible to accurately investigate the ac susceptibility of a superconducting thin film using ac-emulating MOI.
A semi-quantitative approach can also be used to obtain from acMOI. As highlighted by Eq. (3), the sample magnetization is the crucial ingredient in the calculation of and . , however, is a global parameter, describing the average behavior of the sample. In Fig. 6(c), we obtained this quantity from the local flux density distribution in the film. If we remember that raw MOI data is an intensity count, we may define a mean intensity for each MO image, . Then, using measurements performed above , such that the sample magnetization does not interfere with the flux distribution, we may find a relationship between an applied magnetic field and . Considering that, above , = 0 and , the mean flux density distribution can be found by fitting an empirical polynomial relationship between and 111For the data presented in this work, we found by inspection that a third degree polynomial successfully described the behavior of the mean intensity with the applied magnetic field.. The influence of defects on the MO indicator can be minimized by subtracting the zero-field background from all images.
Once the images are calibrated, the mean sample magnetization in each MO image within an ac-emulating field cycle can be calculated as
| (5) |
Using and Eq. (3), we obtained the results shown in Fig. 6(d). The results are completely analogous and very similar to those depicted in Fig. 6(c), demonstrating the robustness of MOI as a tool to gauge .
VI Erasing flux avalanches
Let us now discuss a side benefit of using quantitative MO data to gain insight into the interaction between an incoming magnetic flux front and the region where an avalanche previously took place. In Fig. 4(b), arrows indicate regions in differential images taken at 2.4 Oe and 2.4 Oe in which positive and negative flux, respectively, penetrate further into the sample than elsewhere. Figure 7 sheds light on this dynamics by highlighting results obtained for the a-MoSi sample at 5 K as is increased from the base temperature after ZFC. Panels (a) and (b) show the same MO images side-by-side, only with different color scales. This is done to evidence different aspects of the flux penetration dynamics.
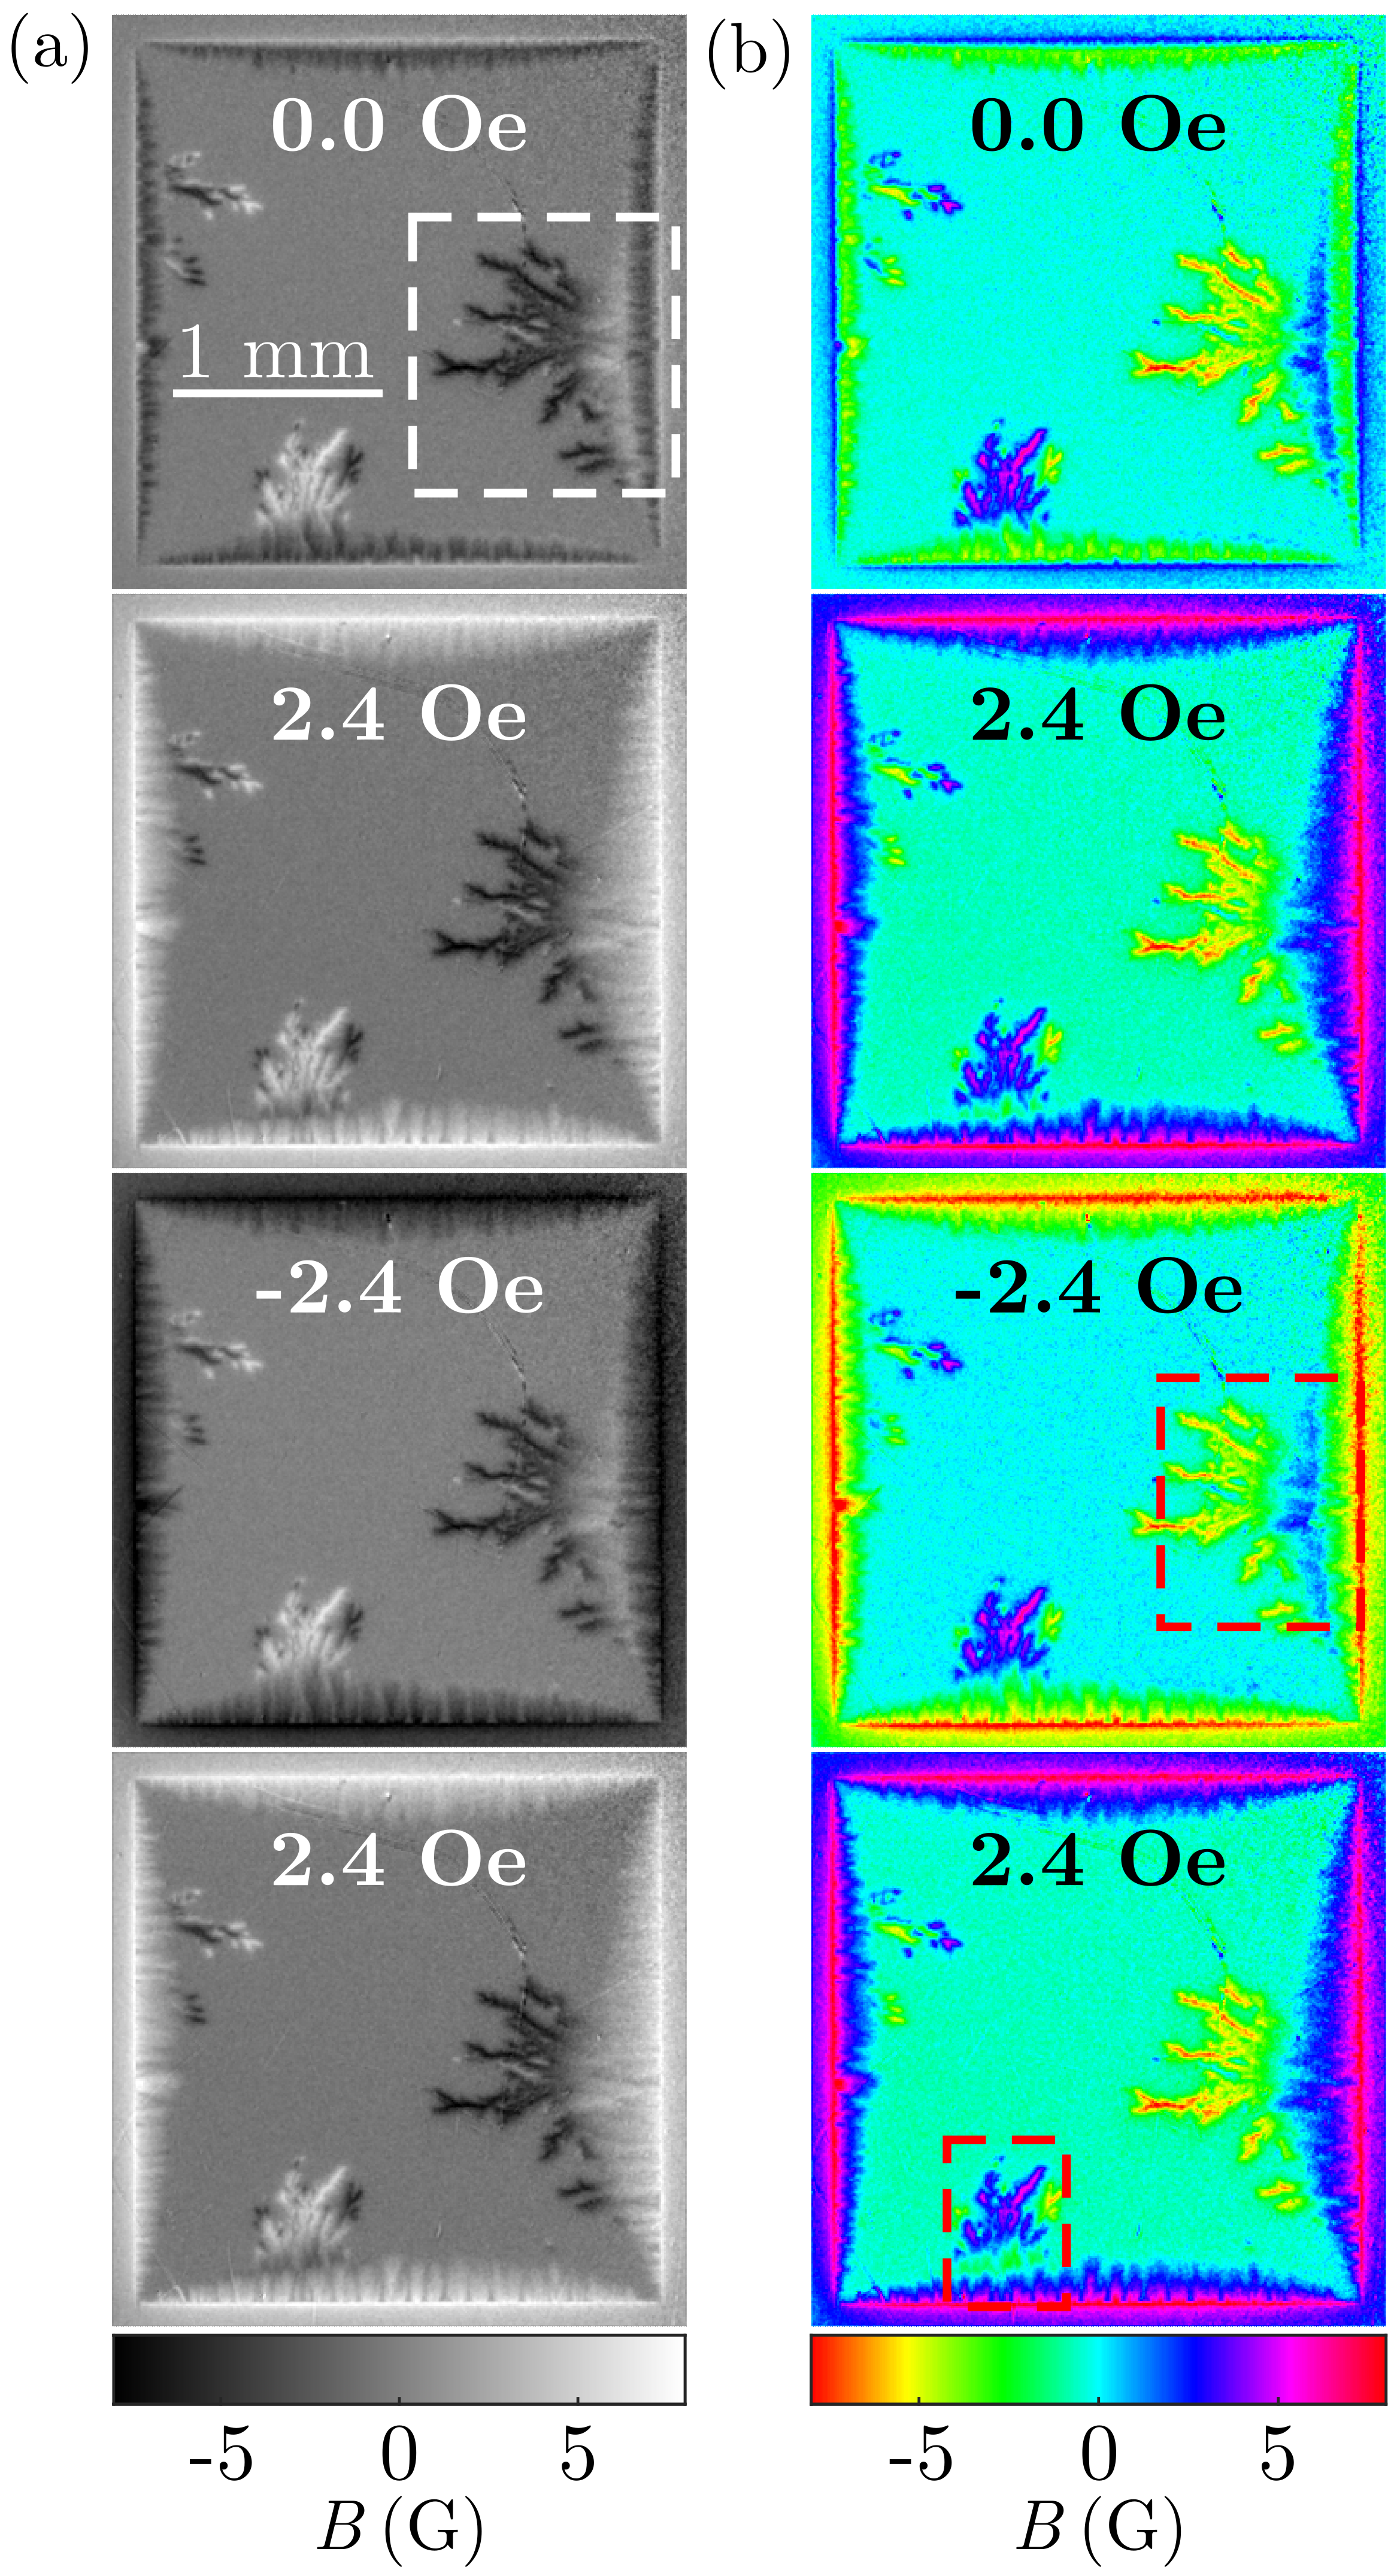
The first image of Fig. 7, taken at 0 Oe, is captured before the ac-emulating magnetic field is applied to the film at 5 K. Therefore, the depicted flux landscape is a result of the 16 ac-emulating field cycles applied to the film at the four previous temperature steps. Noticeably, a number of flux avalanches took place, resulting in the characteristic dendritic flux-filled regions observed in the sample. On the second row, is increased to 2.4 Oe for the first time at 5 K. As previously discussed, this will result in the penetration of a positive, smooth flux front from the edges toward the center of the film. Figure 7(a) illustrates an interesting characteristic of the dynamics of how this flux front interacts with avalanches previously triggered in the film. First, notice the presence of a large negative flux avalanche on the right edge of the film framed by the dashed white rectangle. Then, we may observe that the positive flux front penetrates deeper into the sample where it interacts with the negative avalanche than elsewhere—compare, for instance, the penetration from the right edge with that from the top edge of the sample. Additionally, a medium-sized positive flux avalanche had previously occurred on the bottom-left edge of the film. Near that avalanche, the positive flux front has a shallower penetration than on the right side of the bottom edge. The explanation for such a difference in the flux penetration lies in the nature of the attractive interaction between vortices and antivortices [84], leading to the deeper penetration of the flux front coming from the right edge on the second image of Fig. 7(a). However, if the incoming flux has the same polarity as the pinned flux, it will be repelled, causing the shallower penetration of the positive flux front over the positive avalanche on the bottom edge of the sample.
Moreover, vortices and antivortices will be annihilated if they come in close contact, leaving behind a region of zero net magnetic flux on the superconductor. Figure 7(b) allows us to visualize such vortex-antivortex annihilation regions. Using again the second image of the depicted sequence as a reference, we may look at the right edge of the sample, where the positive (dark-blue) flux front penetrates over the negative (yellow) avalanche. Then, we notice the presence of a zero flux (light-blue) region between the flux front and the avalanche. As vortices penetrate the sample from the right edge, they encounter previously pinned antivortices, leading to mutual annihilation. The resulting flux-free region is then filled by new incoming vortices which, in turn, will be annihilated with further pinned antivortices, in a process that enables the positive flux penetration as the field is increased up to .
In the next step of the ac-emulating field cycle, the field is reduced to . Then, negative (yellow) flux will penetrate the sample from the edges. As observed in the third row of Fig. 7, negative flux penetrates less from the right edge of the sample than the positive flux front did. Moreover, we observe that the negative flux further penetrates over the positive flux avalanche that previously occurred at the bottom edge of the sample. Thus, the negative flux penetration dynamics follow the same behavior observed when a positive flux front penetrates the film. Accordingly, the third image of Fig. 7(b) reveals a vortex-antivortex annihilation zone between the incoming negative flux front and the deeper positive front. Then, inside the dashed red rectangle, we observe beginning from the edge of the sample: a negative flux region, a first annihilation zone, a positive flux region, a second annihilation zone, and, finally, the negative deeply pinned flux where the avalanche propagated through the film. In the fourth image of the depicted sequence, the applied field is once again increased to , leading to positive flux penetration. Now, along the bottom edge, the incoming positive flux penetrates less than the established negative flux over the positive avalanche. This creates the region highlighted by the dashed rectangle on the fourth image of Fig. 7(b), where it is possible to observe a positive flux region, an annihilation zone, a negative flux region, another annihilation zone, and the positive flux pinned after the avalanche penetrated deep into the sample. The Supplemental Material presents a video highlighting the interaction between an incoming flux front with the pre-established avalanches in Fig. 7 at different moments of the ac-emulating field cycle.
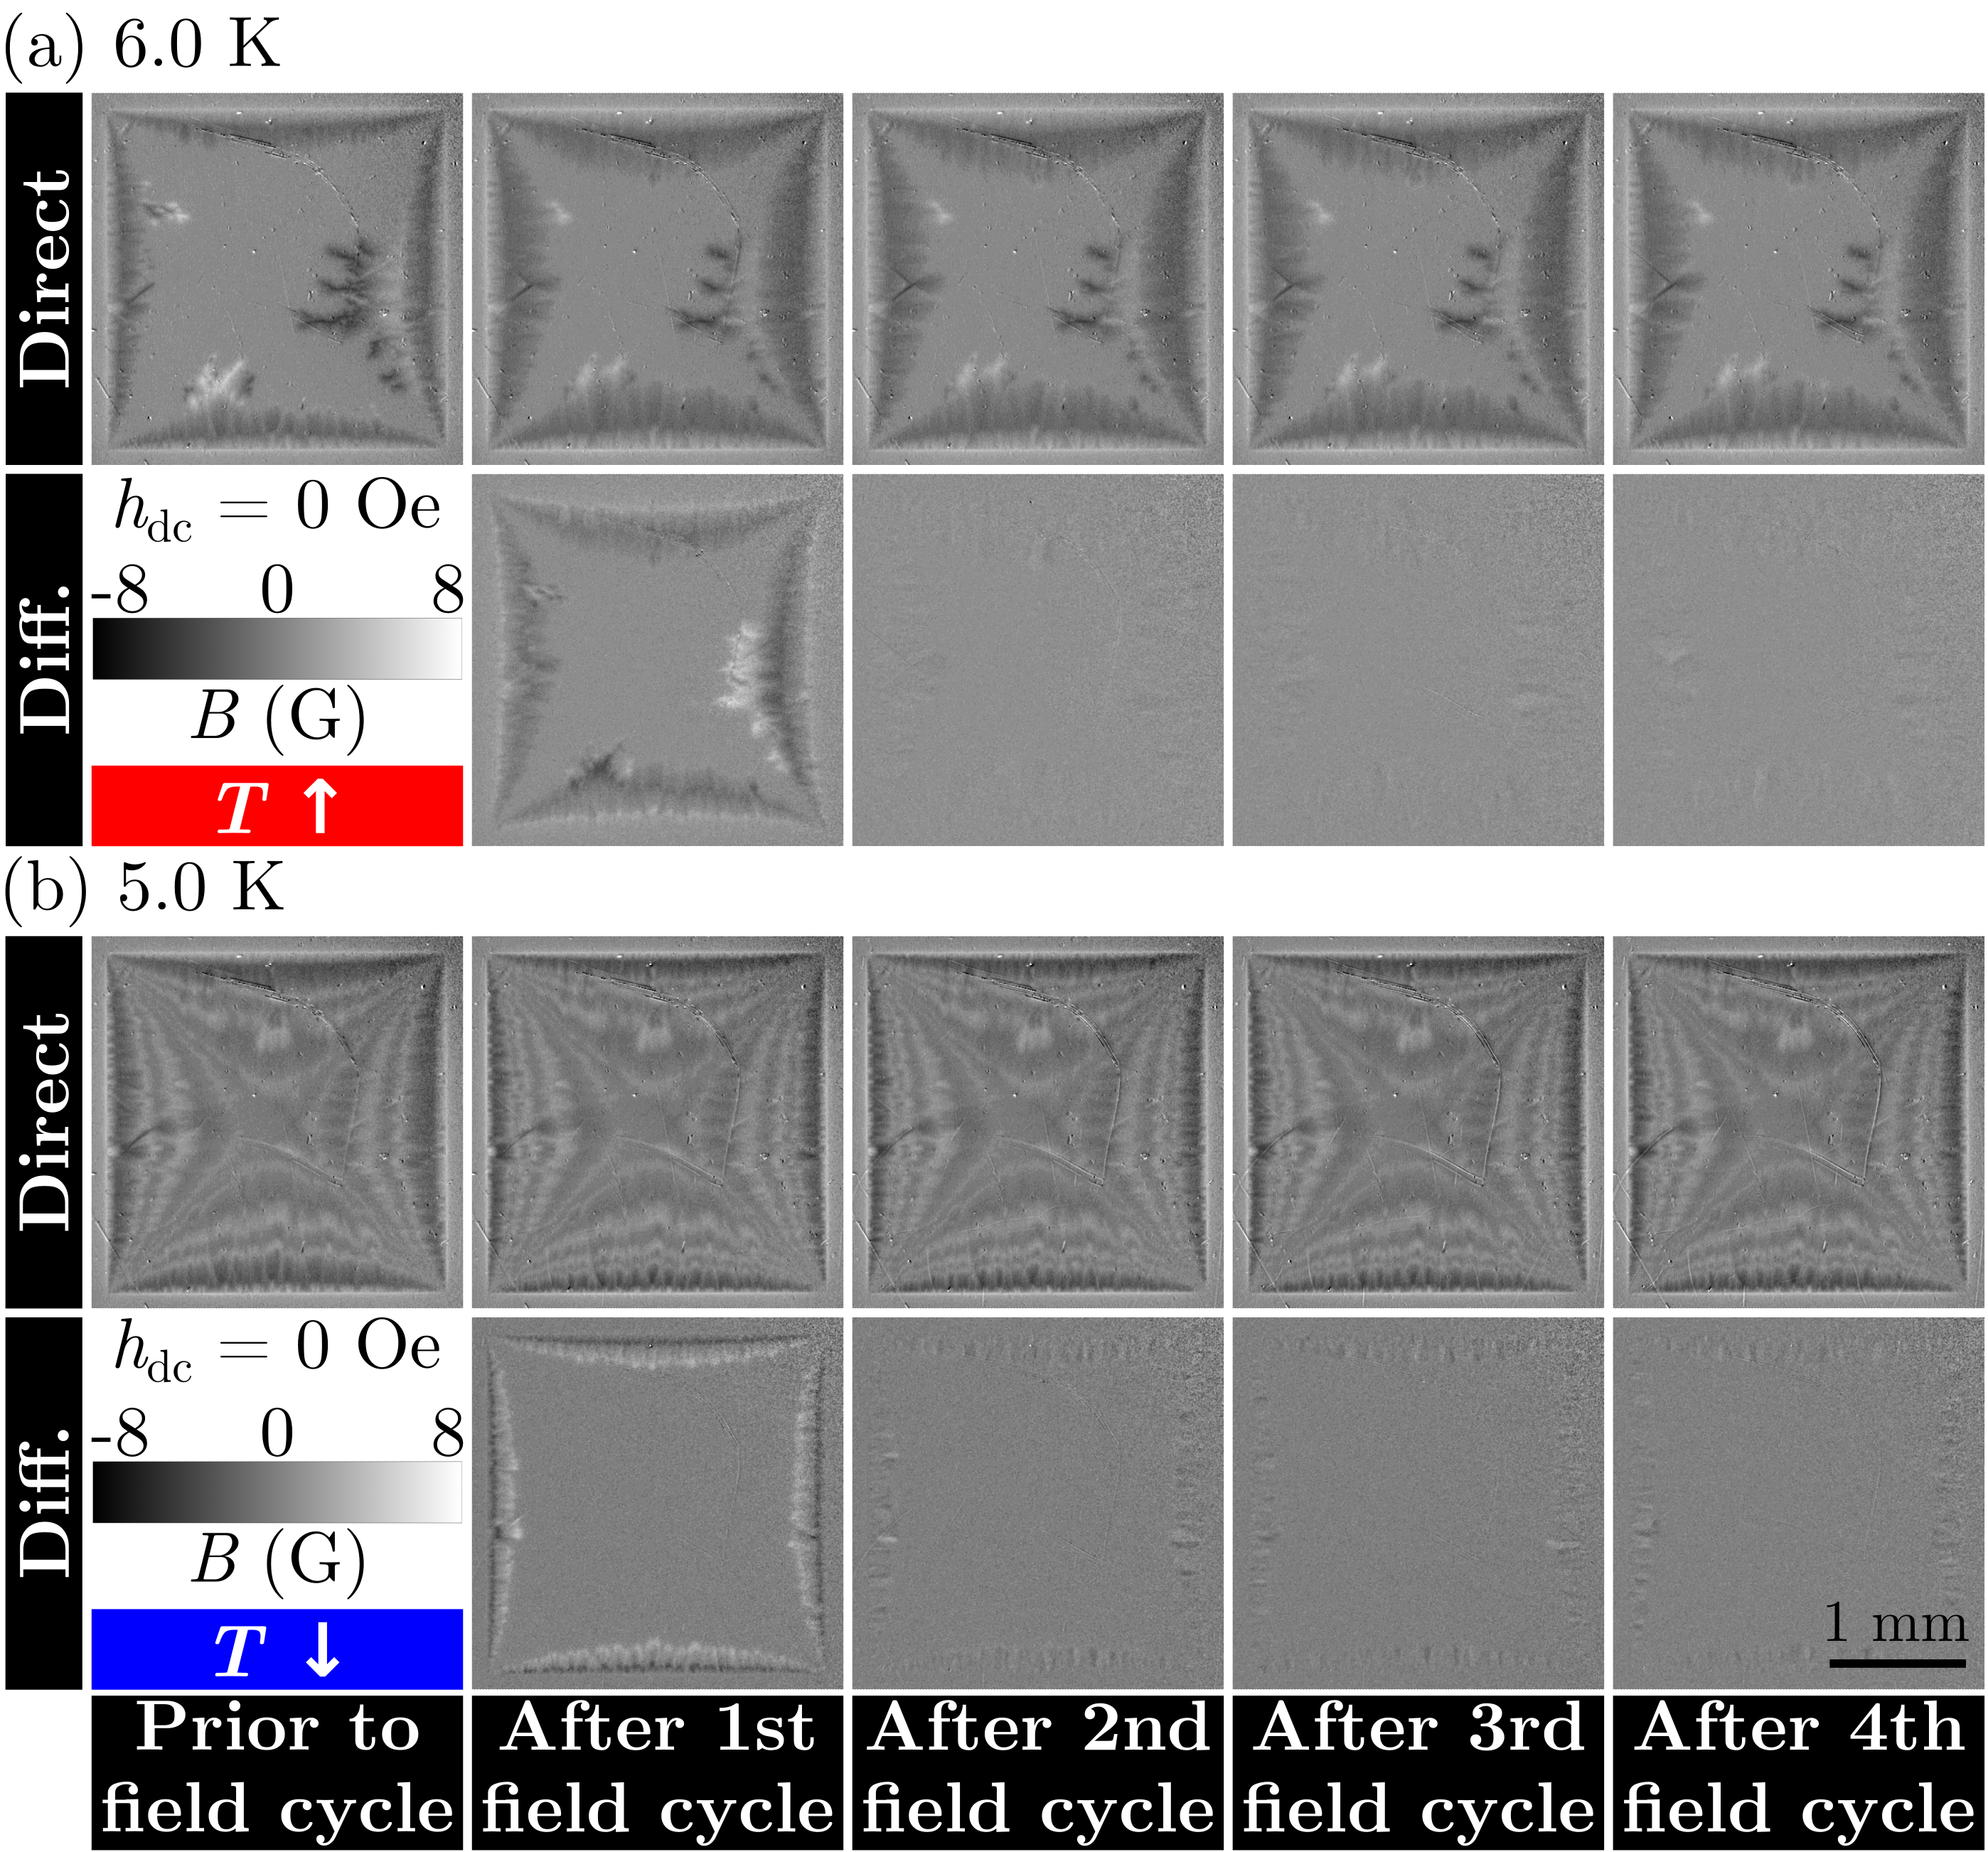
The flux penetration dynamics in the smooth penetration regime revealed by Fig. 7 hints at a different aspect of ac susceptibility measurements. To wit, Fig. 7(a) shows two panels with = 2.4 Oe where no clear differences are observed in the penetrated flux landscape. Figure 8 further explores this aspect of the results both as the temperature is increased after ZFC [Fig. 8(a), at 6 K] and as it is decreased from above [Fig. 8(b), at 5 K]. The first row of both panels shows MO images obtained before the ac-emulating magnetic field is applied at the indicated temperature followed by the flux landscape captured at the end of each field cycle, when the a-MoSi is under = 0 Oe. The second row shows differential MO images obtained by subtracting the flux landscape after field cycle by that after cycle . As established, flux penetration differs when the field is applied at different temperatures. Thus, a different flux pattern is revealed after the first cycle when compared to the previously pinned landscape, as evidenced by the first differential image in both panels. However, as the applied field reaches (or ), the penetrated positive (or negative) flux front reaches its maximum depth into the sample for those specific measurement conditions. Therefore, there is no sensitive difference between the flux landscapes observed at equivalent at the subsequent field cycles after the field reaches its maximum value. This is evidenced by the last three differential images in both panels. In the Supplemental Material, an accompanying video shows that these dynamics are observed in all images captured within the four field cycles for the measurements presented in Fig. 8(a). Therefore, in the smooth regime, the important dynamic aspects of flux penetration into superconducting samples are restricted to occur during the first field cycle. This naturally explains the observed independence of on the number of averaged field cycles in MPMS measurements, as reported in Appendix B.
VII Conclusions
We have investigated the ac magnetic susceptibility of a superconducting thin film with lateral dimensions in the millimeter range. Standard global ac magnetometry measurements of frequency-independent first harmonic reveal that the sample exhibits a paramagnetic reentrance related to the abrupt magnetic flux intake experienced during a flux avalanche event. Despite the stochastic nature of these avalanches, their effect on is nearly insensitive to the sample thermomagnetic history. We employ quantitative ac-emulating magneto-optical imaging to uncover the reasons behind this fact. In the smooth penetration regime, the indistinguishability of measured as the temperature is increased from 2 K or decreased from above is explained using differential MO images highlighting that the flux variation within the sample during an ac cycle is independent of the previously established flux landscape. The same is not true in the presence of flux avalanches. Nevertheless, we demonstrate that new avalanches preferentially nucleate along previously established and frozen avalanche regions of opposite polarity. By quantifying the flux variation due to each single avalanche, we find out that this process leads to similar contributions as is increased or decreased. We thus correlate these findings to the similar behavior in the avalanche regime, independently of the thermomagnetic history of the sample. Moreover, we use acMOI to quantitatively gauge in superconductors obtaining excellent agreement with standard global measurements, particularly at low temperatures and probe field amplitudes. Although the results have been obtained for an a-MoSi film, they are of total generality and, in principle, applicable to any kind of type-II superconductor, even those with high critical temperatures. We also take advantage of the technique to locally resolve regions of vortex-antivortex annihilation, explaining how an income flux front interacts with previously nucleated avalanches. This interplay also allows us to visualize that, after the ac field reaches its maximum amplitude in both field polarities, no new features are observed for subsequent field cycles, explaining the observed independence of on the number of cycles averaged to obtain the results. Therefore, by analyzing the history-independent of an a-MoSi sample, we demonstrate that acMOI is an effective technique to quantitatively study frequent-independent ac magnetic field effects in superconducting materials. This was recently employed to explain the impact of flux dynamics and, in particular, avalanches, on the resonance frequency of large-area superconducting coplanar waveguide resonators [85].
Acknowledgements.
This work was partially supported by Coordenação de Aperfeiçoamento de Pessoal de Nível Superior – Brasil (CAPES) – Finance Code 001, the São Paulo Research Foundation (FAPESP, Grant No. 2021/08781-8), the National Council for Scientific and Technological Development (CNPq, Grants No. 431974/2018-7 and 316602/2021-3) and by the UK EPSRC through Grant EP/I036303/1. D.A.D.C. and J.C.C.F. contributed equally to this work.Appendix A Ac susceptibility dependency on the drive frequency
Figure 9 shows measurements performed in the MPMS varying the magnetic field drive frequency between 0.05 Hz and 1000 Hz. The results are normalized by obtained from the = 1000 Hz curve. In the investigated frequency range, shows no significant variations for different values of .
Appendix B Ac susceptibility dependence on the number of field cycles
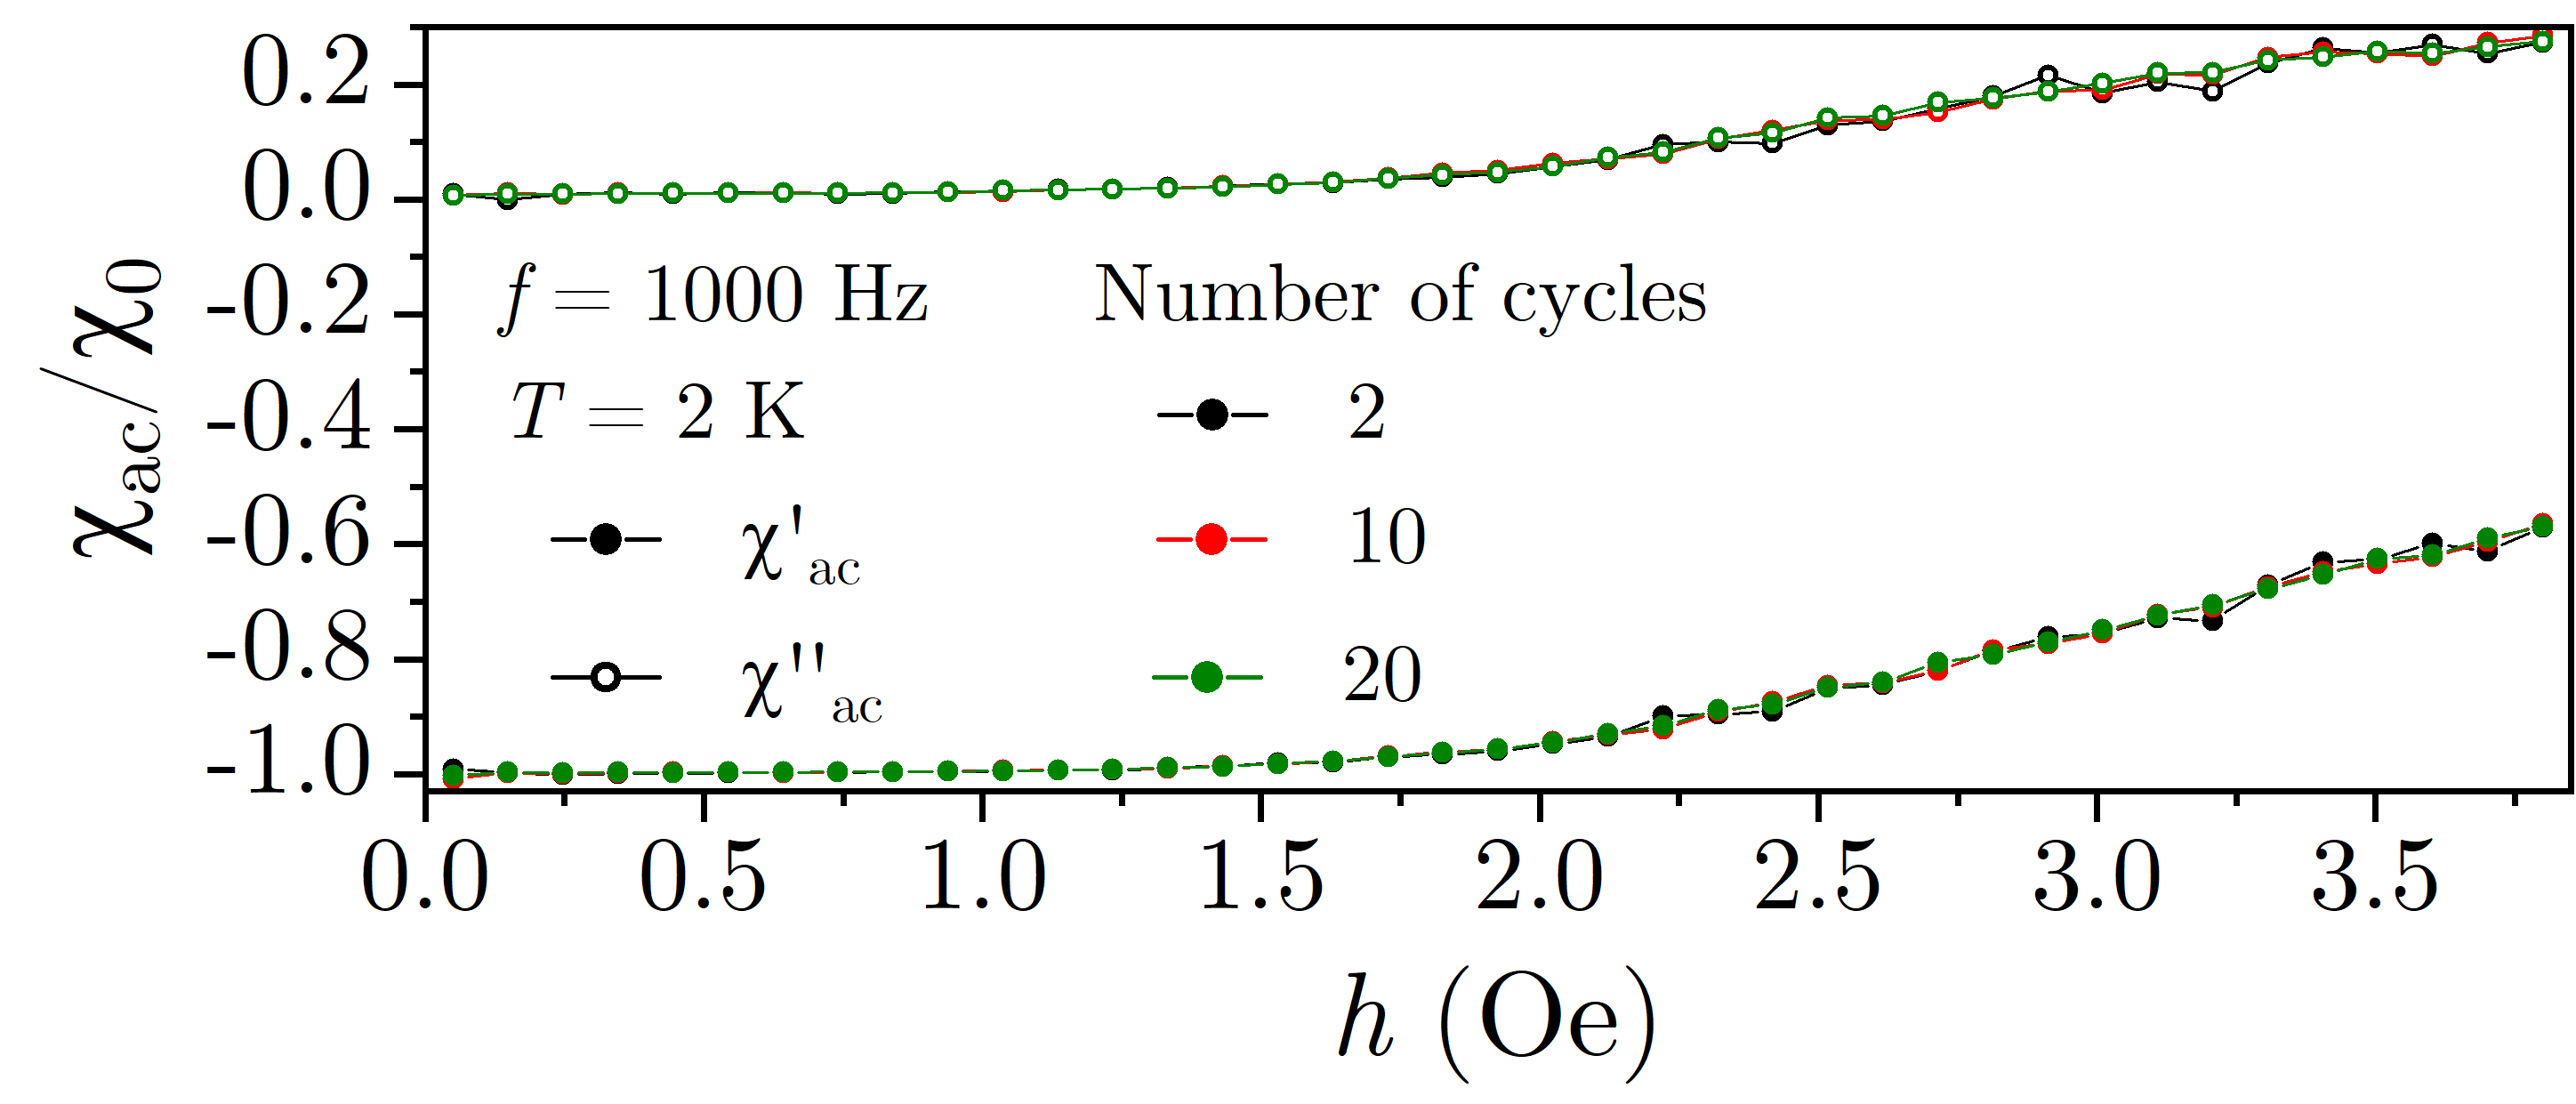
Figure 10 shows three different measurements of the ac susceptibility of the a-MoSi sample as a function of . The data is obtained varying the number of field cycles used by the MPMS to average the magnetic moment [see Eqs. (1) and (2)]. The range explored depicts the full limit of the MPMS. If the sample is in the smooth penetration regime, i.e., 2.0 Oe for = 2 K, Fig. 10 quantitatively shows that is independent of the number of field cycles. In the avalanche regime, small variations are observed due to the stochastic nature of the abrupt flux penetration events.
References
- MacFarlane et al. [2003] A. G. J. MacFarlane, J. P. Dowling, and G. J. Milburn, Quantum technology: the second quantum revolution, Phil. Trans. R. Soc. Lond. A 361, 1655 (2003).
- Devoret and Schoelkopf [2013] M. H. Devoret and R. J. Schoelkopf, Superconducting circuits for quantum information: An outlook, Science 339, 1169 (2013).
- Wendin [2017] G. Wendin, Quantum information processing with superconducting circuits: a review, Rep. Prog. Phys. 80, 106001 (2017).
- Kjaergaard et al. [2020] M. Kjaergaard, M. E. Schwartz, J. Braumüller, P. Krantz, J. I.-J. Wang, S. Gustavsson, and W. D. Oliver, Superconducting qubits: Current state of play, Annu. Rev. Condens. Matter Phys. 11, 369 (2020).
- Blais et al. [2021] A. Blais, A. L. Grimsmo, S. M. Girvin, and A. Wallraff, Circuit quantum electrodynamics, Rev. Mod. Phys. 93, 025005 (2021).
- Natarajan et al. [2012] C. M. Natarajan, M. G. Tanner, and R. H. Hadfield, Superconducting nanowire single-photon detectors: physics and applications, Supercond. Sci. Technol. 25, 063001 (2012).
- McCaughan and Berggren [2014] A. N. McCaughan and K. K. Berggren, A superconducting-nanowire three-terminal electrothermal device, Nano Lett. 14, 5748 (2014).
- Zhao et al. [2018] Q.-Y. Zhao, E. A. Toomey, B. A. Butters, A. N. McCaughan, A. E. Dane, S.-W. Nam, and K. K. Berggren, A compact superconducting nanowire memory element operated by nanowire cryotrons, Supercond. Sci. Technol. 31, 035009 (2018).
- Strambini et al. [2020] E. Strambini et al., A Josephson phase battery, Nat. Nanotechnol. 15, 656 (2020).
- Chen et al. [2020] L. Chen et al., Miniaturization of the superconducting memory cell via a three-dimensional Nb nano-superconducting quantum interference device, ACS Nano 14, 11002 (2020).
- Ligato et al. [2022] N. Ligato, F. Paolucci, E. Strambini, and F. Giazotto, Thermal superconducting quantum interference proximity transistor, Nat. Phys. , 1 (2022).
- Golod and Krasnov [2022] T. Golod and V. M. Krasnov, Demonstration of a superconducting diode-with-memory, operational at zero magnetic field with switchable nonreciprocity, Nat. Commun. 13, 3658 (2022).
- Chaves et al. [2023] D. A. D. Chaves, L. Nulens, H. Dausy, B. Raes, D. Yue, W. A. Ortiz, M. Motta, M. J. Van Bael, and J. Van de Vondel, Nanobridge SQUIDs as multilevel memory elements, Phys. Rev. Appl. 19, 034091 (2023).
- Clem and Sanchez [1994] J. R. Clem and A. Sanchez, Hysteretic ac losses and susceptibility of thin superconducting disks, Phys. Rev. B 50, 9355 (1994).
- Willemin et al. [1998] M. Willemin, C. Rossel, J. Hofer, H. Keller, A. Erb, and E. Walker, Strong shift of the irreversibility line in high- superconductors upon vortex shaking with an oscillating magnetic field, Phys. Rev. B 58, R5940 (1998).
- Brandt and Mikitik [2002] E. H. Brandt and G. P. Mikitik, Why an ac magnetic field shifts the irreversibility line in type-II superconductors, Phys. Rev. Lett. 89, 027002 (2002).
- Hoffmann et al. [2011] C. Hoffmann, D. Pooke, and A. D. Caplin, Flux pump for hts magnets, IEEE Trans. Appl. Supercond. 21, 1628 (2011).
- Geng and Coombs [2015] J. Geng and T. A. Coombs, Mechanism of a high-Tc superconducting flux pump: Using alternating magnetic field to trigger flux flow, Appl. Phys. Lett. 107, 10.1063/1.4932950 (2015).
- Silva et al. [2016] C. C. d. S. Silva, B. Raes, J. Brisbois, L. R. E. Cabral, A. V. Silhanek, J. Van de Vondel, and V. V. Moshchalkov, Probing the low-frequency vortex dynamics in a nanostructured superconducting strip, Phys. Rev. B 94, 024516 (2016).
- Ivan et al. [2018] I. Ivan, A. M. Ionescu, V. Sandu, A. Crisan, and L. Miu, Vortex dynamics driven by AC magnetic field in YBCO thin films with complex pinning structures, Supercond. Sci. Technol. 31, 105012 (2018).
- Shen et al. [2020] B. Shen, F. Grilli, and T. Coombs, Review of the AC loss computation for HTS using H formulation, Supercond. Sci. Technol. 33, 033002 (2020).
- Pasquini et al. [2020] G. Pasquini, M. M. Bermúdez, and V. Bekeris, AC dynamic reorganization and critical phase transitions in superconducting vortex matter, Supercond. Sci. Technol. 34, 013003 (2020).
- Abrikosov [1957] A. A. Abrikosov, On the magnetic properties of superconductors of the second group, Sov. Phys. JETP 5, 1174 (1957).
- Blatter et al. [1994] G. Blatter, M. V. Feigel’man, V. B. Geshkenbein, A. I. Larkin, and V. M. Vinokur, Vortices in high-temperature superconductors, Rev. Mod. Phys. 66, 1125 (1994).
- Brandt [2009] E. H. Brandt, Vortex-vortex interaction in thin superconducting films, Phys. Rev. B 79, 134526 (2009).
- Chaves et al. [2011] A. Chaves, F. M. Peeters, G. A. Farias, and M. V. Milošević, Vortex-vortex interaction in bulk superconductors: Ginzburg-Landau theory, Phys. Rev. B 83, 054516 (2011).
- Sardella et al. [2009] E. Sardella, P. N. Lisboa Filho, C. C. de Souza Silva, L. R. Eulálio Cabral, and W. A. Ortiz, Vortex-antivortex annihilation dynamics in a square mesoscopic superconducting cylinder, Phys. Rev. B 80, 012506 (2009).
- Bean [1964] C. P. Bean, Magnetization of high-field superconductors, Rev. Mod. Phys. 36, 31 (1964).
- Kim et al. [1962] Y. B. Kim, C. F. Hempstead, and A. R. Strnad, Critical persistent currents in hard superconductors, Phys. Rev. Lett. 9, 306 (1962).
- Jooss et al. [2002] C. Jooss, J. Albrecht, H. Kuhn, S. Leonhardt, and H. Kronmüller, Magneto-optical studies of current distributions in high-Tc superconductors, Rep. Prog. Phys. 65, 651 (2002).
- Colauto et al. [2020] F. Colauto, M. Motta, and W. A. Ortiz, Controlling magnetic flux penetration in low-tc superconducting films and hybrids, Supercond. Sci. Technol. 34, 013002 (2020).
- Zeldov et al. [1994] E. Zeldov, J. R. Clem, M. McElfresh, and M. Darwin, Magnetization and transport currents in thin superconducting films, Phys. Rev. B 49, 9802 (1994).
- Brandt [1998] E. H. Brandt, Superconductor disks and cylinders in an axial magnetic field. I. flux penetration and magnetization curves, Phys. Rev. B 58, 6506 (1998).
- Shantsev et al. [1999] D. V. Shantsev, Y. M. Galperin, and T. H. Johansen, Thin superconducting disk with b-dependent flux and current distributions, Phys. Rev. B 60, 13112 (1999).
- Wipf [1991] S. L. Wipf, Review of stability in high temperature superconductors with emphasis on flux jumping, Cryogenics 31, 936 (1991).
- Denisov et al. [2006a] D. V. Denisov, A. L. Rakhmanov, D. V. Shantsev, Y. M. Galperin, and T. H. Johansen, Dendritic and uniform flux jumps in superconducting films, Phys. Rev. B 73, 014512 (2006a).
- Denisov et al. [2006b] D. V. Denisov, D. V. Shantsev, Y. M. Galperin, E.-M. Choi, H.-S. Lee, S.-I. Lee, A. V. Bobyl, P. E. Goa, A. A. F. Olsen, and T. H. Johansen, Onset of dendritic flux avalanches in superconducting films, Phys. Rev. Lett. 97, 077002 (2006b).
- Leiderer et al. [1993] P. Leiderer, J. Boneberg, P. Brüll, V. Bujok, and S. Herminghaus, Nucleation and growth of a flux instability in superconducting films, Phys. Rev. Lett. 71, 2646 (1993).
- Durán et al. [1995] C. A. Durán, P. L. Gammel, R. E. Miller, and D. J. Bishop, Observation of magnetic-field penetration via dendritic growth in superconducting niobium films, Phys. Rev. B 52, 75 (1995).
- Johansen et al. [2001] T. H. Johansen, M. Baziljevich, D. Shantsev, P. E. Goa, Y. M. Galperin, W. N. Kang, H. J. Kim, E. M. Choi, M.-S. Kim, and S. I. Lee, Dendritic flux patterns in MgB2 films, Supercond. Sci. Technol. 14, 726 (2001).
- Bolz et al. [2003] U. Bolz, B. Biehler, D. Schmidt, B.-U. Runge, and P. Leiderer, Dynamics of the dendritic flux instability in YBa2Cu3O7-δ films, Europhys. Lett. 64, 517 (2003).
- Aranson et al. [2005] I. S. Aranson, A. Gurevich, M. S. Welling, R. J. Wijngaarden, V. K. Vlasko-Vlasov, V. M. Vinokur, and U. Welp, Dendritic flux avalanches and nonlocal electrodynamics in thin superconducting films, Phys. Rev. Lett. 94, 037002 (2005).
- Vestgården et al. [2011] J. I. Vestgården, D. V. Shantsev, Y. M. Galperin, and T. H. Johansen, Dynamics and morphology of dendritic flux avalanches in superconducting films, Phys. Rev. B 84, 054537 (2011).
- Colauto et al. [2015] F. Colauto, M. Motta, A. Palau, M. G. Blamire, T. H. Johansen, and W. A. Ortiz, First observation of flux avalanches in a-MoSi superconducting thin films, IEEE Trans. Appl. Supercond. 25, 1 (2015).
- Vestgården et al. [2018] J. I. Vestgården, T. H. Johansen, and Y. M. Galperin, Nucleation and propagation of thermomagnetic avalanches in thin-film superconductors (Review Article), Low Temp. Phys. 44, 460 (2018).
- Schawlow [1956] A. L. Schawlow, Structure of the intermediate state in superconductors, Phys. Rev. 101, 573 (1956).
- Kim et al. [1963] Y. B. Kim, C. F. Hempstead, and A. R. Strnad, Magnetization and critical supercurrents, Phys. Rev. 129, 528 (1963).
- Esquinazi et al. [1999] P. Esquinazi, A. Setzer, D. Fuchs, Y. Kopelevich, E. Zeldov, and C. Assmann, Vortex avalanches in Nb thin films: Global and local magnetization measurements, Phys. Rev. B 60, 12454 (1999).
- Altshuler and Johansen [2004] E. Altshuler and T. H. Johansen, Colloquium: Experiments in vortex avalanches, Rev. Mod. Phys. 76, 471 (2004).
- Silhanek et al. [2004] A. V. Silhanek, S. Raedts, and V. V. Moshchalkov, Paramagnetic reentrance of screening: Evidence of vortex avalanches in Pb thin films, Phys. Rev. B 70, 144504 (2004).
- Menghini et al. [2005] M. Menghini, R. J. Wijngaarden, A. V. Silhanek, S. Raedts, and V. V. Moshchalkov, Dendritic flux penetration in pb films with a periodic array of antidots, Phys. Rev. B 71, 104506 (2005).
- Motta et al. [2011] M. Motta, F. Colauto, R. Zadorosny, T. H. Johansen, R. B. Dinner, M. G. Blamire, G. W. Ataklti, V. V. Moshchalkov, A. V. Silhanek, and W. A. Ortiz, Visualizing the ac magnetic susceptibility of superconducting films via magneto-optical imaging, Phys. Rev. B 84, 214529 (2011).
- Goldfarb et al. [1991] R. B. Goldfarb, M. Lelental, and C. A. Thompson, Alternating-field susceptometry and magnetic susceptibility of superconductors, in Magnetic Susceptibility of Superconductors and Other Spin Systems, edited by R. A. Hein, T. L. Francavilla, and D. H. Liebenberg (Springer US, Boston, MA, 1991) pp. 49–80.
- Gömöry [1997] F. Gömöry, Characterization of high-temperature superconductors by AC susceptibility measurements, Supercond. Sci. Technol. 10, 523 (1997).
- Müller [1989] K.-H. Müller, Ac susceptibility of high temperature superconductors in a critical state model, Physica C 159, 717 (1989).
- Oliveira et al. [2010] A. A. M. Oliveira, N. Hur, S.-W. Cheong, and W. A. Ortiz, Vortex glass melting in Mg-deficient , Phys. Rev. B 82, 104506 (2010).
- Kramer et al. [2010] R. B. G. Kramer, G. W. Ataklti, V. V. Moshchalkov, and A. V. Silhanek, Direct visualization of the campbell regime in superconducting stripes, Phys. Rev. B 81, 144508 (2010).
- Zhao et al. [2012] L. L. Zhao, S. Lausberg, H. Kim, M. A. Tanatar, M. Brando, R. Prozorov, and E. Morosan, Type-I superconductivity in YbSb2 single crystals, Phys. Rev. B 85, 214526 (2012).
- Topping and Blundell [2018] C. V. Topping and S. J. Blundell, A.C. susceptibility as a probe of low-frequency magnetic dynamics, J. Phys.: Condens. Matter 31, 013001 (2018).
- Eremets et al. [2022] M. I. Eremets, V. S. Minkov, A. P. Drozdov, P. P. Kong, V. Ksenofontov, S. I. Shylin, S. L. Bud’ko, R. Prozorov, F. F. Balakirev, D. Sun, S. Mozaffari, and L. Balicas, High-temperature superconductivity in hydrides: Experimental evidence and details, J. Supercond. Novel Magn. 35, 965 (2022).
- Ghigo et al. [2022] G. Ghigo, M. Fracasso, R. Gerbaldo, L. Gozzelino, F. Laviano, A. Napolitano, G.-H. Cao, M. J. Graf, R. Prozorov, T. Tamegai, Z. Shi, X. Xing, and D. Torsello, High-frequency ac susceptibility of iron-based superconductors, Materials 15, 1079 (2022).
- Bosworth et al. [2015] D. Bosworth, S.-L. Sahonta, R. H. Hadfield, and Z. H. Barber, Amorphous molybdenum silicon superconducting thin films, AIP Advances 5, 087106 (2015).
- Kubo [1988] S. Kubo, Superconducting properties of amorphous MoX (X=Si, Ge) alloy films for Abrikosov vortex memory, J. Appl. Phys. 63, 2033 (1988).
- Banerjee et al. [2017] A. Banerjee, L. J. Baker, A. Doye, M. Nord, R. M. Heath, K. Erotokritou, D. Bosworth, Z. H. Barber, I. MacLaren, and R. H. Hadfield, Characterisation of amorphous molybdenum silicide (MoSi) superconducting thin films and nanowires, Supercond. Sci. Technol. 30, 084010 (2017).
- Verma et al. [2015] V. B. Verma, B. Korzh, F. Bussières, R. D. Horansky, S. D. Dyer, A. E. Lita, I. Vayshenker, F. Marsili, M. D. Shaw, H. Zbinden, R. P. Mirin, and S. W. Nam, High-efficiency superconducting nanowire single-photon detectors fabricated from MoSi thin-films, Opt. Express 23, 33792 (2015).
- Caloz et al. [2018] M. Caloz, M. Perrenoud, C. Autebert, B. Korzh, M. Weiss, C. Schönenberger, R. J. Warburton, H. Zbinden, and F. Bussières, High-detection efficiency and low-timing jitter with amorphous superconducting nanowire single-photon detectors, Appl. Phys. Lett. 112, 061103 (2018).
- Zhang et al. [2021] X. Zhang, I. Charaev, H. Liu, T. X. Zhou, D. Zhu, K. K. Berggren, and A. Schilling, Physical properties of amorphous molybdenum silicide films for single-photon detectors, Supercond. Sci. Technol. 34, 095003 (2021).
- Helseth et al. [2001] L. E. Helseth, R. W. Hansen, E. I. Il’yashenko, M. Baziljevich, and T. H. Johansen, Faraday rotation spectra of bismuth-substituted ferrite garnet films with in-plane magnetization, Phys. Rev. B 64, 174406 (2001).
- Shaw et al. [2018] G. Shaw, J. Brisbois, L. B. G. L. Pinheiro, et al., Quantitative magneto-optical investigation of superconductor/ferromagnet hybrid structures, Rev. Sci. Instrum. 89, 023705 (2018).
- Thevenaz et al. [1998] P. Thevenaz, U. Ruttimann, and M. Unser, A pyramid approach to subpixel registration based on intensity, IEEE Trans. Image Process. 7, 27 (1998).
- Schneider et al. [2012] C. A. Schneider, W. S. Rasband, and K. W. Eliceiri, NIH Image to ImageJ: 25 years of image analysis, Nat. Methods 9, 671 (2012).
- Ferrari et al. [2007] H. Ferrari, V. Bekeris, and T. Johansen, Magneto-optic imaging of domain walls in ferrimagnetic garnet films, Physica B 398, 476 (2007).
- Raedts et al. [2004] S. Raedts, A. V. Silhanek, M. J. Van Bael, and V. V. Moshchalkov, Flux-pinning properties of superconducting films with arrays of blind holes, Phys. Rev. B 70, 024509 (2004).
- Yurchenko et al. [2007] V. V. Yurchenko, D. V. Shantsev, T. H. Johansen, M. R. Nevala, I. J. Maasilta, K. Senapati, and R. C. Budhani, Reentrant stability of superconducting films and the vanishing of dendritic flux instability, Phys. Rev. B 76, 092504 (2007).
- Quantum Design [1999] Quantum Design, Magnetic property measurement system: AC option user’s manual, San Diego (1999).
- [76] Quantum Design, Introduction to: AC susceptibility, San Diego Available at: qdusa.com.
- Soibel et al. [2000] A. Soibel, E. Zeldov, M. Rappaport, Y. Myasoedov, T. Tamegai, S. Ooi, M. Konczykowski, and V. B. Geshkenbein, Imaging the vortex-lattice melting process in the presence of disorder, Nature 406, 282 (2000).
- [78] URL_will_be_inserted_by_publisher.
- Jing and Ainslie [2020] Z. Jing and M. D. Ainslie, Numerical simulation of flux avalanches in type-II superconducting thin films under transient AC magnetic fields, Supercond. Sci. Technol. 33, 084006 (2020).
- Qviller et al. [2010] A. J. Qviller, V. V. Yurchenko, K. Eliassen, J. I. Vestgården, T. H. Johansen, M. R. Nevala, I. J. Maasilta, K. Senapati, and R. C. Budhani, Irreversibility of the threshold field for dendritic flux avalanches in superconductors, Physica C 470, 897 (2010).
- Pinheiro et al. [2022] L. B. L. G. Pinheiro, L. Jiang, E. A. Abbey, D. A. D. Chaves, A. J. Chiquito, T. H. Johansen, J. Van de Vondel, C. Xue, Y.-H. Zhou, A. V. Silhanek, W. A. Ortiz, and M. Motta, Magnetic flux penetration in nanoscale wedge-shaped superconducting thin films, Phys. Rev. B 106, 224520 (2022).
- Clem [1991] J. R. Clem, Ac losses in type-II superconductors, in Magnetic Susceptibility of Superconductors and Other Spin Systems, edited by R. A. Hein, T. L. Francavilla, and D. H. Liebenberg (Springer, New York, NY, 1991) pp. 177–211.
- Note [1] For the data presented in this work, we found by inspection that a third degree polynomial successfully described the behavior of the mean intensity with the applied magnetic field.
- Chaves et al. [2021] D. A. D. Chaves, I. M. de Araújo, D. Carmo, F. Colauto, A. A. M. de Oliveira, A. M. H. de Andrade, T. H. Johansen, A. V. Silhanek, W. A. Ortiz, and M. Motta, Enhancing the effective critical current density in a Nb superconducting thin film by cooling in an inhomogeneous magnetic field, Appl. Phys. Lett. 119, 022602 (2021).
- Nulens et al. [2023] L. Nulens, N. Lejeune, J. Caeyers, S. Marinković, I. Cools, H. Dausy, S. Basov, B. Raes, M. J. V. Bael, A. Geresdi, A. V. Silhanek, and J. V. de Vondel, Catastrophic magnetic flux avalanches in NbTiN superconducting resonators (2023), arXiv:2305.02418 [cond-mat.supr-con] .