Spatially resolved Kennicutt-Schmidt relation at and its connection with the interstellar medium properties
Abstract
We exploit moderately resolved [O ], [C ] and dust continuum ALMA observations to derive the gas density (), the gas-phase metallicity () and the deviation from the Kennicutt-Schmidt (KS) relation () on scales in the interstellar medium (ISM) of five bright Lyman Break Galaxies at the Epoch of Reionization (). To do so, we use GLAM, a state-of-art, physically motivated Bayesian model that links the [C ] and [O ] surface brightness (, ) and the SFR surface density () to , , and . All five sources are characterized by a central starbursting region, where the vs align 10 above the KS relation (). This translates into gas depletion times in the range Myr. The inner starbursting centers are characterized by higher gas density () and higher metallicity () than the galaxy outskirts. We derive marginally negative radial metallicity gradients ( dex/kpc), and a dust temperature ( K) that anticorrelates with the gas depletion time.
keywords:
galaxies: high-redshift – galaxies: ISM – galaxies: evolution – dark ages, reionization, first stars1 Introduction
The Epoch of Reionization (EoR) represents a critical phase of the Universe evolution, and its study is one of the frontiers in modern astrophysics (e.g. Robertson, 2022). During the EoR, the first galaxies started to rapidly form stars, which in turn began producing photons able to ionize the surrounding gas – first the interstellar medium (ISM), and eventually the intergalactic medium (Dayal & Ferrara, 2018, for a review). For this reason, shedding light on how the gas is converted into stars (e.g. Tacconi et al., 2020), and how this process is influenced by the ISM properties holds the key to understanding the evolution of cosmic reionization.
At low and intermediate redshifts, the so-called Kennicutt-Schmidt (KS) relation111The star formation rate (gas) surface density is expressed in units of (). , linking the star formation rate (SFR) and the gas surface densities (, respectively) is well established (Schmidt, 1959; Kennicutt, 1998; Heiderman et al., 2010; de los Reyes
& Kennicutt, 2019). The “burstiness" parameter, , was first introduced in Ferrara
et al. (2019) to quantify the deviation from the KS relation that might occur in the high- Universe. Galaxies with show a larger SFR per unit area with respect to those located on the KS relation, i.e. they tend to be starburst. At high redshifts, values in the range have been measured for massive/rare sub-millimeter galaxies for which spatially-resolved data of cold gas tracers, namely low- CO lines, are available (e.g. Hodge et al., 2015; Chen
et al., 2017). Spatially-resolved low- CO detections in galaxies representative of the bulk population in the EoR are instead time demanding even with state-of-art radio/sub-mm facilities, unless taking advantage of strong gravitational lensing (Nagy et al., 2023, at z). This is due to the efficient CO photodissociation at low metallicity and dust abundance (Bolatto
et al., 2013; Wolfire
et al., 2022), and because of the increasing temperature of the CMB (da Cunha
et al., 2013; Vallini et al., 2015) against which the lines are observed. Only a few mid- CO detections have been reported so far (e.g. Pavesi et al., 2019; Ono et al., 2022) but none of them are spatially resolved even by the Atacama Large Millimeter/submillimeter Array (ALMA), thus hampering the measure of the size of the emitting area and ultimately the derivation of .
In recent years an alternative, indirect, method has been proposed to infer the location of EoR sources with respect to the KS relation. This is done by linking their to the relative surface brightness ratios of bright neutral (e.g. [C ] 158m) versus ionized (e.g. [O ] 88m, CIII]1907,1909 doublet) gas tracers (Ferrara et al., 2019; Vallini et al., 2020, 2021; Markov et al., 2022) that can be spatially resolved by ALMA (Herrera-Camus et al., 2022; Akins et al., 2022; Molyneux et al., 2022; Witstok et al., 2022; Posses et al., 2023) and JWST (e.g. Hsiao et al., 2023). A starburst source has a larger ionization parameter, , producing a correspondingly larger ionized gas column density, as compared to a galaxy with the same but lying on the KS relation (Ferrara et al., 2019). These conditions boost (quench) ionized (neutral) gas tracers and, together with the gas density () and metallicity (), concur in determining the surface brightness ratios (Kohandel et al., 2023).
By leveraging this method, Vallini et al. (2021) analyzed the nine EoR Lyman Break Galaxies (LBGs) that had joint (albeit only barely resolved) [C ]-[O ] detections at the time (Laporte et al., 2017; Tamura et al., 2019; Harikane et al., 2020; Bakx et al., 2020; Carniani et al., 2020), obtaining . These high burstiness parameters, in agreement with expectations from cosmological zoom-in simulations (Pallottini et al., 2019, 2022), suggest ISM conditions favouring an efficient conversion of gas into stars (short depletion times), with starburst episodes producing bright [O ] emission from H regions (e.g. Cormier et al., 2019; Harikane et al., 2020). Also, the gas metallicity and density were found to be relatively high (, and , respectively) in agreement with independent analysis carried out on the same objects (Jones et al., 2020; Yang & Lidz, 2020).
A recent study of three galaxies from REBELS (Bouwens et al., 2022) supports the tight relation between galaxy burstiness and [O ]/[C ] ratios. In this case, low [O ]/[C ] have been explained with the weak ionizing field resulting from the non-starbursting nature of the sources (Algera et al., 2023). The lack of recent bursts is also likely the cause (e.g. Sommovigo et al., 2020) of their cold dust temperatures. The sources analyzed by Algera et al. (2023) seem, however, to be an outlier with respect to the average conditions of EoR galaxies with below-average [OIII]H equivalent widths compared to the known high- population.
black From the theoretical side, an increasing number of simulations and models developed to interpret [C ] (e.g. Vallini et al., 2015; Lagache
et al., 2018; Pallottini
et al., 2022), [O ] (e.g. Moriwaki
et al., 2018; Arata et al., 2020; Katz
et al., 2022) and dust continuum emission (e.g. Behrens et al., 2018; Di Cesare
et al., 2023), find high turbulence (e.g. Kohandel
et al., 2020), strong radiation fields (e.g. Katz
et al., 2022), high densities, and warm dust temperatures (e.g. Sommovigo
et al., 2021), to be common on sub-kpc scales in the ISM of star forming galaxies in the EoR.
The goal of this work is to push further the study of the link between the KS relation, and ISM/dust properties in the first galaxies by leveraging the spatially resolved [C ], [O ], and dust continuum data recently presented by Witstok et al. (2022) in a sample of five bright LBGs at . Our aim is to investigate the sub-kpc relation between the burstiness parameter, gas density and metallicity and study their connection with global values that can be inferred from unresolved data.
2 Sample and data
Details regarding the sample and data reduction can be found in Witstok et al. (2022), however we summarize the key points here. We considered all available ALMA data sets of [C ] 158m (2015.1.01111.S, 2017.1.00604.S, 2019.1.01611.S, PI: Smit, 2018.1.00085.S, PI: Schouws, 2018.1.01359.S, PI: Aravena, 2015.1.00540.S, 2018.1.00933.S, PI: Bowler) and [O ] 88 m (2018.1.00429.S, 2019.1.01524.S, PI: Smit) for the sample of LBGs at : COS-3018555981 (COS-3018, hereafter), COS-2987030247 (COS-2987, hereafter), UVISTA-Z-001, UVISTA-Z-007, and UVISTA-Z-019. Data were calibrated and reduced with the automated pipeline of the Common Astronomy Software Application (casa; McMullin et al., 2007). In cases where the continuum is robustly detected (i.e. next to the [C ] emission in COS-3018, UVISTA-Z-001, and UVISTA-Z-019 and next to the [O ] emission in UVISTA-Z-001), we first performed continuum subtraction using the uvcontsub task in casa. After this step, we created images with the tclean task both under natural and several Briggs weightings. We tuned the weighting and/or taper scheme to match the beam sizes as closely as possible, using natural weighting (and a small taper, if required) for the line observed with highest spatial resolution and Briggs weighting for the other. The robust parameter has been tuned to the highest resolution achievable while maintaining a reasonable signal-to-noise ratio. The resulting matched beam sizes () for [C ] and [O ] are listed in Table 2 of Witstok et al. (2022). Finally, we regridded images of the [O ] and [C ], obtained by integrating along the frequency axis over the full width at half maximum (FWHM) of the line, to a common coordinate mesh with the reproject package in astropy.
Both UV and IR luminosity maps were regridded to the same pixel grid as the [O ] and [C ] lines. We used the same imaging parameters for the dust continuum at rest-frame wavelength (since band-6 measurements had the most significant detections) to achieve a beam nearly identical to that of the [C ] line. The IR luminosity (, ) was calculated using the global best-fit spectral energy distribution (SED, see Section 4 in Witstok et al. 2022 and Table 3 for the best-fit dust temperatures, ) as a template for rescaling the flux in each pixel. The UV continuum was convolved with an effective Richardson (1972); Lucy (1974) beam to match the point spread function (PSF) of the dust-continuum emission.
3 Model
The derivation and study of the ISM properties presented in this paper is based on GLAM222GLAM: Galaxy Line Analyzer with MCMC, is publicly available at https://lvallini.github.io/MCMC_galaxyline_analyzer/ (Vallini et al., 2020, 2021, hereafter V20, V21). GLAM is a tool to perform Bayesian inference that is based on a physically motivated model for the analytical treatment of the radiative transfer of ionizing (, EUV) and non-ionizing (, FUV) photons in the ISM of galaxies (Ferrara et al., 2019, hereafter F19).
F19 enables the computation of the surface brightness of lines excited either in the ionized and/or in the photodissociation region (PDR; Hollenbach & Tielens, 1999; Wolfire et al., 2022) of a gas slab illuminated by ultraviolet (UV) radiation from newly formed stars. The surface brightness of the lines is determined by the average gas density () of the H/PDR environment – \colorblack characterized by electron density and neutral gas density , respectively333\colorblackBoth and can be expressed as a function of . In the ionized layer, assuming an ionized fraction , while in the PDR the neutral gas density given that . –, the dust-to-gas ratio, (, where is the gas metallicity), and ionisation parameter, . The latter, can be expressed in terms of observed quantities by deriving its relation ( /, see eqs. 38 and 40 in F19) with the star formation rate surface density () and the gas surface density (), which in turn are connected through the star formation law. This leaves us with the parameter, describing the burstiness of the galaxy. GLAM adopts a Markov Chain Monte Carlo (MCMC) algorithm (implemented with emcee, Foreman-Mackey et al., 2013) to search for the posterior probability of the model parameters (, , ) that reproduce the observed [C ] surface brightness (), [O ] surface brightness (), and the SFR surface density (). GLAM accounts for the observed errors (, , ) and can accept also different lines (e.g. CIII]1909 instead of [O ]) as input (V20, Markov et al., 2022).
black It is worth noting that the F19 model assumes a fixed O/C ratio (Asplund et al., 2009), with carbon and oxygen abundances linearly scaling with metallicity, and a constant gas temperature in the ionized layer () and PDR (). The impact of the latter assumption has been tested against numerical radiative transfer calculations performed with CLOUDY (Ferland
et al., 2017) over a wide range of ionization parameters and metallicities. Overall, the agreement is very good (see Figure 3 in F19), with CLOUDY confirming both the amplitude and linear slope of the increasing [C ] flux with gas metallicity, along with the saturation of the [C ] flux for increasing . In spite of the inevitable simplifications of an analytical model such as that of F19, the differences with CLOUDY are relatively small (e.g. the [C ] flux is overestimated by F19 at most by at any ). Moreover, as outlined in V21, the temperature in the ionized layer does not have a strong impact on the predicted [O ] flux. The 88 line, and the other transition in the doublet ([O ] at 52). have similar excitation energy ( and ) but different critical densities, hence for K their ratio is only affected by the gas density (Palay et al., 2012).
Up to now, the exploitation of GLAM in hign- galaxies has been limited to the derivation of the galaxy-averaged values (V20, V21, Markov et al., 2022) because of the relatively low ( kpc scales) spatial resolution of the [C ], [O ], and CIII] data (Smit et al., 2018; Carniani et al., 2020; Markov et al., 2022, respectively) used as input in the code. The recent work by Witstok et al. (2022), which gathers moderate resolution () [C ] and [O ] observations in a sample of galaxies, regridded to a common coordinate mesh of sub-kpc pixels, allows us for the first time the use of GLAM on a pixel-by-pixel basis, and the characterization at sub-kpc scales of the ISM properties of EoR sources.
We perform two types of analysis with GLAM. First, we fit a 2D Gaussian profile to the [C ], [O ], UV, and IR continuum maps, to compute the global size of the emission (,, ) and, with that, infer the mean , , . The choice of a 2D gaussian profile, instead of e.g. an exponential one, is for consistency with the V21 analysis sources with barely resolved observations. Second, we feed to the model the , , of each -pixel of the grid (pixel size kpc, depending on the source), for which all the three quantities are above the level, to obtain spatially resolved derivation of the ISM parameters.
4 Results
In this Section we presents our results and their implications, starting with an overview of the spatially resolved vs global gas density, metallicity, and burstiness values computed with GLAM (Sec. 4.1). We then focus on key quantities from which we can infer insights on the ISM enrichment and baryon cycle (Sec. 4.2), the conversion of the gas into stars (Sec. 4.3), and the dust properties (Sec. 4.4) in the EoR.
4.1 Spatially resolved vs global ISM properties
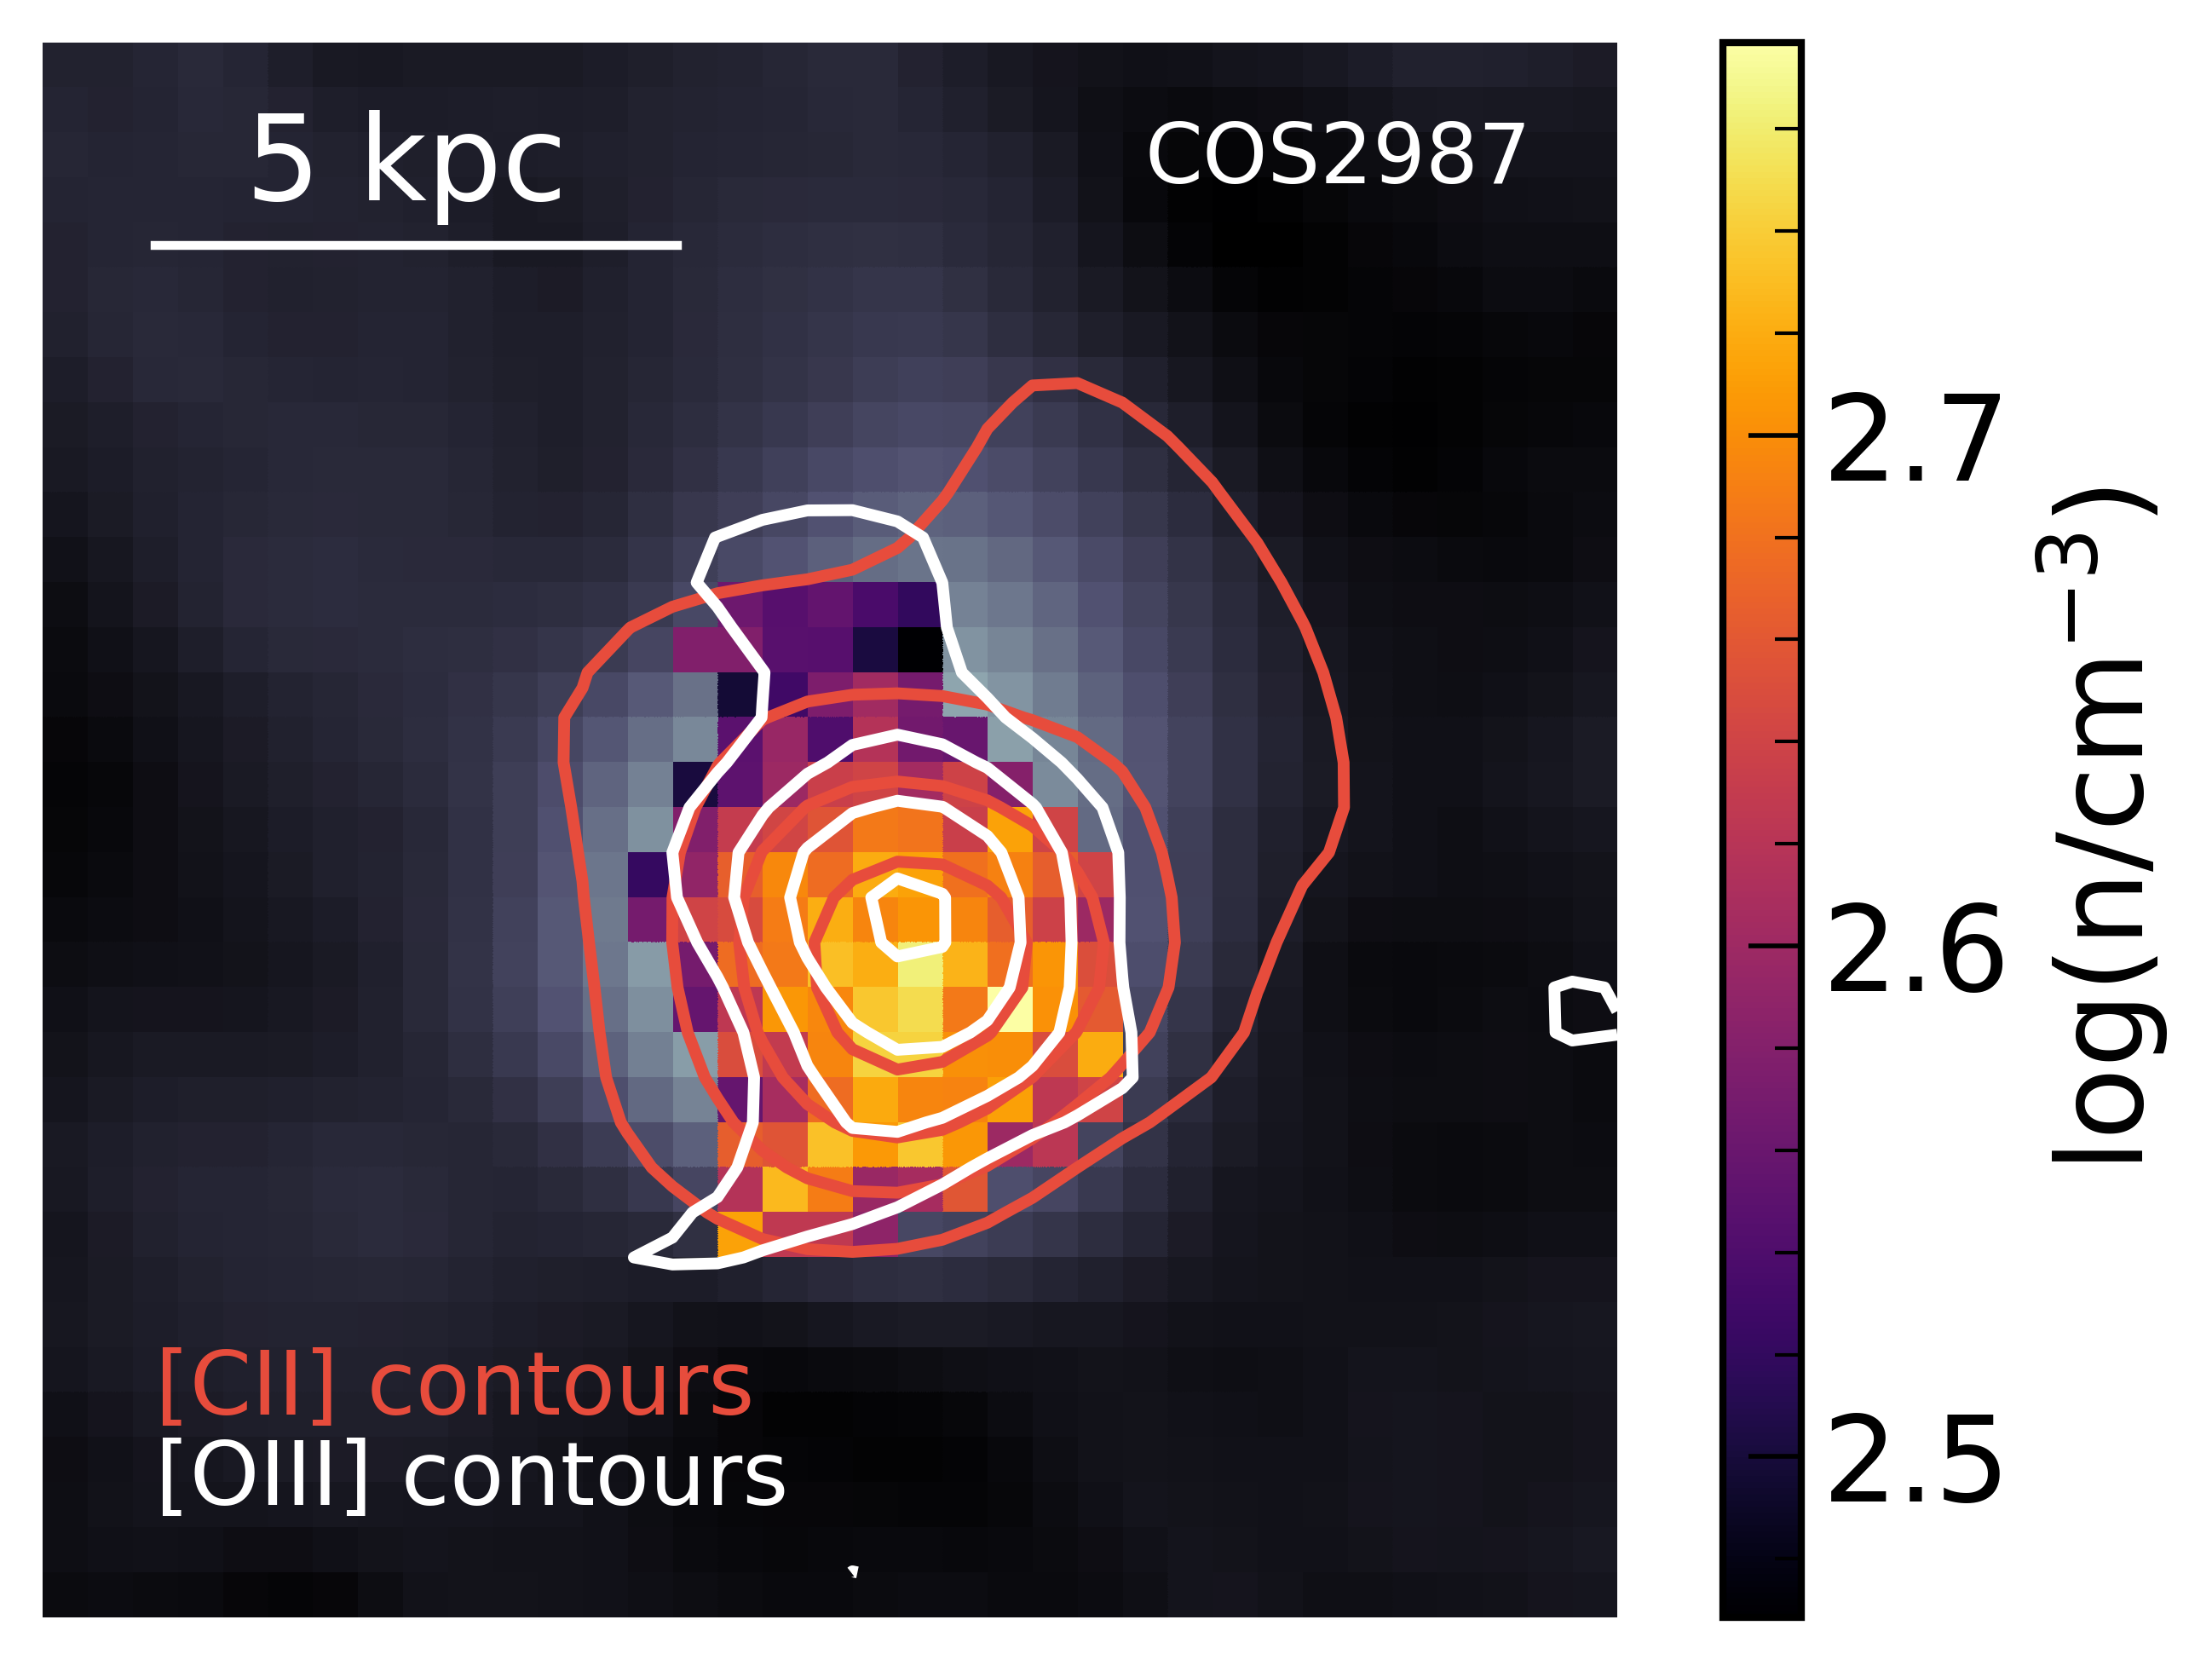
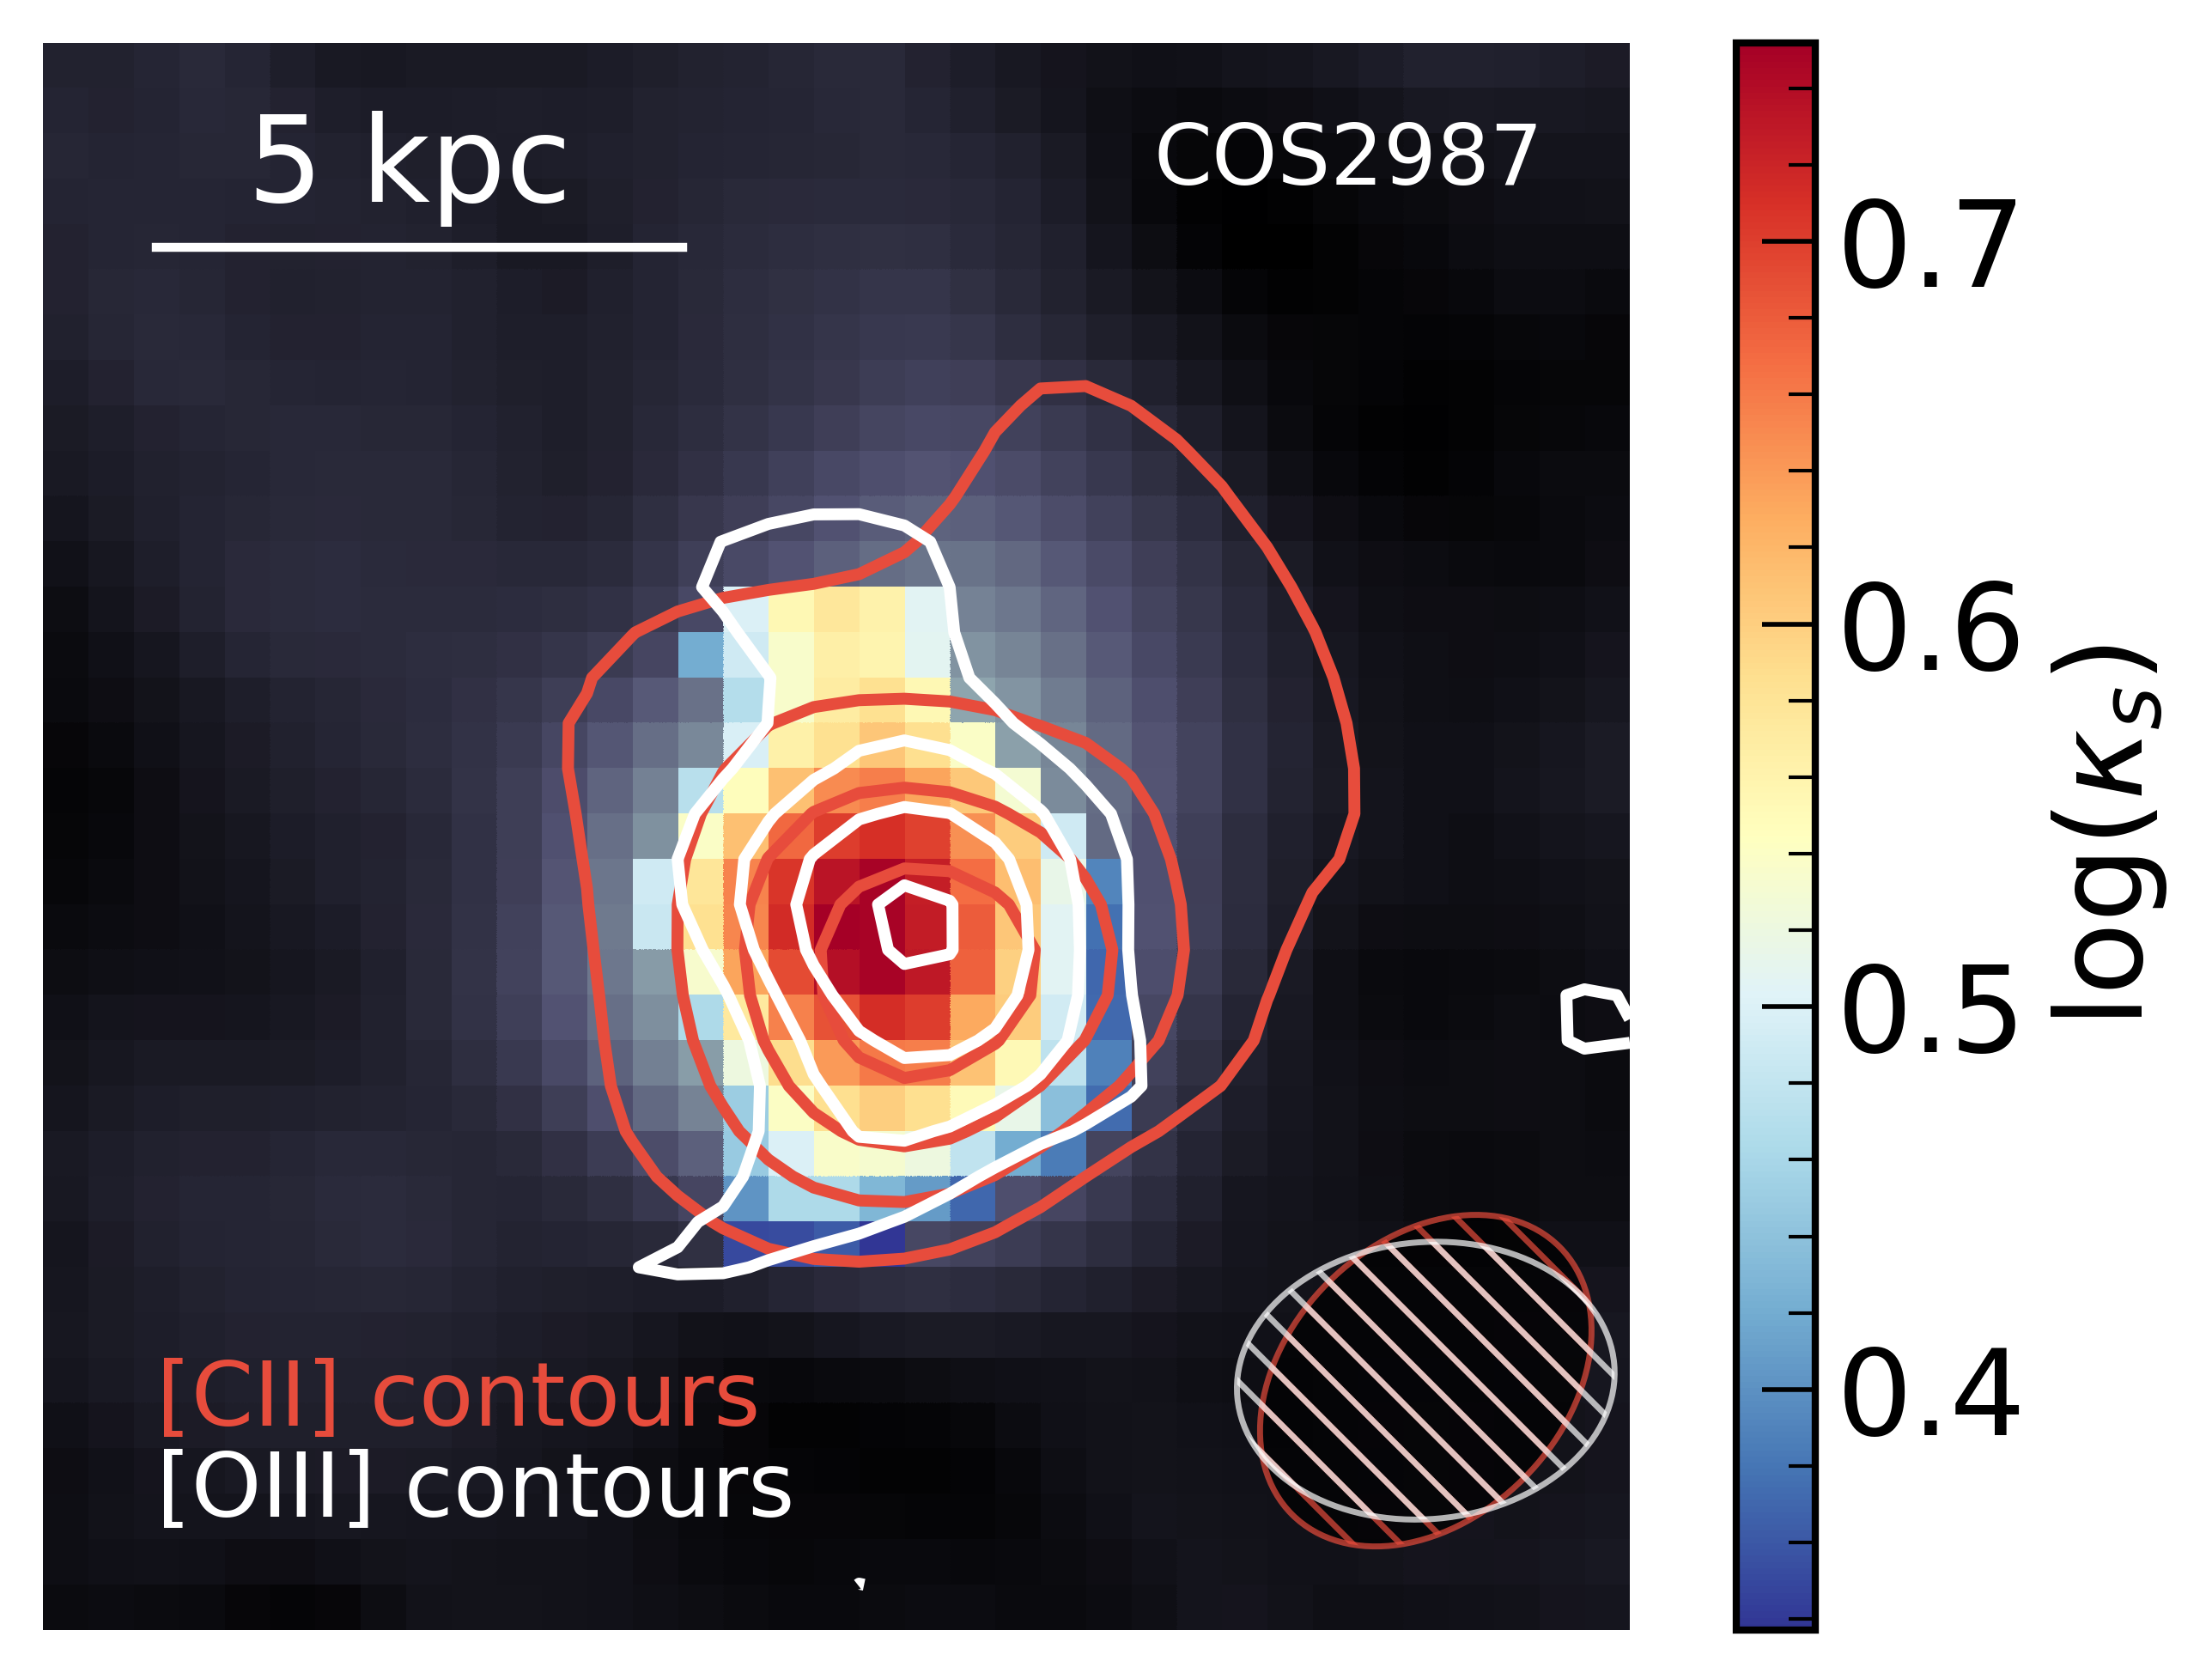
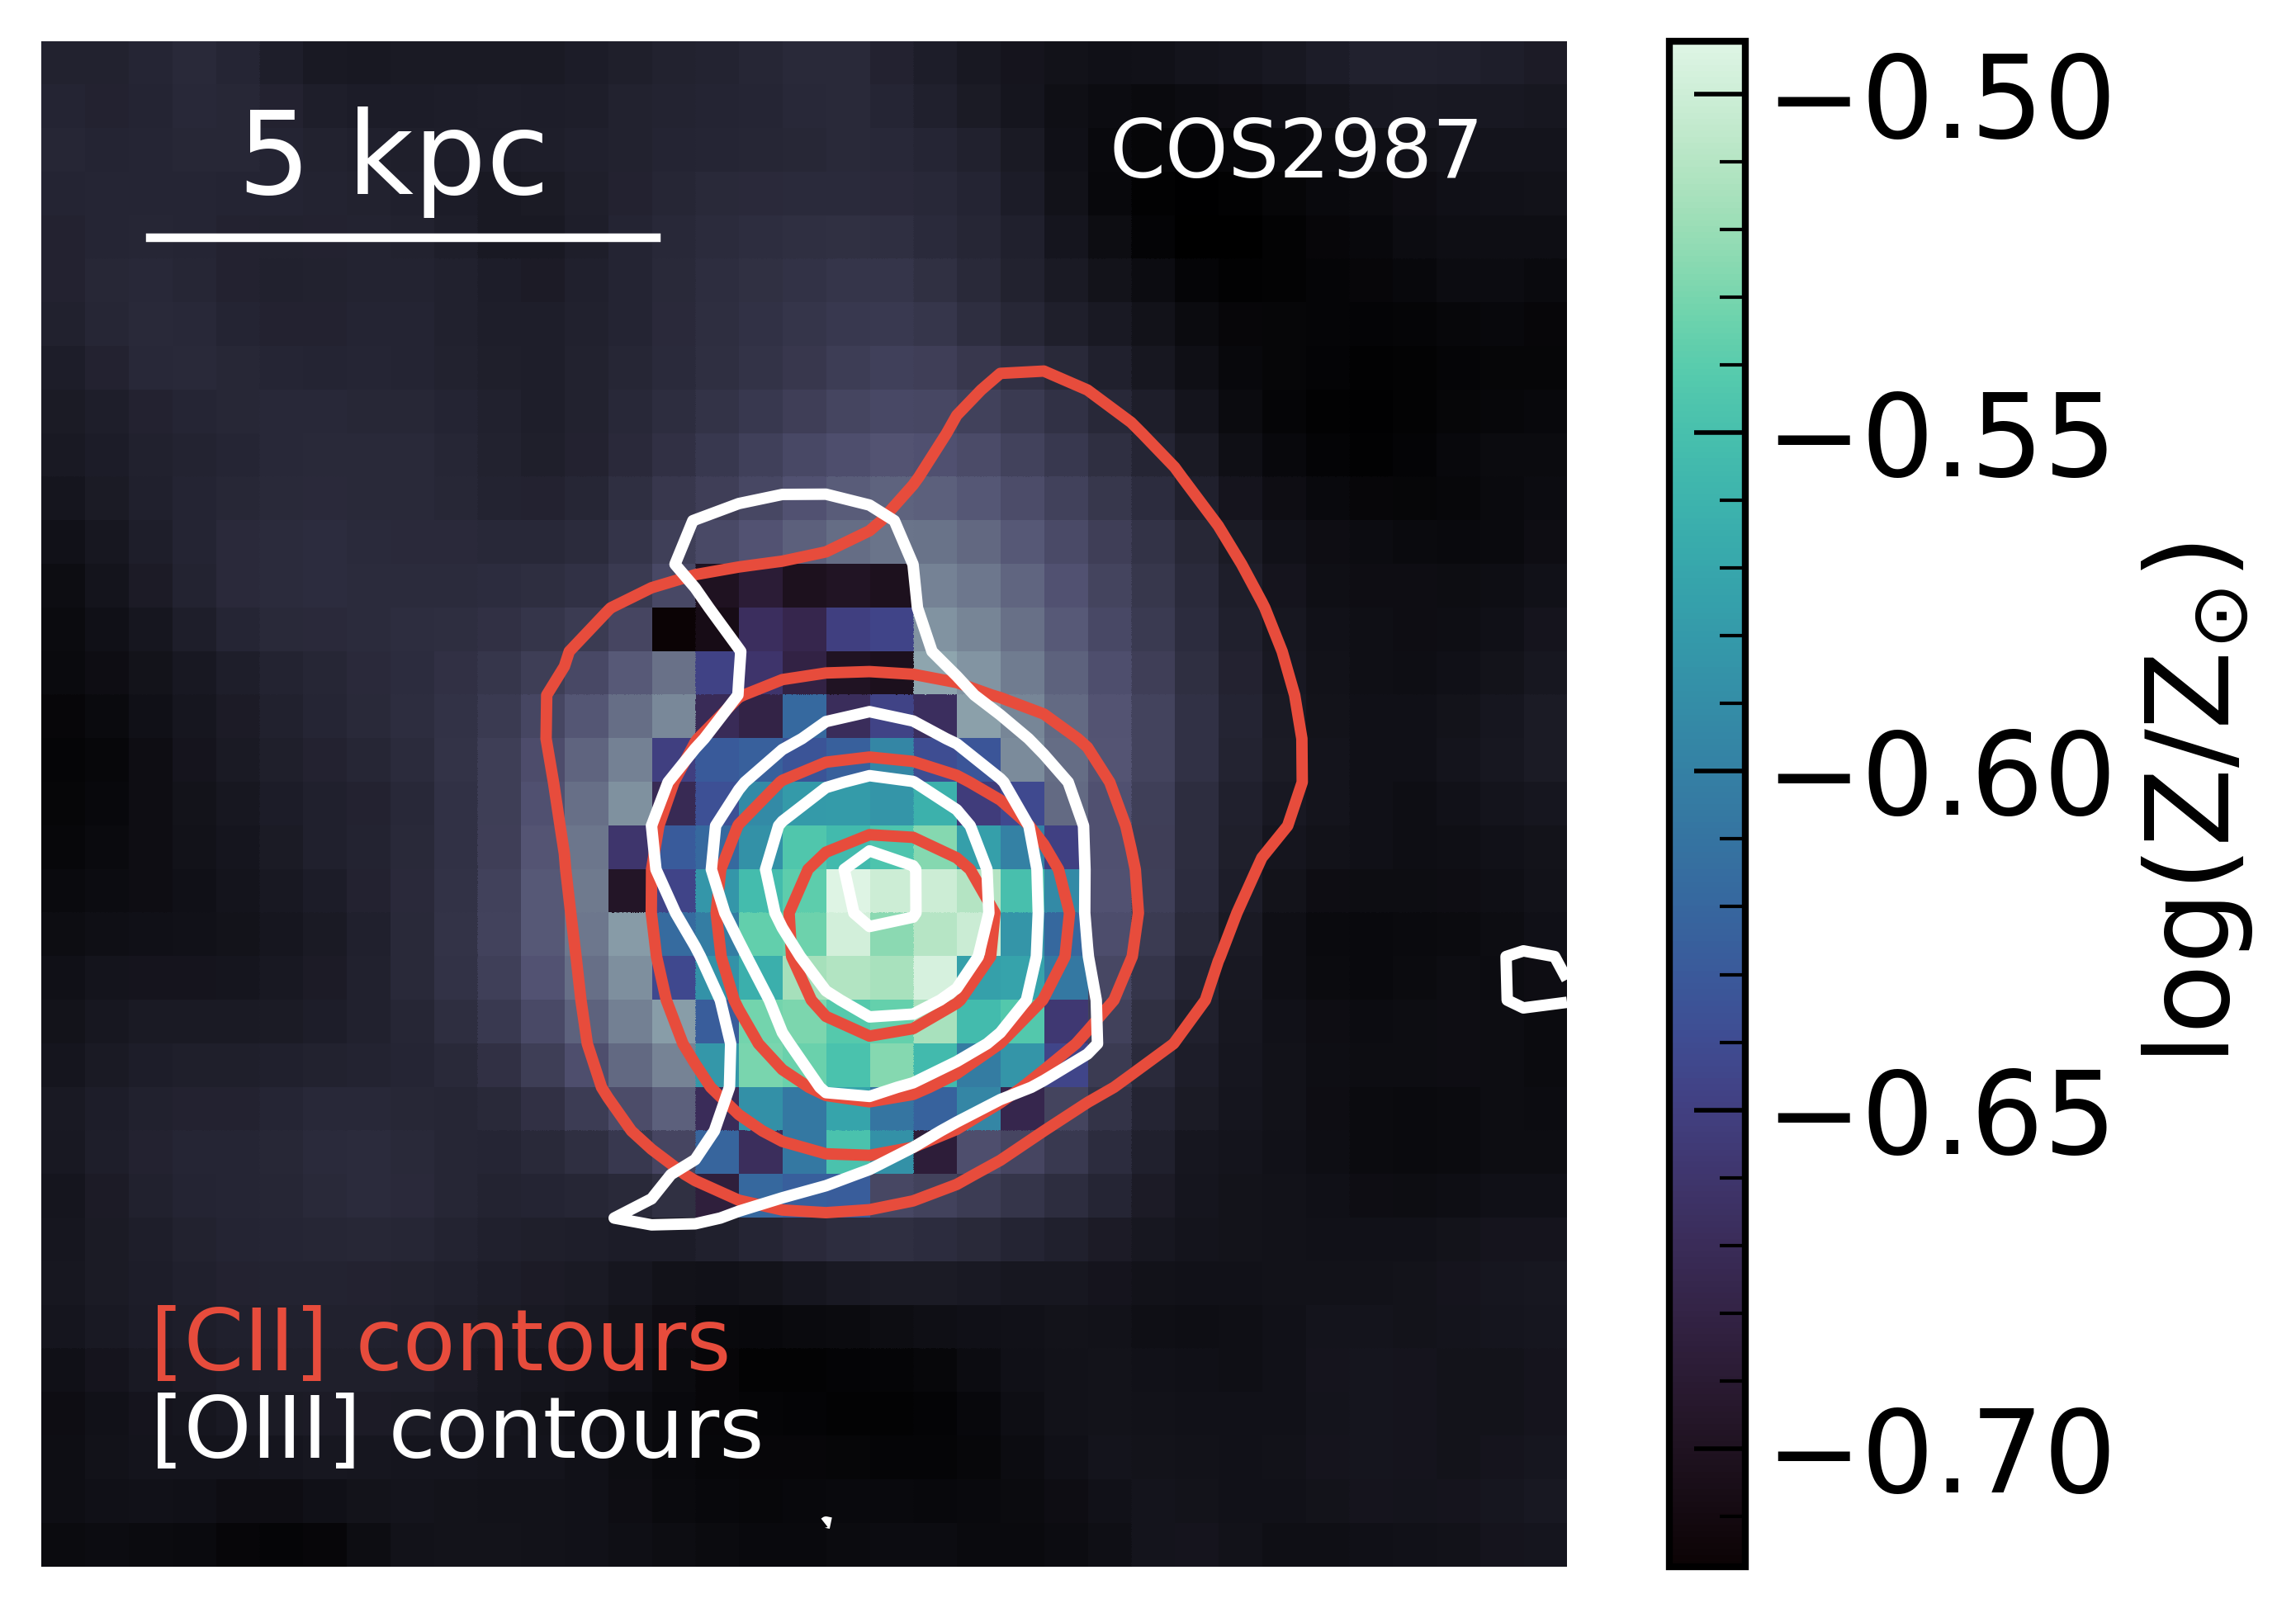
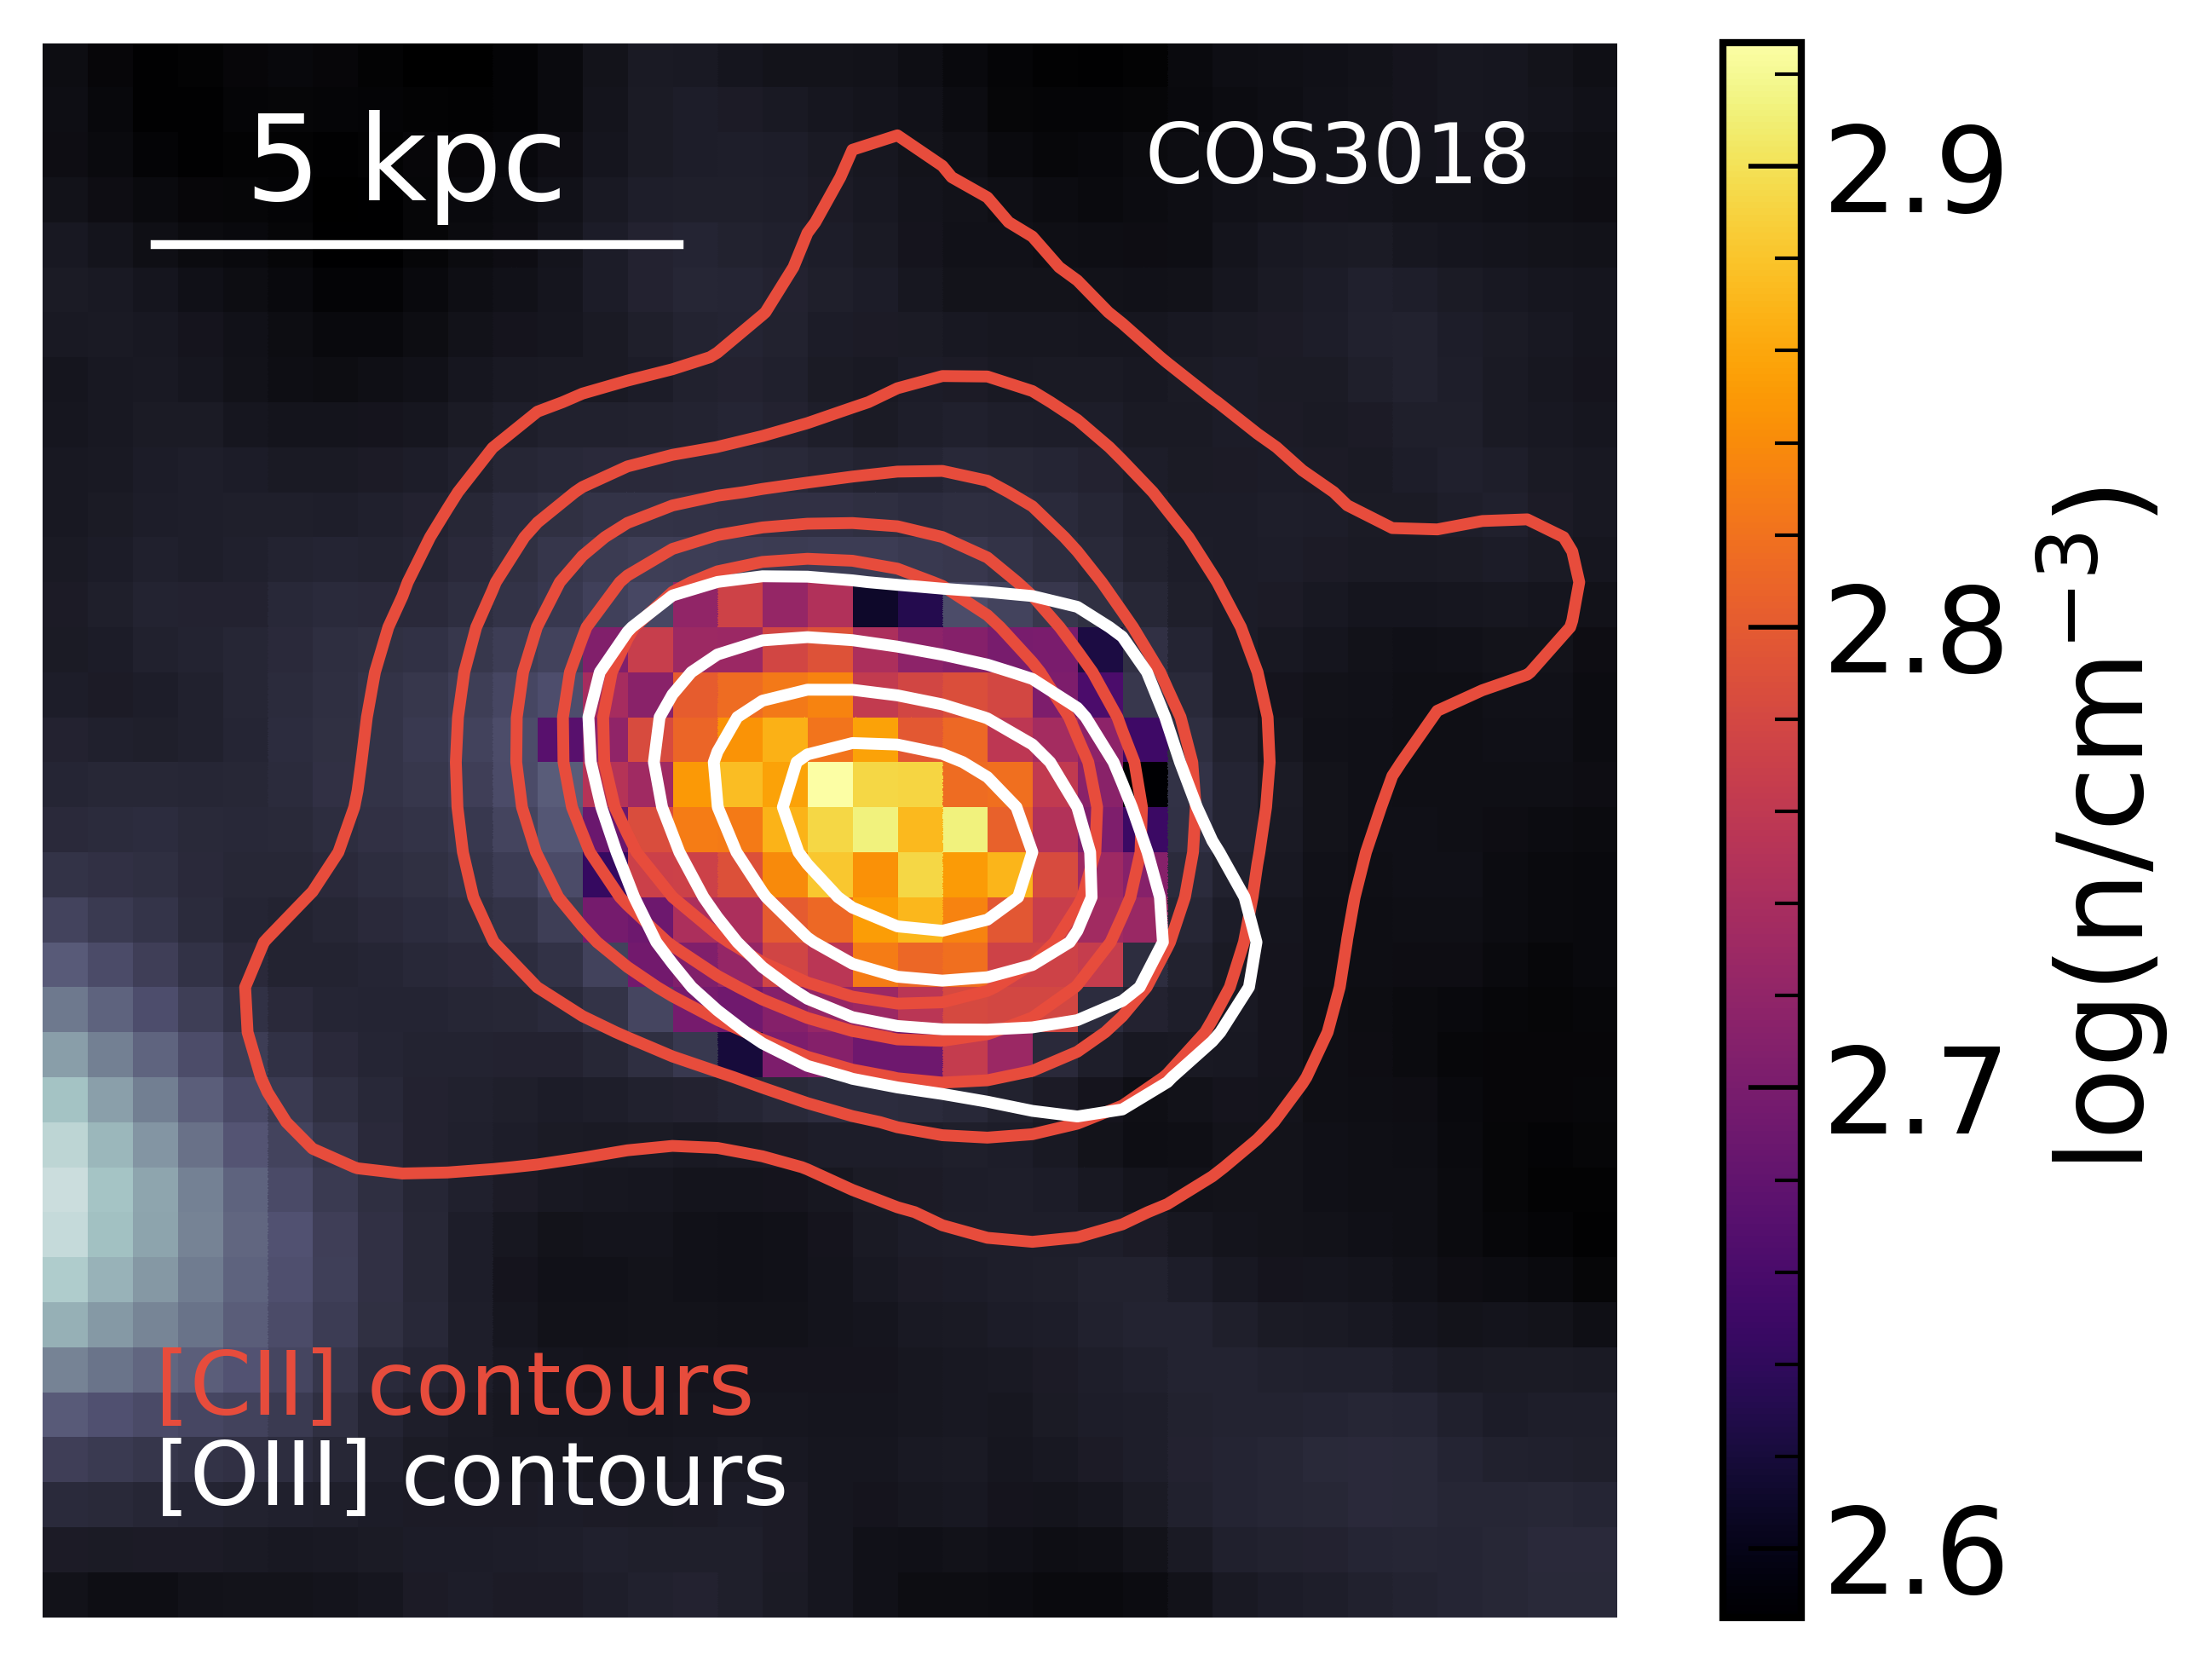
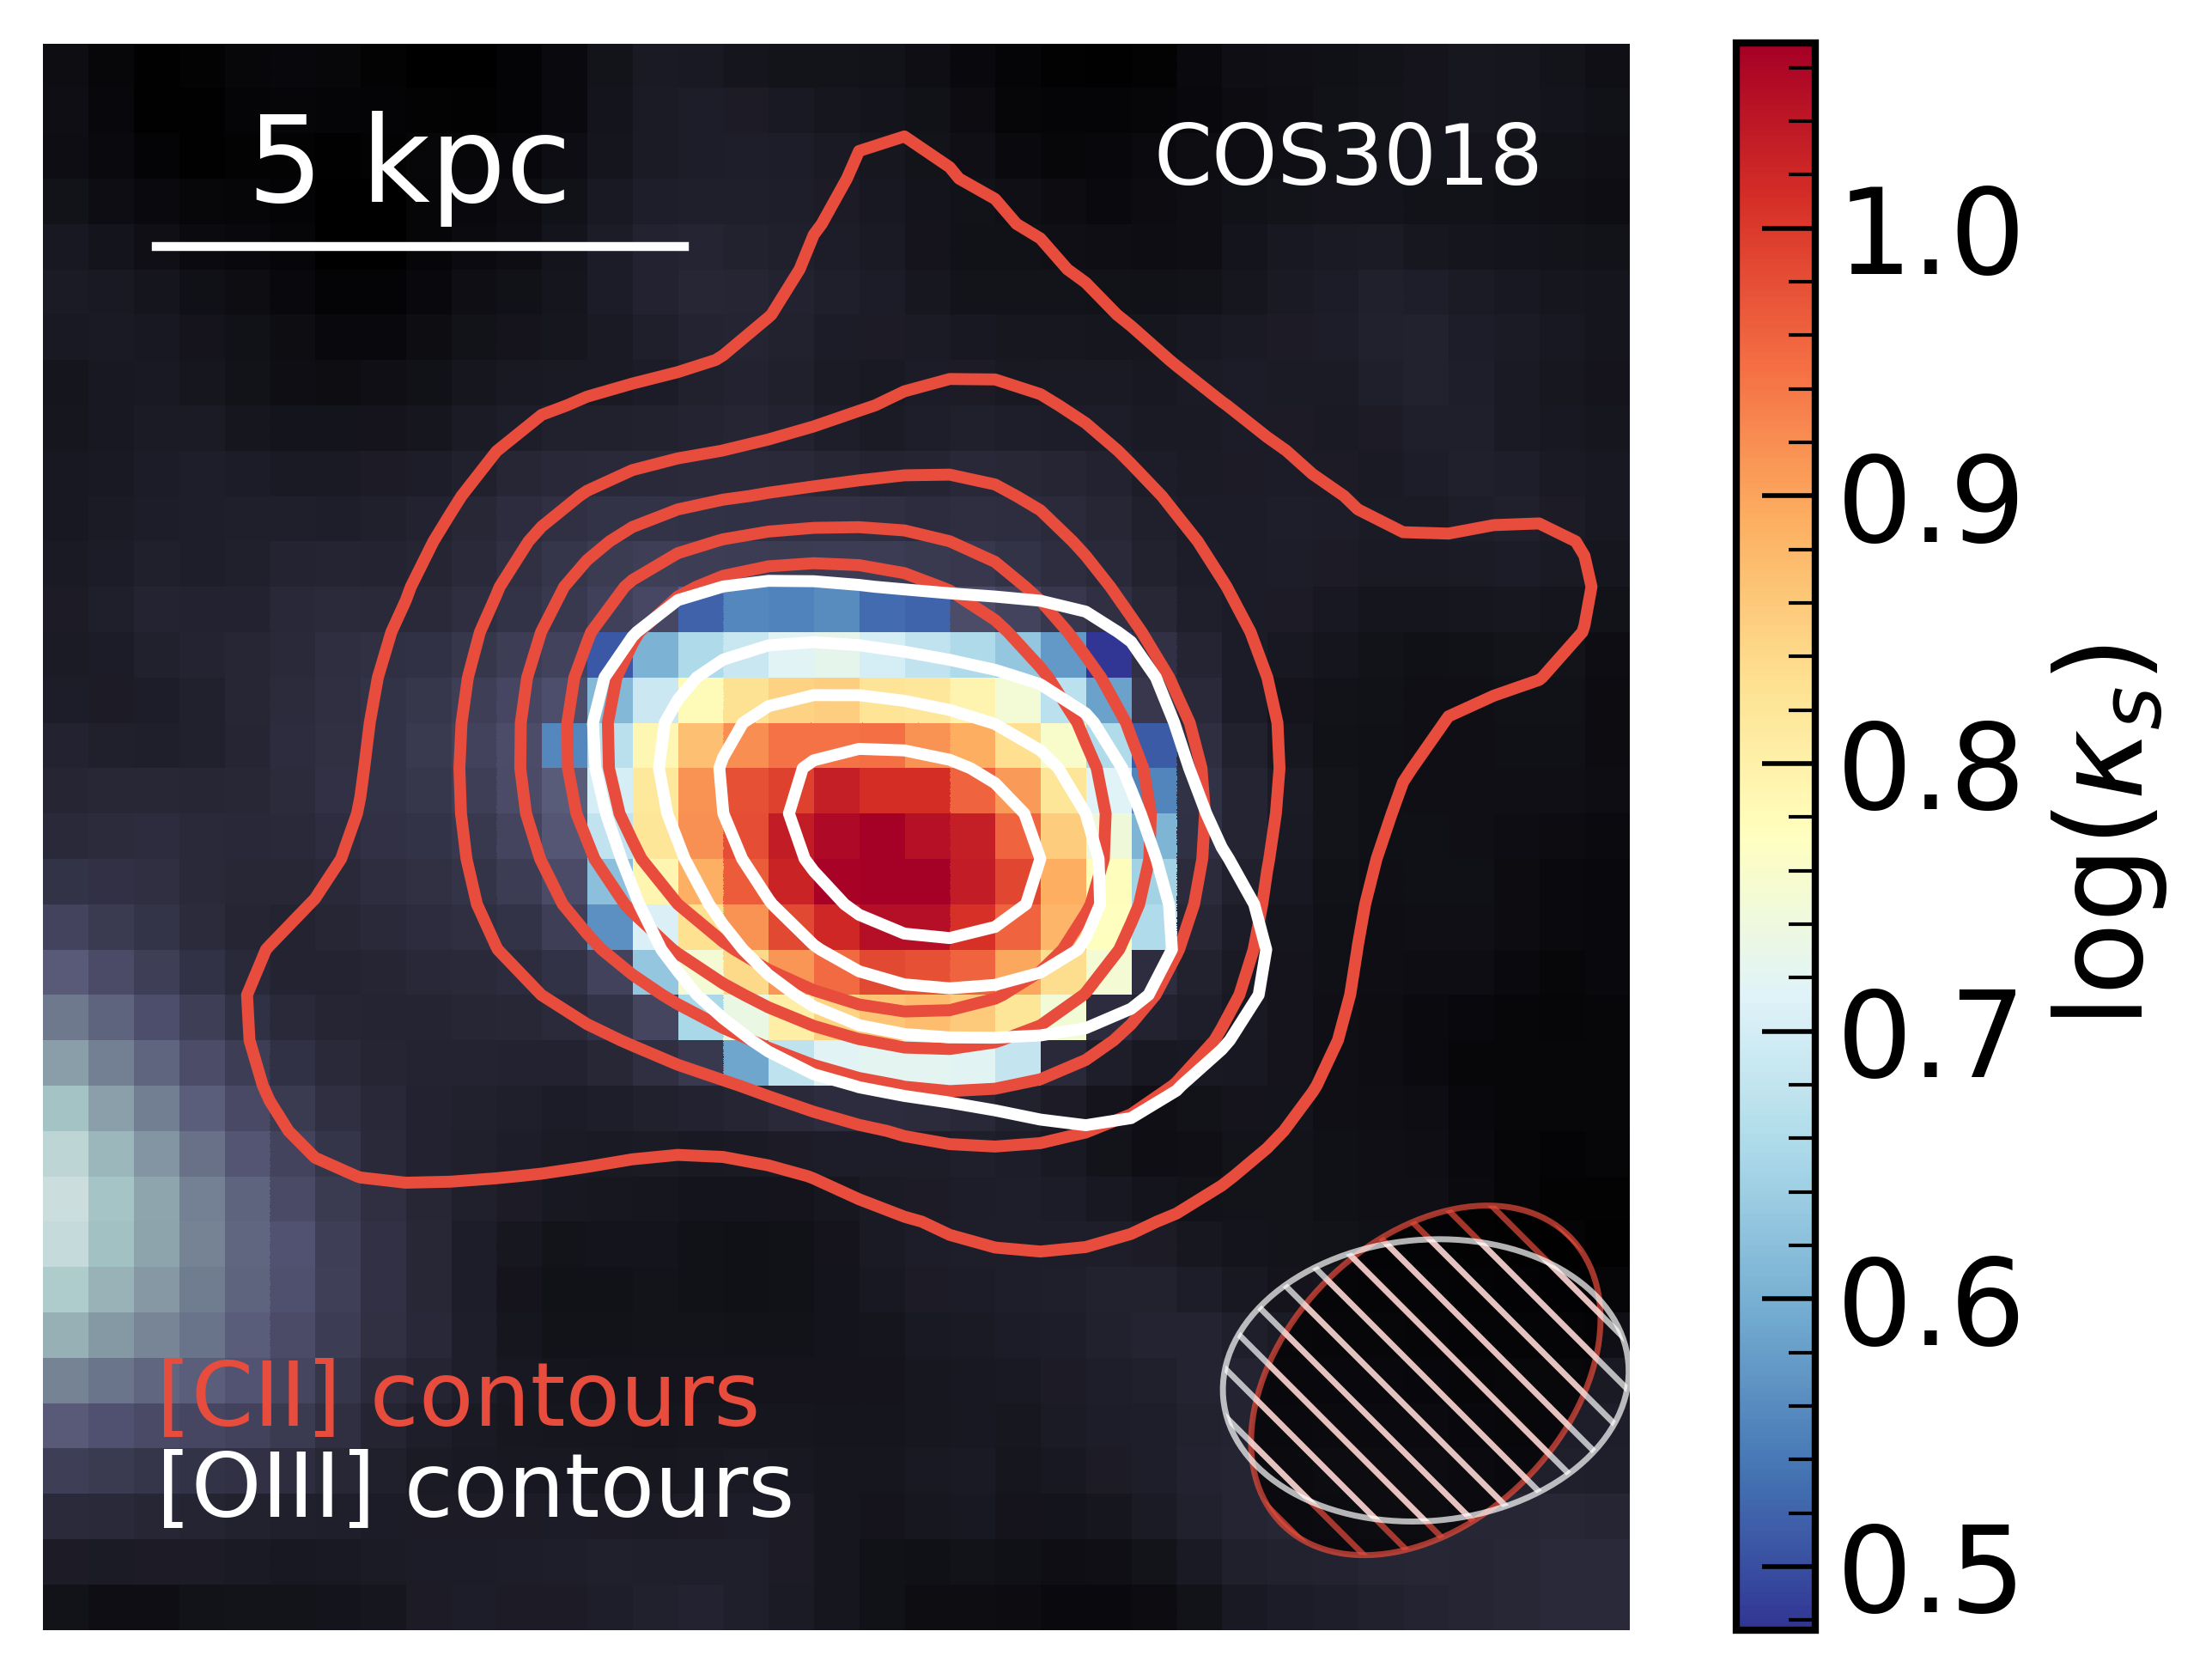
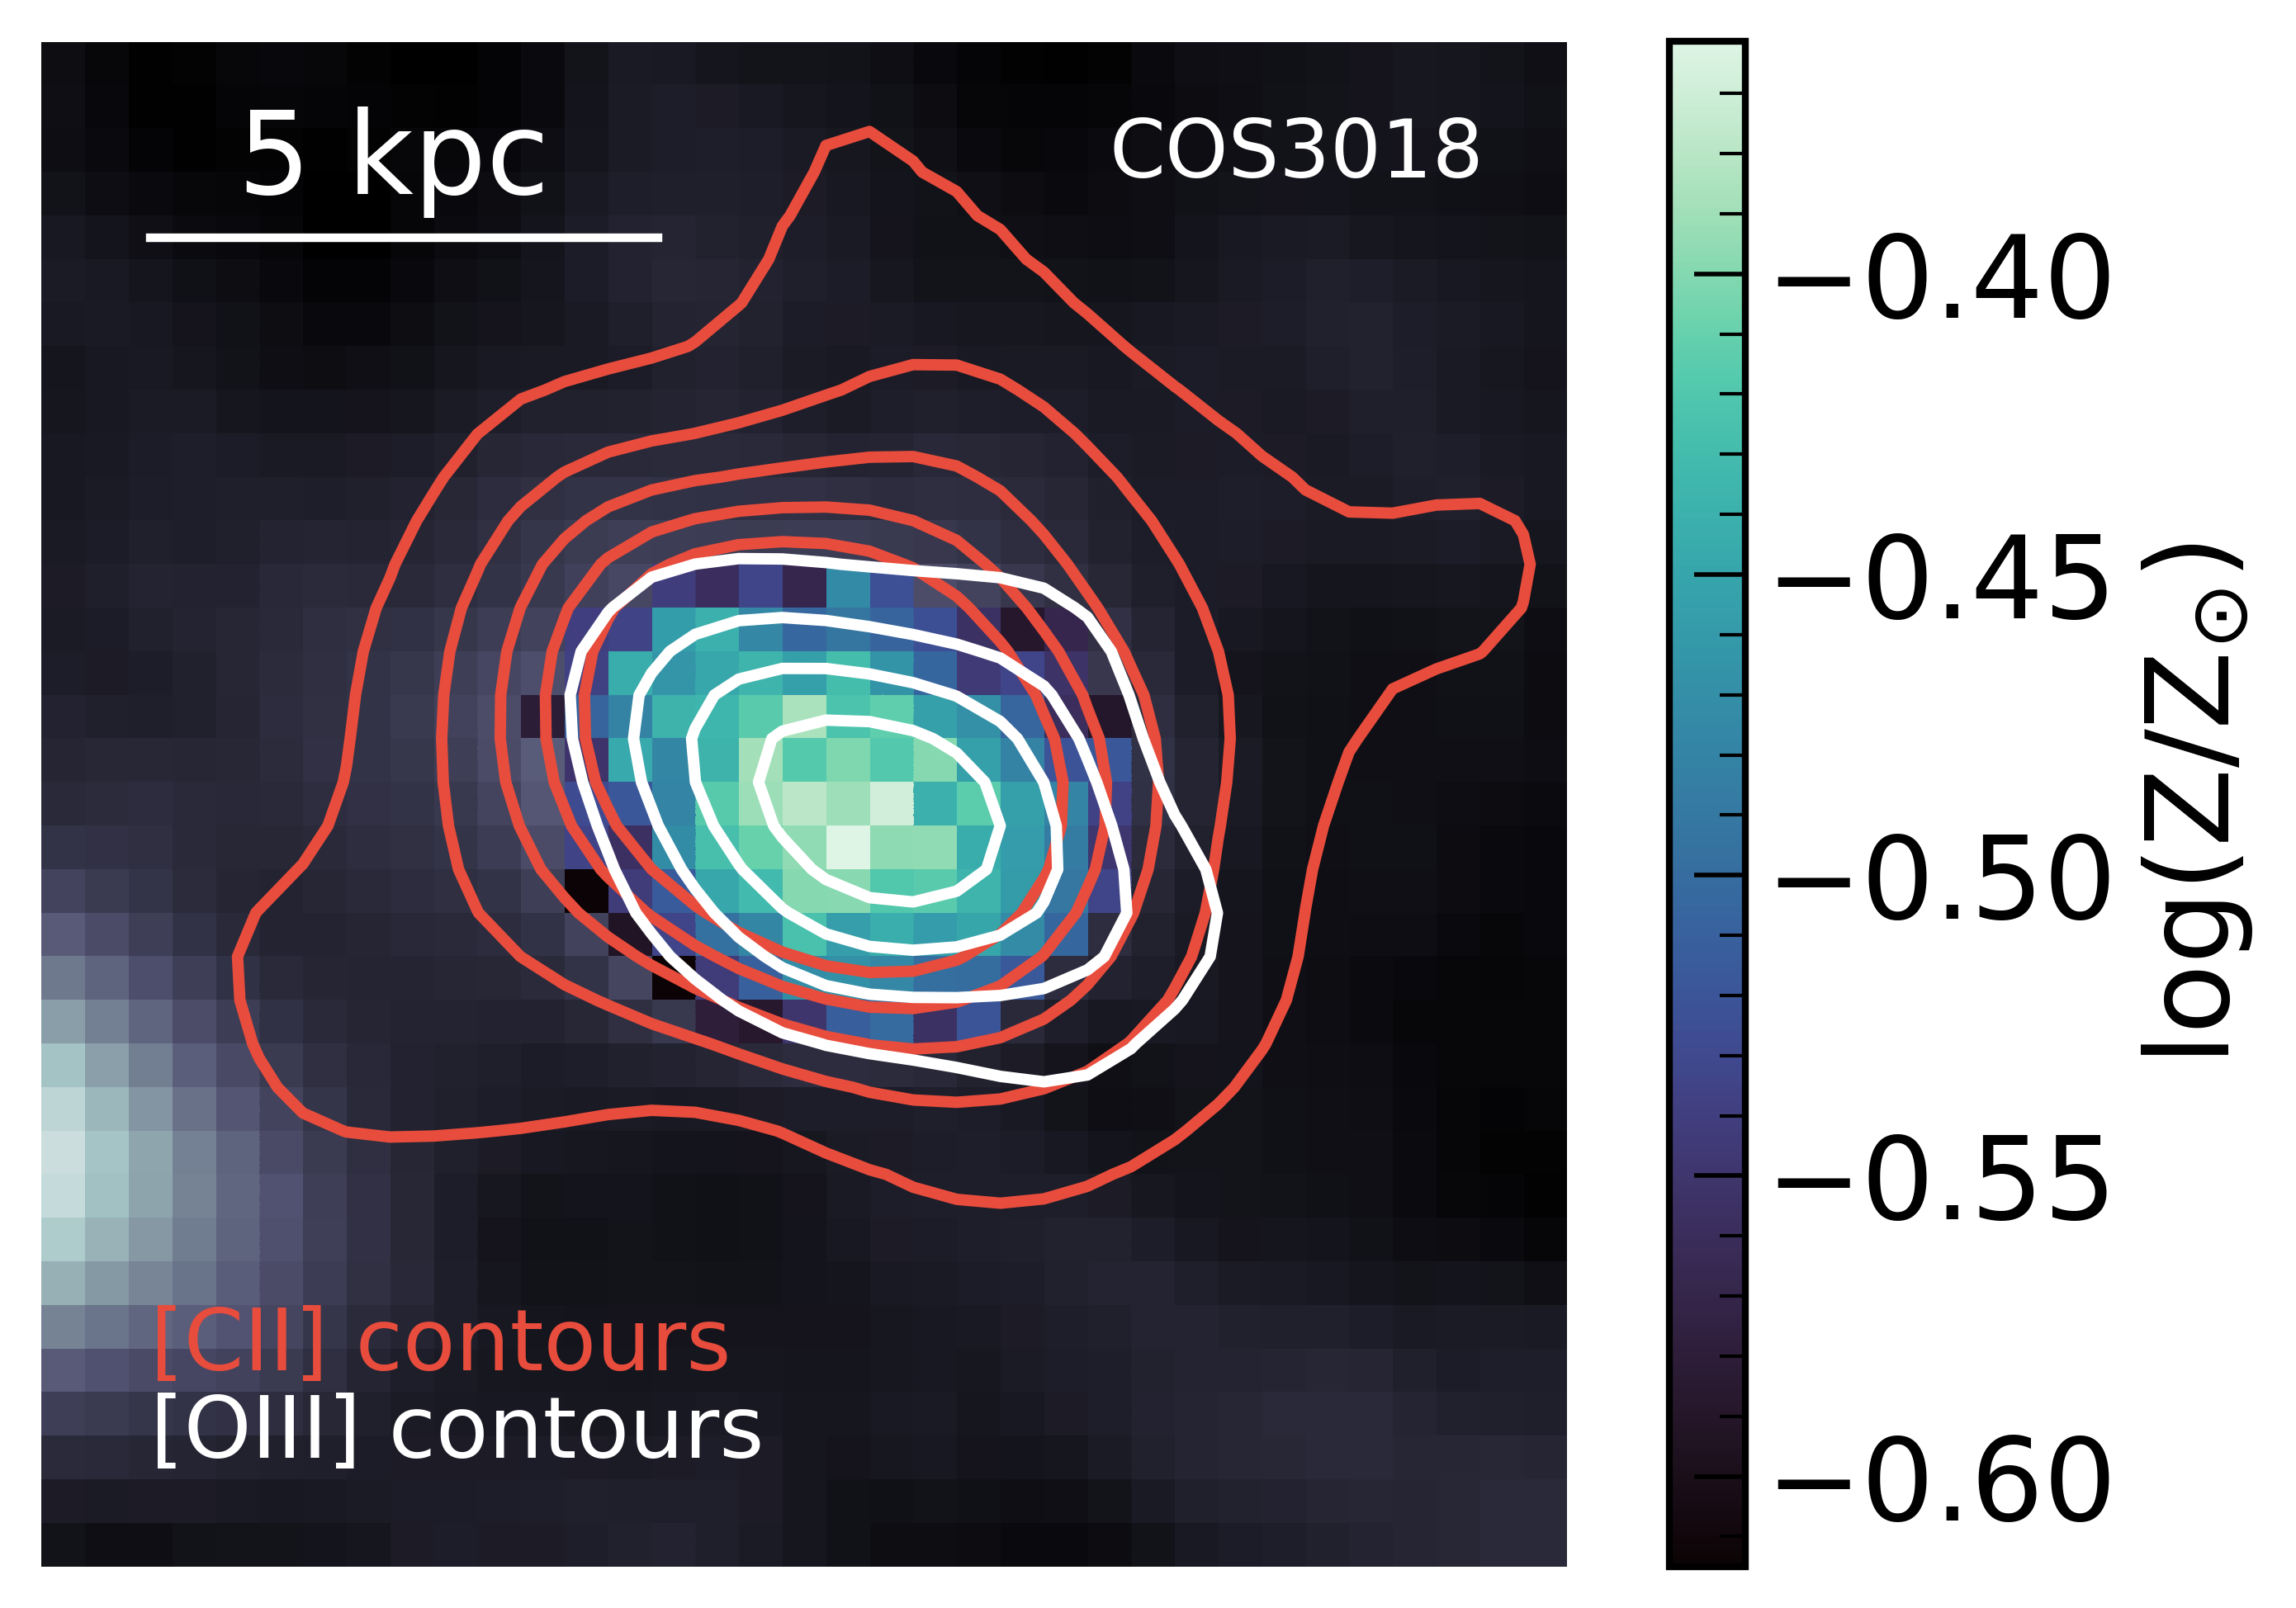
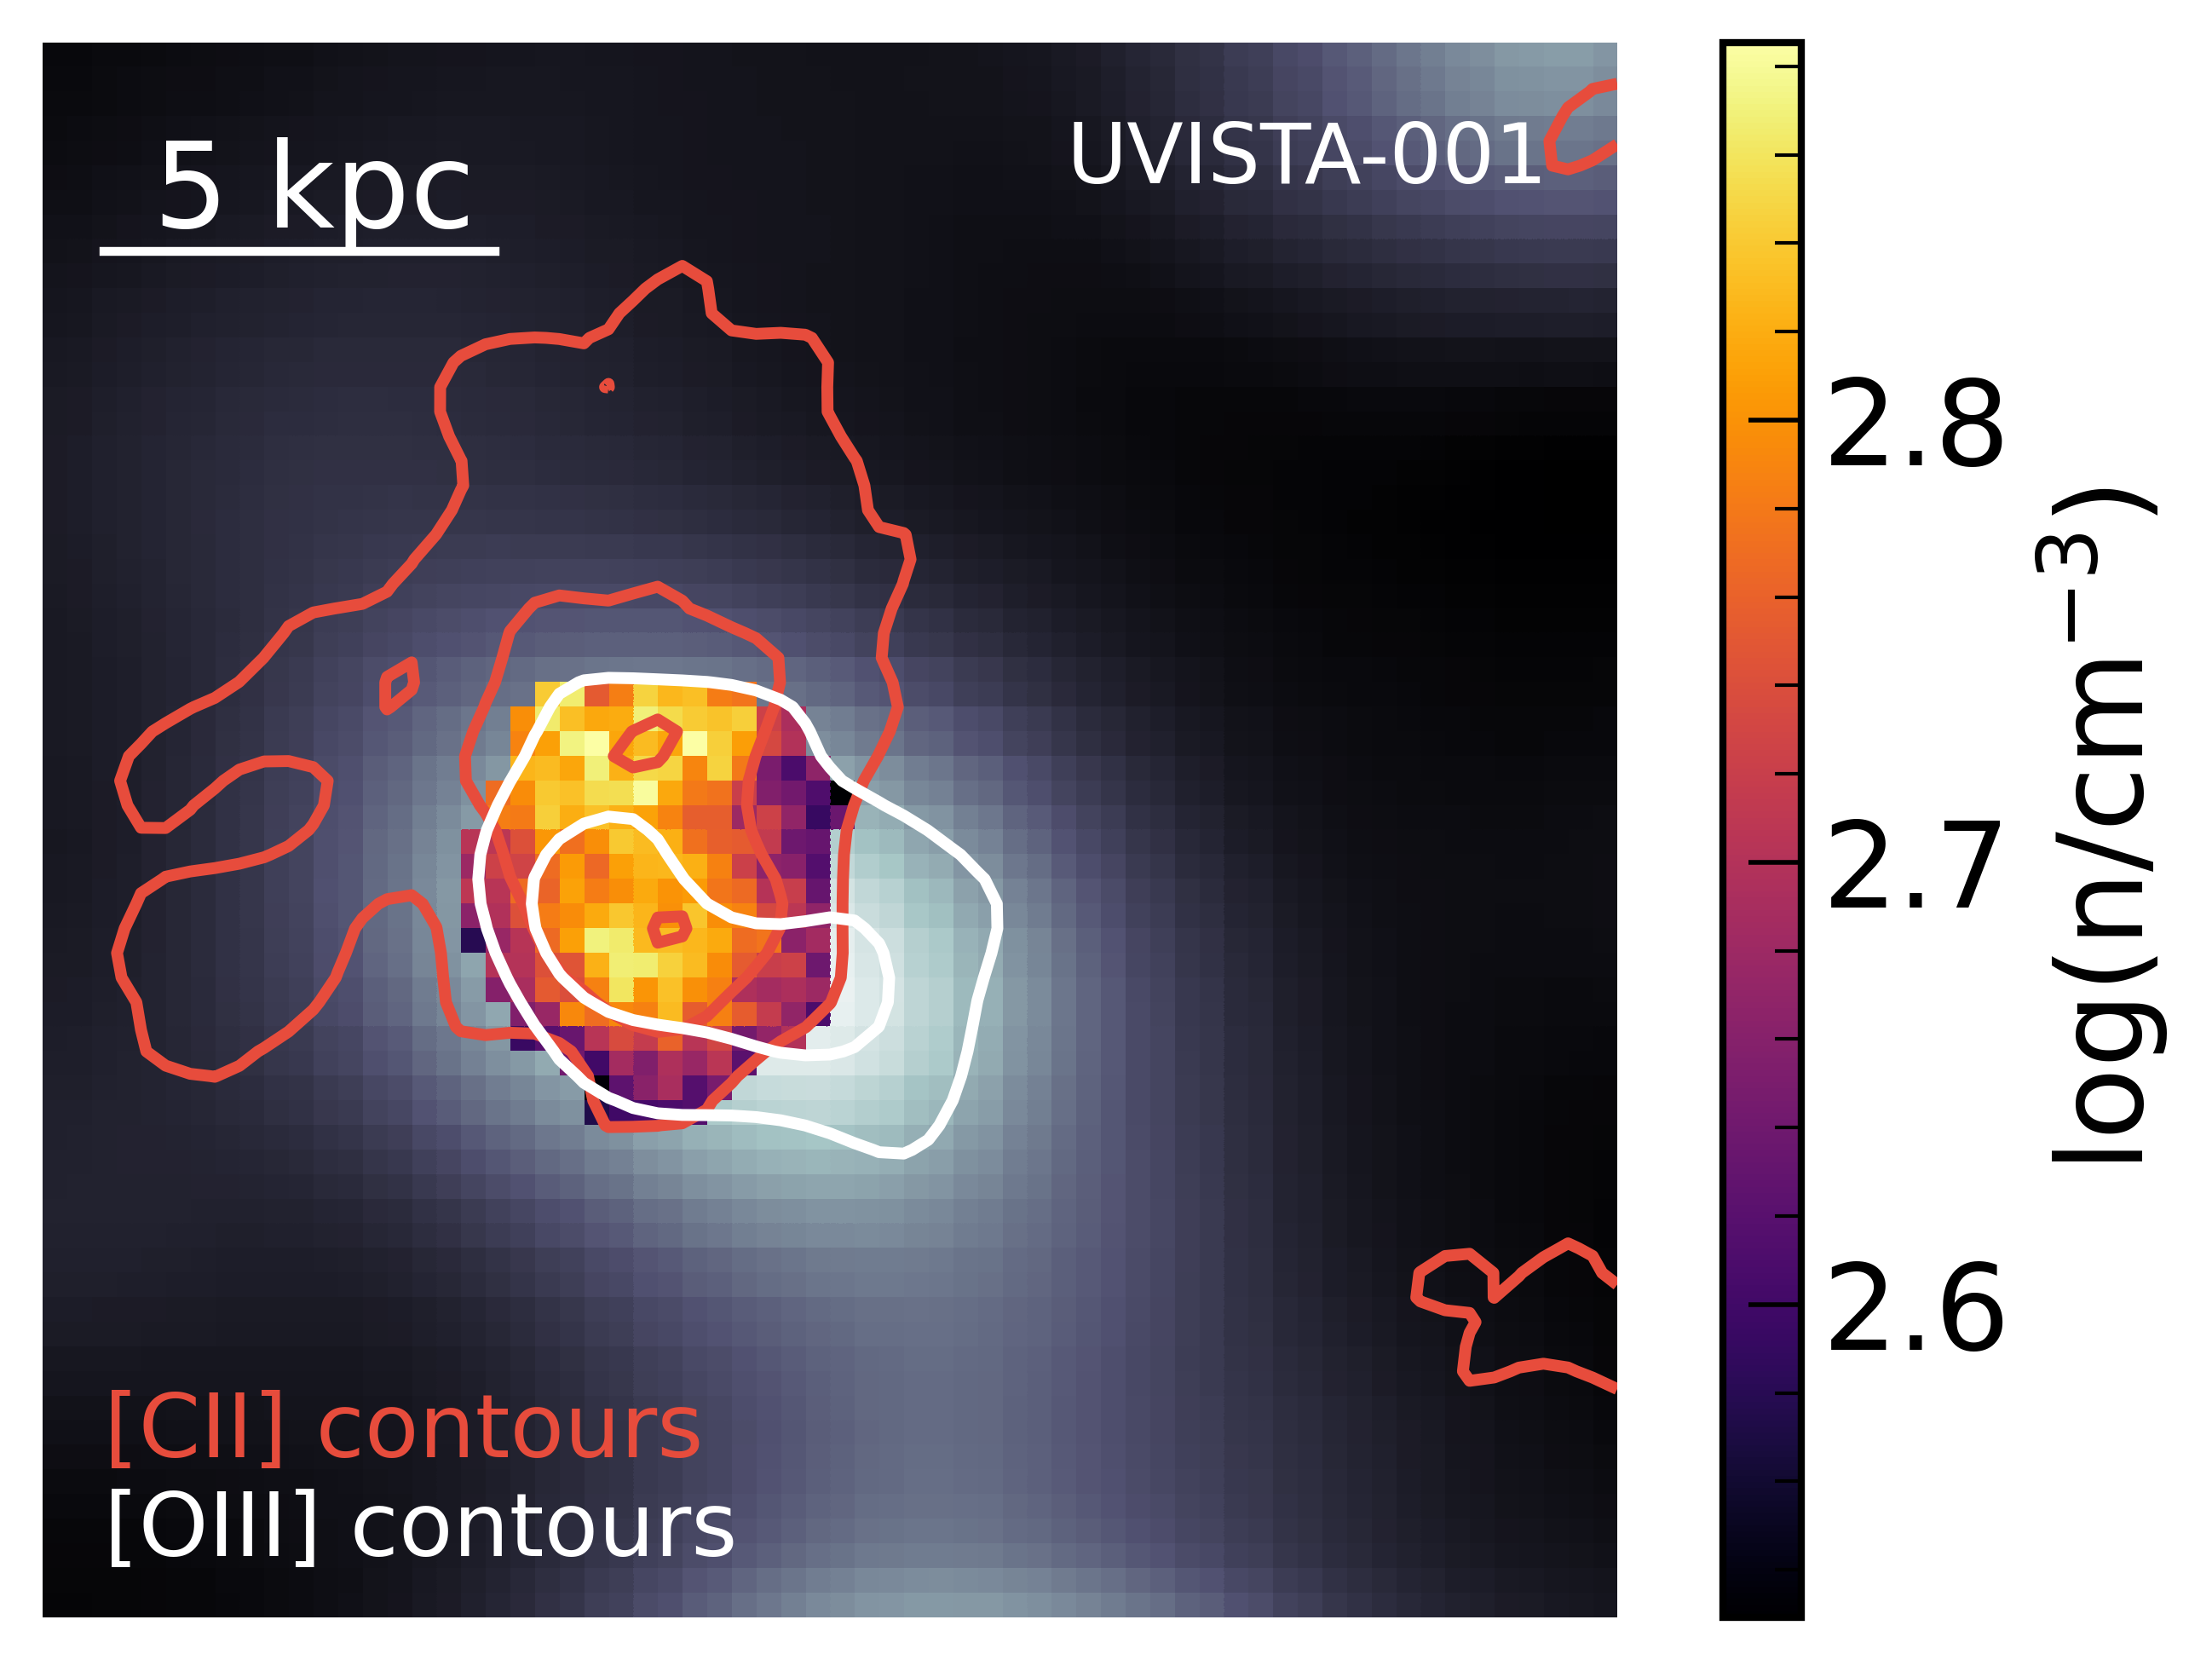
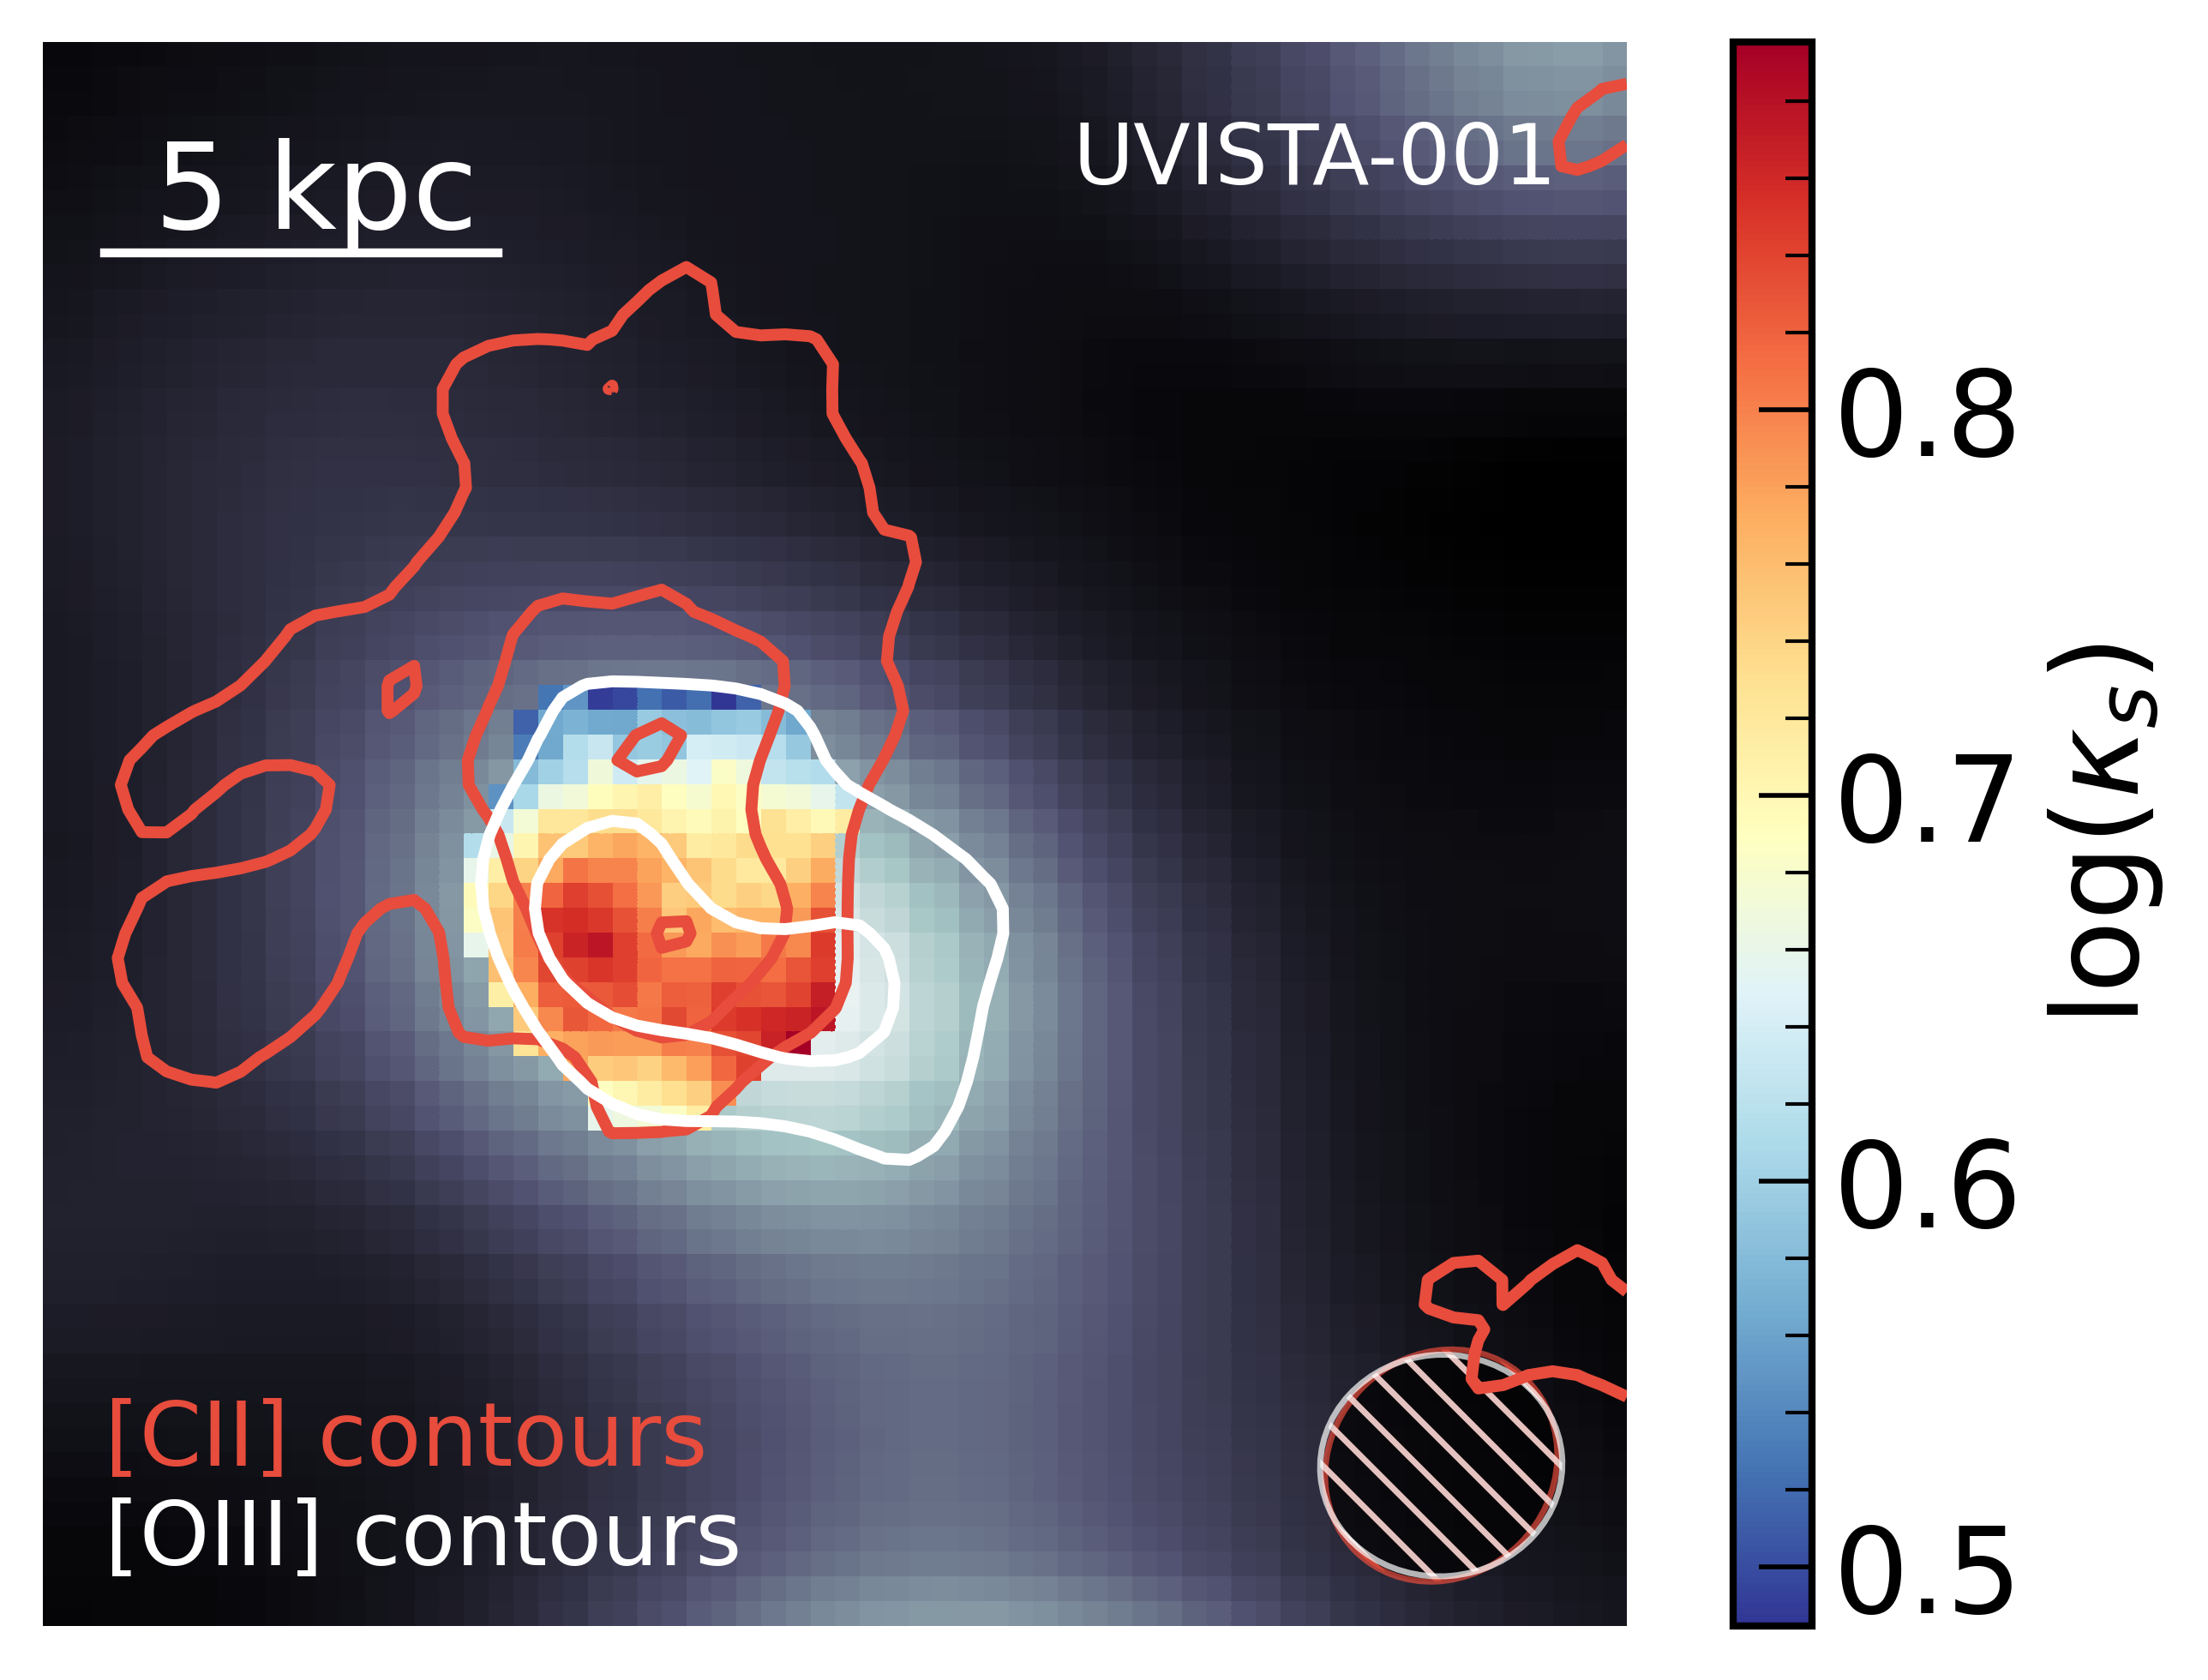
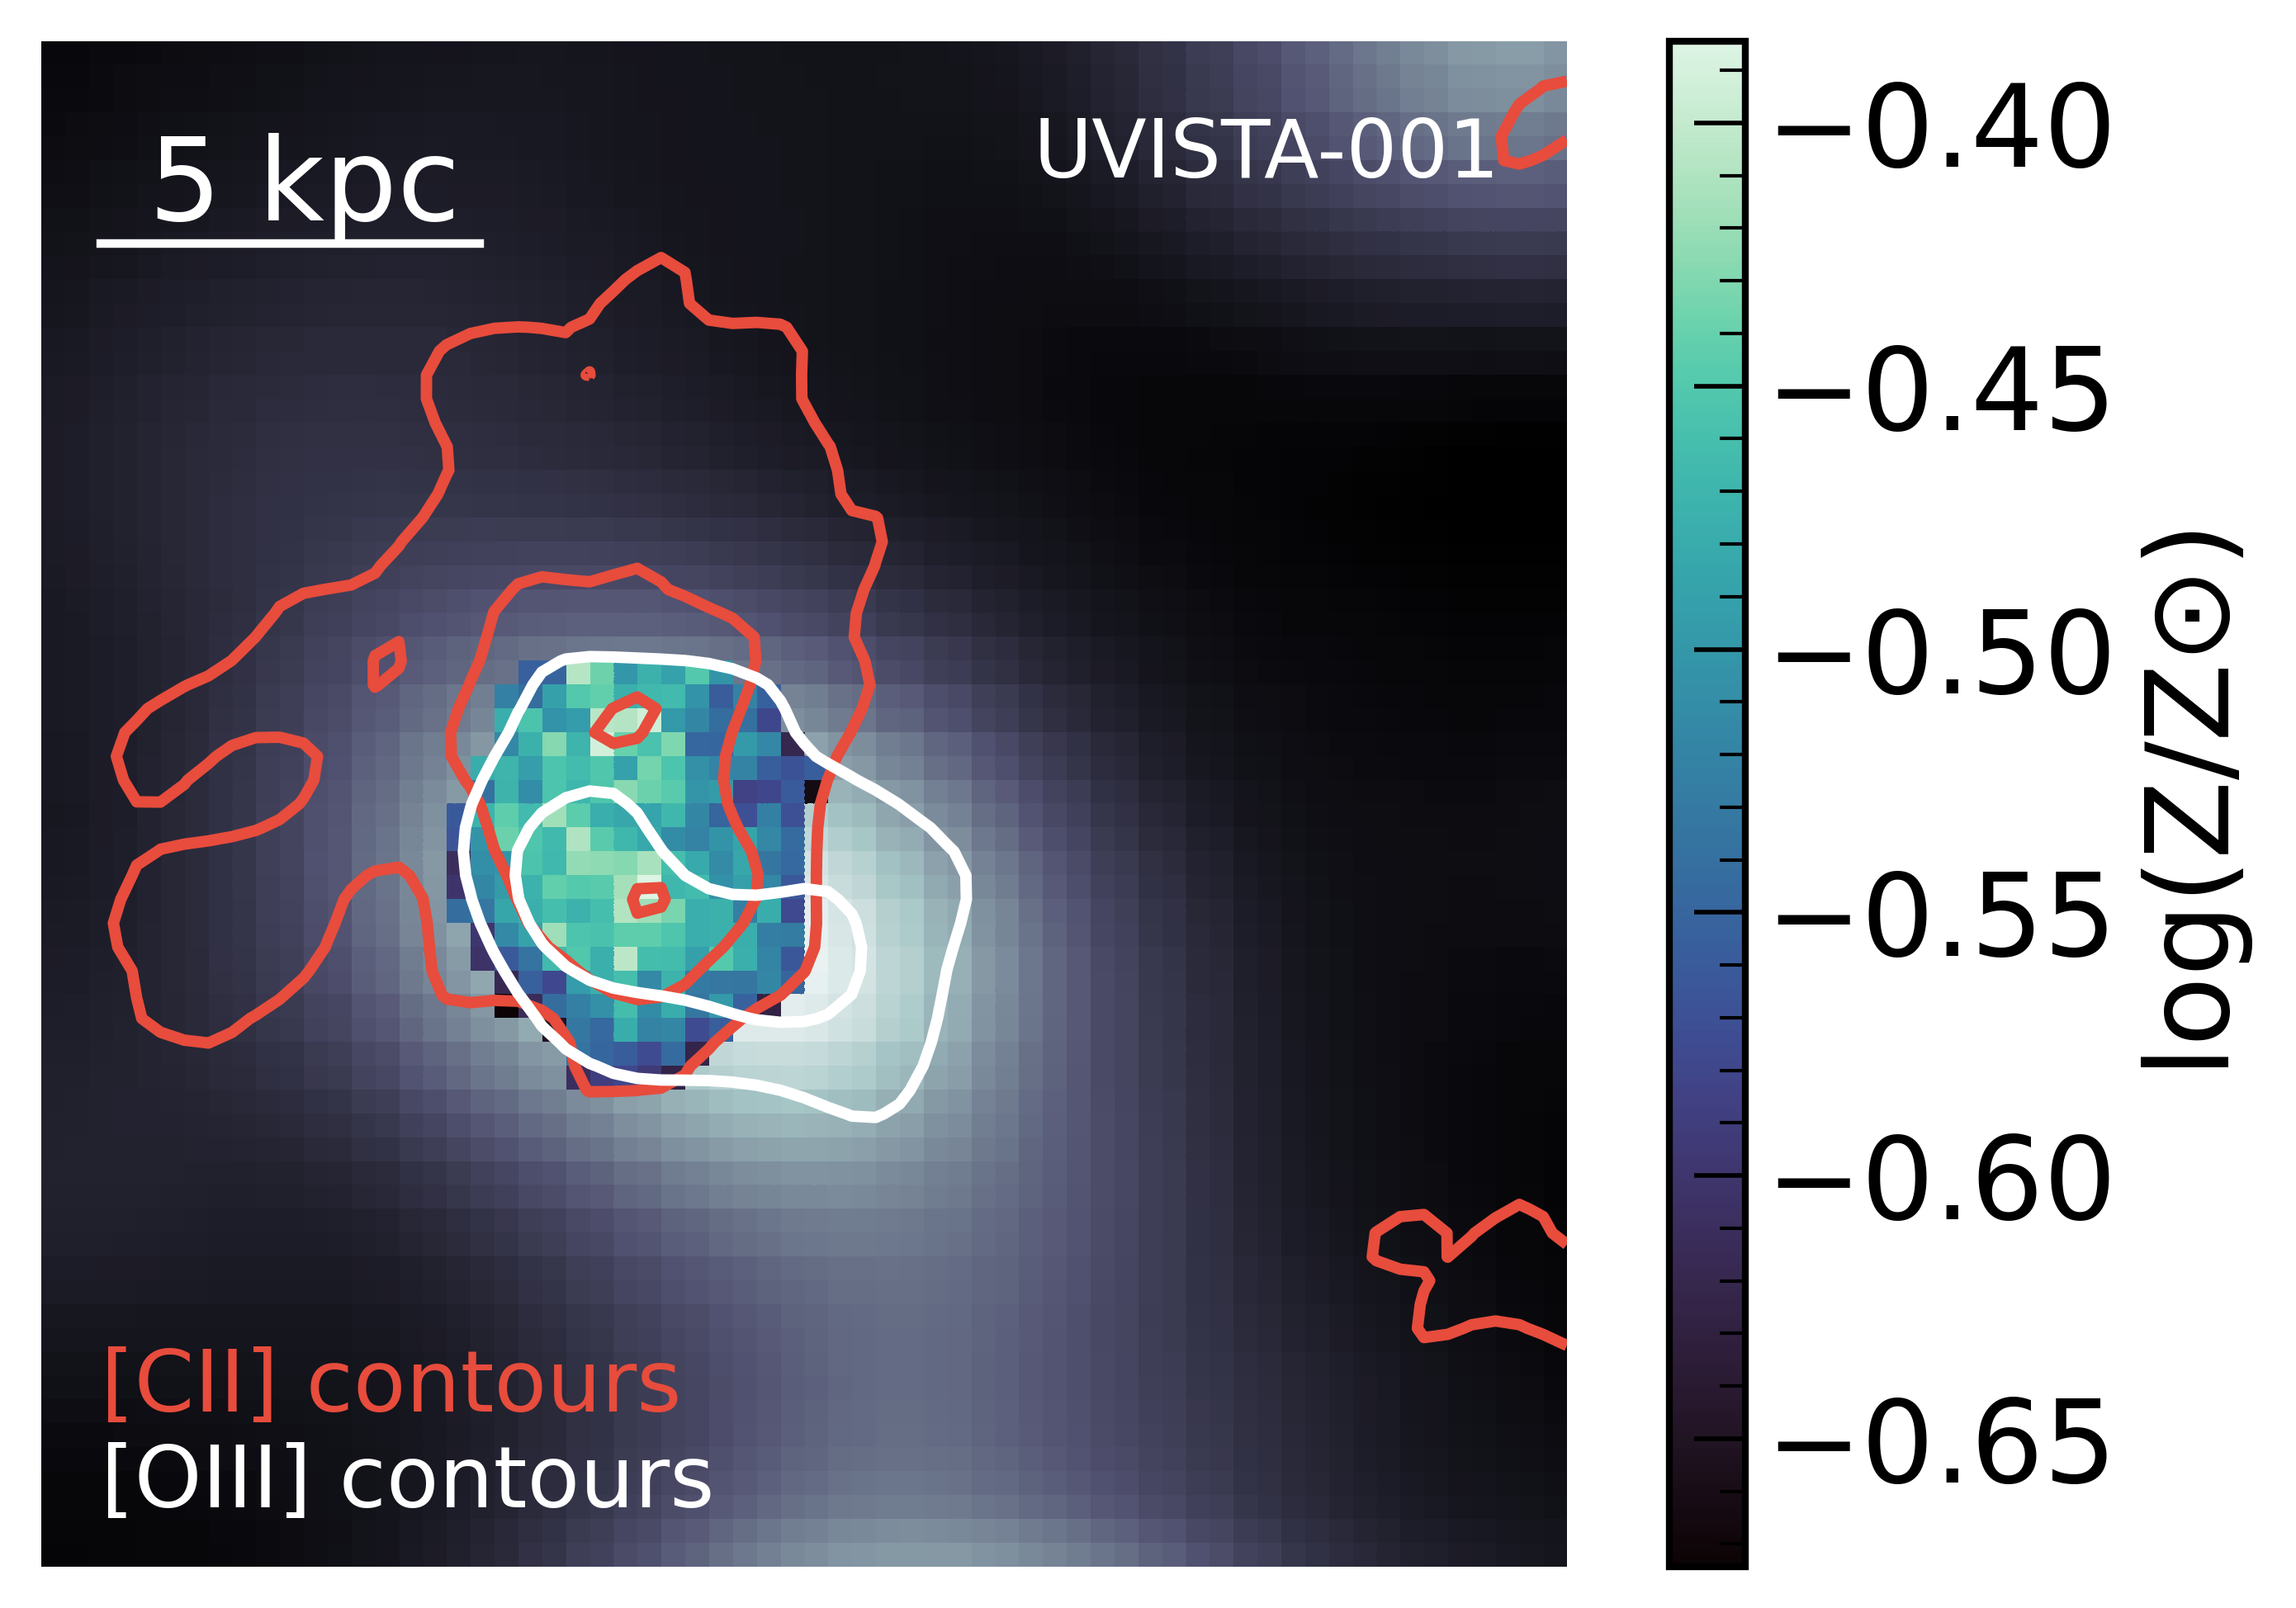
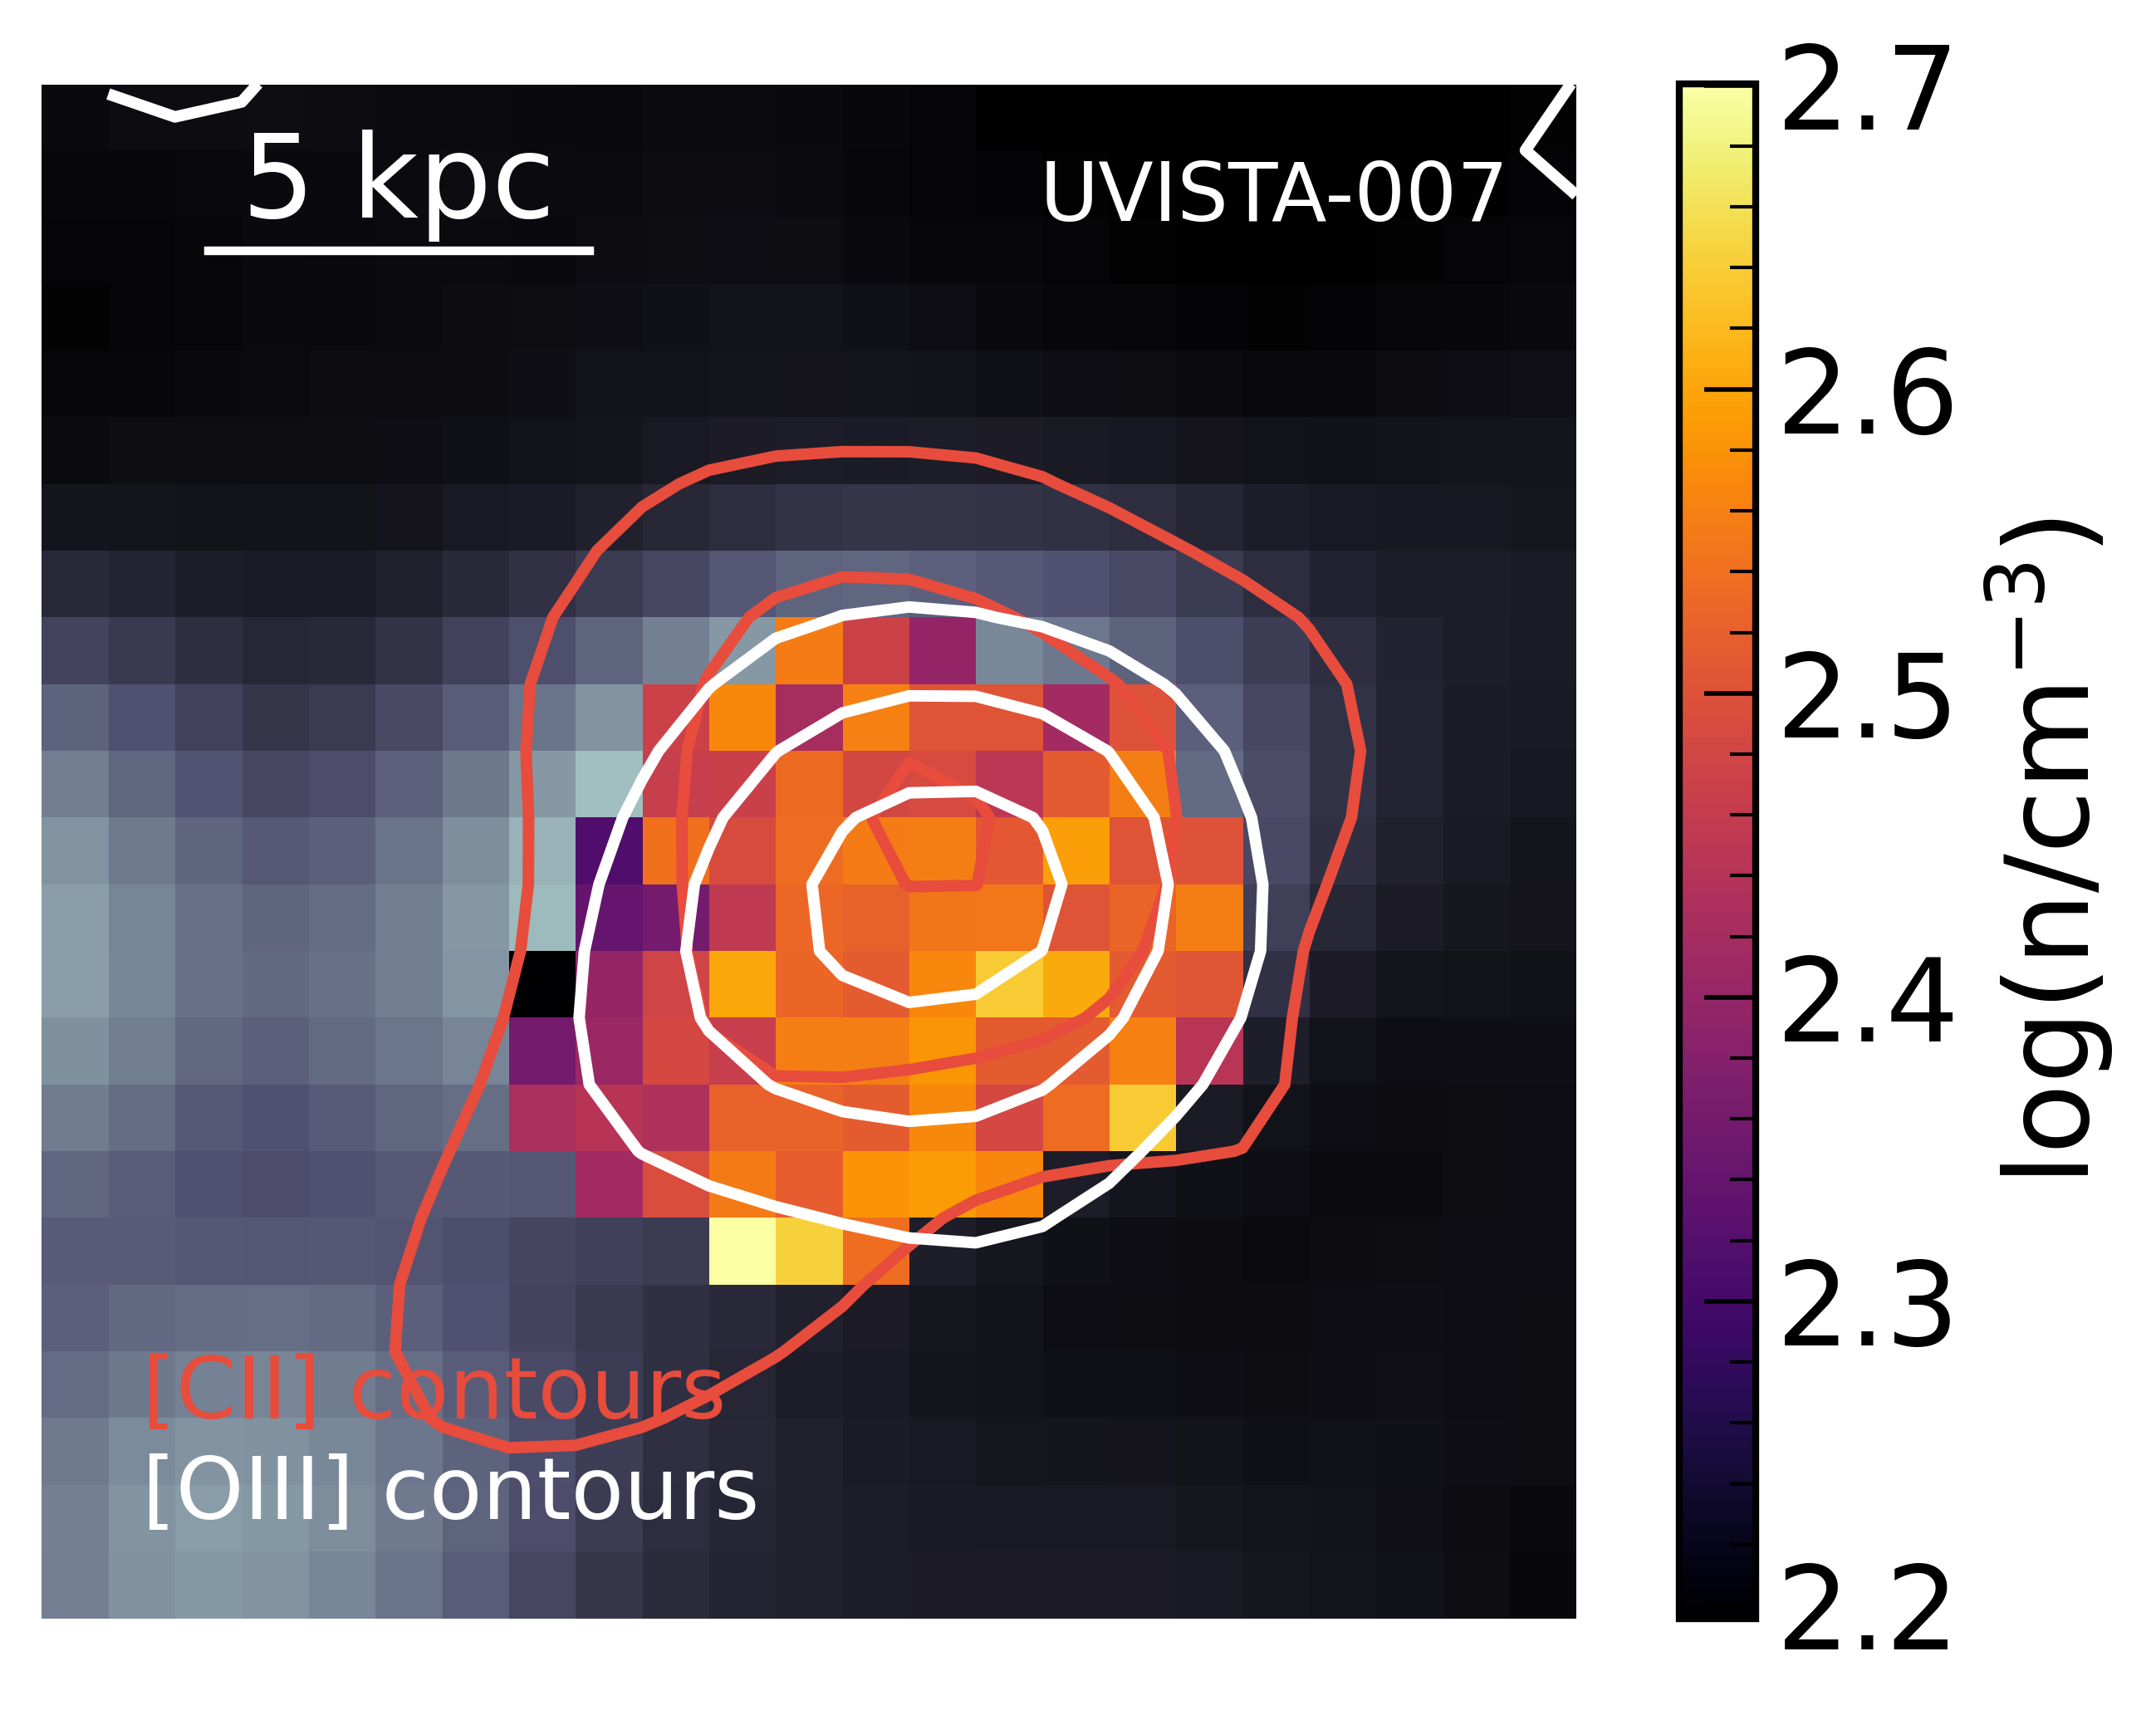
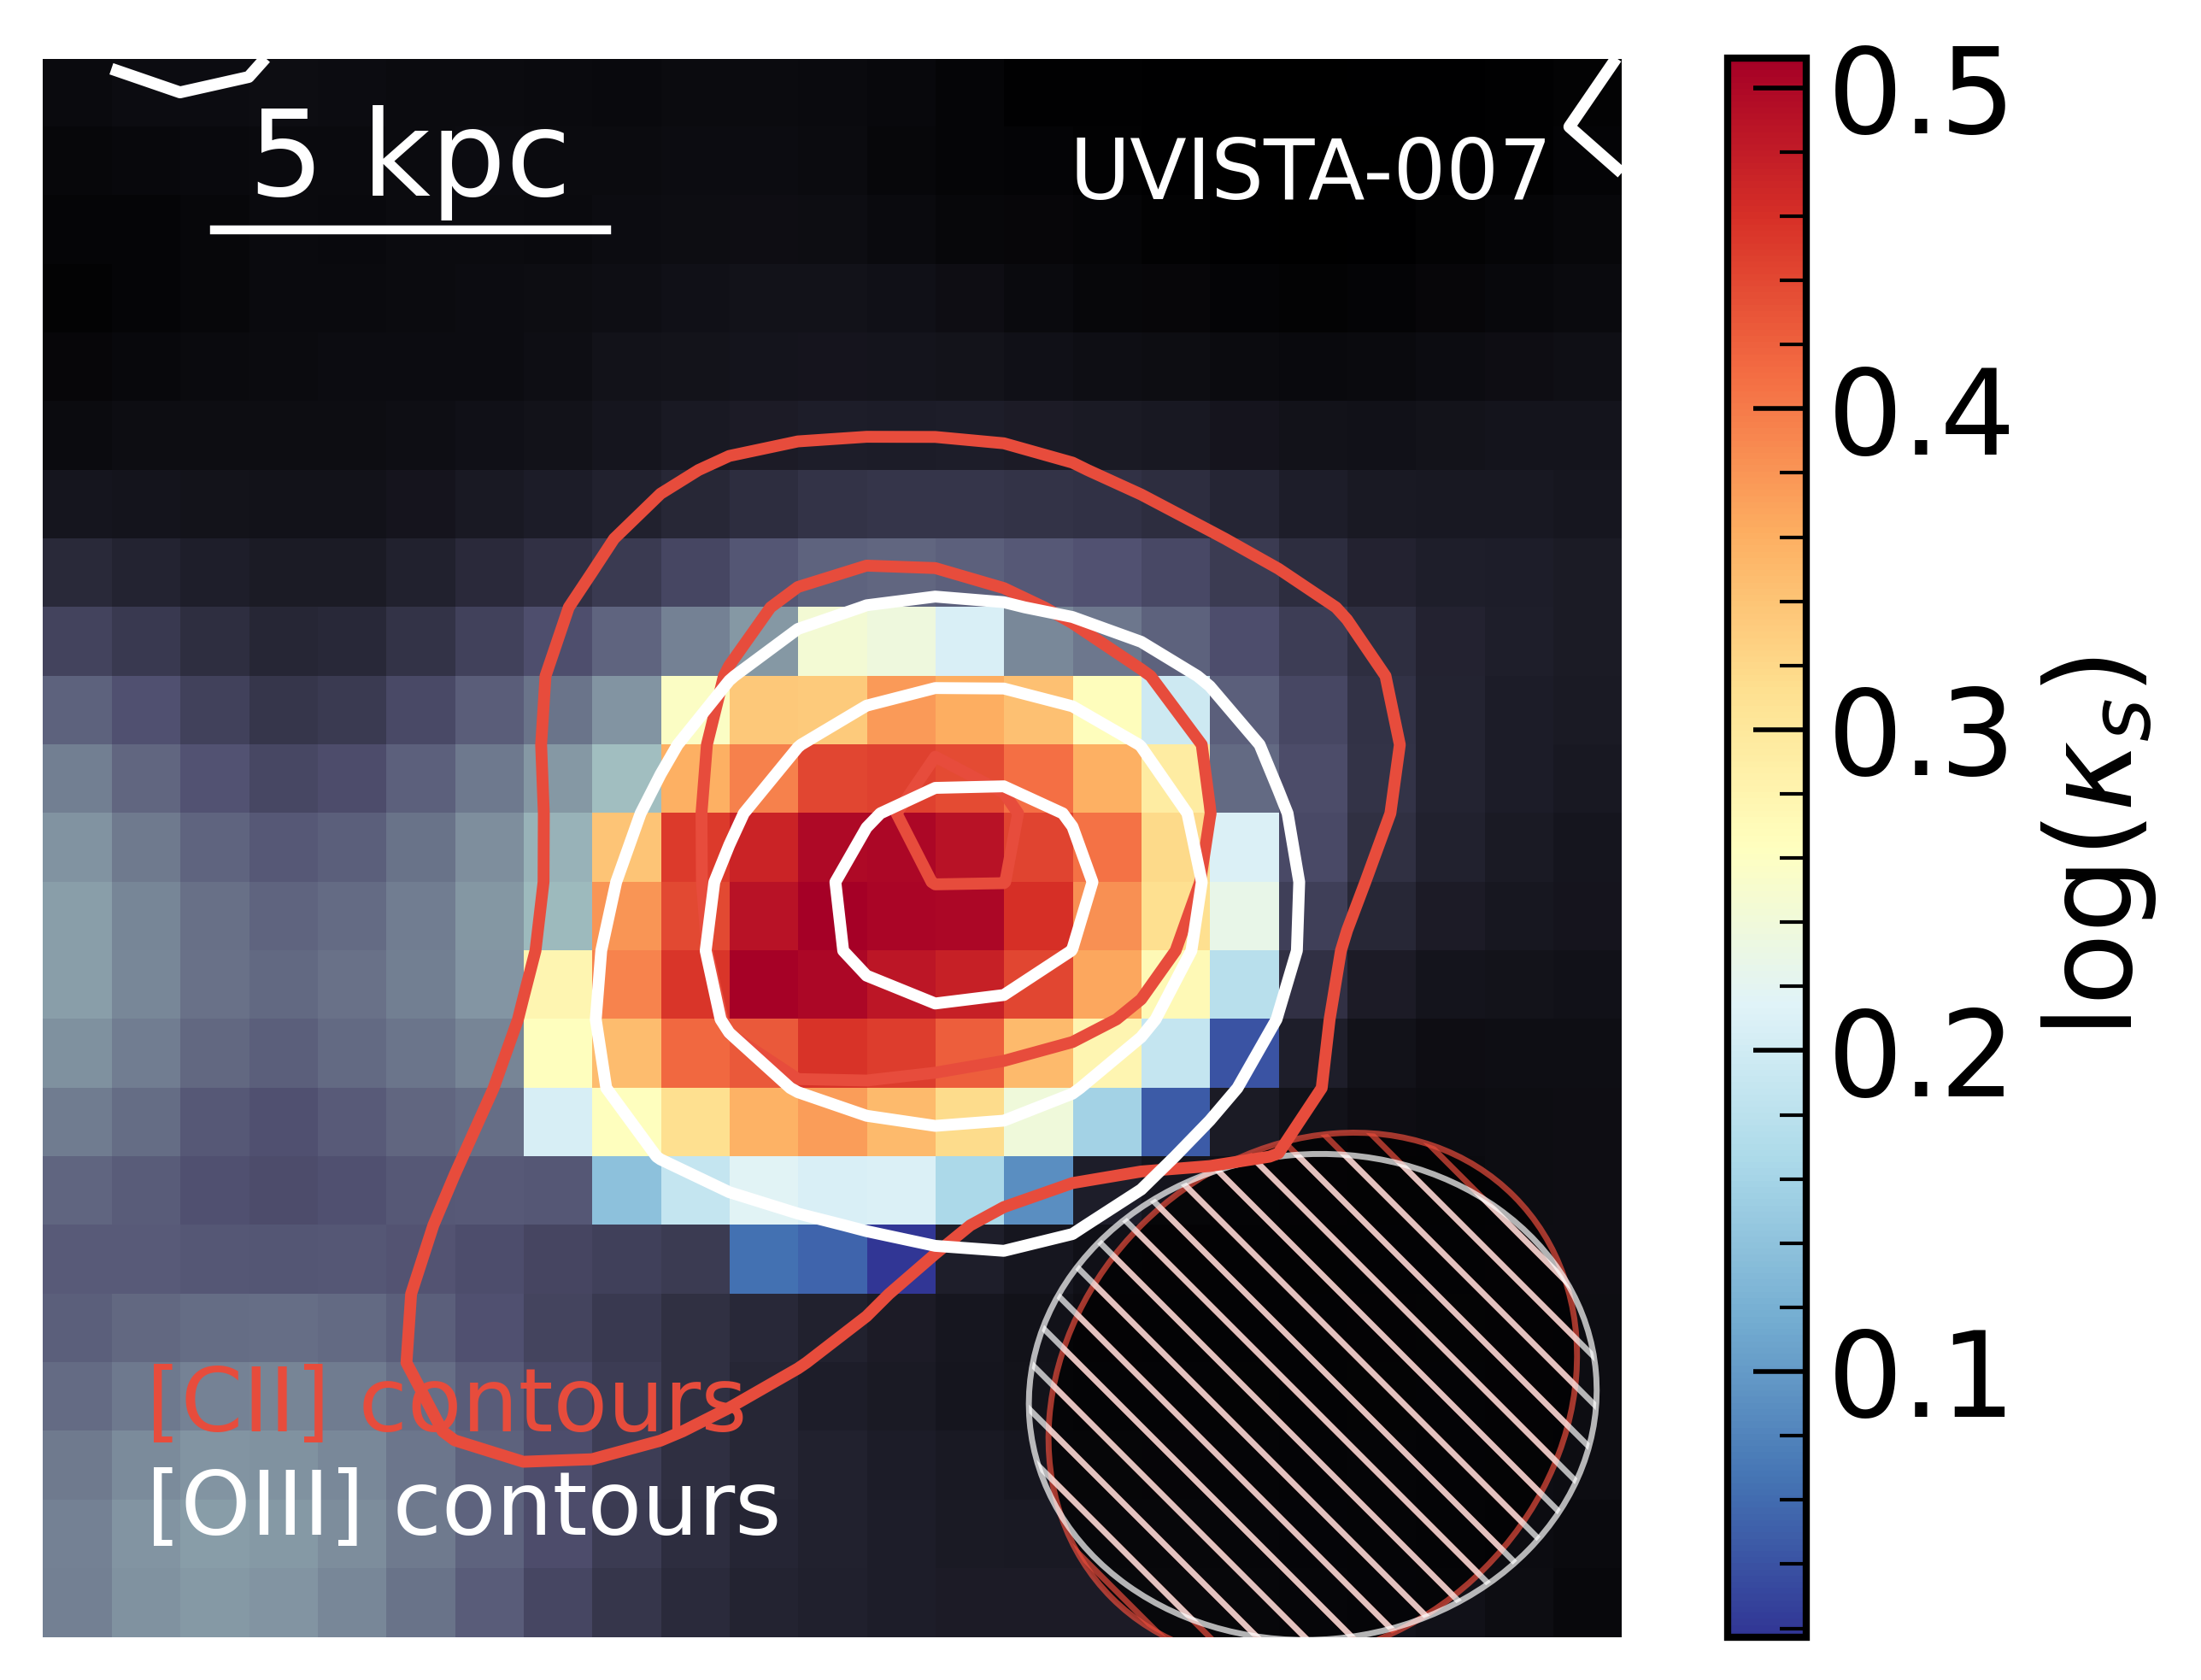
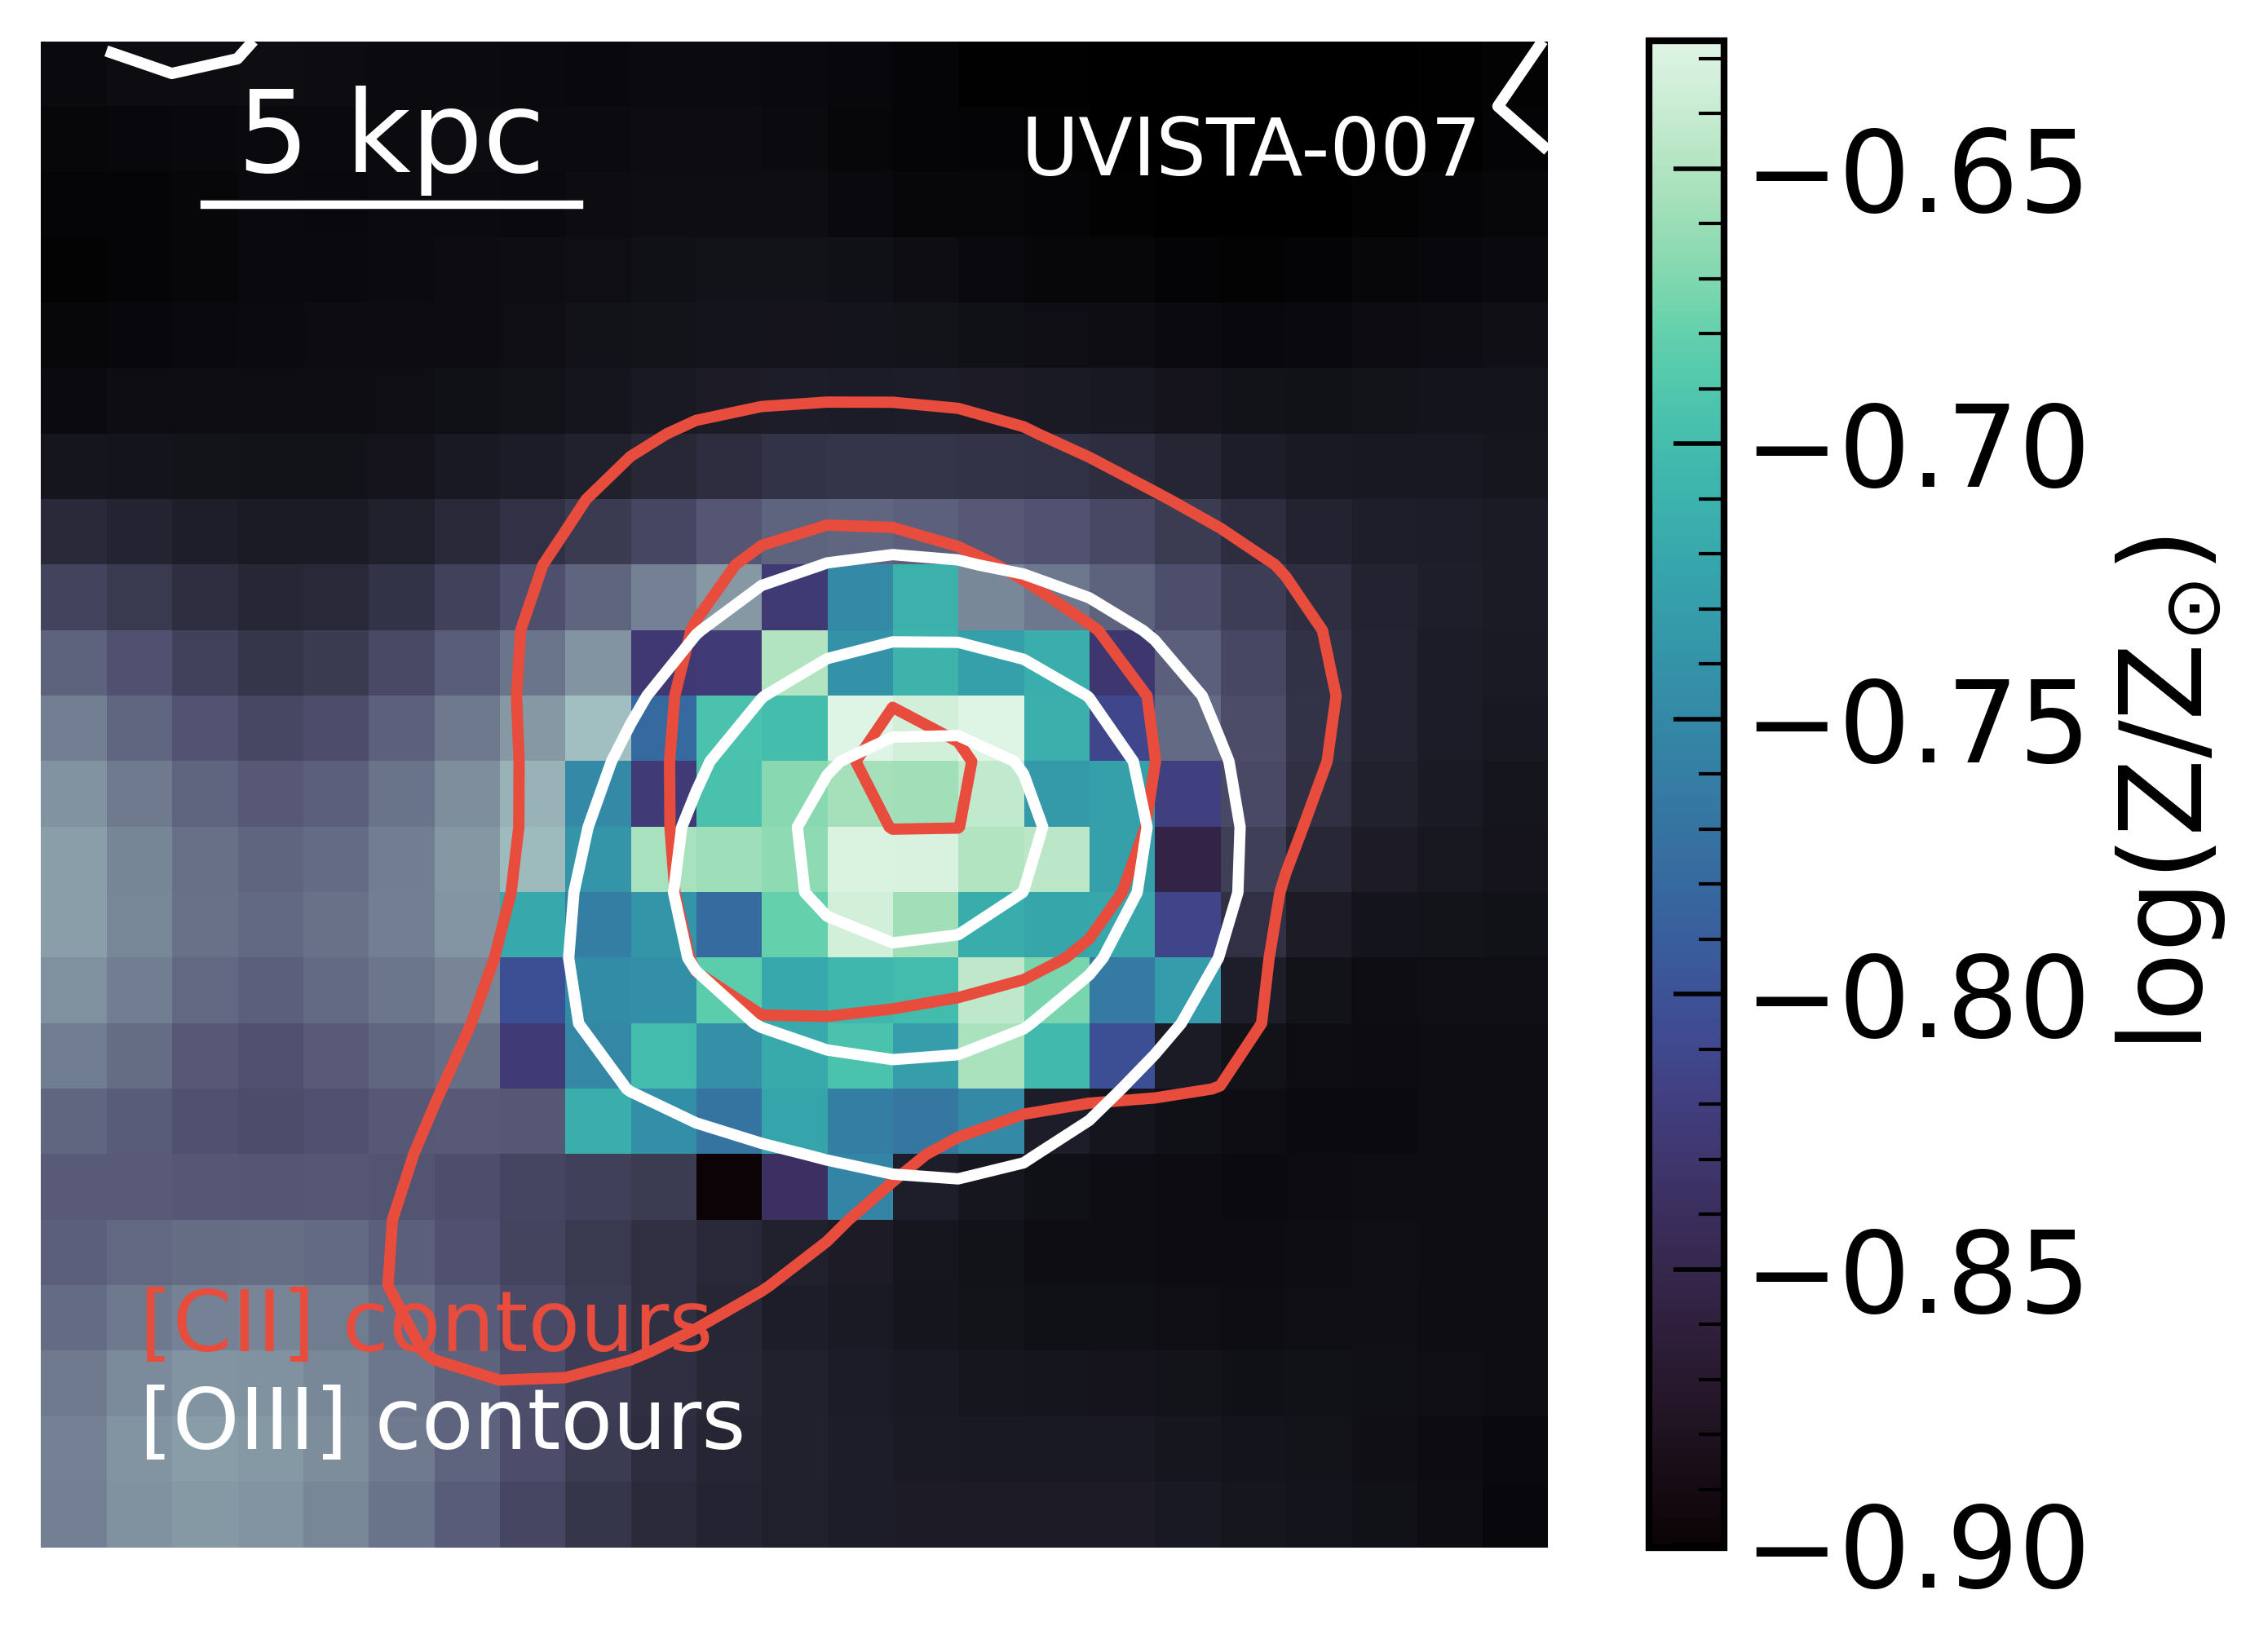
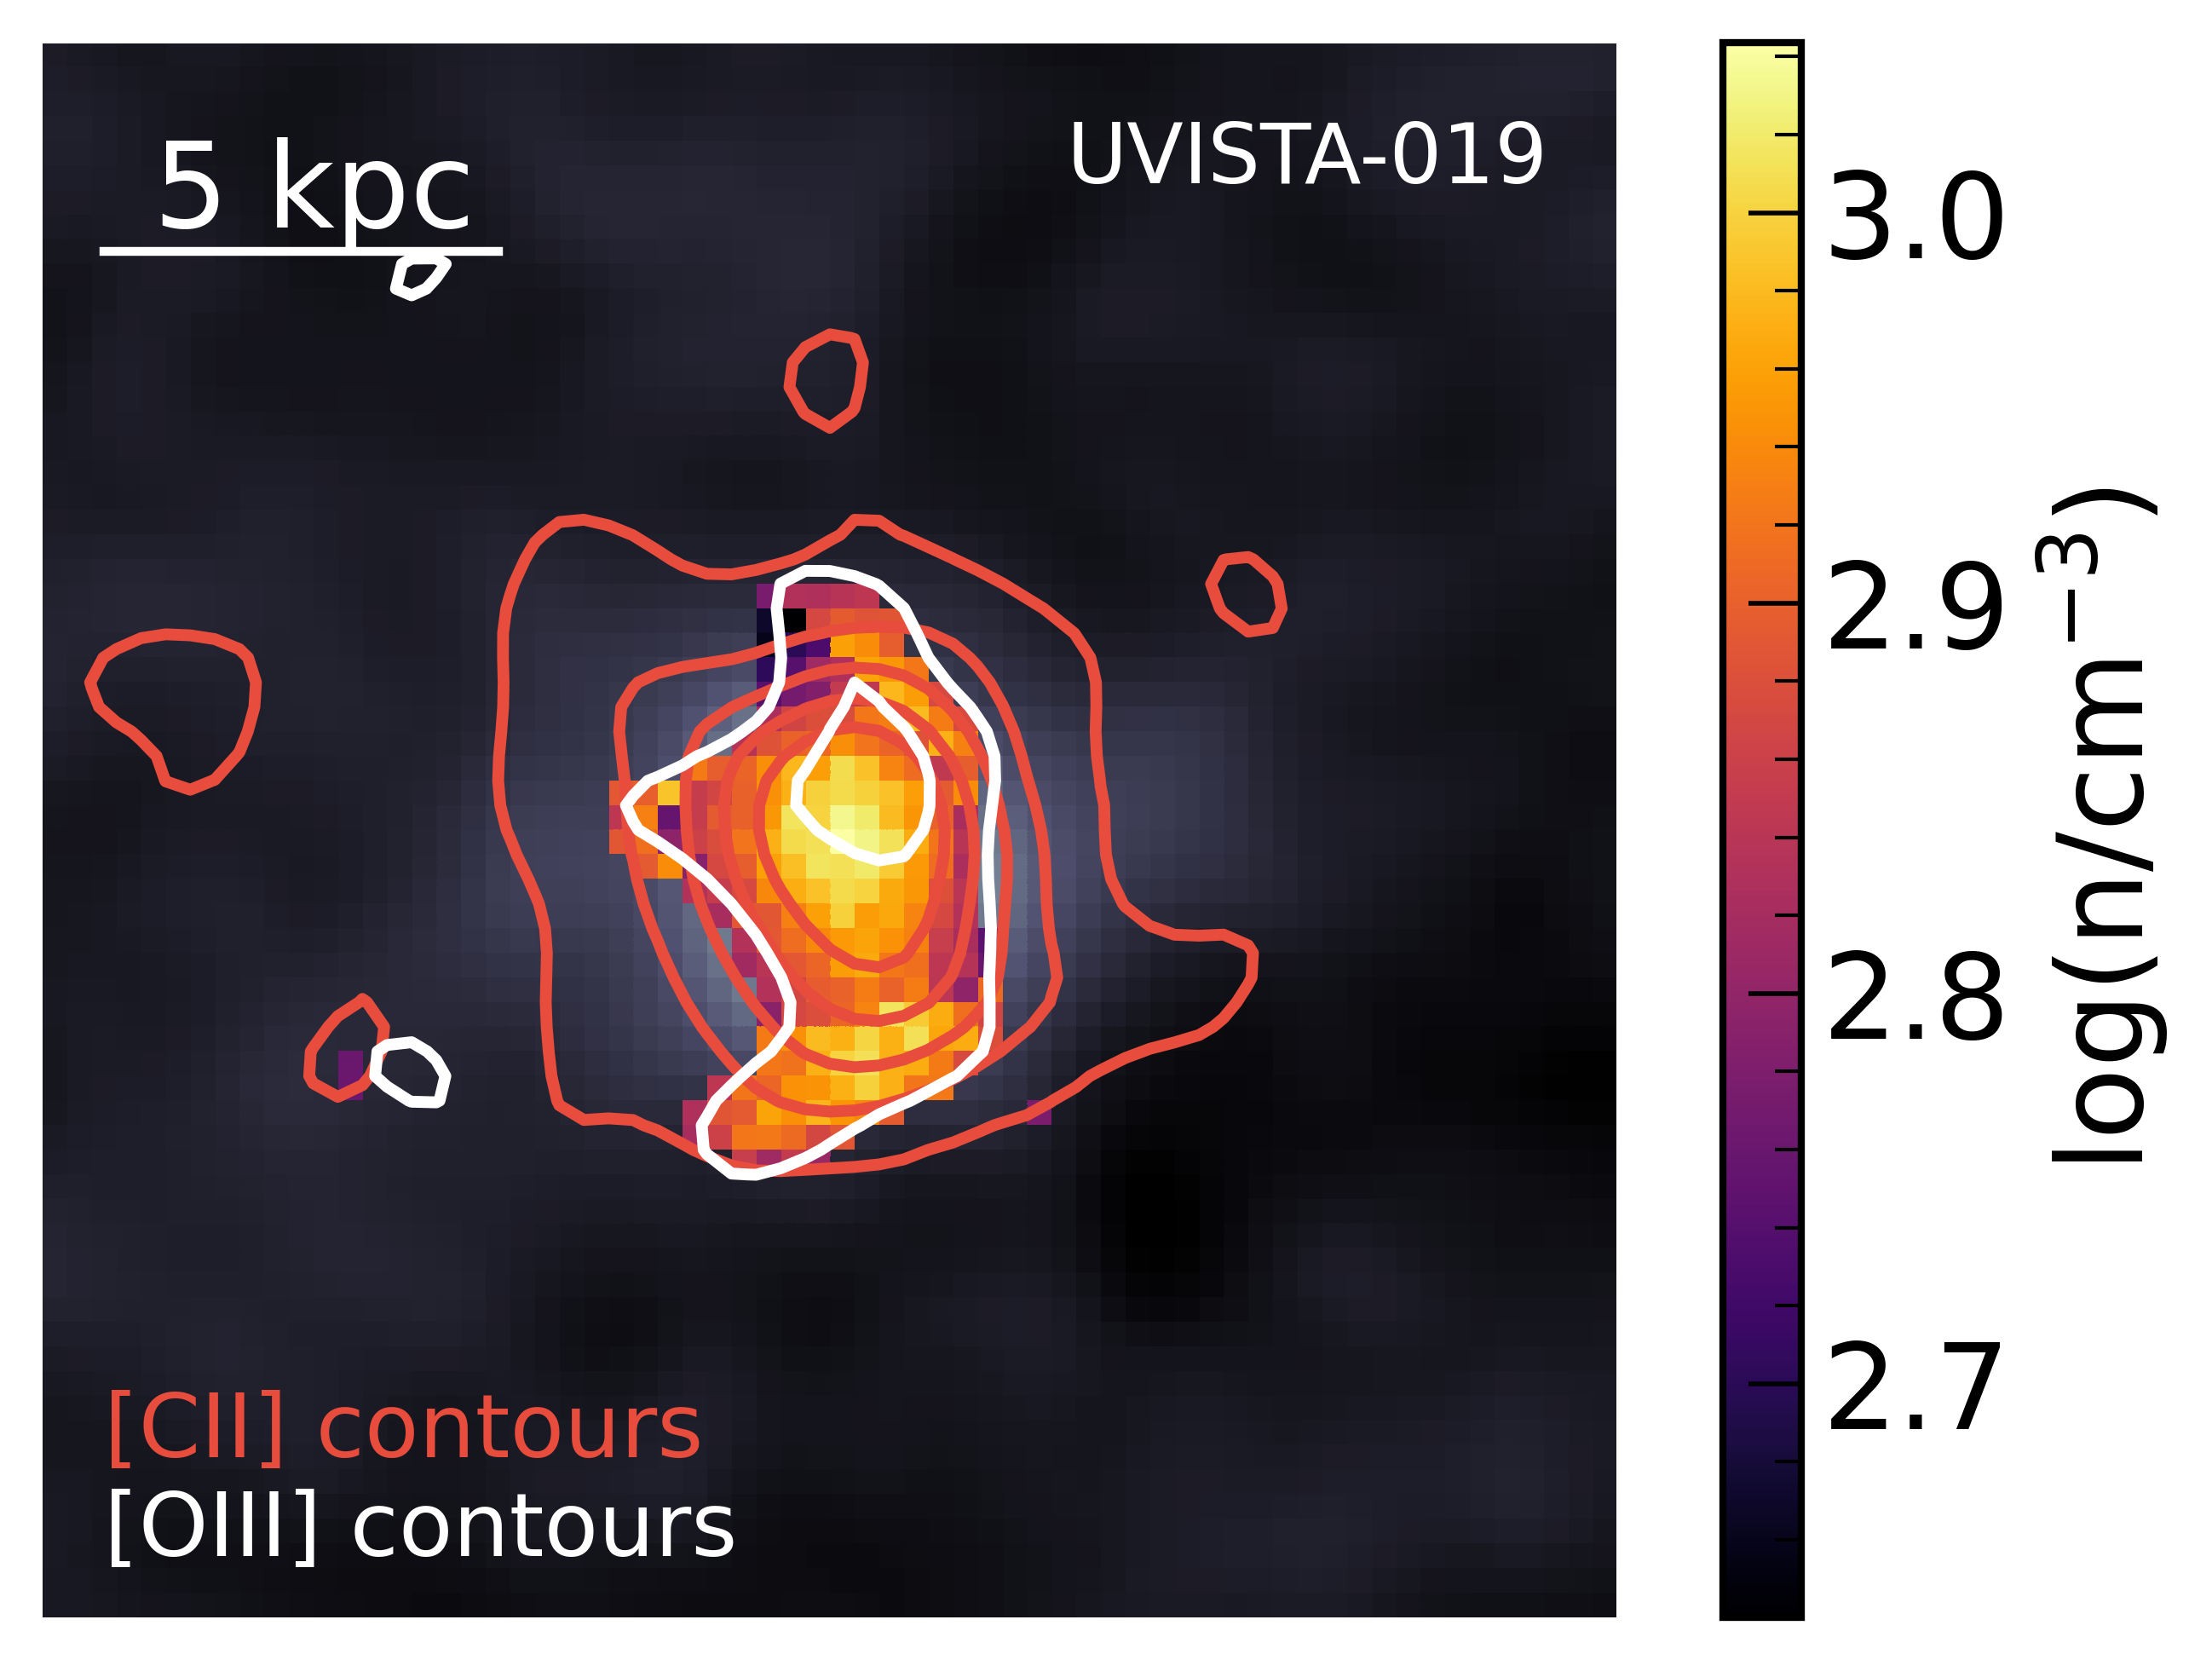
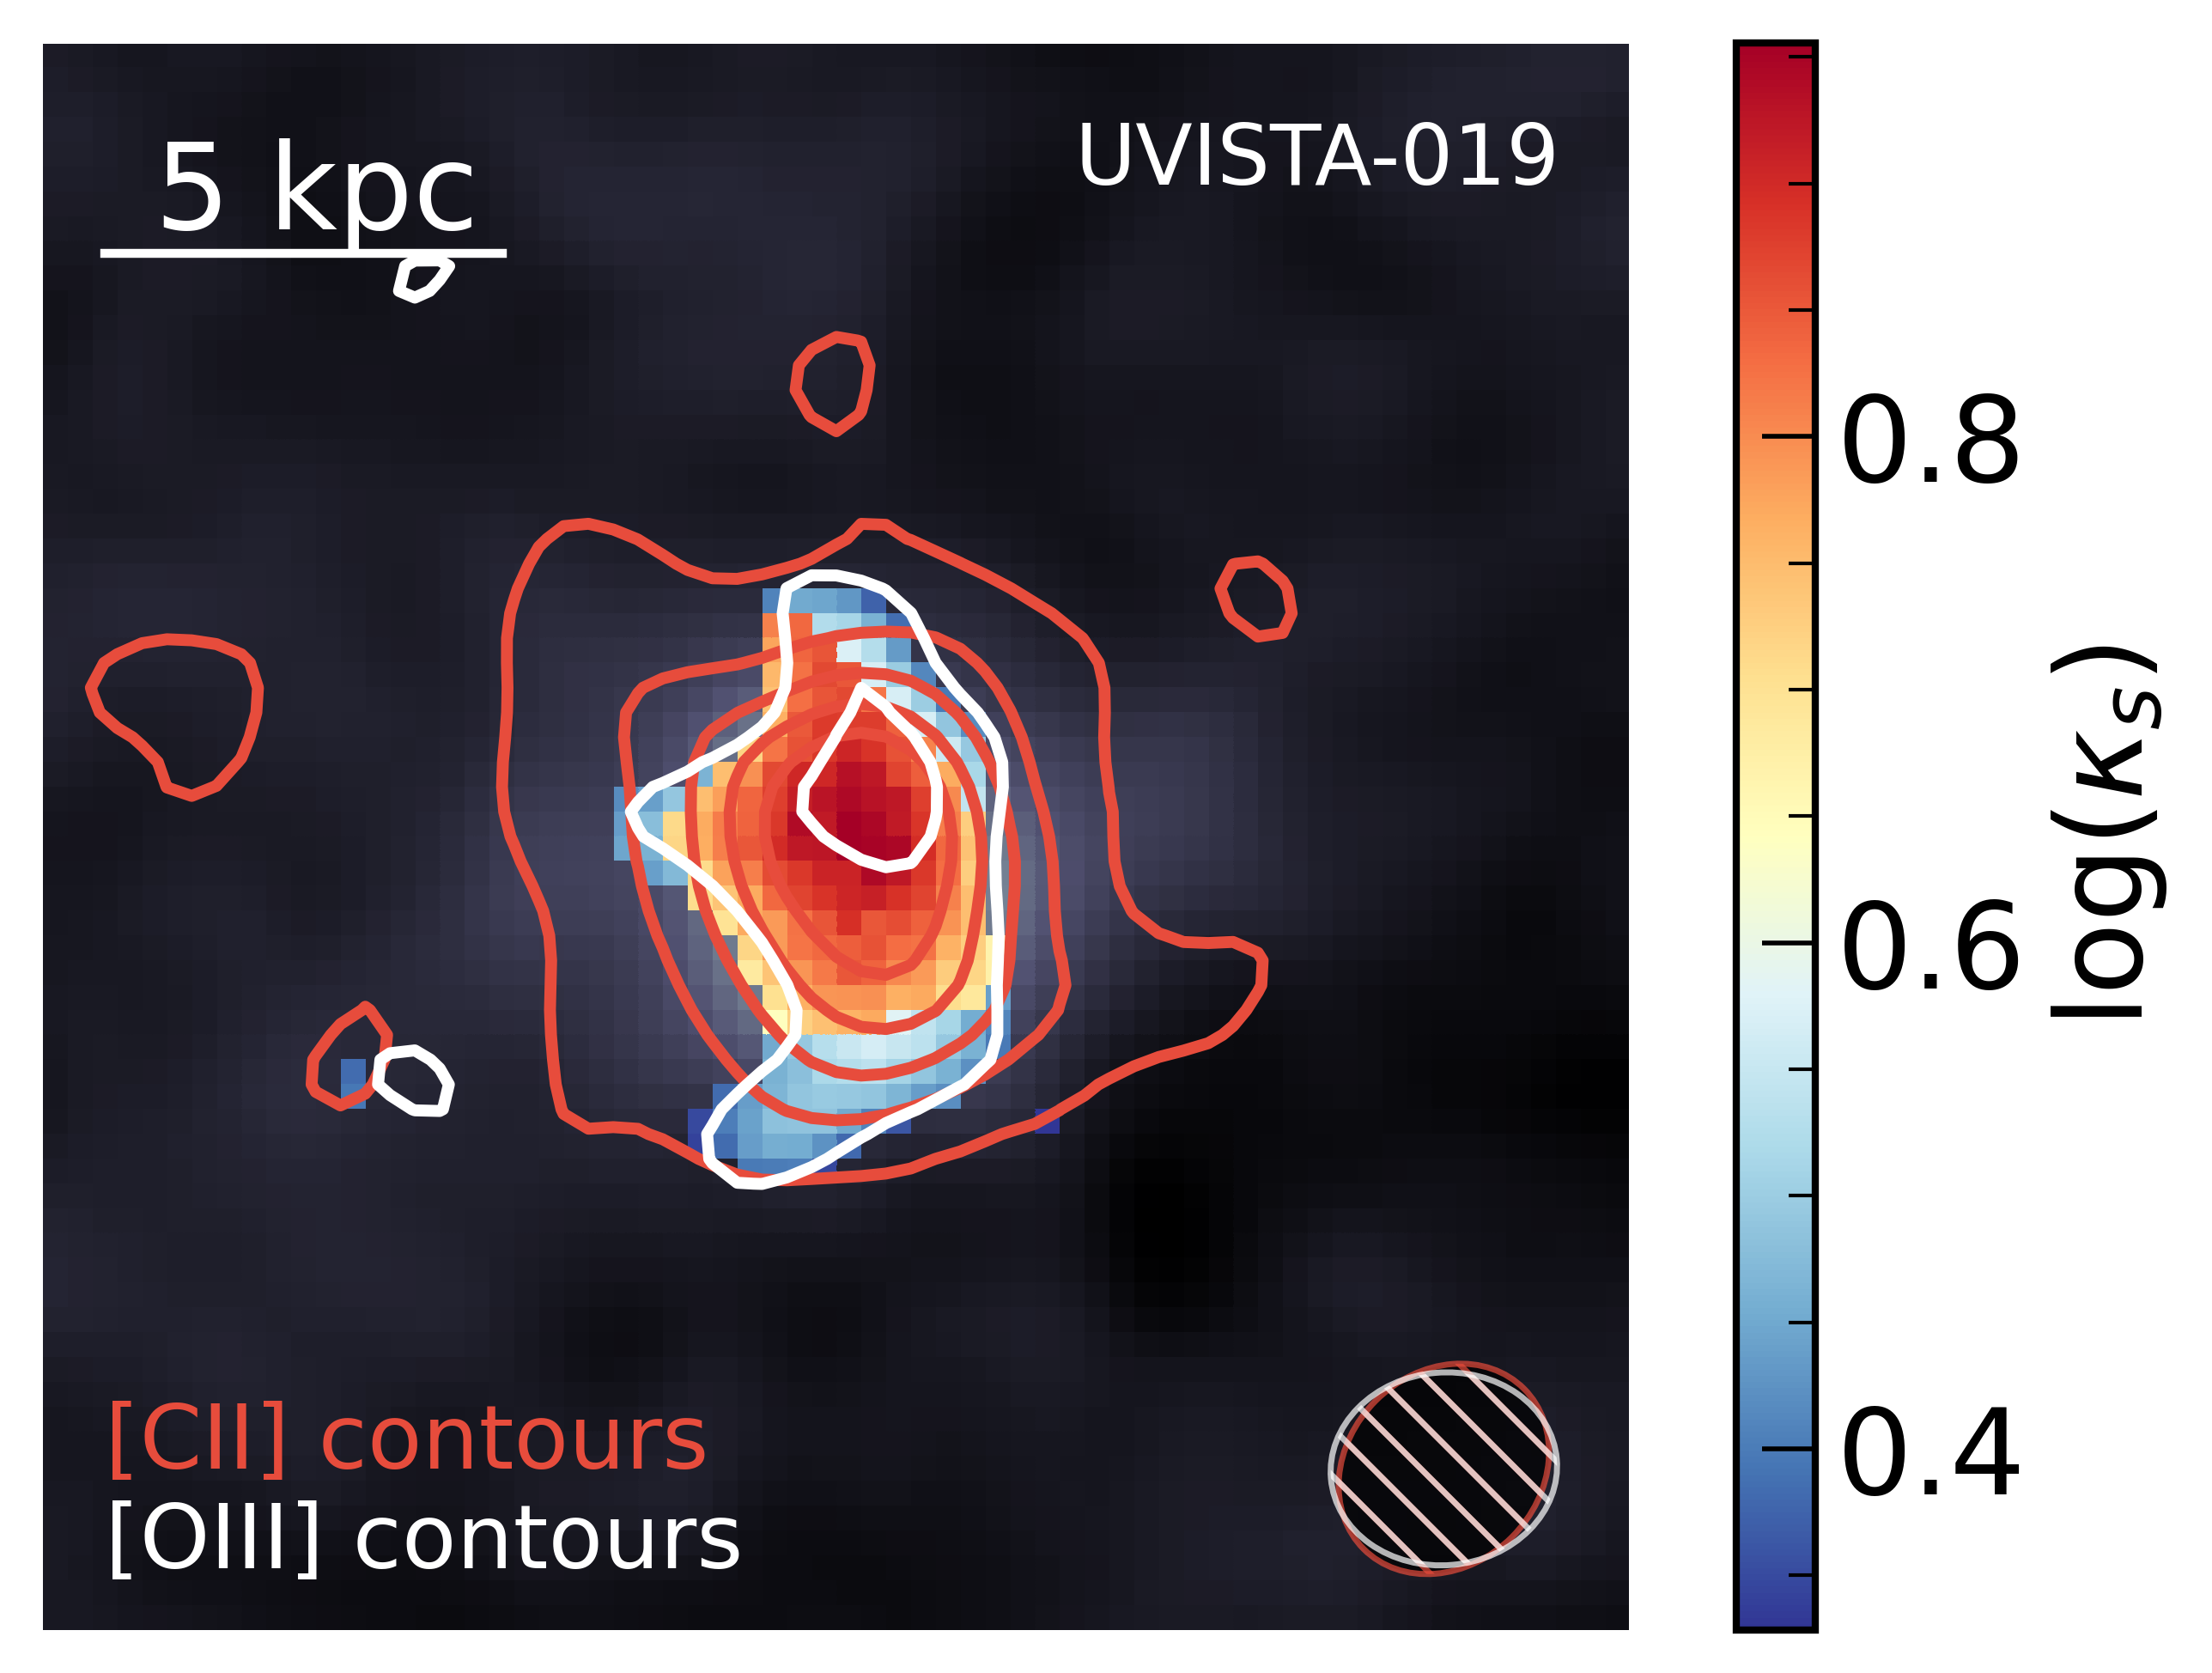
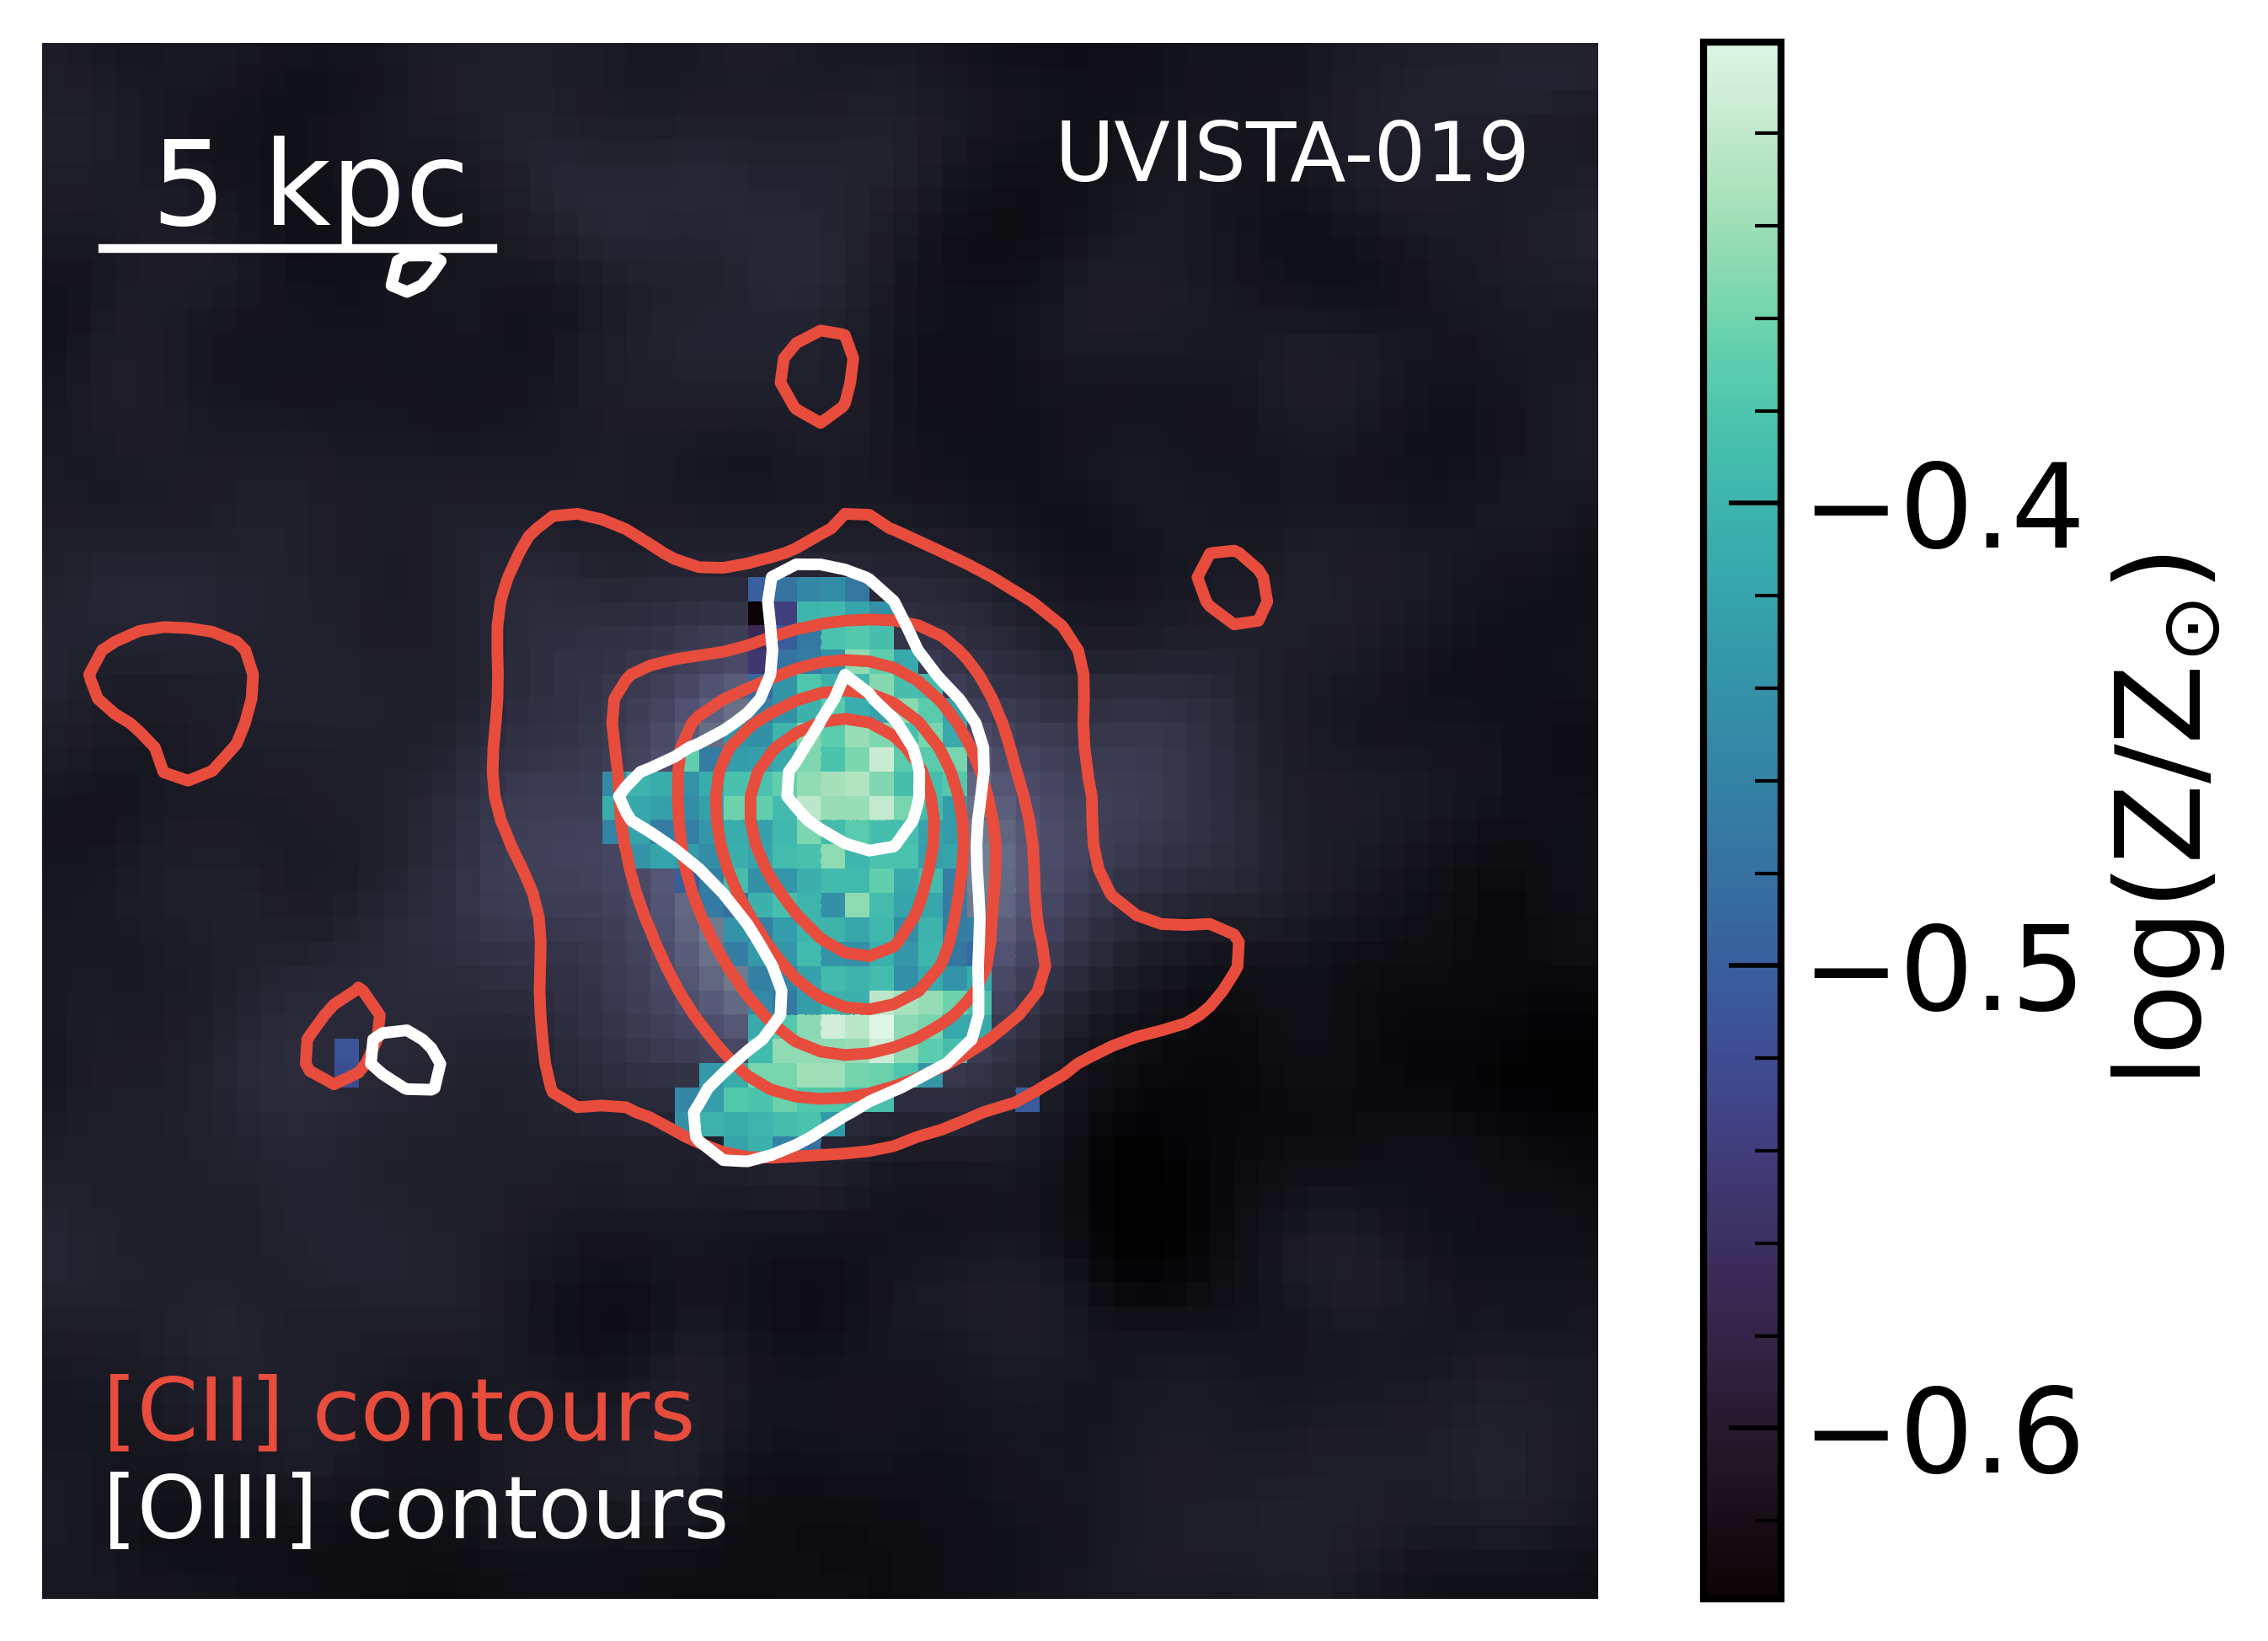
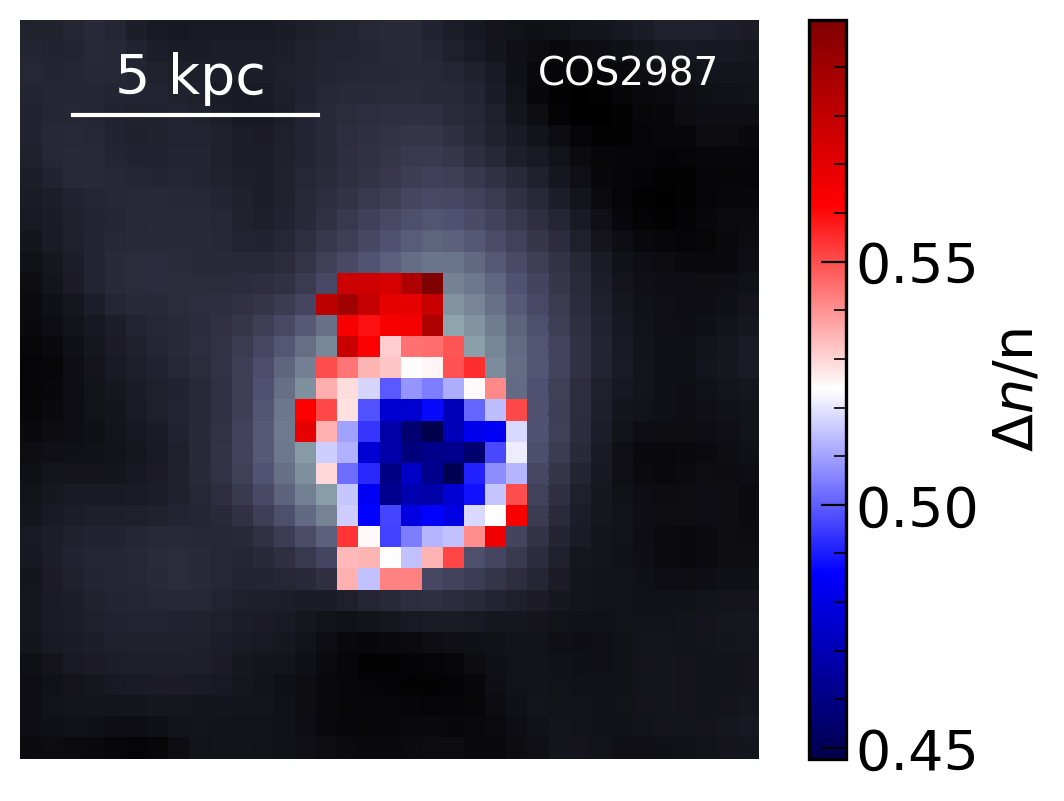
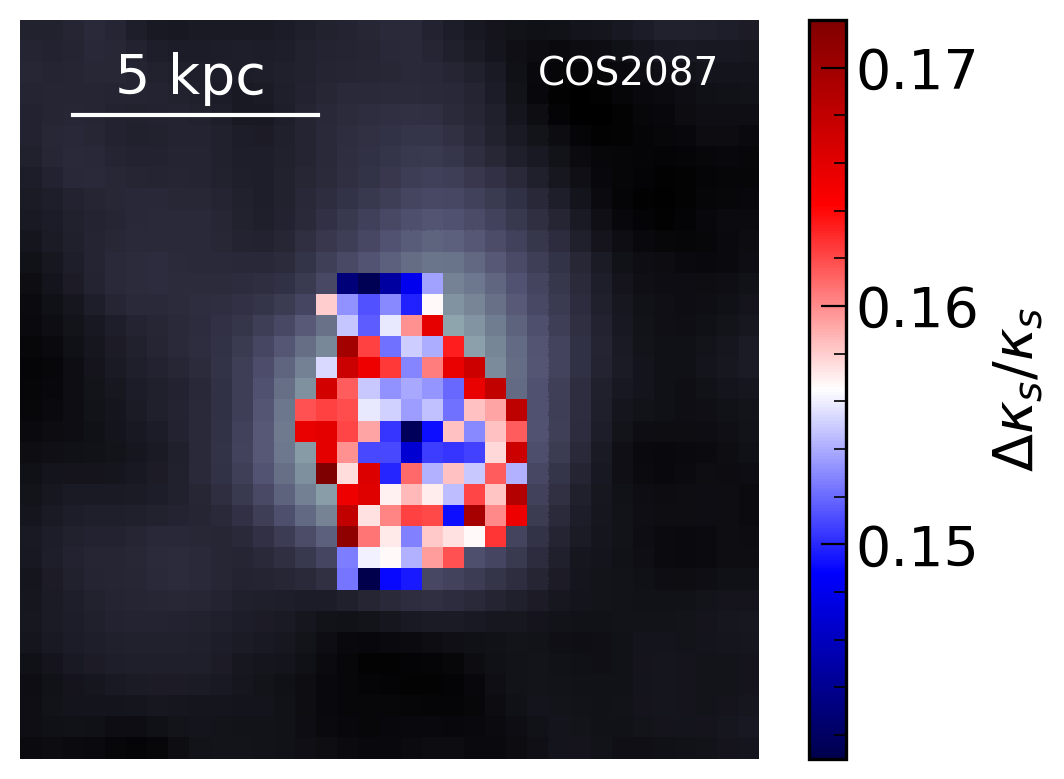
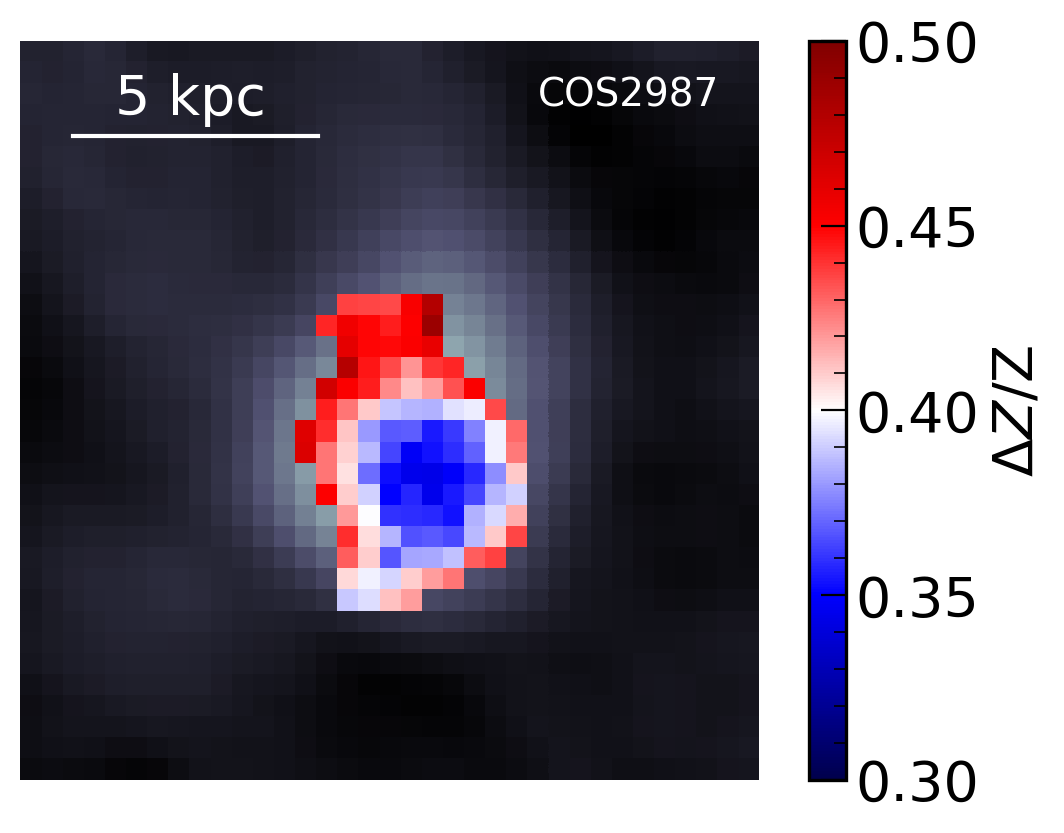
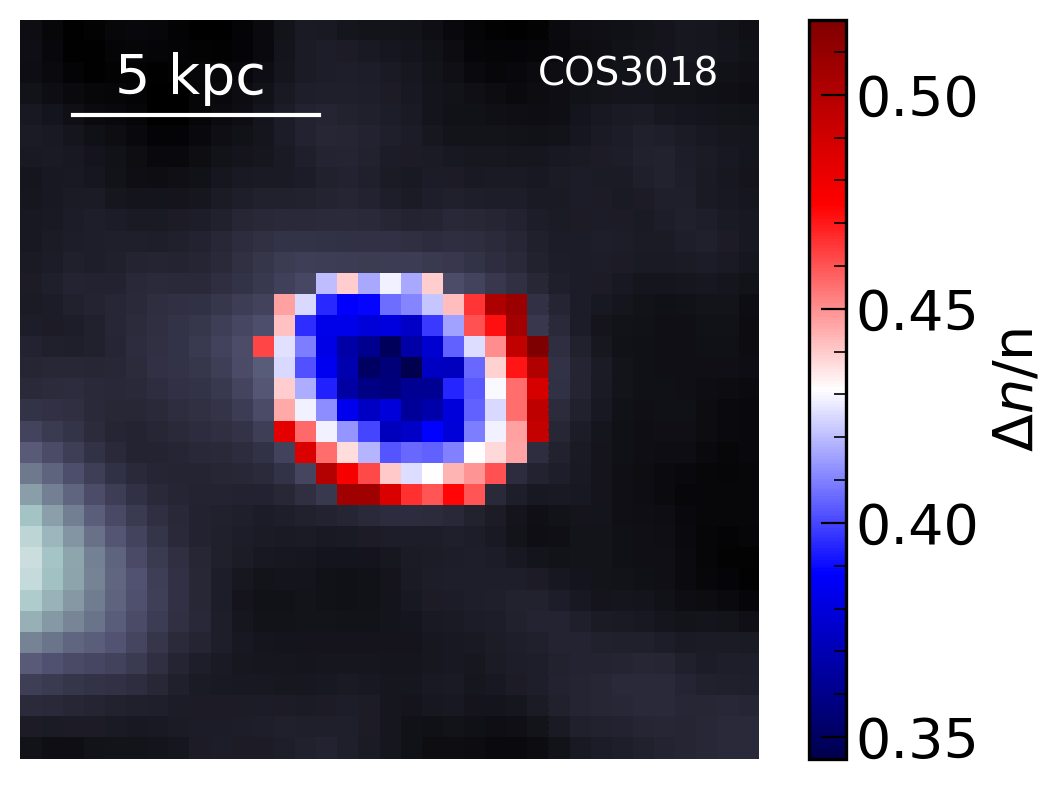
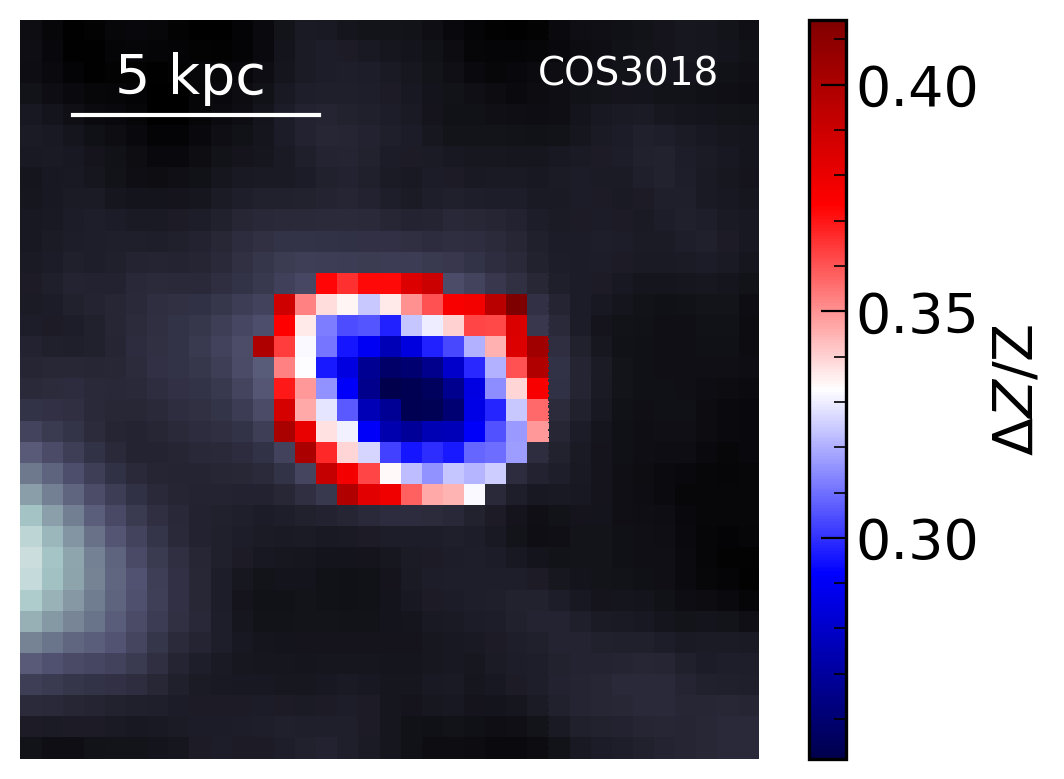
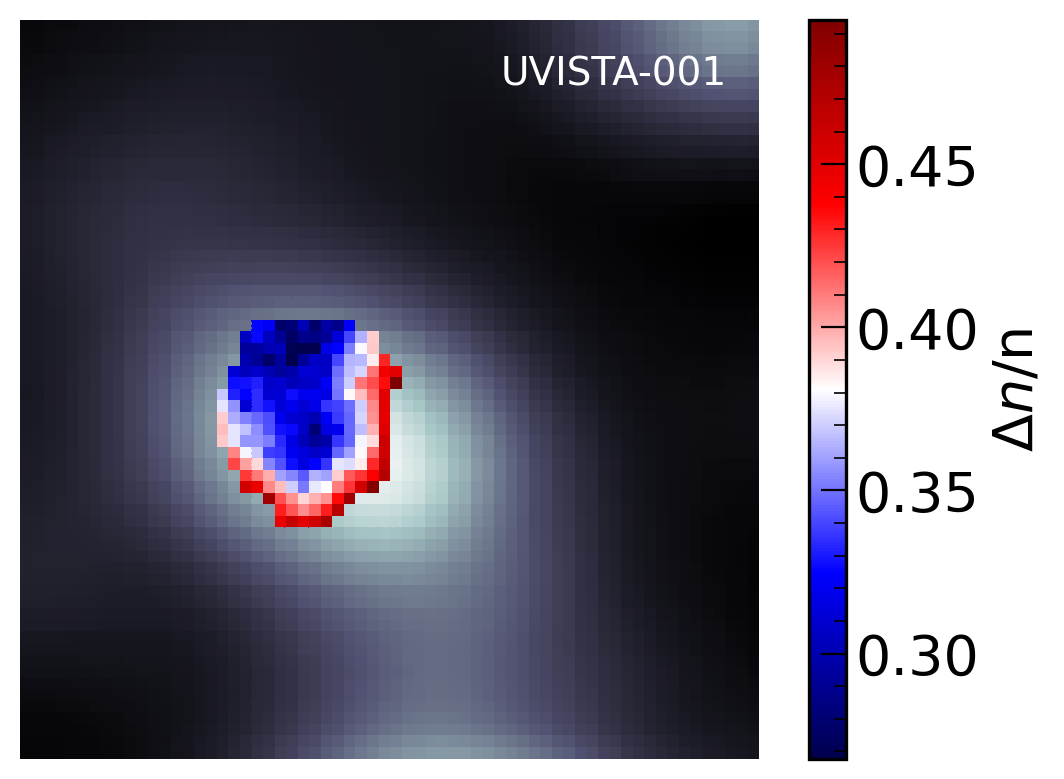
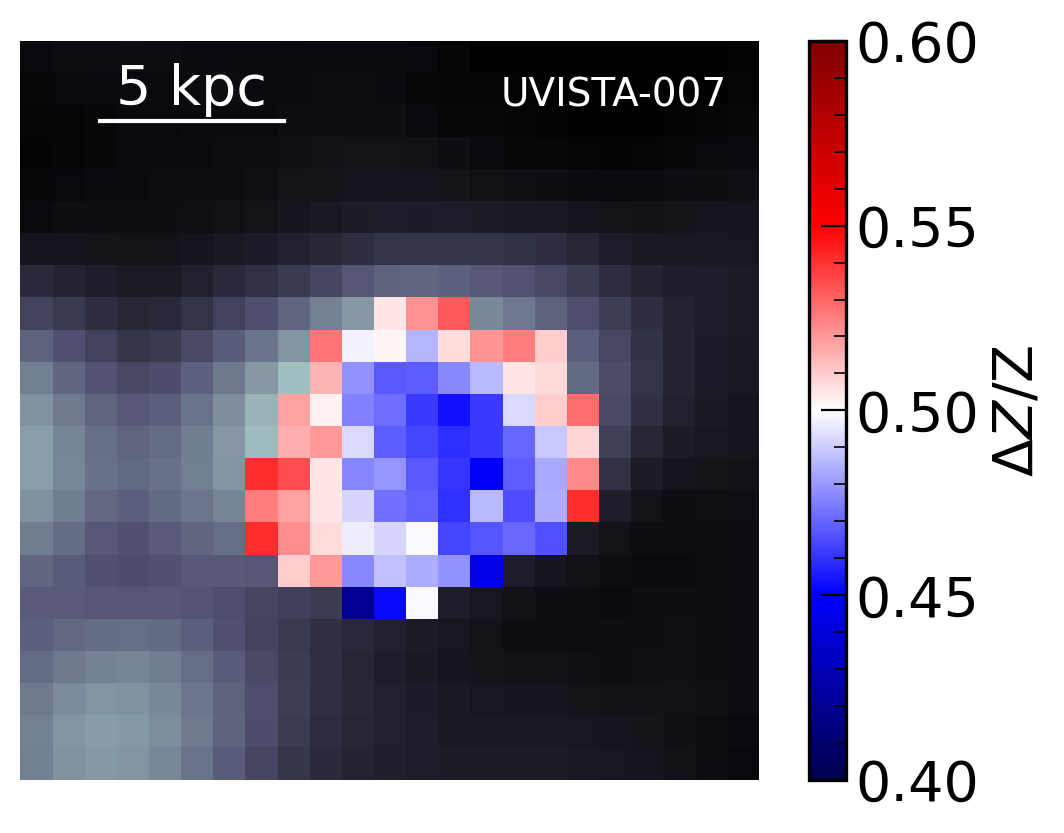
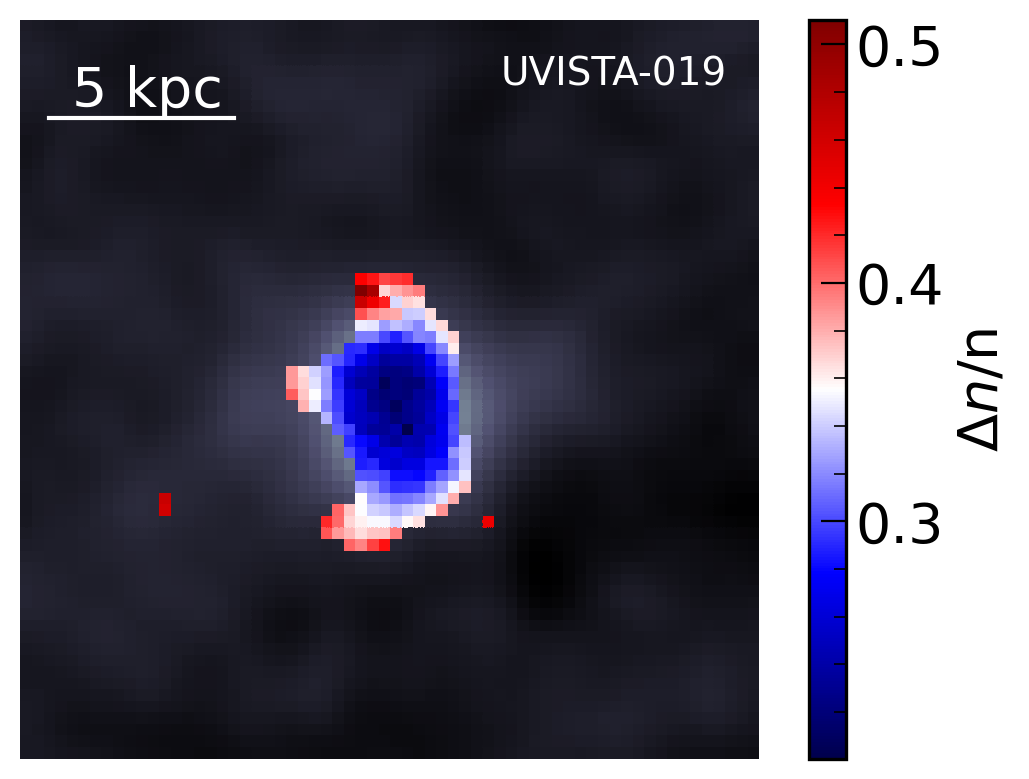
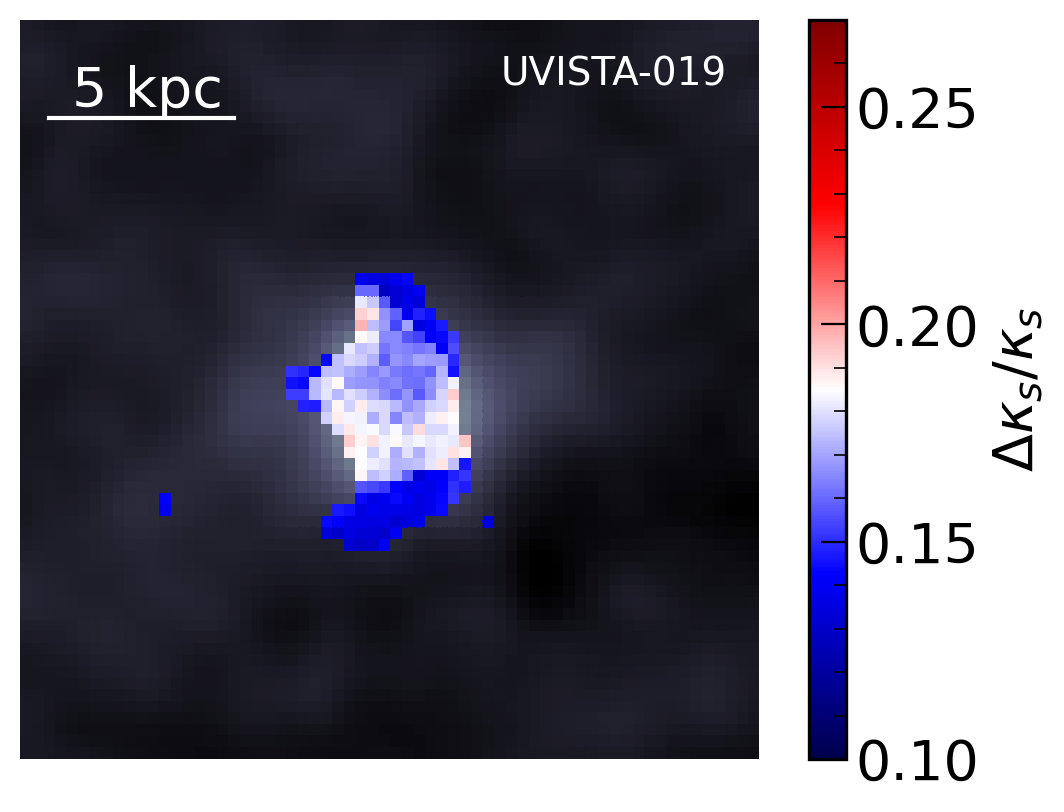
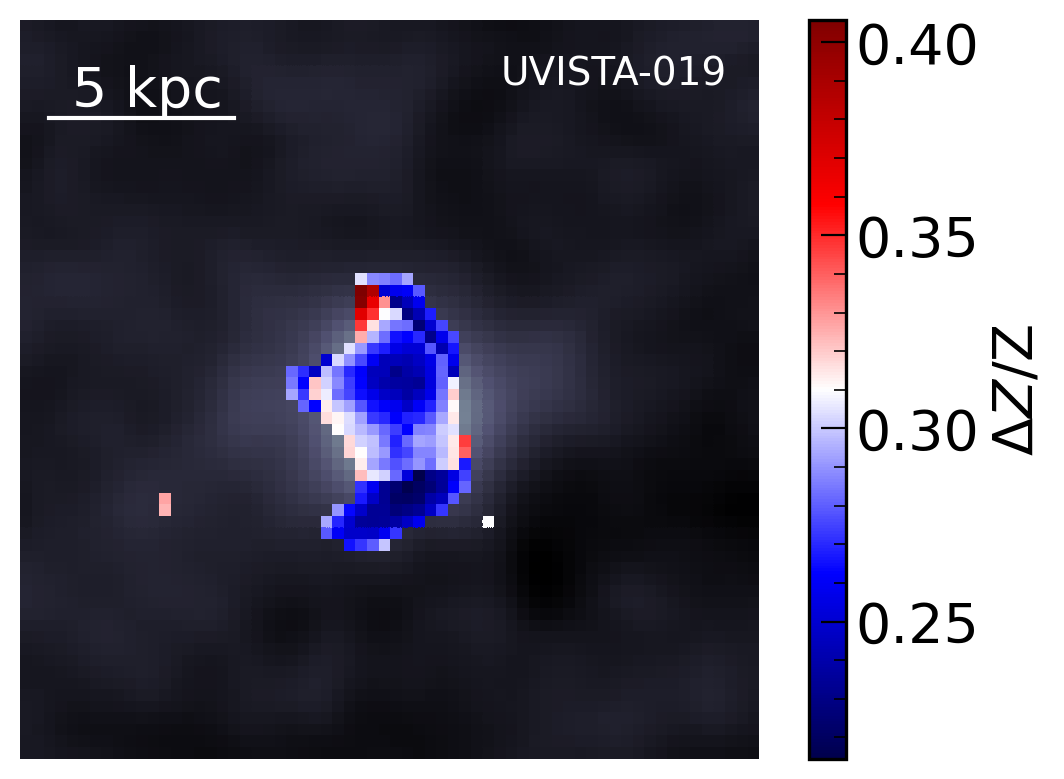
In Figure 1, we present the , and maps, for the five galaxies in the Witstok et al. (2022) sample, produced with GLAM by simultaneously fitting the , , and the in each pixel. We note that the central regions are characterized by higher gas density, burstiness parameter and metallicity, suggesting an inside-out star formation scenario. The sources are likely experiencing a burst in star formation in connection with the central [O ] bright regions. The connection between recent bursts of star formation and high [O ]/[C ] ratios has been discussed on global galactic scales by several authors (Katz et al., 2017; Arata et al., 2020; Sugahara et al., 2022; Pallottini et al., 2022; Kohandel et al., 2023), but this is the first time that we obtain a quantitative measure of spatially resolved trends in burstiness within EoR galaxies.
As outlined in Sec. 3, for sources detected in the dust continuum (COS-3018, UVISTA-Z-001, and UVISTA-Z-019) we also considered the obscured star formation rate (SFRIR) when deriving the total . The SFRIR is computed from the (see Sec 2) using the conversion from Kennicutt & Evans (2012) in those pixels where the continuum is detected at . For COS-3018 and UVISTA-Z-001 adding SFRIR does not alter the smooth decreasing radial trends of (, , ) from the galaxy center towards the periphery, but in UVISTA-Z-019 the SFRIR produces a sharp gradient in the and values towards the center of the source. In the IR-detected central region both and have higher values with respect to the neighbouring regions that are only UV detected. This finding can be even more prominent should the galaxy centres be characterized by warmer than the value derived from the global SED fitting procedure (see Sec. 2).
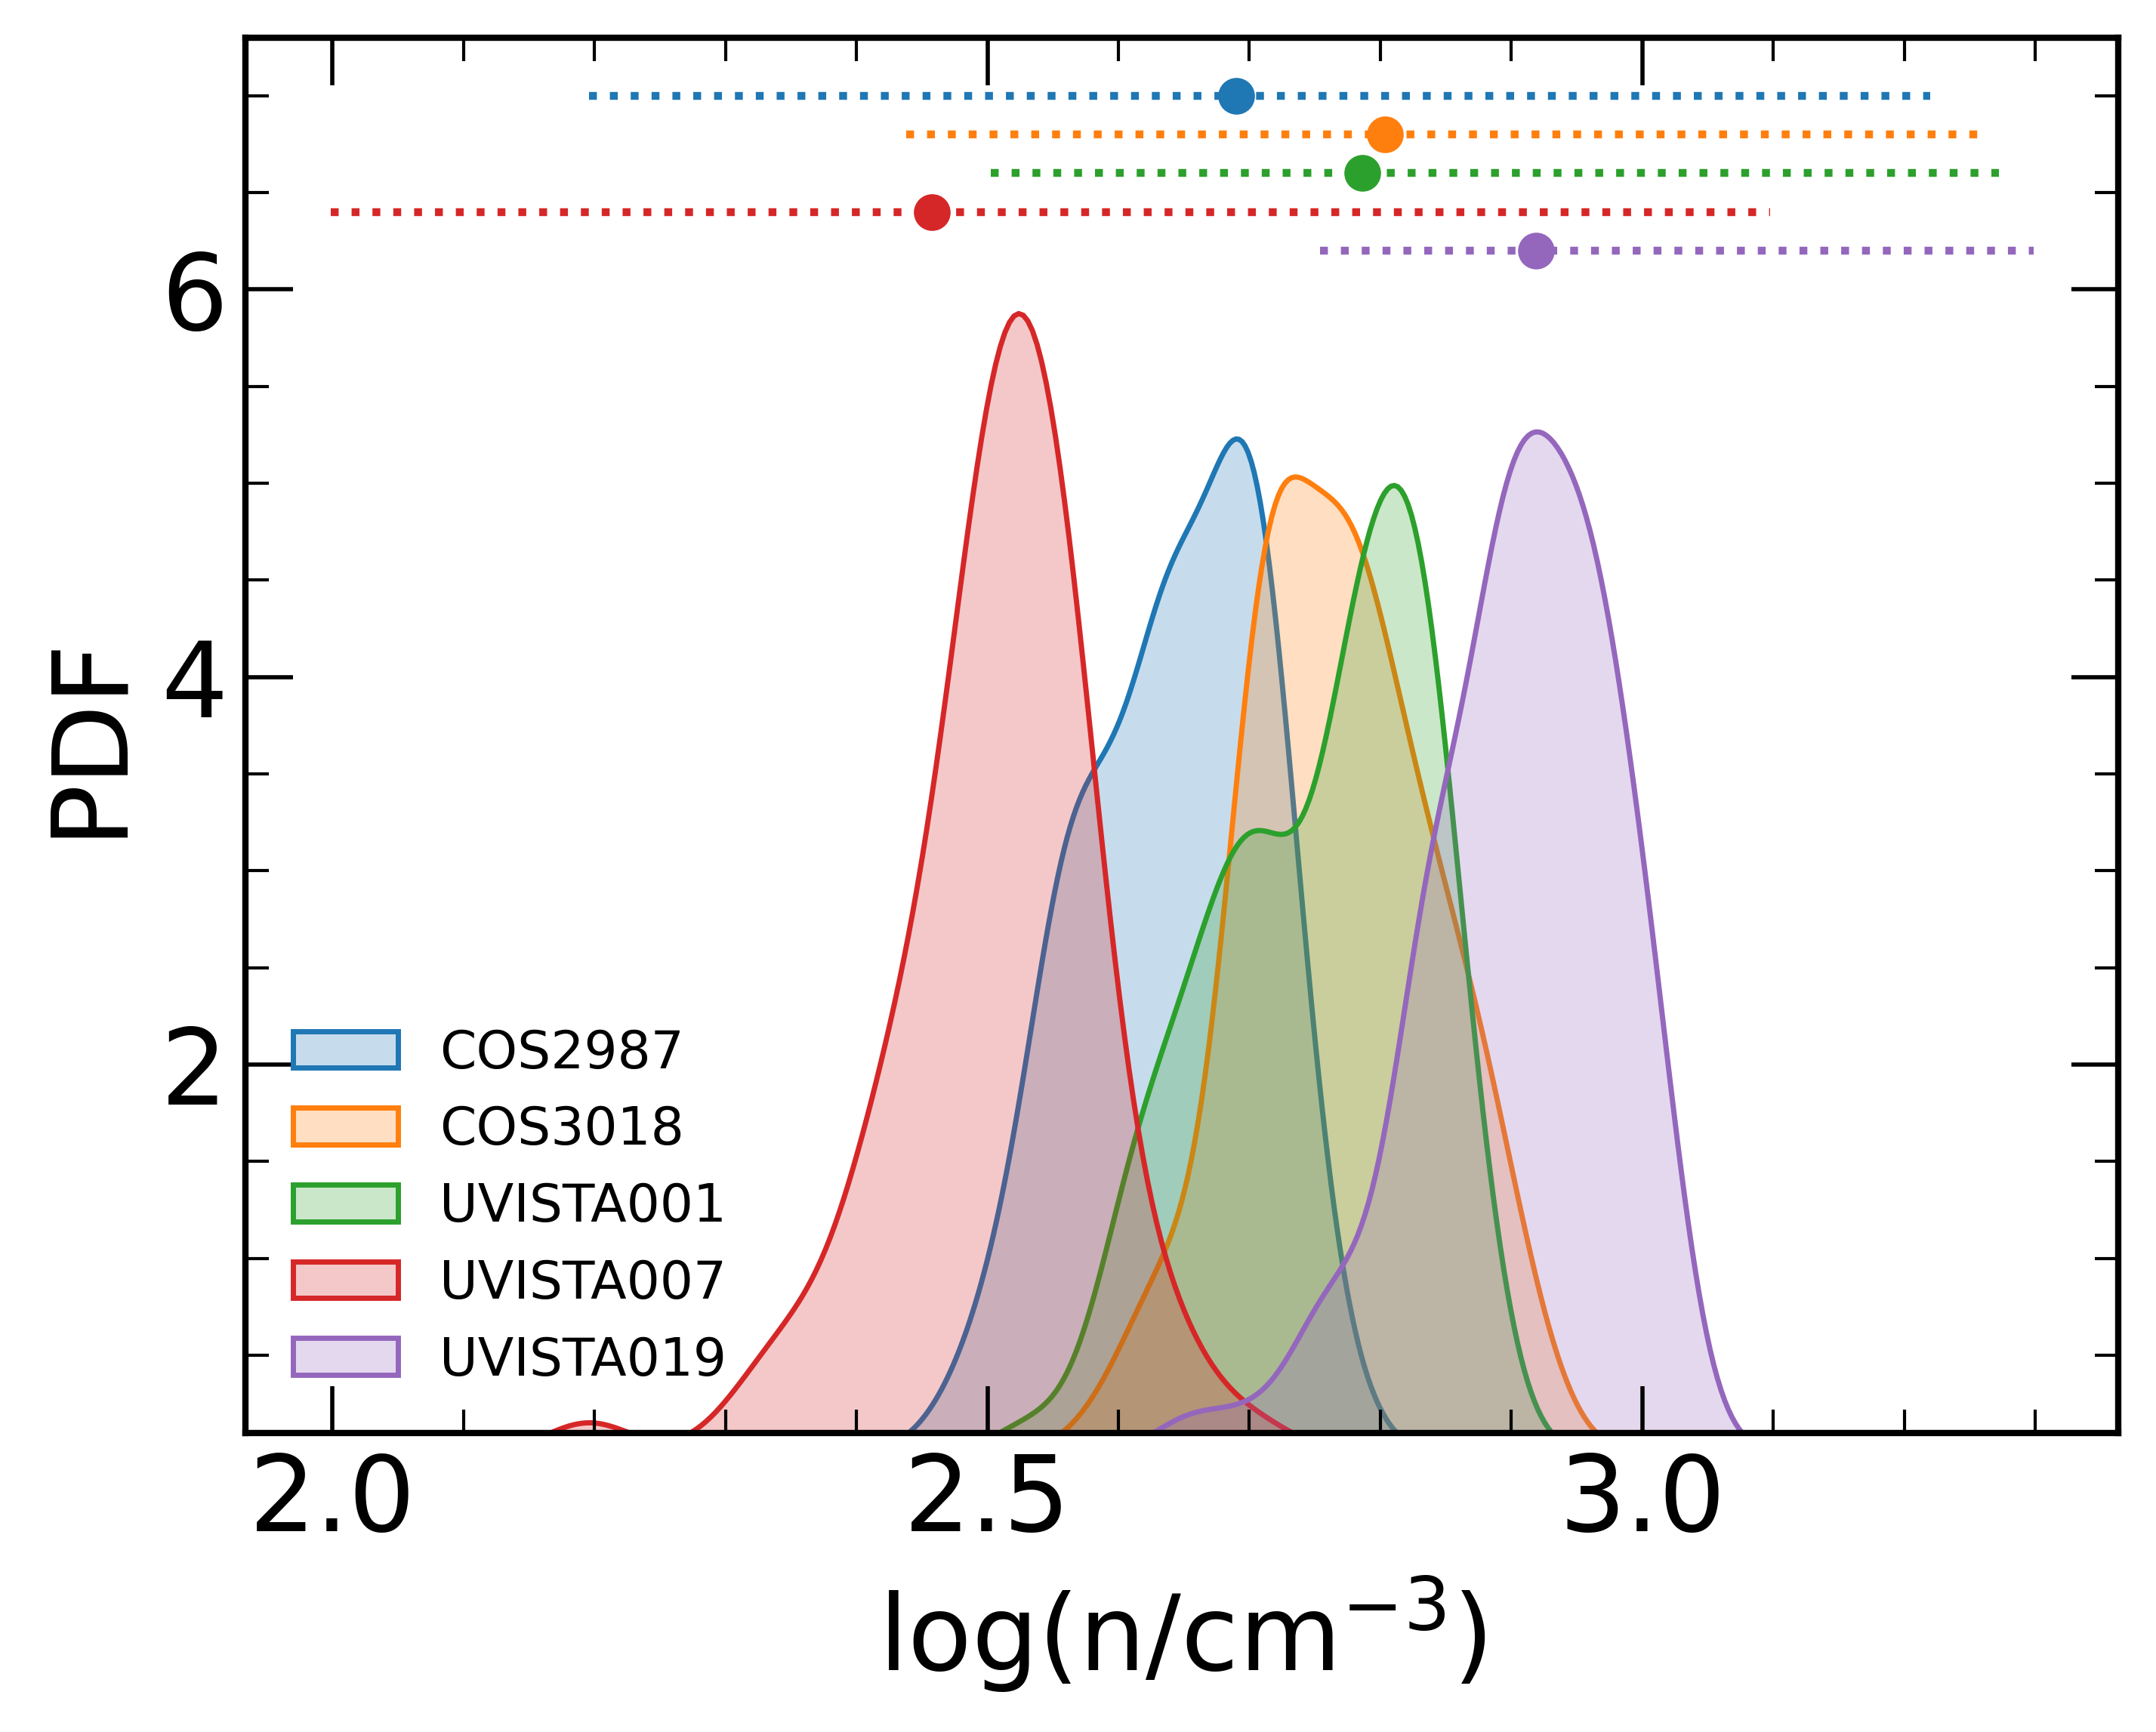
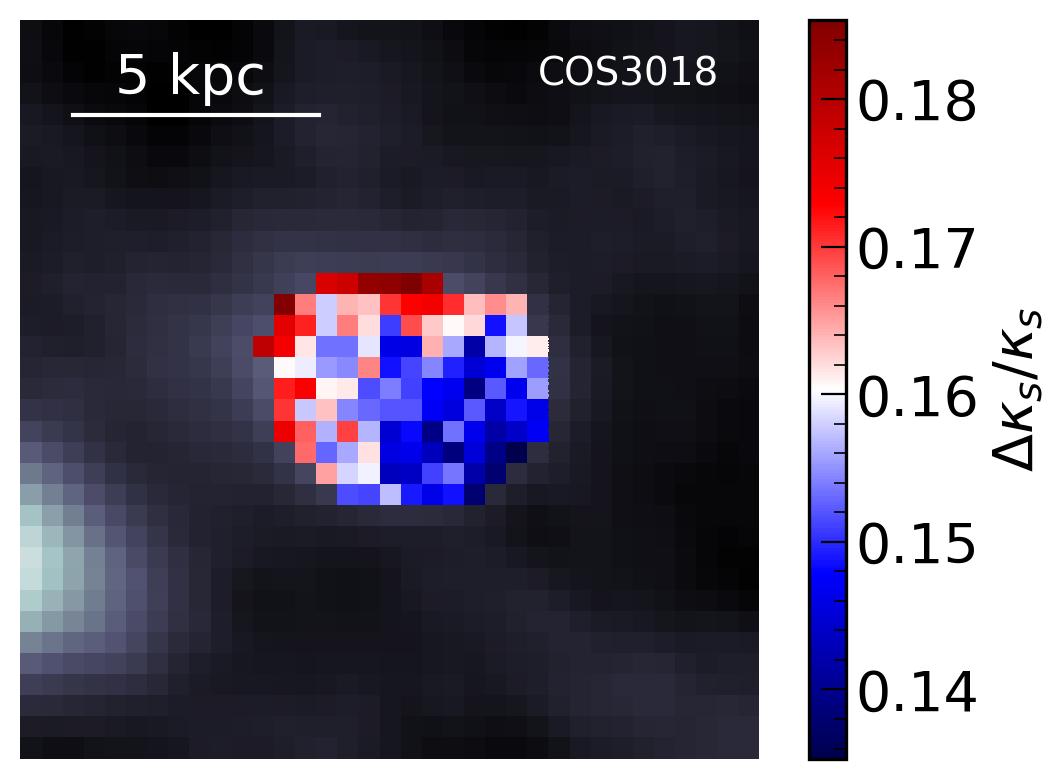
In Figure 2 we analyze the probability distribution function (PDF) of , , and derived on pixel-by-pixel basis within the five galaxies. The relative error on the parameters, see Appendix A for the corresponding maps, are in the range , , , respectively, depending on the source. The density distribution in all the galaxies is fairly narrow ( dex between the minimum and maximum value) and the peak of the distribution ranges from (UVISTA-Z-007), to (UVISTA-Z-019), albeit higher resolution data might reveal larger variability in the density within the ISM of the sources. For comparison, we also report the global value and uncertainties for the same parameters obtained using the mean , , and of each source. The global (see Table 1) for each source is very close to the peak of the corresponding PDF over the pixels.
This implies that using GLAM for deriving the gas density of a galaxy using the average [C ], [O ], and SFR surface density would return values that are representative of the actual ISM conditions within the source.
Our derived gas densities are slightly higher than the electron density, , inferred by Fujimoto et al. (2022) using [O ] and [O ] 5007 JWST data in a source. This is expected because the electron densities derived with standard methods based on optical/UV line ratios (e.g. Kewley et al., 2019) are sensitive to the conditions in the H regions only, which despite being connected with the surrounding environment, have an overall lower density than the neutral/molecular gas in the PDRs (Fig. 1 in Vallini et al., 2021). It is also interesting to compare our results with those obtained by Davies et al. (2021) on the redshift evolution of the (electron) density. Davies et al. (2021) find an increasing trend with redshift from at to at . Such a positive correlation is likely connected with the evolution in the normalization of the star formation main sequence, and with the H regions being embedded in parent giant molecular clouds (GMCs) characterized by higher densities at high- (see also Sommovigo et al., 2020). Note that the total gas density derived with GLAM is explicitly linked to that of the GMCs as, by construction, the density is parametrized in term of the H region-PDR complexes tracing [O ] and [C ], respectively.
Our results at are also in agreement with the density increase () with redshift recently found by Isobe et al. (2023) exploiting [OII]3726,3729 fluxes in sources. Isobe et al. (2023) identify an increase of the electron density with redshift that can be approximated as , with . The exponent is explained by a combination of the compact morphology toward high-, and the reduction of the electron density due to high electron temperatures of high- metal-poor nebulae. Our method favors the solution that implies at .
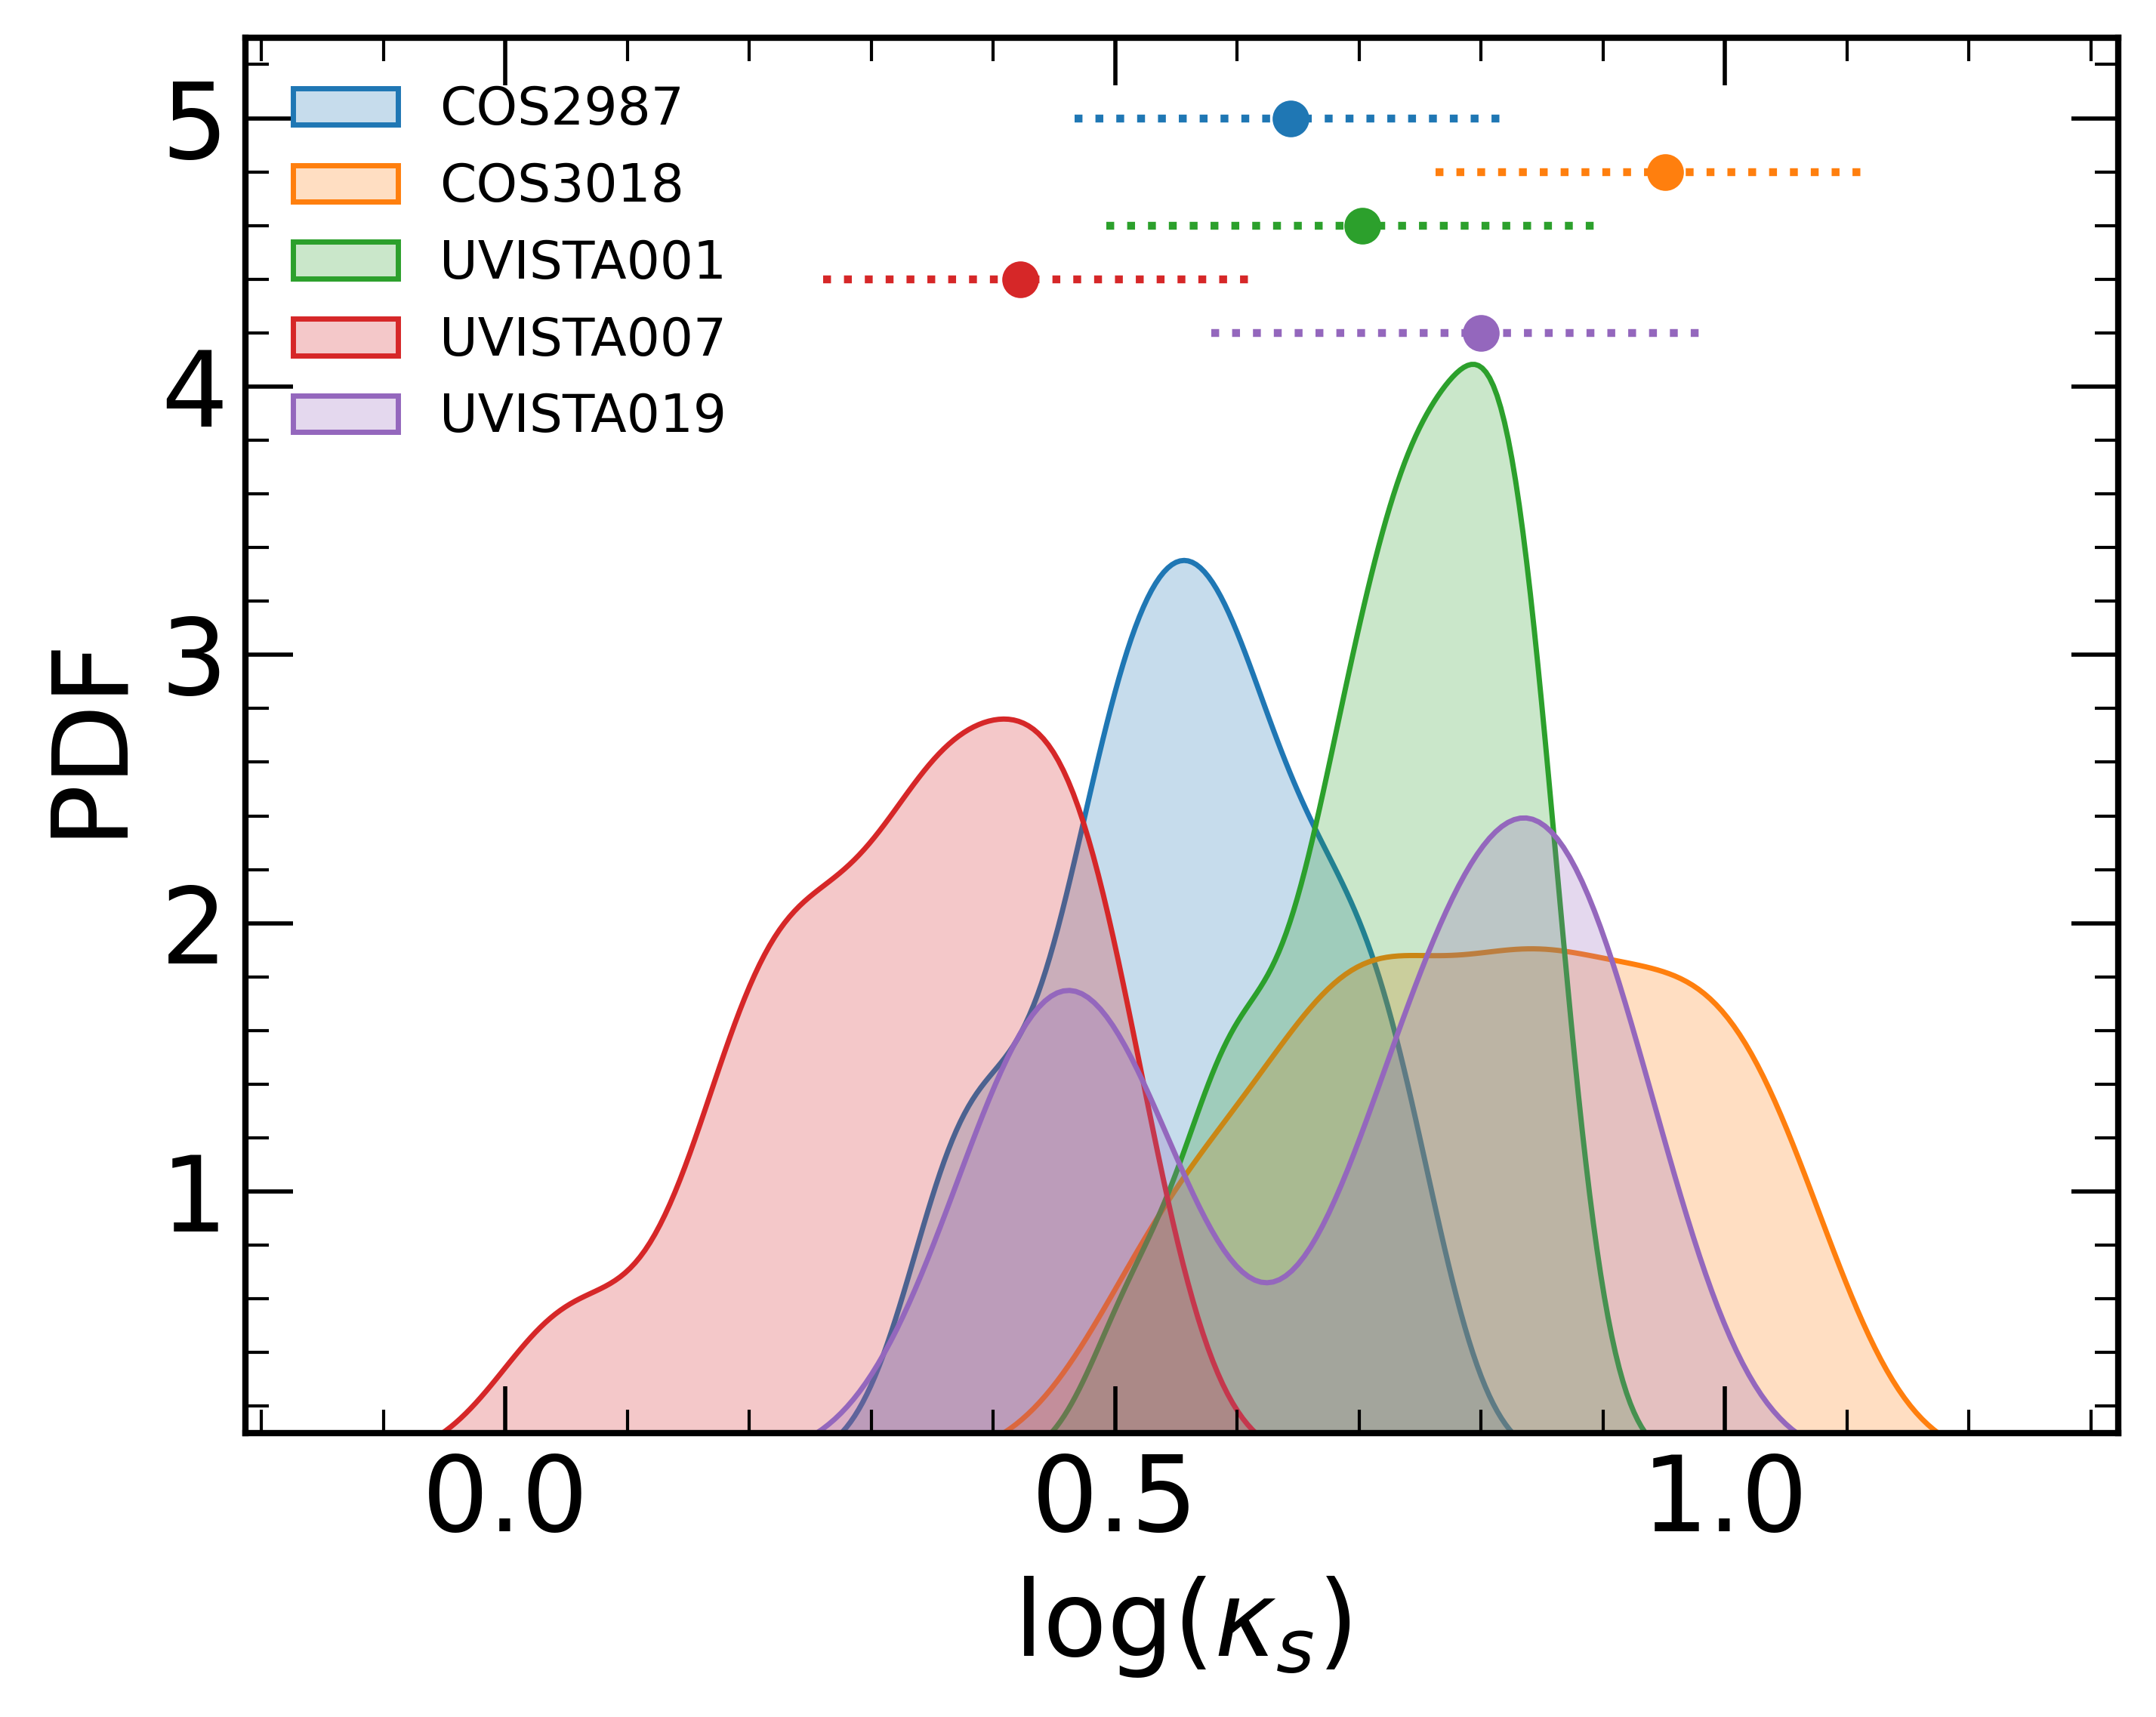
All five galaxies lie above the KS relation, i.e. they are characterized by . Overall the PDFs span a range between (UVISTA-Z-007), up to (UVISTA-Z-019). Note that for UVISTA-Z-019 we recover a clear bi-modality in the PDF of the burstiness parameter. This is because the dust-continuum detected region is more bursty than the outer part that is instead undetected with ALMA in continuum at . As for the gas density, the derived from global values is close to the peak of the corresponding PDF over the pixels, albeit the PDFs show a larger scatter, while the error on the global is rather small ( dex). Moreover, the global tends to be skewed towards the higher end of the PDFs (see the case of UVISTA-Z-019).
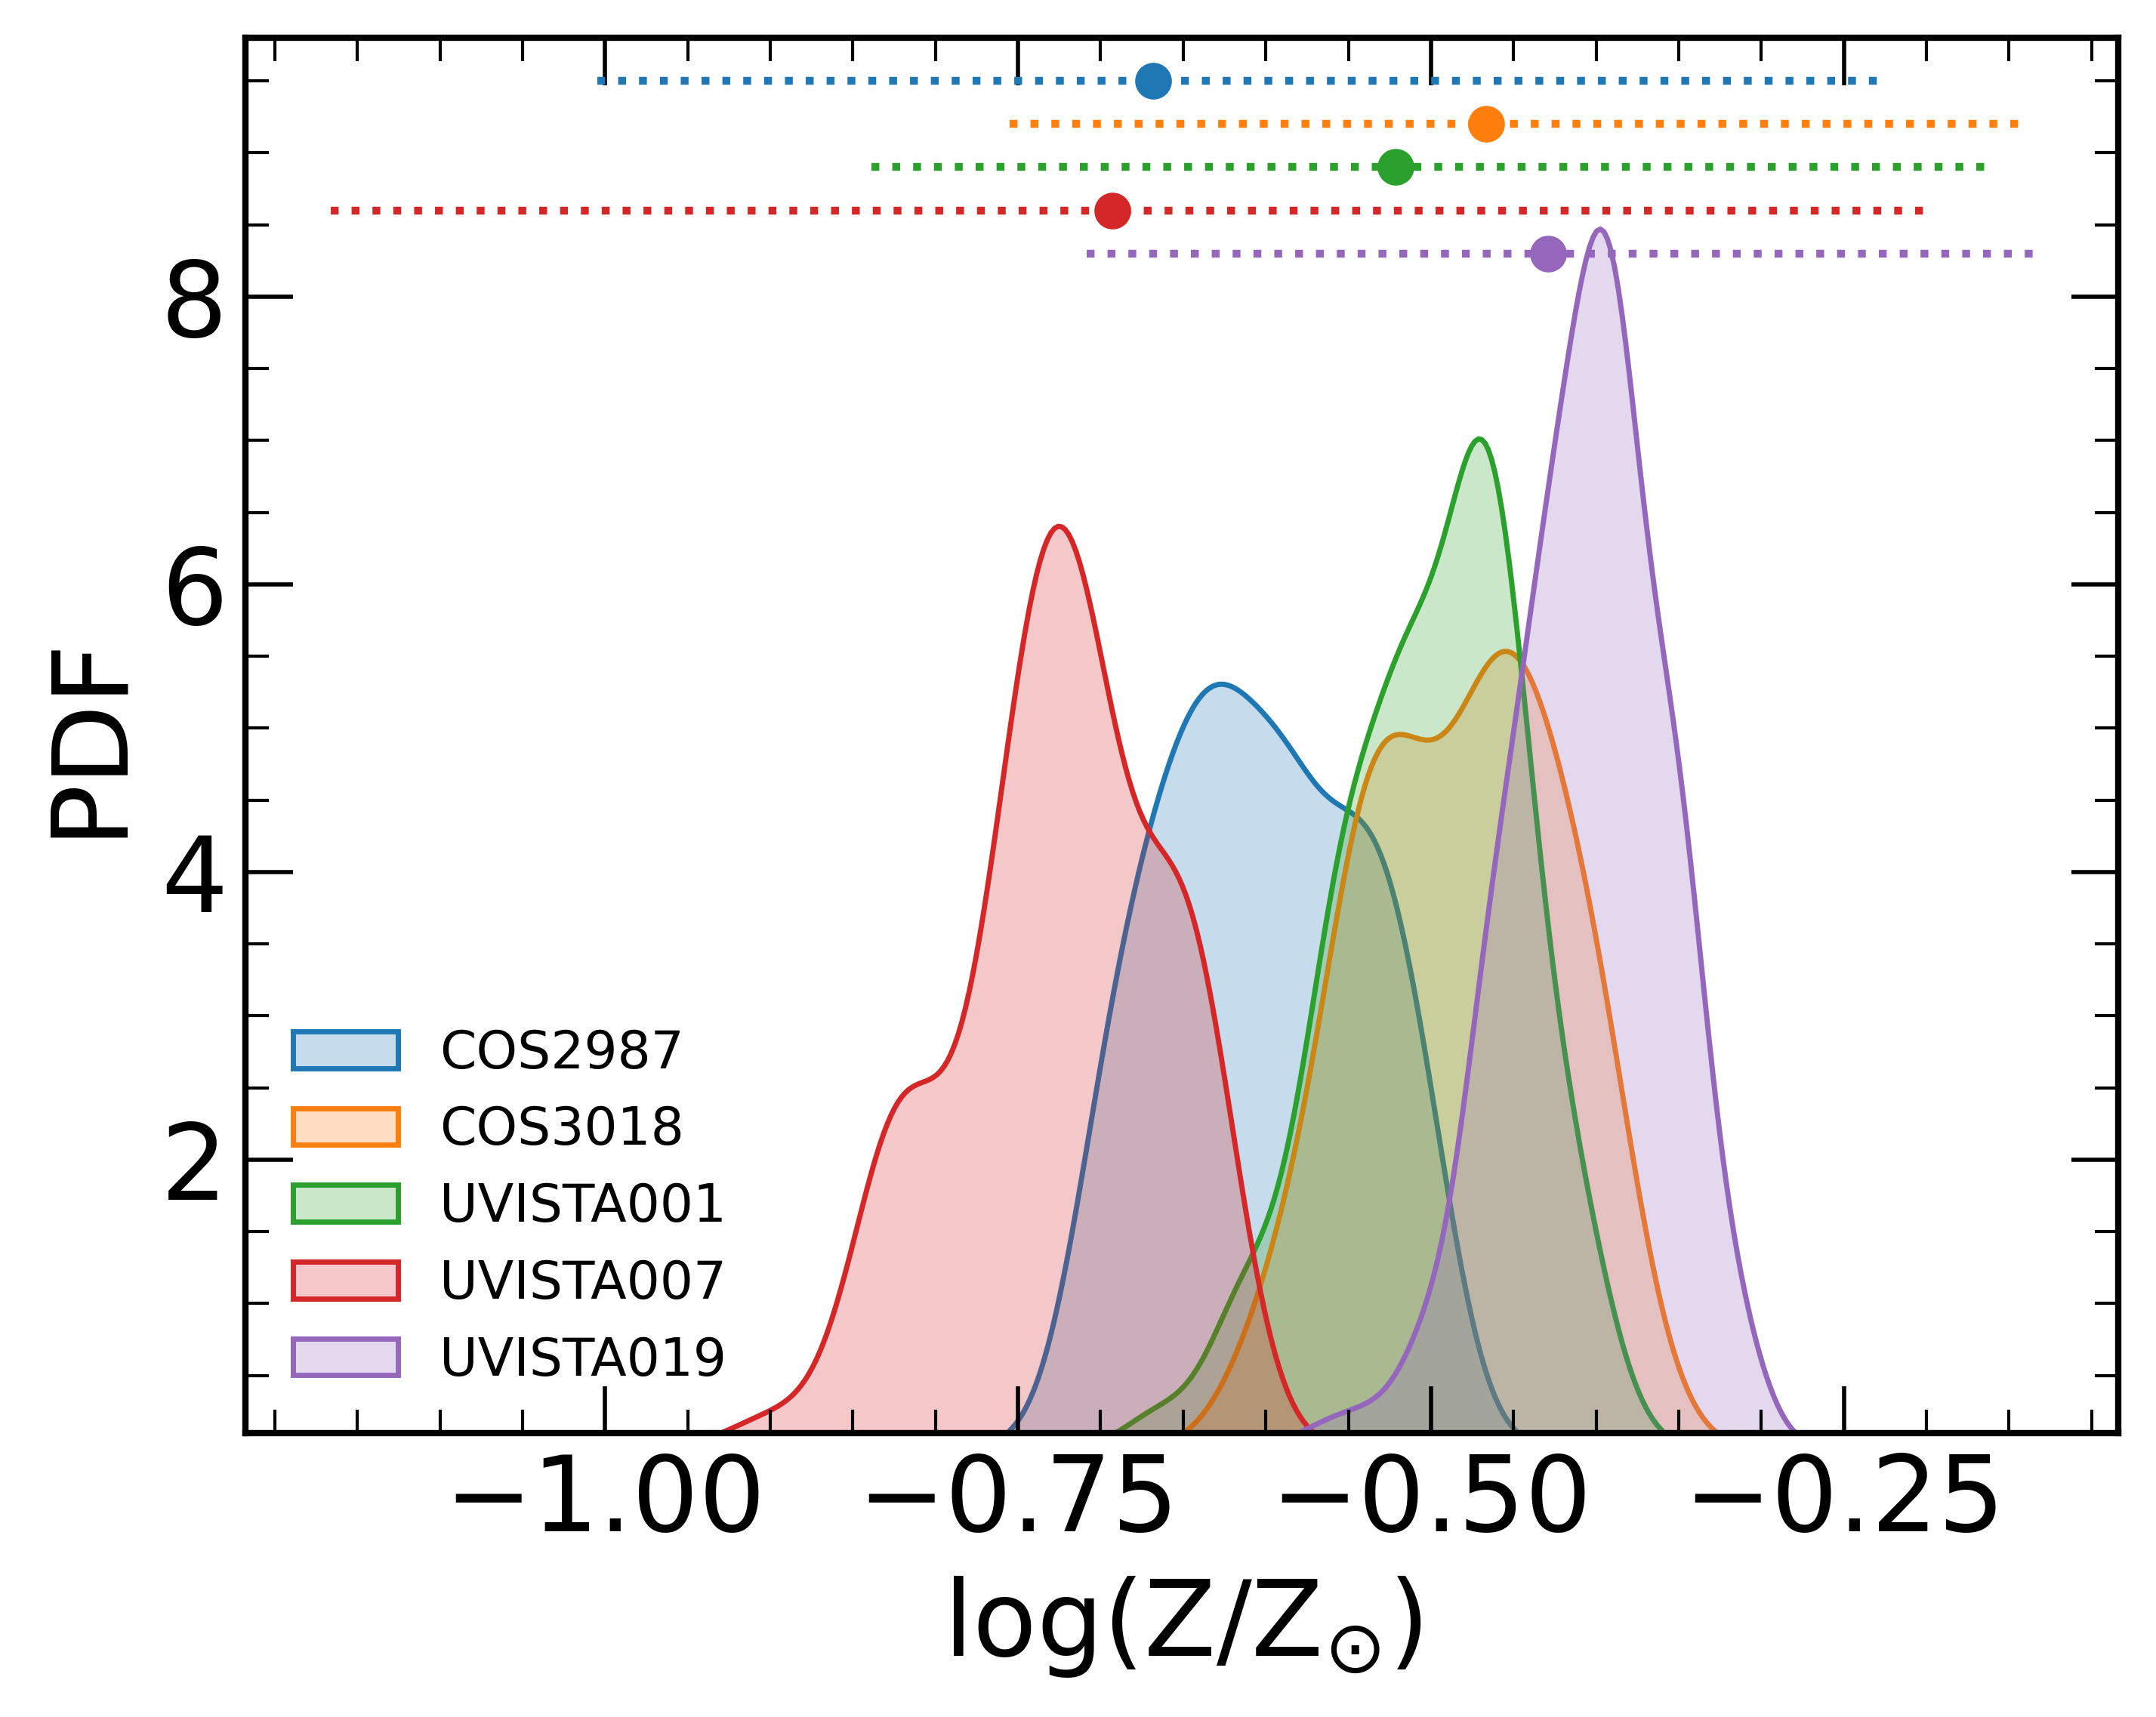
Finally, we report the PDFs of the gas-phase metallicity obtained with GLAM in every pixel. As previously discussed for the density, and burstiness parameter, also the global of each galaxy is close to the peak of the corresponding PDFs. The uncertainties in the global values are much larger than the typical width of the PDFs and comparable to the pixel relative error.All the galaxies have sub-solar gas metallicities ranging from of UVISTA-Z-007 up to the in some of the pixels of UVISTA-Z-019. As a caveat we stress that the GLAM model assumes a fixed O/C ratio; the O/C in the early Universe is expected to be higher than that measured at (e.g. Maiolino & Mannucci, 2019) thus the inferred from the (high) / ratios might be underestimated by GLAM.
4.2 Metallicity gradients
Metallicity gradients are sensitive probes of the complex network of processes that regulates gas inflows/outflows, feedback, and mixing within the ISM of galaxies across cosmic time (e.g. Sánchez Almeida et al., 2014). Theoretical models and numerical simulations (e.g. Gibson et al., 2013; Ma et al., 2017; Hemler et al., 2021; Sharda et al., 2021; Tissera et al., 2022) addressed the physical mechanisms shaping the metallicity gradient within galaxies and its evolution with redshift. In particular, negative gradients represent one of the strongest pieces of evidence for the inside-out galaxy formation scenario in which the nucleus forms first and more metals enrich the galaxy centre as compared to the disc. A flattening in the gas-phase galaxy metallicity can instead be the signature of star formation and strong stellar feedback (e.g. Gibson et al., 2013; Ma et al., 2017), merger events (e.g. Rupke et al., 2010) and pristine gas inflows towards the central regions (e.g Ceverino et al., 2016). The combined effects of these physical processes modulate the evolution of the metallicity gradients as function of redshift.
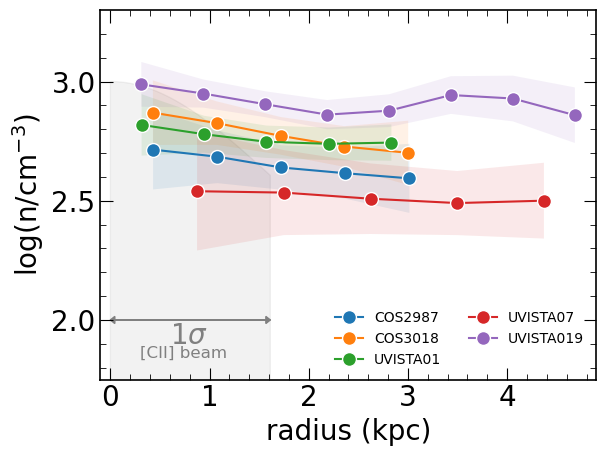
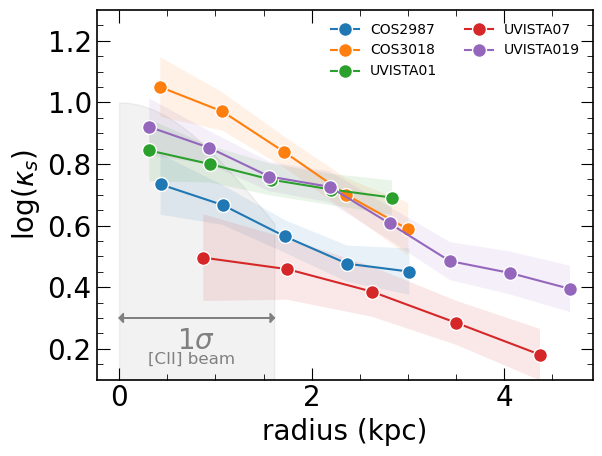
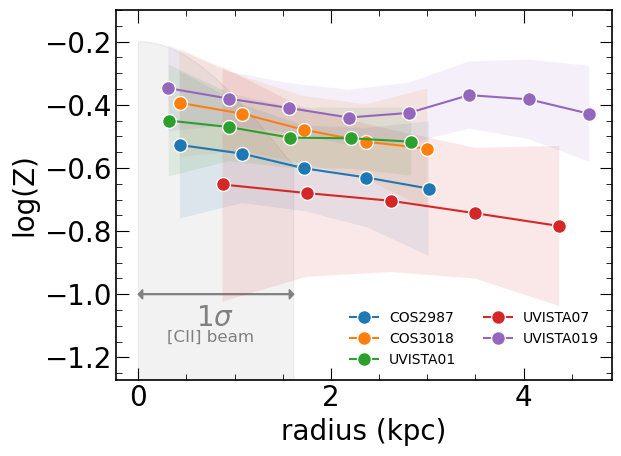
Thanks to the pixel-by-pixel derivation of the ISM properties within the five galaxies in our sample, it is possible to study how the gas metallicity, but also the galaxy burstiness and gas density, vary within each source as a function of the galactocentric radius. To do so we use the RadialProfile class within the photutils package to compute the azimuthally-averaged value, and the corresponding uncertainty, of all the three GLAM parameters over circular annuli of kpc (2 pixels) width. The exception is UVISTA-Z-007 for which the radial spacing corresponds to 1 pixel, due to the lower spatial resolution of the data. We assume the center () to be located at peak of the [O ] emission. The error on the radial profiles is computed by providing to the RadialProfile routine the map of the errors of each parameter in each -th pixel as computed by GLAM (see Appendix A).
| name | redshift | |||||
|---|---|---|---|---|---|---|
| COS-2987 | 6.807 | 2.69 | 0.64 | -0.67 | ||
| COS-3018 | 6.854 | 2.80 | 0.95 | -0.47 | ||
| UVISTA-Z-001 | 7.060 | 2.79 | 0.70 | -0.52 | ||
| UVISTA-Z-007 | 6.749 | 2.46 | 0.42 | -0.69 | ||
| UVISTA-Z-019 | 6.754 | 2.92 | 0.80 | -0.43 |
The result of this procedure is outlined in Figure 3 where we show the gas metallicity profiles for the five sources analyzed in this work. We refer the interested reader to Appendix B for details regarding the radial profiles of the gas density and burstiness. We note that gradients as a function of galactocentric radius are marginally negative, but consistent with being flat within the errors. The median in the sample dex/kpc and the values for each source can be found in Table 1. Our analysis suggests that the metal enrichment in the central regions might be connected with recent burst (high ) of star formation and that, at the same time, the vigorous starburst (and possibly flikering SFR, e.g. Pallottini & Ferrara, 2023) implies copious energy injection via stellar feedback, thus flattening the gradient.
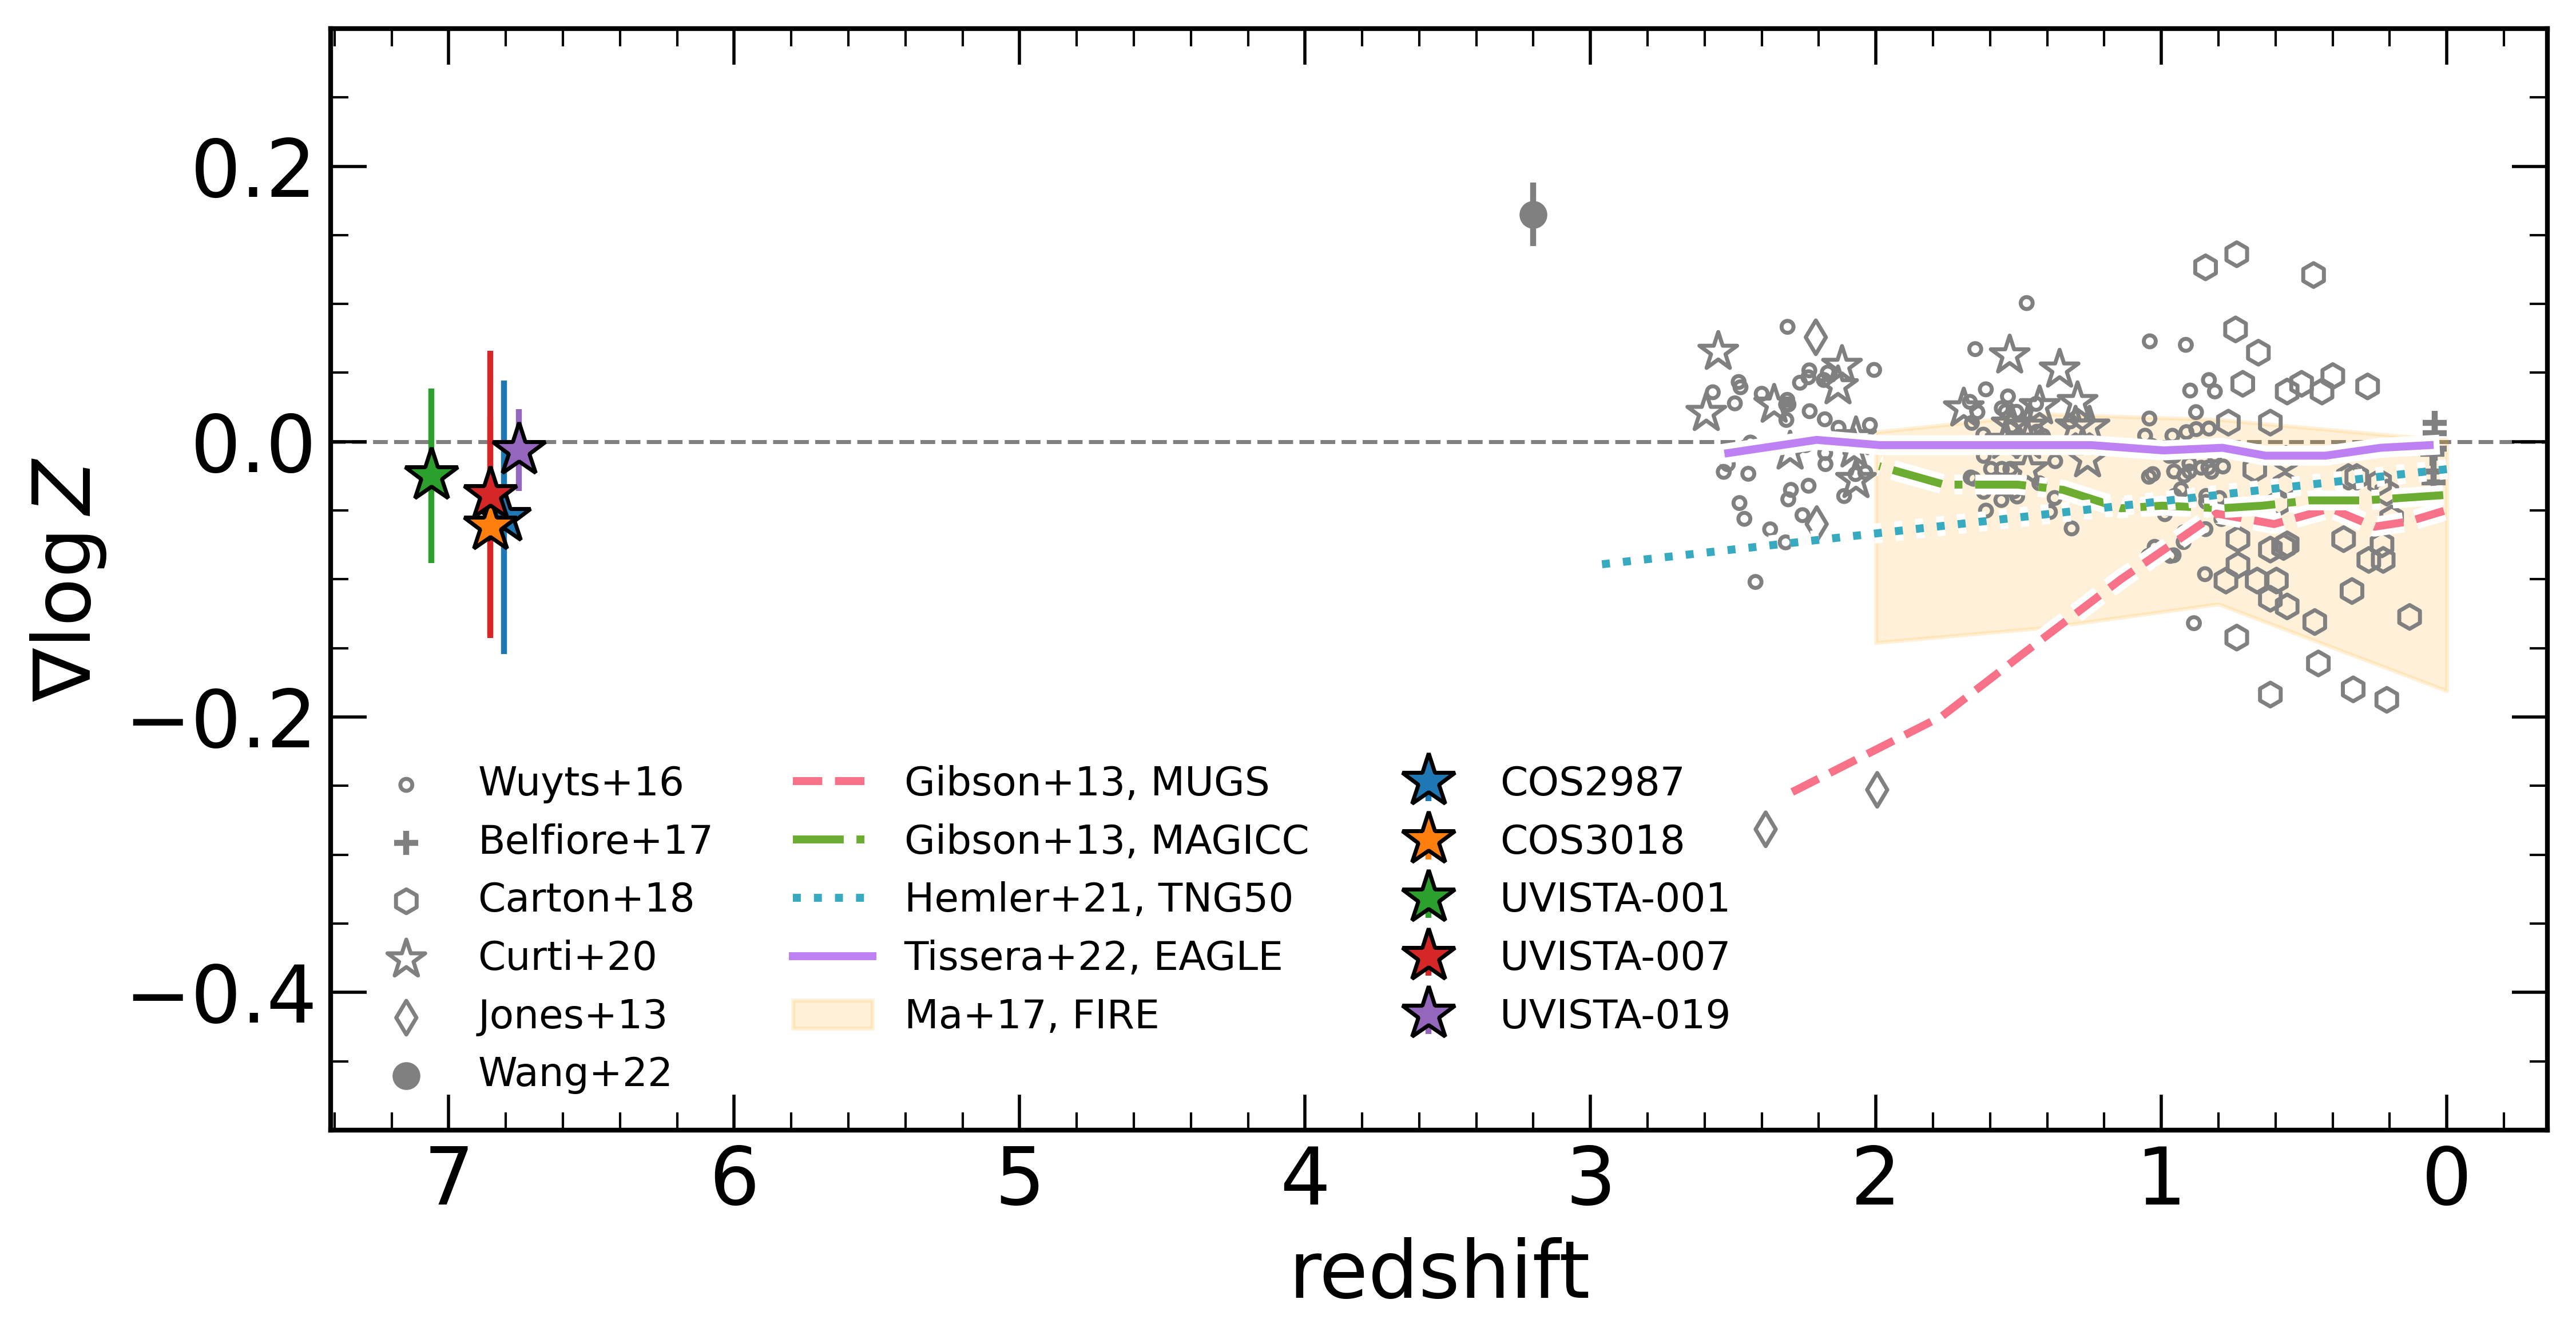
In Figure 4, we report the gradient estimates for the five sources as a function of their redshift, comparing them with observations and theoretical models in the literature. Negative metallicity gradients in the radial direction have been confirmed in most galaxies at (e.g. Stanghellini & Haywood, 2010; Belfiore et al., 2017; Stanghellini & Haywood, 2018) whereas there is evidence of an evolution of the metallicity gradients towards a flattening at high- (Wuyts et al., 2016; Carton et al., 2018; Curti et al., 2020) albeit with large scatter (see e.g. the negative slopes reported by Jones et al., 2013).
In the coming years, high- samples with spatially resolved metallicity measurements will rapidly expand thanks to JWST that will allow observing nebular lines (e.g. [O III], H, [O II]) that are routinely used as metallicity estimators. Wang et al. (2022) reported the first JWST determination of the metallicity gradient in a galaxy, finding a strongly positive gradient likely due to the interaction with a nearby object. With our method, we do not find evidence of positive gradients in our sources at and this is likely connected to the fact that the star formation burst, as traced by [O ], is localized at the center of the sources. Nevertheless, as a caveat, we warn the reader that our derivation of the metallicity using GLAM represents an indirect methodology and thus the uncertainty in the comparison with gradients in the O/H abundance obtained with other methods is large. \colorblack In particular, systematics in the determination can arise from the fact that the likely enhancement O/C ratio at low metallicity (e.g. Maiolino & Mannucci, 2019) is not accounted for in GLAM (see Section 3). This assumption implies that the inferred with GLAM from the and fitting, might be biased towards higher values to compensate for a lower than expected oxygen abundance at sub-solar metallicity.
4.3 Kennicutt Schmidt relation and gas depletion time
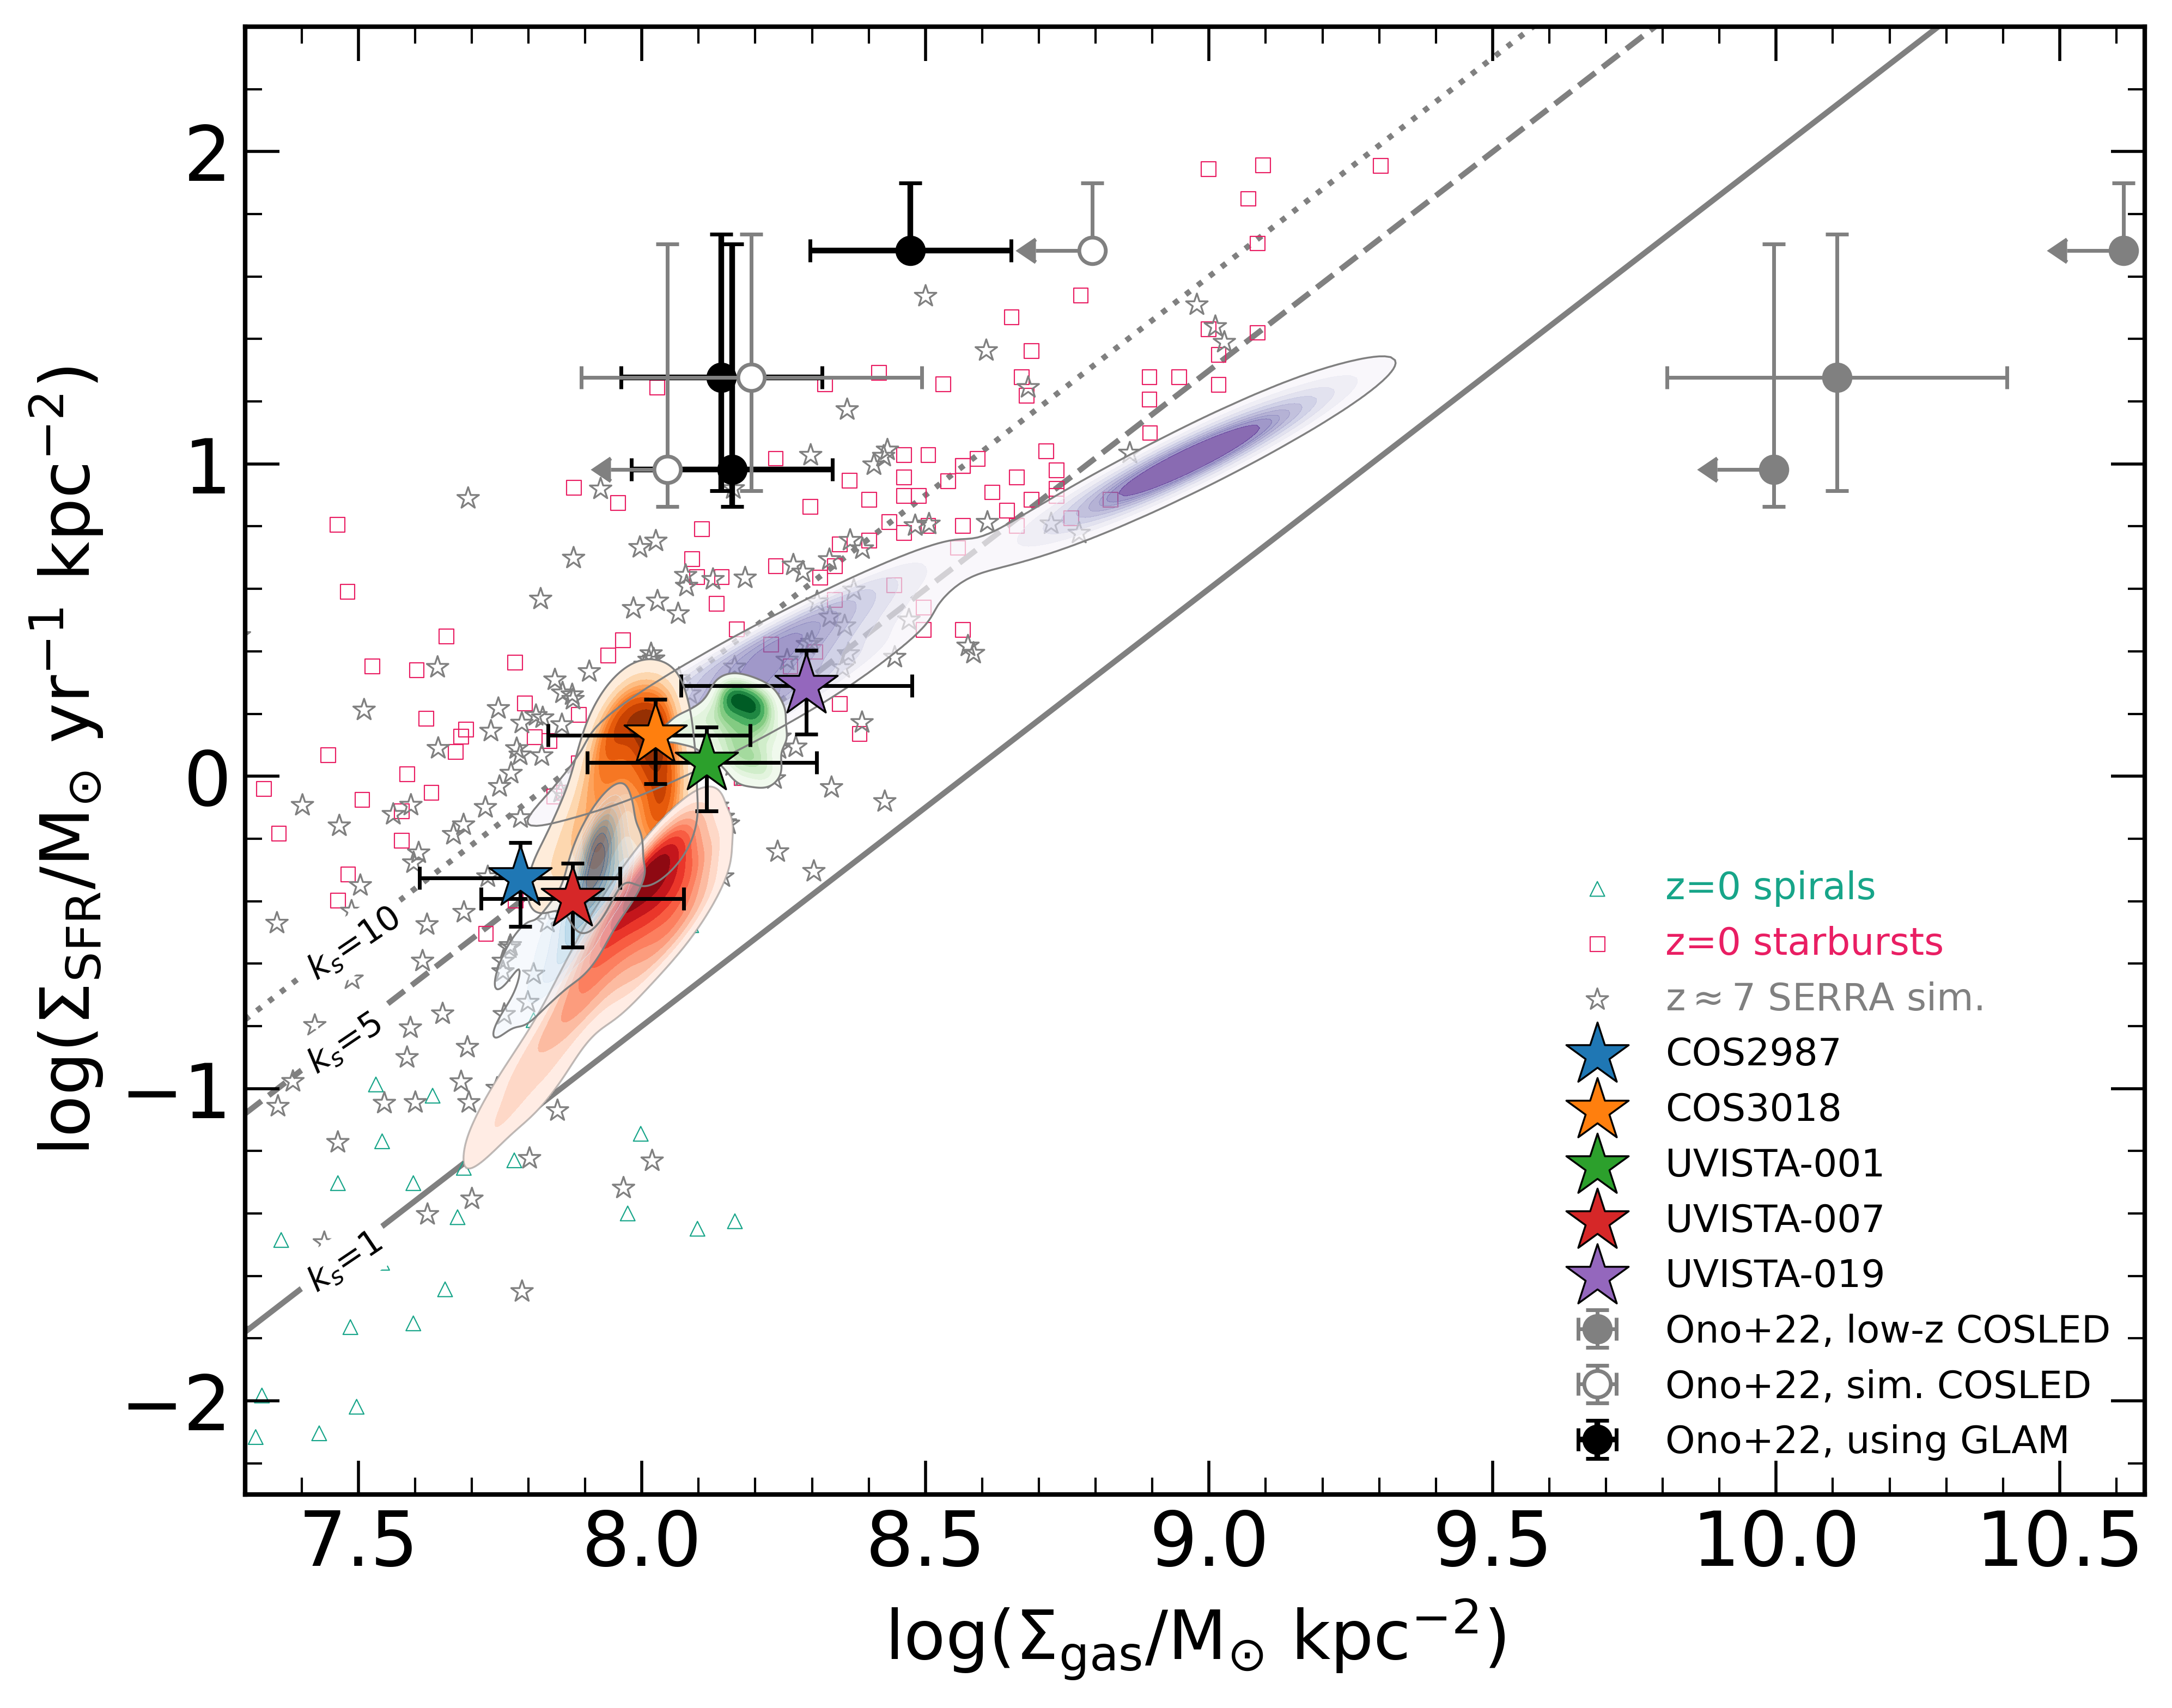
In Figure 5 we show the - (Kennicutt-Schmidt) relation for the five galaxies analyzed in this work. We consider both the 2-D probability density distribution of the values within the pixels, and the location of the five galaxies in the KS plane when deriving the from the global and .
In line with previous works (V21), we confirm that the inferred location in the KS plane of a source, obtained considering the global and values, traces the most starbursting (high ) patches within the ISM of the objects. The global values fall indeed in the upper- end of the 2-D distribution of the pixels within each galaxy. The global and spatially resolved - values place our galaxies above the relation for spiral galaxies (de los Reyes & Kennicutt, 2019) in the region populated by starburst sources in the local Universe (Kennicutt & De Los Reyes, 2021).
Interestingly, their location is in good agreement with the position in the KS plane of simulated star forming galaxies at extracted from the serra zoom-in cosmological simulation (Pallottini et al., 2022) that cover a range of stellar masses () and star formation rate (SFR) that encompass that of the five LBGs analyzed in this work.
Our analysis suggests that luminous LBGs in the EoR are characterized by an efficient conversion of the gas into stars. To put this conclusion into a broader context we perform a comparison with three luminous LBGs (J0235-0532, J1211-0118 and J0217-0208) first targeted by Harikane
et al. (2020) with ALMA in [C ] and [O ] characterized by UV luminosities () and [O ]/[C ] ratios () similar to those of our galaxy sample (see Witstok
et al., 2022).
V21 studied J0235-0532, J1211-0118 and J0217-0208 with GLAM, albeit using only the barely resolved [C ] and [O ] data available at the time, deriving their burstiness parameter, gas-phase metallicity and density. Thanks to the detection of the CO(6–5) line in J0235-0532, and the upper limits in the other two LBGs (Ono et al., 2022), it is possible to compare their location in the KS plane from GLAM with that obtained using the CO as fiducial gas proxy, which, however, involves many uncertain parameters. In fact, (i) the conversion of the CO(6–5) flux into the CO(1–0)444The CO(1–0) luminosity can be then converted into the molecular mass via the CO-to-H2 conversion factor, depends on the CO Spectral Line Energy Distribution (COSLED) excitation, which is observationally unconstrained in LBGs in the EoR (Pavesi et al., 2019), (ii) the CO-to-H2 conversion factor is also highly uncertain in high- sources as it depends on metallicity (Bolatto
et al., 2013) and (iii) the actual size of the molecular gas distribution cannot be derived from unresolved CO observations. As discussed by Ono et al. (2022), assuming and the CO(6–5)/CO(1–0) ratio of star forming galaxies (Daddi
et al., 2010), all the three sources lie below the KS relation, at odds with their high [O ]/[C ] ratios that are usually powered by ongoing bursts of star formation (Arata et al., 2020; Vallini et al., 2021; Kohandel et al., 2023). If, instead, one assumes the and CO(6–5)/CO(1–0) ratio derived by Vallini et al. (2018) for Althaea – a simulated LBG extracted from the precursor of the serra zoom-in simulation (Pallottini
et al., 2017, 2019, 2022) – the sources are compatible with the location of starburst galaxies in agreement within the errors (see Fig. 5) with the location inferred with GLAM in V21.
Given that the CO(6–5) traces dense/warm (, K) molecular gas (Wolfire
et al., 2022, for a recent review) the line is expected to be luminous in bursty galaxies that are experiencing on-going star formation within dense GMCs (Vallini et al., 2018). UVISTA-Z-019 would be therefore an ideal target for CO follow-up being the most dense and bursty among the five LBGs in our sample with both CO(6–5) and CO(7–6) falling into ALMA band 3. Moreover, its continuum detection translates into SFRIR/SFR, namely 70 per cent of the star formation is dust obscured and dust shielding is one of the key necessary conditions mitigating the CO dissociation in star forming regions (Wolfire
et al., 2010). Note that the UVISTA-Z-019 IR luminosity (and the obscured fraction of the star formation) , (SFRIR/SFR) is similar to that of J0235–0532 (, , respectively), the CO(6-5)-detected LBG from the Ono et al. (2022) sample.
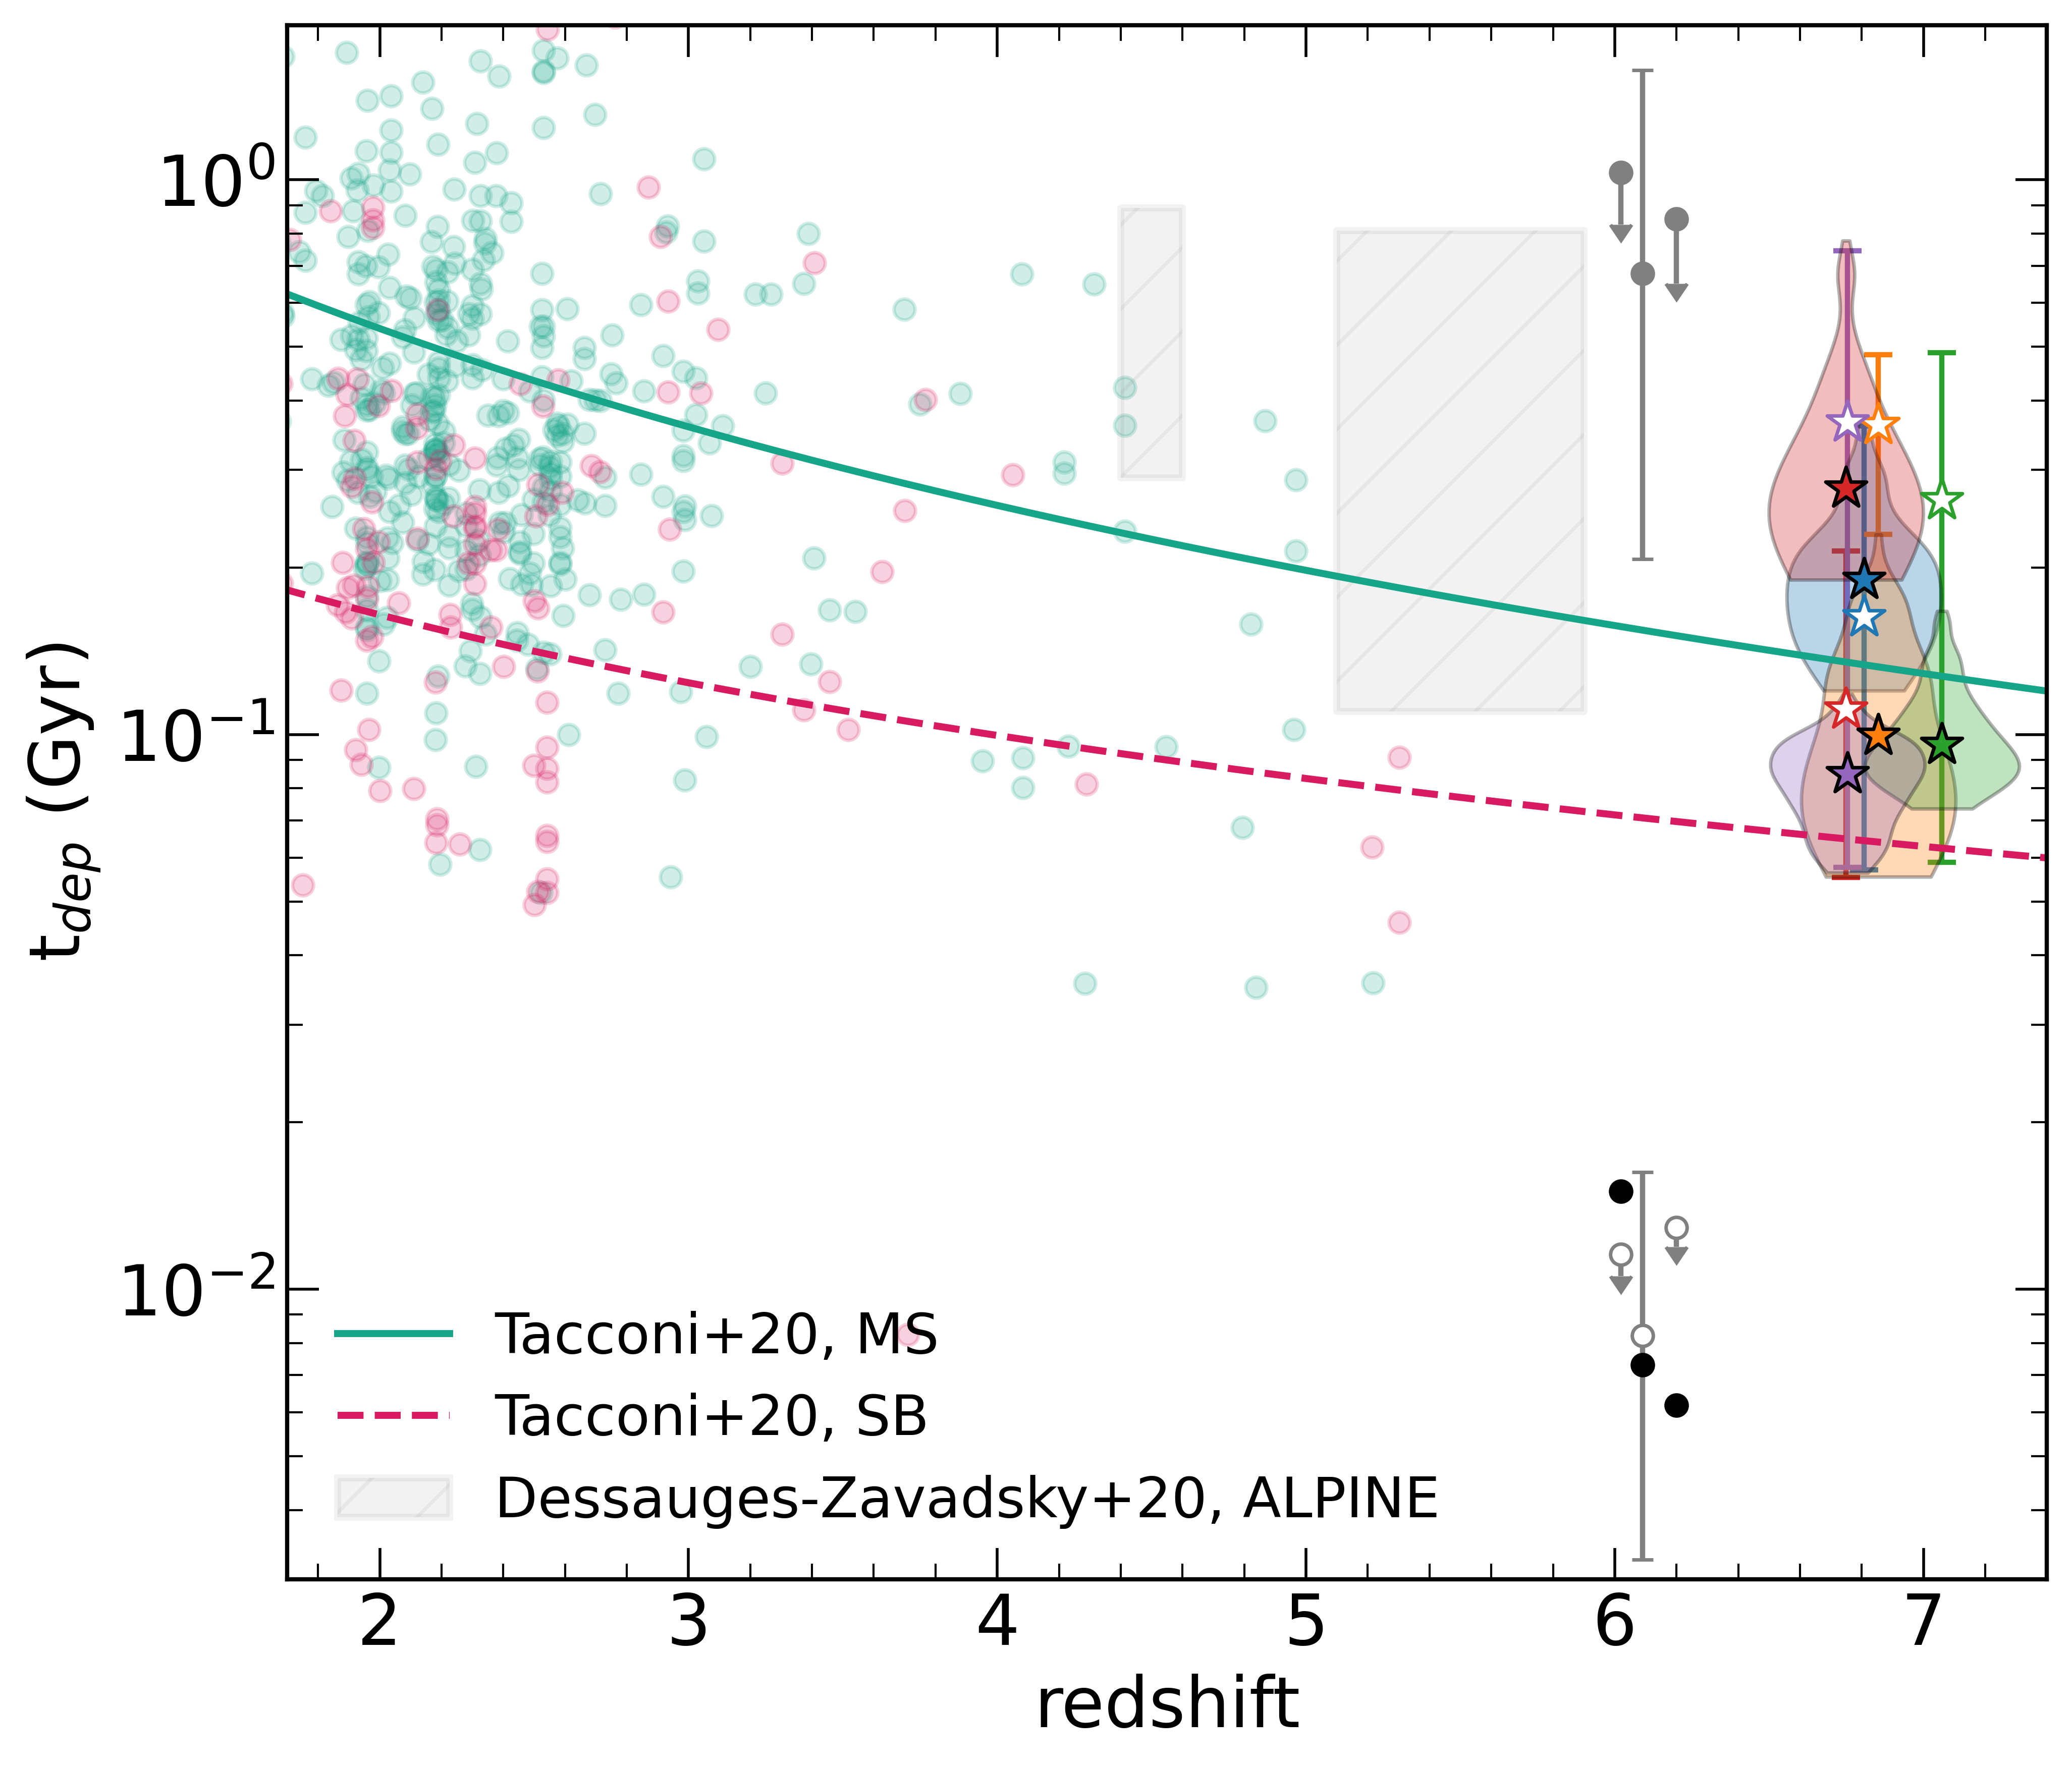
High burstiness parameters translate into short gas depletion times (e.g. Tacconi et al., 2013, 2020), defined on spatially resolved scales as . The evolution of the depletion time with redshift (see Figure 6) is a fundamental quantity shaping galaxy evolution, as it quantifies the typical timescales for the conversion of the gas into stars, thus ultimately the galaxy and stellar build up from the Dark Ages to the present day and the efficiency with which galaxies build up their stellar mass. In particular, Tacconi et al. (2020) found that the integrated depletion timescale, \colorblacknamely that derived as , depends mainly on the redshift and offset from the main sequence (). The trend for main sequence galaxies has been overall confirmed in the redshift range by the ALPINE (Le Fèvre et al., 2020) survey (Dessauges-Zavadsky et al., 2020) \colorblackby inferring the gas mass from the [C ] luminosity (see Zanella et al., 2018).
From the spatially resolved within our sources we obtain median ranging from Myr of UVISTA-Z-007 to Myr of UVISTA-Z-019, in agreement with the redshift evolution proposed by Tacconi et al. (2020). In particular, these values encompass the tight range between the extrapolation of out to for main sequence galaxies and that for starburst (deviation from the main sequence, ) sources.
black Finally, we also compare the spatially resolved obtained from GLAM against that derived on global scales by using the Zanella
et al. (2018) conversion factor to infer the gas mass . This also enables a fair comparison with the depletion times in ALPINE (Dessauges-Zavadsky et al., 2020), which appear still marginally higher than those derived in our five galaxies.
For COS-2987 the global value of the is in excellent agreement the median of the spatially resolved one. For the other four sources the two methods return that agree within the errors (see Fig. 6). More precisely, in COS-3018, UVISTA-Z-001, UVISTA-Z-019 the global value is higher than the median of the spatially resolved one. Overall we interpret this trend as the probe that GLAM, by using both the information on [C ] and [O ], is more sensitive to the starbursting regions within galaxies, whose depletion time is expected to be shorter than the average value. The exception is UVISTA-Z-007 that is the galaxy with the poorer spatial resolution of the [C ] and [O ] data for which the median of the spatially resolved value is lower than the global .
We point out that thanks to the derivation of the with GLAM the five galaxies analyzed here allow to constrain the extrapolation of the redshift evolution of the depletion time in the EoR, and the method is definitively promising as an alternative in galaxies for which the CO detection might be challenging.
4.4 Linking dust temperature and gas depletion time
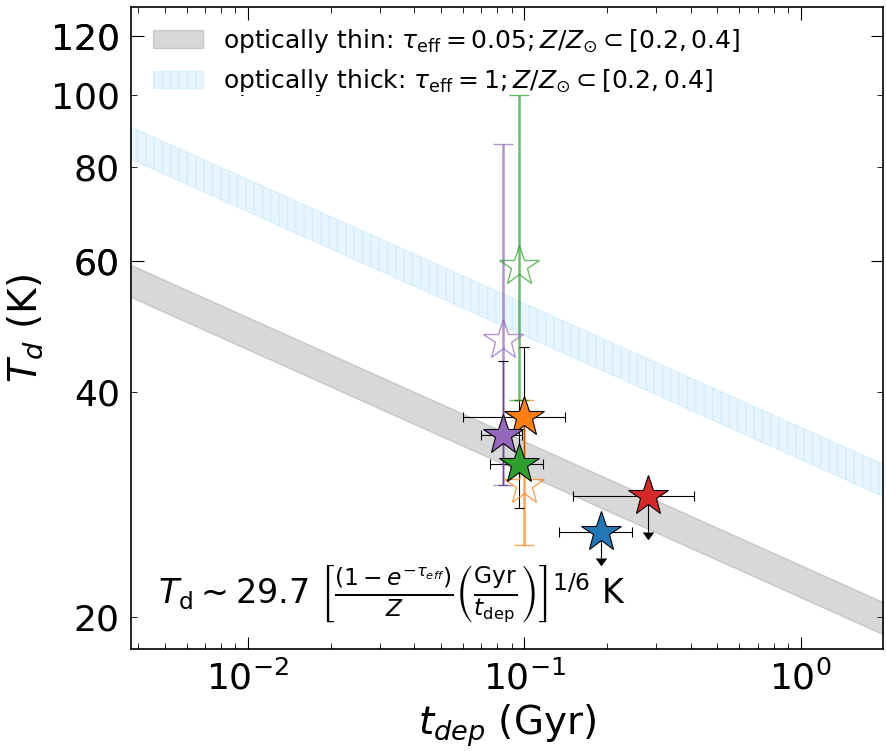
In the last few years, several works dealing with FIR stacked SED fitting across cosmic time (), have inferred the presence of a tight correlation between and redshift (Schreiber et al. 2018; Bouwens et al. 2020; Viero et al. 2022, see also Liang et al. 2019). Sommovigo et al. (2022a, b) proposed a theoretical explanation for the relation based on the evolution of the total gas depletion time. They show that, in a simplified single-phase ISM model, (see eq. 10 in Sommovigo et al. 2022a also reported in Fig. 7), resulting in a mild increase of with redshift () due to the shorter at early epochs (Fig. 6) produced by the more vigorous cosmic accretion. At any fixed epoch, the scatter in is produced by variations in metallicity and optical depth (see Figure 7), with lower (higher ) resulting in warmer dust.
To investigate this scenario, in Figure 7 we report the dust temperature for the sources in our sample as a function of the depletion times derived in the previous Section. Unfortunately, for most of our sources (and in general for galaxies towards the EoR, e.g. Béthermin et al. 2020; Gruppioni et al. 2020; Inami et al. 2022), only a single/two ALMA dust continuum detections are generally available. Thus, the derived from SED fitting is highly uncertain (, see Witstok et al. 2022) hampering an unambiguous analysis.
To overcome this problem, and study in detail the relation in all the sample, we use an alternative method (Sommovigo et al., 2021) based on the combination of the ALMA FIR continuum data point with the [C ] luminosity information. The latter is used as a proxy of the total gas (and dust) mass, so that the single continuum measurement can be exploited to constrain the dust temperature. In this case this allows us to constrain to a greater precision (). We obtain for the dust-continuum detected galaxies, and for the continuum-undetected ones. These values are consistent within the uncertainties with those derived from the SED fitting by Witstok et al. (2022), where available.
As shown in Fig. 7 we find that galaxies with shorter depletion times host warmer dust. Our results are in agreement with the physically motivated prediction for the optically thin () case (Sommovigo et al., 2022a, b) when accounting for the metallicity variation within the sample.
If future ALMA dust continuum observations at shorter wavelengths will confirm the warmer suggested by the median values for UVISTA-Z-001 and UVISTA-Z-019 by Witstok et al. (2022), this might indicate that these galaxies are characterized by and thus a spatially segregated scenario between dust and UV emission. This can be further confirmed by high spatial resolution ALMA observations (tracing the dust obscured star formation) in conjunction with JWST (tracing the un-obscured one).
5 Summary
In this paper, we have used GLAM (Vallini et al., 2020, 2021) to derive the ISM properties (gas density, deviation from the KS relation, and gas metallicity) in five UV luminous LBGs at for which moderately resolved [C ] and [O ] observations are available. We have compared the pixel-by-pixel values for the ISM parameters with the global ones derived with the same methodology using instead average and surface brightness values. We confirm the conclusion by V21, namely that global values are biased towards the most luminous ISM regions. The main results from our spatially resolved analysis are the following:
-
•
The distribution of the gas density in the five LBGs is narrow and peaks in the range , depending on the source. The gas densities obtained are higher than typical values in local galaxies, hence suggesting an overall increase in the mean gas density in the ISM at early epochs.
-
•
We derived radial profiles for the metallicity, density and burstiness. In particular, the metallicity shows a mildly negative radial gradient that, within the uncertainties, is compatible with being flat.
-
•
All five galaxies lie above the KS relation by a factor of , in perfect agreement with expectations from cosmological zoom-in simulations (Pallottini et al., 2022) at the same redshift. The value is higher in the center. In some cases, we obtain a bimodal distribution in regions where dust continuum emission is detected, suggesting the presence of dense, dust-obscured, highly star-forming regions.
-
•
We predict that bursty galaxies with dense gas (such as UVISTA-Z-019) would be an ideal target for ALMA follow-ups in CO(6–5) as mid- CO lines trace warm/dense molecular gas.
-
•
The gas depletion times, derived from the KS relation, are in the range Myr. The of the five sources fall between that predicted by the extrapolation out to of for MS and SB galaxies of the Tacconi et al. (2020) relation.
-
•
The dust temperature of the five sources correlates with ., as predicted by theoretical models (Sommovigo et al., 2021) for an optically thin medium. We confirm that the redshift evolution of the dust temperature might be the imprint of a more efficient conversion of the gas into stars.
The work presented in this paper highlights the huge potential of the synergy between physically motivated line emission models and spatially resolved observations of [C ] and [O ] for constraining a wealth of ISM properties within galaxies in the Epoch of Reionization. Simply using a handful of observables – traced down to kpc scales – allows to determine the Kennicutt-Schmidt relation, metallicity profiles, and impact of gas accretion on the dust continuum properties. Further follow-ups at higher spatial resolution in a larger samples of sources already detected in [C ] will allow putting the results presented here on a statistically more robust basis.
Data Availability
GLAM can be accessed on Github at https://lvallini.github.io/MCMCgalaxylineanalyzer/. HST data underlying this article are available in the MAST archive at 10.17909/6gya-3b10 (GO 13793), 10.17909/T9-JHSFM392 (GO 16506) and from https://archive.stsci.edu/prepds/3d-hst/ (the 3D-HST Treasury Program). The ALMA data are available in the ALMA science archive at https://almascience.eso.org/asax/ under the following project codes: 2015.1.01111.S, 2018.1.01359.S, 2018.1.00429.S, 2018.1.01551.S, 2017.1.00604.S, 2015.1.00540.S, 2018.1.00085.S, 2018.1.00933.S, 2019.1.01611.S, 2019.1.01524.S, 2018.1.00085.S, 2019.1.01611.S.
Acknowledgments
LS, AF, MK acknowledge support from the ERC Advanced Grant INTERSTELLAR H2020/740120. JW acknowledges support by Fondation MERAC, the Science and Technology Facilities Council (STFC), by the ERC through Advanced Grant 695671, “QUENCH”, and by the UK Research and Innovation (UKRI) Frontier Research grant RISEandFALL. AP acknowledges the CINECA award under the ISCRA initiative, for the availability of high performance computing resources and support from the Class B project SERRA HP10BPUZ8F (PI: Pallottini). SC acknowledges support by the European Union (ERC Starting Grant, WINGS, 101040227). Views and opinions expressed are however those of the author(s) only and do not necessarily reflect those of the European Union or the European Research Council Executive Agency. Neither the European Union nor the granting authority can be held responsible for them. RS acknowledges an STFC Ernest Rutherford Fellowship (ST/S004831/1).
This work was based on observations taken by the Atacama Large Millimeter/submillimeter Array (ALMA). ALMA is a partnership of ESO (representing its member states), NSF (USA) and NINS (Japan), together with NRC (Canada), MOST and ASIAA (Taiwan), and KASI (Republic of Korea), in cooperation with the Republic of Chile. The Joint ALMA Observatory is operated by ESO, AUI/NRAO and NAOJ. This work was furthermore partially based on new observations made with the NASA/ESA Hubble Space Telescope (HST), obtained at the Space Telescope Science Institute (STScI), which is operated by the Association of Universities for Research in Astronomy, Inc., under NASA contract NAS 5-26555. HST archival data was obtained from the data archive at the STScI. STScI is operated by the Association of Universities for Research in Astronomy, Inc. under NASA contract NAS 5-26555. We gratefully acknowledge computational resources of the Center for High Performance Computing (CHPC) at SNS. This research made use of astropy (Astropy Collaboration et al., 2018), Matplotlib (Hunter, 2007), Seaborn (Waskom, 2021), Scipy (Virtanen et al., 2020), Numpy (Harris et al., 2020), and Photutils (Bradley et al., 2022), an Astropy package for detection and photometry of astronomical sources.
References
- Akins et al. (2022) Akins H. B., et al., 2022, ApJ, 934, 64
- Algera et al. (2023) Algera H., et al., 2023, arXiv e-prints, p. arXiv:2301.09659
- Arata et al. (2020) Arata S., Yajima H., Nagamine K., Abe M., Khochfar S., 2020, MNRAS, 498, 5541
- Asplund et al. (2009) Asplund M., Grevesse N., Sauval A. J., Scott P., 2009, ARA&A, 47, 481
- Astropy Collaboration et al. (2018) Astropy Collaboration et al., 2018, aj, 156, 123
- Bakx et al. (2020) Bakx T. J. L. C., et al., 2020, MNRAS, 493, 4294
- Behrens et al. (2018) Behrens C., Pallottini A., Ferrara A., Gallerani S., Vallini L., 2018, MNRAS, 477, 552
- Belfiore et al. (2017) Belfiore F., et al., 2017, MNRAS, 469, 151
- Béthermin et al. (2020) Béthermin M., et al., 2020, A&A, 643, A2
- Bolatto et al. (2013) Bolatto A. D., Wolfire M., Leroy A. K., 2013, ARA&A, 51, 207
- Bouwens et al. (2020) Bouwens R., et al., 2020, ApJ, 902, 112
- Bouwens et al. (2022) Bouwens R. J., et al., 2022, ApJ, 931, 160
- Bradley et al. (2022) Bradley L., et al., 2022, astropy/photutils: 1.5.0, doi:10.5281/zenodo.6825092, https://doi.org/10.5281/zenodo.6825092
- Carniani et al. (2020) Carniani S., et al., 2020, MNRAS, 499, 5136
- Carton et al. (2018) Carton D., et al., 2018, MNRAS, 478, 4293
- Ceverino et al. (2016) Ceverino D., Sánchez Almeida J., Muñoz Tuñón C., Dekel A., Elmegreen B. G., Elmegreen D. M., Primack J., 2016, MNRAS, 457, 2605
- Chen et al. (2017) Chen C.-C., et al., 2017, ApJ, 846, 108
- Cormier et al. (2019) Cormier D., et al., 2019, A&A, 626, A23
- Curti et al. (2020) Curti M., Mannucci F., Cresci G., Maiolino R., 2020, MNRAS, 491, 944
- Daddi et al. (2010) Daddi E., et al., 2010, ApJ, 714, L118
- Davies et al. (2021) Davies R. L., et al., 2021, ApJ, 909, 78
- Dayal & Ferrara (2018) Dayal P., Ferrara A., 2018, Phys. Rep., 780, 1
- Dessauges-Zavadsky et al. (2020) Dessauges-Zavadsky M., et al., 2020, A&A, 643, A5
- Di Cesare et al. (2023) Di Cesare C., Graziani L., Schneider R., Ginolfi M., Venditti A., Santini P., Hunt L. K., 2023, MNRAS, 519, 4632
- Ferland et al. (2017) Ferland G. J., et al., 2017, Rev. Mex. Astron. Astrofis., 53, 385
- Ferrara et al. (2019) Ferrara A., Vallini L., Pallottini A., Gallerani S., Carniani S., Kohandel M., Decataldo D., Behrens C., 2019, MNRAS, 489, 1
- Foreman-Mackey et al. (2013) Foreman-Mackey D., et al., 2013, emcee: The MCMC Hammer, Astrophysics Source Code Library (ascl:1303.002)
- Fujimoto et al. (2022) Fujimoto S., et al., 2022, arXiv e-prints, p. arXiv:2212.06863
- Gibson et al. (2013) Gibson B. K., Pilkington K., Brook C. B., Stinson G. S., Bailin J., 2013, A&A, 554, A47
- Gruppioni et al. (2020) Gruppioni C., et al., 2020, A&A, 643, A8
- Harikane et al. (2020) Harikane Y., et al., 2020, ApJ, 896, 93
- Harris et al. (2020) Harris C. R., et al., 2020, Nature, 585, 357–362
- Heiderman et al. (2010) Heiderman A., Evans II N. J., Allen L. E., Huard T., Heyer M., 2010, ApJ, 723, 1019
- Hemler et al. (2021) Hemler Z. S., et al., 2021, MNRAS, 506, 3024
- Herrera-Camus et al. (2022) Herrera-Camus R., et al., 2022, A&A, 665, L8
- Hodge et al. (2015) Hodge J. A., Riechers D., Decarli R., Walter F., Carilli C. L., Daddi E., Dannerbauer H., 2015, ApJ, 798, L18
- Hollenbach & Tielens (1999) Hollenbach D. J., Tielens A. G. G. M., 1999, RMP, 71, 173
- Hsiao et al. (2023) Hsiao T. Y.-Y., et al., 2023, arXiv e-prints, p. arXiv:2305.03042
- Hunter (2007) Hunter J. D., 2007, Computing in Science & Engineering, 9, 90
- Inami et al. (2022) Inami H., et al., 2022, MNRAS,
- Isobe et al. (2023) Isobe Y., Ouchi M., Nakajima K., Harikane Y., Ono Y., Xu Y., Zhang Y., Umeda H., 2023, arXiv e-prints, p. arXiv:2301.06811
- Jones et al. (2013) Jones T., Ellis R. S., Richard J., Jullo E., 2013, ApJ, 765, 48
- Jones et al. (2020) Jones T., Sanders R., Roberts-Borsani G., Ellis R. S., Laporte N., Treu T., Harikane Y., 2020, ApJ, 903, 150
- Katz et al. (2017) Katz H., Kimm T., Sijacki D., Haehnelt M. G., 2017, MNRAS, 468, 4831
- Katz et al. (2022) Katz H., et al., 2022, MNRAS, 510, 5603
- Kennicutt (1998) Kennicutt Robert C. J., 1998, ApJ, 498, 541
- Kennicutt & De Los Reyes (2021) Kennicutt Robert C. J., De Los Reyes M. A. C., 2021, ApJ, 908, 61
- Kennicutt & Evans (2012) Kennicutt R. C., Evans N. J., 2012, ARA&A, 50, 531
- Kewley et al. (2019) Kewley L. J., Nicholls D. C., Sutherland R., Rigby J. R., Acharya A., Dopita M. A., Bayliss M. B., 2019, ApJ, 880, 16
- Kohandel et al. (2020) Kohandel M., Pallottini A., Ferrara A., Carniani S., Gallerani S., Vallini L., Zanella A., Behrens C., 2020, MNRAS, 499, 1250
- Kohandel et al. (2023) Kohandel M., Ferrara A., Pallottini A., Vallini L., Sommovigo L., Ziparo F., 2023, MNRAS, 520, L16
- Lagache et al. (2018) Lagache G., Cousin M., Chatzikos M., 2018, A&A, 609, A130
- Laporte et al. (2017) Laporte N., Nakajima K., Ellis R. S., Zitrin A., Stark D. P., Mainali R., Roberts-Borsani G. W., 2017, ApJ, 851, 40
- Le Fèvre et al. (2020) Le Fèvre O., et al., 2020, A&A, 643, A1
- Liang et al. (2019) Liang L., et al., 2019, MNRAS, p. 2072
- Lucy (1974) Lucy L. B., 1974, AJ, 79, 745
- Ma et al. (2017) Ma X., Hopkins P. F., Feldmann R., Torrey P., Faucher-Giguère C.-A., Kereš D., 2017, MNRAS, 466, 4780
- Maiolino & Mannucci (2019) Maiolino R., Mannucci F., 2019, A&ARv, 27, 3
- Markov et al. (2022) Markov V., Carniani S., Vallini L., Ferrara A., Pallottini A., Maiolino R., Gallerani S., Pentericci L., 2022, A&A, 663, A172
- McMullin et al. (2007) McMullin J. P., Waters B., Schiebel D., Young W., Golap K., 2007, in Shaw R. A., Hill F., Bell D. J., eds, Astronomical Society of the Pacific Conference Series Vol. 376, Astronomical Data Analysis Software and Systems XVI. p. 127
- Molyneux et al. (2022) Molyneux S. J., et al., 2022, MNRAS, 512, 535
- Moriwaki et al. (2018) Moriwaki K., et al., 2018, MNRAS, 481, L84
- Nagy et al. (2023) Nagy D., Dessauges-Zavadsky M., Messa M., Richard J., Sun J., Combes F., Eyholzer Y., 2023, arXiv e-prints, p. arXiv:2307.07551
- Ono et al. (2022) Ono Y., et al., 2022, ApJ, 941, 74
- Palay et al. (2012) Palay E., Nahar S. N., Pradhan A. K., Eissner W., 2012, MNRAS, 423, L35
- Pallottini & Ferrara (2023) Pallottini A., Ferrara A., 2023, A&A, 677, L4
- Pallottini et al. (2017) Pallottini A., Ferrara A., Bovino S., Vallini L., Gallerani S., Maiolino R., Salvadori S., 2017, MNRAS, 471, 4128
- Pallottini et al. (2019) Pallottini A., et al., 2019, MNRAS, 487, 1689
- Pallottini et al. (2022) Pallottini A., et al., 2022, MNRAS, 513, 5621
- Pavesi et al. (2019) Pavesi R., Riechers D. A., Faisst A. L., Stacey G. J., Capak P. L., 2019, ApJ, 882, 168
- Posses et al. (2023) Posses A. C., et al., 2023, A&A, 669, A46
- Richardson (1972) Richardson W. H., 1972, Journal of the Optical Society of America (1917-1983), 62, 55
- Robertson (2022) Robertson B. E., 2022, ARA&A, 60, 121
- Rupke et al. (2010) Rupke D. S. N., Kewley L. J., Barnes J. E., 2010, ApJ, 710, L156
- Sánchez Almeida et al. (2014) Sánchez Almeida J., Elmegreen B. G., Muñoz-Tuñón C., Elmegreen D. M., 2014, A&ARv, 22, 71
- Schmidt (1959) Schmidt M., 1959, ApJ, 129, 243
- Schreiber et al. (2018) Schreiber C., Elbaz D., Pannella M., Ciesla L., Wang T., Franco M., 2018, A&A, 609, A30
- Sharda et al. (2021) Sharda P., Krumholz M. R., Wisnioski E., Forbes J. C., Federrath C., Acharyya A., 2021, MNRAS, 502, 5935
- Smit et al. (2018) Smit R., et al., 2018, Nature, 553, 178
- Sommovigo et al. (2020) Sommovigo L., Ferrara A., Pallottini A., Carniani S., Gallerani S., Decataldo D., 2020, MNRAS, 497, 956
- Sommovigo et al. (2021) Sommovigo L., Ferrara A., Carniani S., Zanella A., Pallottini A., Gallerani S., Vallini L., 2021, MNRAS, 503, 4878
- Sommovigo et al. (2022a) Sommovigo L., et al., 2022a, MNRAS, 513, 3122
- Sommovigo et al. (2022b) Sommovigo L., et al., 2022b, MNRAS, 517, 5930
- Stanghellini & Haywood (2010) Stanghellini L., Haywood M., 2010, ApJ, 714, 1096
- Stanghellini & Haywood (2018) Stanghellini L., Haywood M., 2018, ApJ, 862, 45
- Sugahara et al. (2022) Sugahara Y., Inoue A. K., Fudamoto Y., Hashimoto T., Harikane Y., Yamanaka S., 2022, ApJ, 935, 119
- Tacconi et al. (2013) Tacconi L. J., et al., 2013, ApJ, 768, 74
- Tacconi et al. (2020) Tacconi L. J., Genzel R., Sternberg A., 2020, ARA&A, 58, 157
- Tamura et al. (2019) Tamura Y., et al., 2019, ApJ, 874, 27
- Tissera et al. (2022) Tissera P. B., Rosas-Guevara Y., Sillero E., Pedrosa S. E., Theuns T., Bignone L., 2022, MNRAS, 511, 1667
- Vallini et al. (2015) Vallini L., Gallerani S., Ferrara A., Pallottini A., Yue B., 2015, ApJ, 813, 36
- Vallini et al. (2018) Vallini L., Pallottini A., Ferrara A., Gallerani S., Sobacchi E., Behrens C., 2018, MNRAS, 473, 271
- Vallini et al. (2020) Vallini L., Ferrara A., Pallottini A., Carniani S., Gallerani S., 2020, MNRAS, 495, L22
- Vallini et al. (2021) Vallini L., Ferrara A., Pallottini A., Carniani S., Gallerani S., 2021, MNRAS, 505, 5543
- Viero et al. (2022) Viero M. P., Sun G., Chung D. T., Moncelsi L., Condon S. S., 2022, MNRAS, 516, L30
- Virtanen et al. (2020) Virtanen P., et al., 2020, Nature Methods, 17, 261
- Wang et al. (2022) Wang X., et al., 2022, ApJ, 938, L16
- Waskom (2021) Waskom M. L., 2021, Journal of Open Source Software, 6, 3021
- Witstok et al. (2022) Witstok J., et al., 2022, MNRAS, 515, 1751
- Wolfire et al. (2010) Wolfire M. G., Hollenbach D., McKee C. F., 2010, ApJ, 716, 1191
- Wolfire et al. (2022) Wolfire M. G., Vallini L., Chevance M., 2022, ARA&A, 60, 247
- Wuyts et al. (2016) Wuyts E., et al., 2016, ApJ, 827, 74
- Yang & Lidz (2020) Yang S., Lidz A., 2020, MNRAS, 499, 3417
- Zanella et al. (2018) Zanella A., et al., 2018, MNRAS, 481, 1976
- da Cunha et al. (2013) da Cunha E., et al., 2013, ApJ, 766, 13
- de los Reyes & Kennicutt (2019) de los Reyes M., Kennicutt Robert C. J., 2019, ApJ, 872, 16
Appendix A Error maps
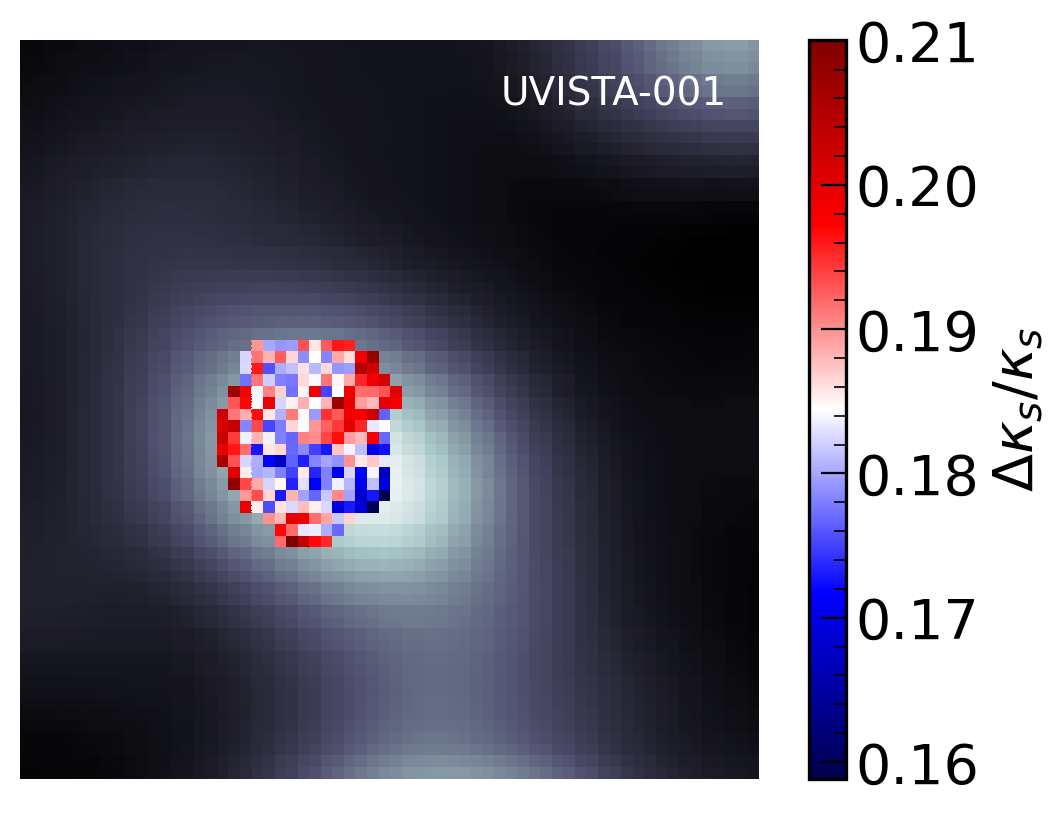
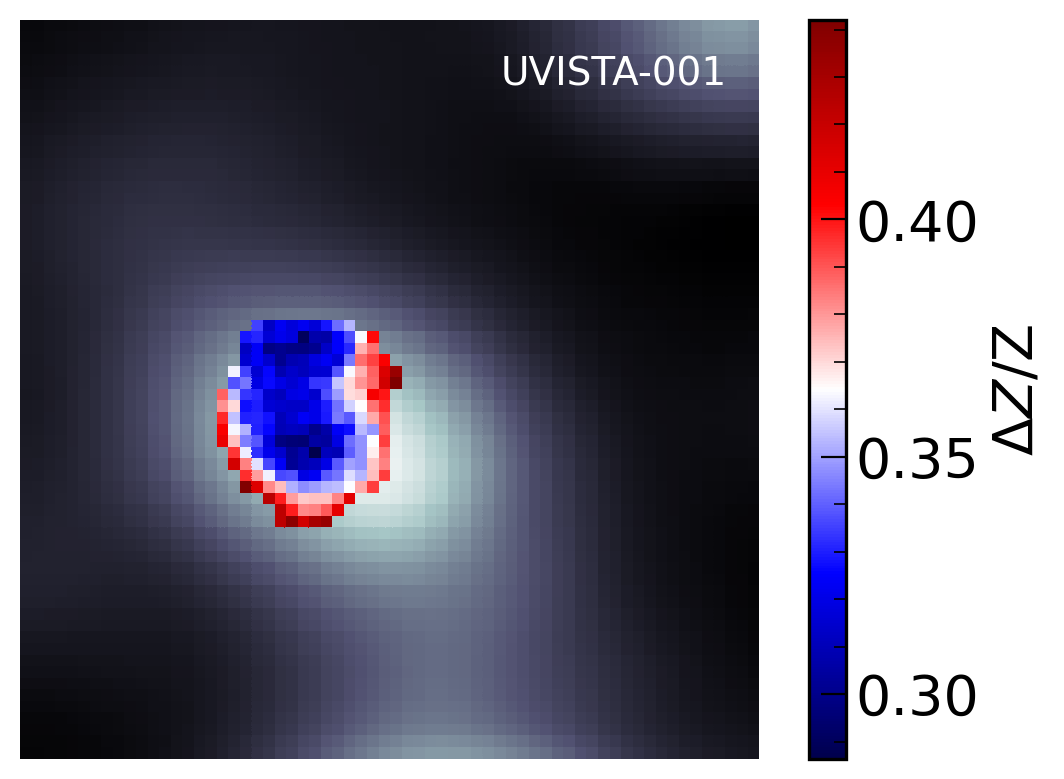
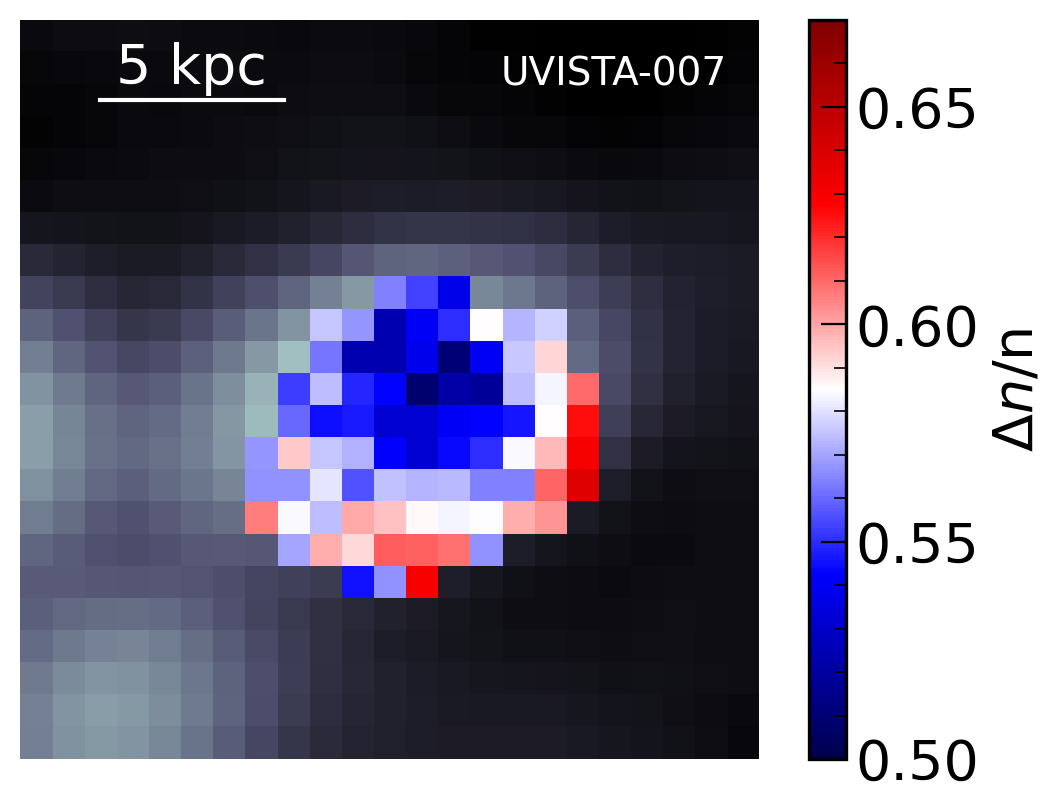
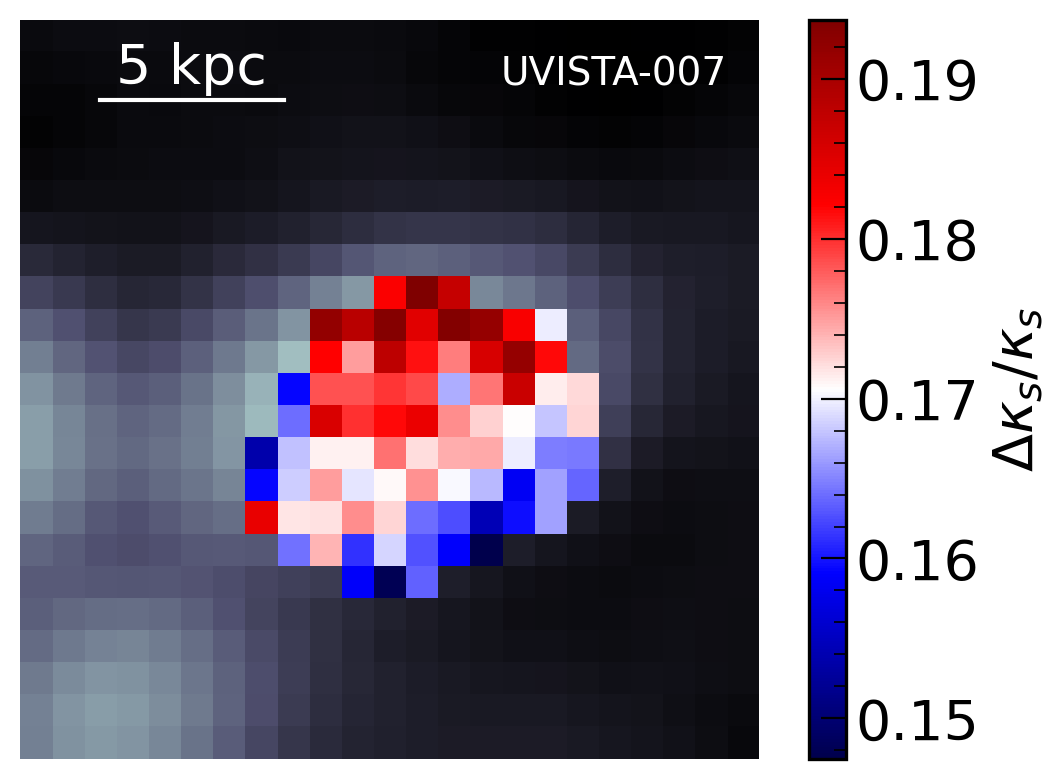
In Figure 8 we report the relative errors on the parameters derived with GLAM on pixel by pixel basis. The error on gas density ranges between 30% – 50% depending on the source. The burstiness parameter is the ISM property that is better constrained, with errors ranging between 15%–20%. Finally, the metallicity errors range between 25% – 50%. \colorblack We note that while the errors for the gas density and metallicity are lower in the central regions for all the galaxies, the trend is the opposite for in UVISTA-Z-007 and UVISTA-Z-019, where the parameter is less constrained in the center. The uncertainties on (, , ) are influenced by the signal to noise ratio (SNR) of the inputs (, and ), which is higher in the center where the emission is brighter. However, this is not the only aspect influencing the uncertainty on the parameters derived from the MCMC. In fact, the analytical functions describing the [C ] and [O ] fluxes are both characterized by a plateau in the flux at large (see F19), which makes the model more degenerate. For this reason there are regimes in which, the central part of the sources being characterized by large , the GLAM parameters end up being less precisely constrained albeit the SNR of the input data is higher. Improving the precision on the SFR tracers, with better rest-frame UV and IR data, can help in alleviating this issue.
Appendix B Density and burstiness gradients
We computed the gradient for the gas density and the burstiness parameter in the same way discussed for the metallicity ones. The results for our five sources are shown in Figure 9. We note that, while the density profile is consistent with being flat (the median gradient among the five galaxies in our sample is dex/kpc), the burstiness parameter shows a steeper decrease (median dex/kpc).