Nuclear Recoil Identification in a Scientific Charge-Coupled Device
Abstract
Charge-coupled devices (CCDs) are a leading technology in direct searches for dark matter because of their eV-scale energy threshold and m-scale spatial resolution. The sensitivity of future CCD experiments could be enhanced by distinguishing nuclear recoil signals from electronic recoil backgrounds in the CCD silicon target. We present a technique for event-by-event identification of nuclear recoils based on the spatial correlation between the primary ionization event and the defect cluster left behind by the recoiling atom, later identified as a localized excess of leakage current under thermal stimulation. By irradiating a CCD with an 241Am9Be neutron source, we demonstrate % identification efficiency for nuclear recoils with energies keV, where the coincident ionization events were confirmed to be nuclear recoils due to their topology. The technique remains fully efficient down to 90 keV, decreasing to 50% at 8 keV, and reaching ()% at 1.5–3.5 keV. Irradiation with a 24Na -ray source does not result in any detectable defect clusters, with the fraction of electronic recoils with energies keV that are spatially correlated with defects %.
I Introduction
The detection of interactions of weakly interacting particles with atomic nuclei provides a means to search for the weakly interacting massive particles (WIMPs) that may constitute the universe’s dark matter Akerib et al. (2022) and to measure coherent elastic neutrino-nucleus scattering (CENS) Abdullah et al. (2022). The experiments developed for this purpose use an instrumented target to distinguish the signal of a recoiling atom from backgrounds due to environmental radiation, which are mostly electronic recoils from radioactive decays in the target and from the interactions of external rays. Therefore, discrimination between nuclear and electronic recoils at low energies is a powerful technique of background suppression. Various realizations of nuclear/electronic recoil discrimination have been demonstrated in several targets, including noble liquids Agnes et al. (2018); Aalbers et al. (2023) and cryogenic calorimeters Armengaud et al. (2016); Agnese et al. (2018); Abdelhameed et al. (2019).
Silicon charge-coupled devices (CCDs) are some of the most sensitive ionization sensors Holland et al. (2003); *Tiffenberg:2017aac but so far have lacked the capability to discriminate between nuclear and electronic recoils. Nevertheless, the DAMIC detector—a CCD array operating in a low-background environment deep underground—performed a highly sensitive search for low-mass WIMPs that was competitive because of the low energy threshold of the detector Aguilar-Arevalo et al. (2020). Detectors based on CCDs have been successfully deployed at a short baseline from nuclear reactors to search for CENS Fernandez Moroni et al. (2015); *CONNIE:2021ggh, although they have yet to reach the sensitivity required for a positive detection. The potential of CCDs in the search of CENS at the European Spallation Neutron Source has also been noted Baxter et al. (2020). In all these cases, electronic-recoil backgrounds remain a significant limitation for CCD experiments.
In this paper, we demonstrate for the first time event-by-event identification of nuclear recoils in a CCD by making use of the spatial correlation of the primary ionization event with the cluster of defects generated in the silicon lattice by the recoiling atom that is later identified by thermal stimulation. This work builds on previous studies of neutron interactions with silicon indicating the potential for using crystal defects as a method for detecting the nuclear recoils from dark matter interactions Lee (2023a); *Steven-thesis. Since low-energy electronic recoils do not generate measurable clusters of defects, this strategy can effectively be employed for nuclear/electronic recoil discrimination in CCD experiments.
II Methodology
Charge-coupled devices are pixelated sensors with a fully depleted active silicon volume. Free charges generated in the active volume by ionizing particles are drifted by the electric field and collected on the pixel array. Since charges diffuse laterally as they drift, energy depositions that occur deeper into the CCD volume result in more diffuse patterns of charge on the pixel array. After a user-defined exposure time, the pixel array is read out to generate an image, where each pixel value above the image pedestal is proportional to the charge collected by the pixel during the exposure. The images are analyzed to identify clusters of pixels with charge. Low-energy recoils, for which the track length is much shorter than the pixel size, result in two-dimensional Gaussian clusters, whose integral is proportional to the energy of the event, whose spread is positively correlated with the depth () of the interaction, and whose mean corresponds to the coordinates of the interaction. To minimize noise from leakage current across the biased device, CCDs are typically operated at low temperatures (from 100 K to 150 K) when recording ionization events.
In addition to the primary ionization event, a nuclear recoil induced by a neutron (or weakly interacting particle) will produce a cluster of crystal defects in the silicon lattice by dislocating atoms along its path until it stops Nordlund et al. (1998); Fretwurst et al. (2002); Srour et al. (2003); Sassi et al. (2022). Electrons with energies above keV can dislocate single atoms to produce point defects Fretwurst et al. (2002). For clarity, we make no distinction and refer to the clusters of defects that we detect simply as “defects” to distinguish them from “clusters,” which refer to contiguous pixels with charge observed in a CCD image. Defects become stable within picoseconds and are small relative to the CCD pixel size. Defects in the silicon lattice distort the local band gap structure, resulting in intermediate energy states that give rise to excess leakage current. The current emanating from defects is typically too small at low temperatures for the defects to be visible. At higher temperatures, the leakage current from defects increases rapidly and can result in visible clusters above the shot noise due to the uniform leakage current across the device. As is similar for ionization events, defects are measured as two-dimensional Gaussian clusters, whose integral is the total charge from the leakage current integrated over the exposure time. Thus, bulk defects and their location in the CCD volume may be identified in images acquired at warm temperatures (e.g., 220 K).
In this study, we first acquired images with a CCD at warm temperatures to identify existing defects. We then lowered the temperature of the CCD and proceeded with a series of cold images acquired while the CCD was irradiated with a neutron source to identify the ionization signals from nuclear recoils. Finally, the temperature was increased back to the original value for a second series of warm images to identify the defects generated during the irradiation. The data were analyzed to search for correlations in the coordinates between ionization clusters in the irradiated images and clusters from defects that appeared following the irradiation. The experiment was repeated with a 24Na -ray source to characterize backgrounds due to electronic recoils and confirm that these recoils do not generate visible defects and a third time without any source to characterize the effect of environmental backgrounds.
In Section III, we provide the details of the experimental setup and the acquired warm and cold data. In Section IV, we describe how we use the warm images to identify the defects generated during irradiation. In Section V, we describe how we reconstruct the energy spectrum of nuclear recoils induced in the CCD by neutrons from the 241Am9Be source. We first reconstruct the high-energy part of the spectrum by selecting nuclear-recoil clusters based on their topology (Sec. V.1) and then extrapolate toward lower energies by subtracting the expected electronic-recoil backgrounds from the 241Am9Be source (Sec. V.2). In Section VI, we present the results from the search for spatial correlations between clusters from ionization events in the cold data and clusters from defects in the warm data, where we demonstrate that only nuclear-recoil ionization events from the 241Am9Be source show a statistically significant correlation with defects. Finally, in Section VII, we divide the measured spectrum of ionization events from the 241Am9Be source that are spatially correlated with defects by the reconstructed total spectrum of nuclear recoils to obtain the fraction of nuclear recoils that generate visible defects as a function of energy.
III Experimental Setup and Data Sets
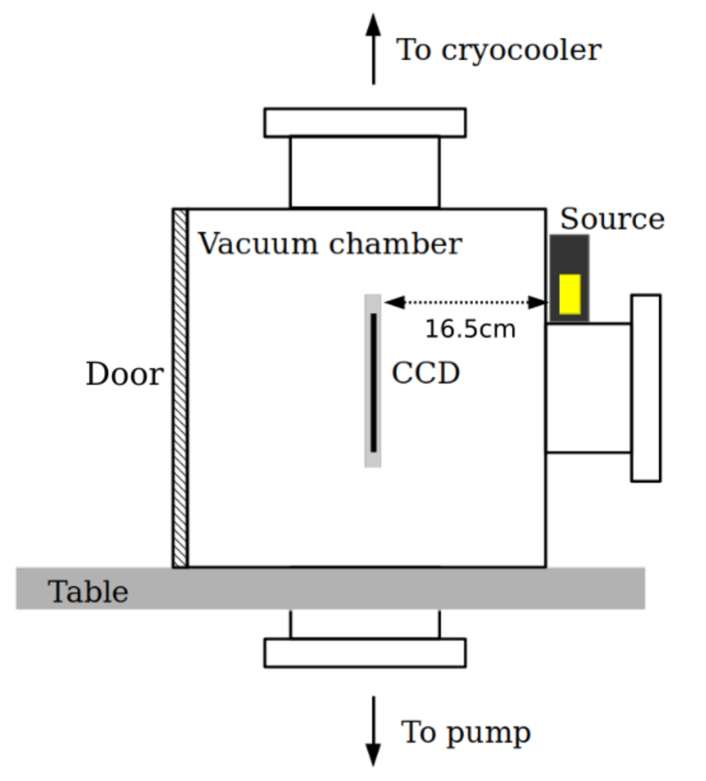
All data were acquired in a surface laboratory on the University of Washington campus in Seattle. The 24-megapixel CCD ( pixels, m2 pixel size, 670 m thick) was developed by Lawrence Berkeley National Laboratory MicroSystems Lab for the DAMIC-M dark matter direct detection experiment Arnquist et al. (2023a). The CCD was installed in a stainless steel vacuum chamber where it was operated at temperatures ranging from 147 K to 223 K at a pressure millibar. A 111 MBq 241Am9Be neutron source (mean neutron energy 4.2 MeV; neutron rate 7400 s-1) was used to generate nuclear recoils in the bulk silicon of the CCD. To attenuate the fluence of 4.44 MeV rays from the 241Am9Be source and to allow for easy removal of the source during CCD readout, the source was enclosed in a lead vial with a thickness of 6 mm and positioned outside the vacuum chamber, as shown in Fig. 1.
To minimize charge diffusion and thus enhance sensitivity to low-energy recoils and defects, the CCD was operated at a substrate bias of 100 V. The CCD was read out by clocking charge row-wise into the horizontal register, where the charge was clocked pixel by pixel to two charge-to-voltage amplifiers located at opposite ends of the horizontal register for charge measurement. The CCD can be operated in skipper mode, whereby multiple non-destructive charge measurements (NDCMs) of a single pixel are performed, suppressing the readout noise averaged over measurements, , by . We used a commercial CCD controller from Astronomical Research Cameras, Inc., to supply the clocks and biases and to measure the pixel values with a noise for a single measurement of 6 . The calibration constant to convert raw pixel values to number of electrons was obtained for each amplifier from an image readout with , where the readout noise = 0.23 e- was sufficiently low to identify discrete peaks for the charge in the pixels Norcini et al. (2022). The calibration constant was found to be stable within 2 throughout data taking.
Images were acquired in dedicated data sets at two different temperatures, the details of which are given in Table 1. Each CCD image was exposed for 20 minutes, during which time the clocks were held fixed, followed by readout. First, a series of 31 high-temperature, “pre-irradiation” images were taken at K with a single measurement per pixel, resulting in a readout time of 4 minutes. The CCD was then cooled at a rate of 0.3 K/min to K, and 10 images were acquired with the 241Am9Be source in place. To reduce readout noise, the CCD was operated in skipper mode, with , resulting in a pixel noise 2 and a readout time of 28.7 minutes per image. Particles incident on the CCD during readout will continue to generate ionization events that appear in the image at locations different from the point of interaction in the CCD. To preserve the spatial correlation between nuclear recoil events as they appear in an image and their physical location on the CCD, the 241Am9Be source was removed and shielded during each readout. The CCD was then warmed to K at a rate of 0.5 K/min and a second set of 31 “post-irradiation” images was acquired, after which the CCD was brought to room temperature. The experiment was repeated a second time with a 3.7 kBq 24Na -ray source (energies 1.37 MeV, 2.75 MeV) in place of the 241Am9Be and a third time with no source to characterize environmental backgrounds.
All images consist of 6400 columns and 2000 rows, with each amplifier reading 3200 pixels in the horizontal direction, including 128 past the end of the physical pixel array. These 128 columns are referred to as the “overscan” and correspond to measurements of empty pixels that we use to evaluate the readout noise. We read only 2000 out of the 4128 physical rows of the CCD since we found the top half of a full CCD image to be overpopulated with tracks from environmental background, which leads to a higher probability of pile-up that can distort event reconstruction. To remove the charge left over after this partial readout, the full CCD pixel array was cleared of charge before beginning a new image by rapidly clocking the charge toward the amplifiers and dumping it without measurement. The background leakage charge, which is the average number of electrons per pixel accumulated from the leakage current during exposure and readout, is measured by taking the difference between the average pixel value in a background region of the pixel array with no ionization events and the overscan. The background noise in the images, , has contributions from both the pixel readout noise, , and statistical fluctuations in the pixel values from background leakage charge, which is dominant in the data acquired at higher temperatures and does not decrease with increasing number of NDCMs.
| ID | No. images | NDCMs | ||
|---|---|---|---|---|
| (e-) | ||||
| 241Am9Be | 10 | 10 | 1.82 | |
| 24Na | 10 | 10 | 1.61 | |
| bkgd | 10 | 10 | 1.61 | |
| ID | No. images | NDCMs | Leakage charge | |
| (e-) | (e-) | |||
| pre-241Am9Be | 31 | 1 | 19813 | 1690290 |
| post-241Am9Be | 31 | 1 | 19211 | 1672295 |
| 241Am9Be diff | 1 | – | 181 | – |
| pre-24Na | 31 | 1 | 14011 | 1621181 |
| post-24Na | 31 | 1 | 1419 | 1710195 |
| 24Na diff | 1 | – | 241 | – |
| pre-bkgd | 31 | 1 | 1396 | 1686186 |
| post-bkgd | 31 | 1 | 1443 | 1718193 |
| bkgd diff | 1 | – | 261 | – |
IV Defect Identification
We used the pre- and post-irradiation warm images to identify defects generated during irradiation. Since defects appear at the same location across many images, they are most readily identified in the “median image,” where each pixel value is the median of the given pixel over all images in the data set. Ionization events, which appear only in a single image, are effectively filtered out from the median image. Defects can originate during fabrication or may arise over the lifetime of the CCD. They may be stable over time or may disappear after temperature-cycling (annealing) the CCD to room temperature. Some prominent, stable defects have enough charge to overcome potential barriers when the charge is shifted during readout, causing vertical streaks (”hot columns”), which can interfere with cluster identification. To exclude image regions affected by such defects, we generated a list of pixels, referred to as a “mask,” from the median images of the pre- and post-irradiation data sets, with a separate mask applied to each of the three experiments. The masks include regions where the pixel value exceeds by 3 the pedestal value in both median images. Pixels on the edges of the image with coordinates 10 or and or were also masked to exclude noise and baseline transients at the beginning of image readout and after row shifts.
To identify defects that appear during the irradiation of the CCD, we generated a “difference image” where each pixel is the difference between the post- and pre-irradiation median images, taken at 223 K, in each of the three experiments. Table 1 summarizes the images used in this analysis. Note the much lower in the median difference image compared with the individual warm images, which results in significant improvement in the sensitivity to defects. Leakage current in the CCD scales exponentially with temperature and is very sensitive at warm temperatures to slight variations. To account for this, the temperature of the pre- and post-irradiation images was fine-tuned about the nominal value of 223K so that the background leakage charge was as close as possible between the two data sets so that it could be accurately subtracted.
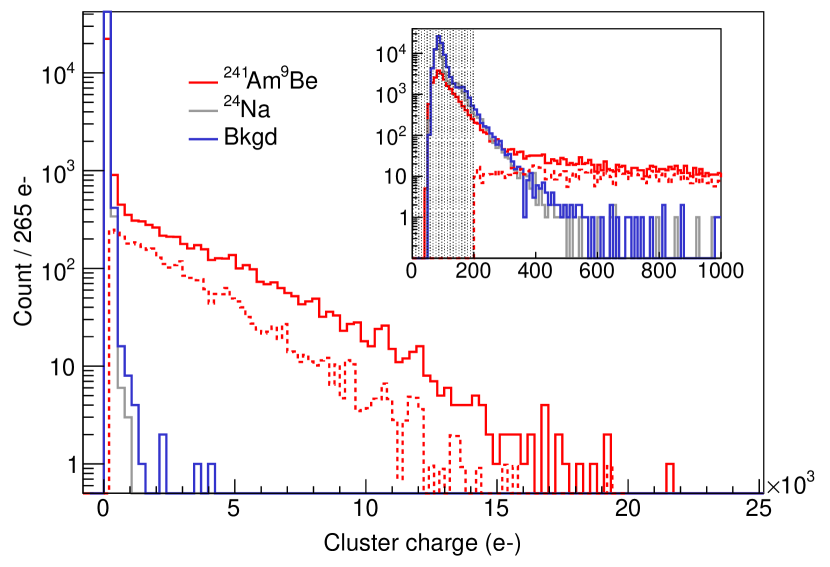
Candidate defects in the median difference image were identified by running a clustering algorithm that groups adjacent pixels of charge if at least one pixel has charge 80 e- (4). The total charge of the candidate was evaluated by summing the charge of the pixels in the cluster, while the cluster position was estimated as the charge-weighted mean of the coordinates of the pixels. We consider candidate defects to be all clusters with total charge 200 e-, as shown in Fig. 2. This selection was chosen to accept as many defects as possible while keeping the percentage of accidental spatial coincidences with noise clusters at a level of 5 in the 241Am9Be data. Clusters directly adjacent to a masked pixel were omitted from the analysis. Following this approach we identified 6777 candidate defects after 241Am9Be irradiation, 1570 candidates after 24Na irradiation, and 1879 candidates with no source (background). The total number of selected clusters in the 24Na data and background data is dominated by noise (Fig. 2), with fewer clusters in the 24Na data because of the slightly lower noise (Table 1). Therefore, there is no evidence of defect generation by the 24Na irradiation, while there are 5000 visible defects above noise that appear following 241Am9Be irradiation.
V Nuclear Recoil Ionization Spectrum
Cold images were processed by first averaging over all NDCMs of every pixel and then subtracting the pedestal, representing the analog-to-digital (ADC) value of the background pixels. The pedestal was calculated separately for each column segment of 1000 consecutive pixels by fitting to a Gaussian function the most prominent peak in the pixel-value distribution. The mean value from the fit was then subtracted from each pixel in the column segment and the process was repeated for row segments of 800 consecutive pixels.
Ionization events in the cold images may be produced by neutrons and rays from the radioactive sources and from environmental backgrounds. We identify ionization events in the cold (147 K) images as contiguous pixels each with value . We exclude from the analysis any cluster directly adjacent to a masked pixel. There is an upper limit on the size of a charge packet that can be efficiently transferred to the readout stage and its value measured repeatedly without charge loss. By comparing the first and second out of 10 NDCMs for each pixel in an image and noting where the difference exceeded the readout noise, we determined saturation to occur at 553080 e- for one amplifier and 5250125 e- for the other. Since saturation affects the reconstruction of the energy and topology of the cluster, any cluster containing at least one pixel above 5070 e- (19 keVee) was omitted from the analysis. The total charge of every cluster was estimated by summing over the pixel values. We also evaluated the charge-weighted mean and variance of the pixel coordinates to obtain the cluster location in the image and the spread of the cluster, respectively.
The total charge of the event was converted to deposited energy (in “electron-equivalent” units) by considering that an electronic recoil ionizes on average one electron-hole pair for every 3.8 eV of energy deposited Ramanathan and Kurinsky (2020). The corresponding nuclear-recoil energy was obtained from the electron-equivalent values using the Lindhard model for energies above 3 keVee Lindhard et al. (1963); *Chagani:2008in. For energies below this, the conversion was obtained using the parameterization in Ref. Agnese et al. (2017). To determine our sensitivity to low-energy events in our data, we simulated point-like events distributed uniformly in the CCD volume and introduced them on top of noise-only “blank” images. To relate the depth of the interaction with the simulated , we used the diffusion model outlined in Ref. Aguilar-Arevalo et al. (2016), with parameters found using muon tracks acquired with a similar 24-megapixel CCD and scaled for our substrate bias of 100 V. By running our clustering algorithm on the simulated images, we obtain a clustering efficiency 99 and accurate energy reconstruction down to 0.2 keVee.
V.1 Identification by Topology
Atoms recoiling after scattering with neutrons from the 241Am9Be source have track lengths smaller than the pixel size, and the ionization events can be considered to be point-like, while recoiling electrons are only point-like for energies below 85 keVee, below the threshold for a recoiling electron to generate a defect. Above this energy, electronic recoils have extended tracks of irregular shape that can be easily distinguished from nuclear recoils by cluster topology alone, thereby allowing us to select a clean sample of nuclear recoils to construct the energy spectrum.
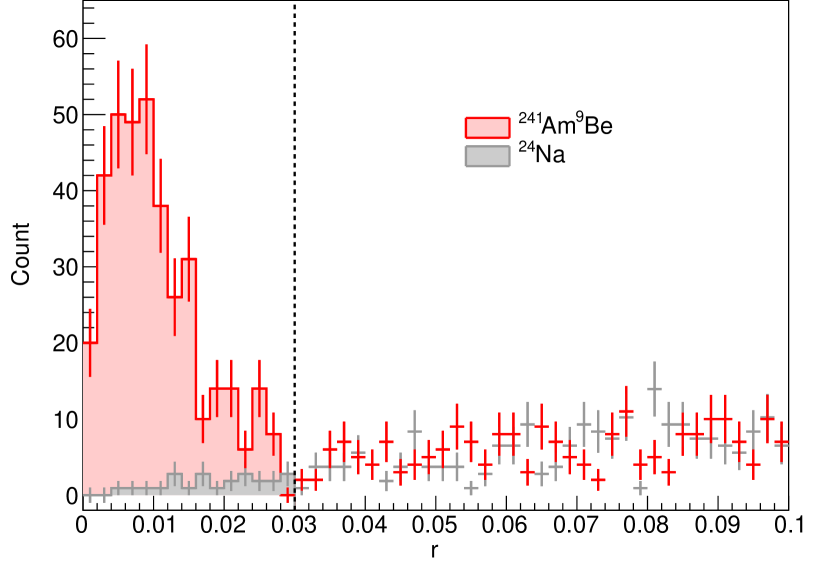
The characteristic symmetry of nuclear recoil clusters can be parameterized by the ratio of the spread of charge in the vertical and horizontal directions, , which is expected to be unity, and the Pearson correlation coefficient between the and coordinates of the pixels, , which is expected to be zero. We define a single selection parameter and classify events as high-energy nuclear recoils if for 85 eVee (150 keVnr) . This selection criterion was chosen by comparing clusters in the 241Am9Be and background-only data sets and selecting a region in space containing an excess of events in the 241Am9Be data. Using this method we identified 374 high-energy nuclear recoils in the 241Am9Be data set. Figure 3 shows the distribution of for high-energy ionization clusters in the 241Am9Be and 24Na data sets, where the 24Na spectrum was scaled such that its integral for matches the integral of the 241Am9Be spectrum in this region.
From the comparison between the 241Am9Be and scaled 24Na histograms, we conclude that % of selected events in the 241Am9Be data are electronic recoils. The dark blue histogram in Fig. 4 shows the high-energy spectrum of nuclear recoils from the 241Am9Be source identified by cluster topology, where the estimated leakage from electronic recoils that pass the selection, approximated with the spectrum of those found in the 24Na data, was subtracted.
V.2 Extrapolation to Low Energies
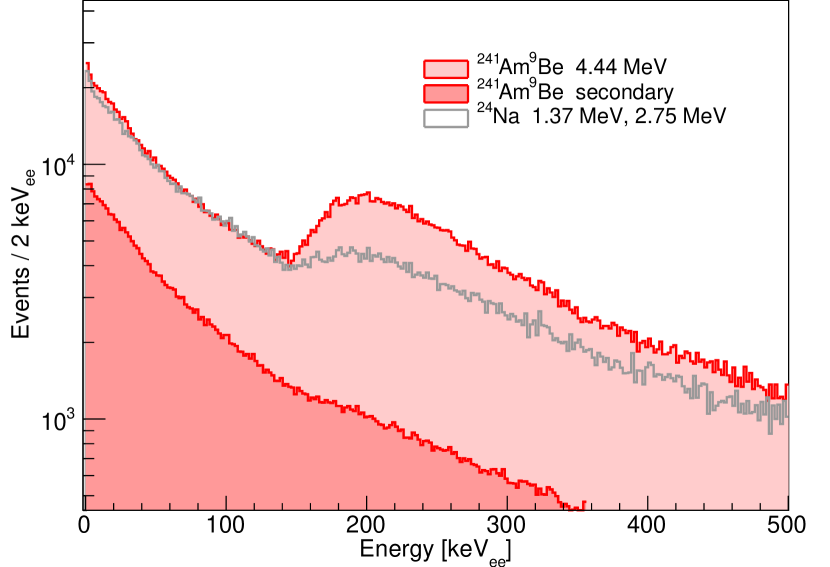
To determine the nuclear-recoil spectrum below 85 keVee, we subtract the contribution of electronic recoils from the 241Am9Be source and from environmental background from the spectrum of all clusters in the 241Am9Be data. Electronic recoils from the 241Am9Be source are dominated by the primary 4438 keV rays emitted by the deexcitation of 12C ∗ following 58% of reactions. Secondary rays from the inelastic scattering of fast neutrons from the source and from the capture of thermal neutrons with nuclei in the setup may also produce electronic recoils.
To estimate the contribution from rays to the spectrum, we simulated with Geant4 Agostinelli et al. (2003) primary neutrons and rays radiated by the 241Am9Be and 24Na sources and propagated them through a model of our experimental setup, including the detailed geometry and material composition. The neutron and ray spectra for the 241Am9Be and 24Na sources were obtained from Ref. Kluge and Weise (1982); *Duke:2015wga and Basunia and Chakraborty (2022), respectively. Within Geant version 4.10.04, the Livermore low-energy electromagnetic models were used to control the electron and -ray transport and interactions. The low-energy Neutron High Precision (HP) package was used for neutron transport, scattering, and capture. Our Geant4 simulation shows that the electronic-recoil spectrum from primary and secondary rays from the 241Am9Be source is very similar to the spectrum from 24Na below 140 keVee, with a maximum difference of 10% (Fig. 5). Therefore, we use the measured spectrum from 24Na as a model of the electronic-recoil background from the 241Am9Be source below 140 keVee and consider the systematic uncertainty from this choice in Sec. VII. Using the data 24Na spectrum accounts for detector effects (e.g., noise, cluster reconstruction, cluster selection, etc.) and inaccuracies in the simulation that equally affect rays from the 241Am9Be and 24Na radioactive sources.
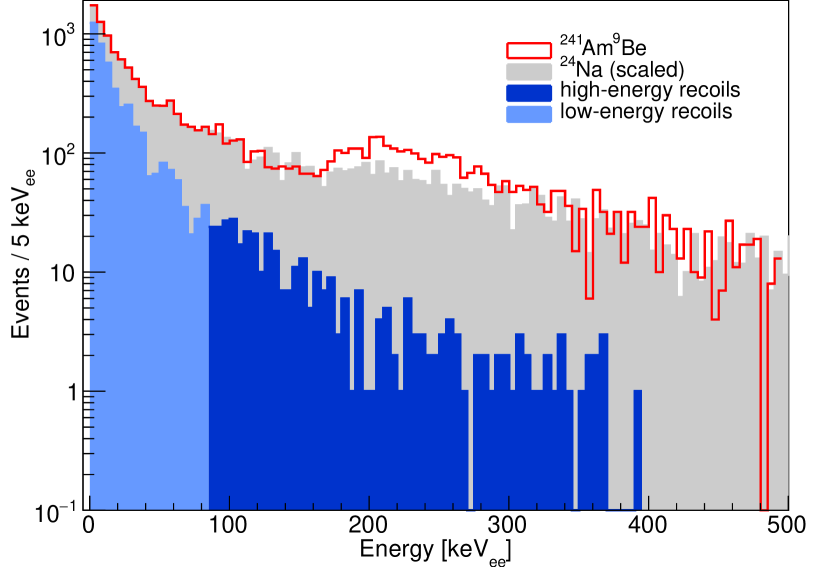
Figure 4 shows the measured ionization spectrum from the 241Am9Be source and the reconstructed spectrum obtained by adding the electronic-recoil spectrum from the 24Na source to the nuclear-recoil spectrum. The environmental background was subtracted from both the 241Am9Be and 24Na spectra. The 24Na spectrum was scaled in amplitude so that the addition of the 24Na spectrum to the high-energy nuclear recoils identified by topology matches the total 241Am9Be spectrum in the range 85 keVee 140 keVee. We take the difference between the scaled 24Na spectrum and the total 241Am9Be spectrum as the spectrum of nuclear recoils below 85 keVee down to our 0.2 keVee threshold (light blue histogram in Fig. 4).
VI Coincidence Search
To correlate ionization events with defects, we performed a simple coincidence search by comparing the coordinates of each ionization cluster selected in the cold data to that of all defect clusters above threshold in the corresponding warm data, requiring that the two locations fall within one pixel width apart. To estimate the number of events that accidentally coincide with a defect, we performed the same coincidence search after replacing the coordinates of every defect with a random position in the unmasked region of the CCD. Table 2 shows the number of coincidences and the expected accidentals in each of the three experiments with the different source configurations. Only the irradiation with the 241Am9Be source shows a statistically significant number of spatial correlations, with an upper limit on the number of coincidences above accidentals in the 24Na data of (95% C.L.). Considering that there are ionization events with keVee in the 24Na data, this corresponds to a fraction of point-like electronic recoils that are spatially correlated with a visible defect , consistent with the expected absence of defects in this energy range Fretwurst et al. (2002).
From this we conclude that the defects that arose during the 241Am9Be irradiation were caused by nuclear recoils, with negligible contribution from electronic recoils.
| ID | Defects | Coincidences | Accidentals | |
|---|---|---|---|---|
| bkgd | 1879 | 22 | 28 | |
| 241Am9Be | 6777 | 3580 | 168 | |
| 24Na | 1570 | 44 | 40 |
Of the 5000 defects above threshold that appear following 241Am9Be irradiation, 3580 coincide with selected ionization events. Another 969 coincide with an ionization event that contains at least one saturated pixel or is directly adjacent to a masked pixel and was already excluded from the analysis. By simulating nuclear recoil events on top of images from the 241Am9Be irradiation, we estimate that an additional 13 of defects (650) do not coincide with an ionization event because the ionization event overlaps with another event (pile-up).
To confirm that correlated events are not missed because the distance requirement between cluster centers is too small, we increased it to 2 pixels, which resulted in 3400 coincidences above accidentals, consistent with the result in Table 2.
Of the 3580 coincidences, 435 coincide with a selected ionization event with keVee, with 71 accidentals. Of these events, 338 were identified as nuclear recoils by cluster topology. We visually inspected the coincident high-energy ionization events that are not identified as nuclear recoils by topology and conclude that 14 are likely misidentified because of pile-up with a low-energy event that distorts the cluster topology but does not significantly displace the mean position of the cluster. Another 5 resemble nuclear recoils that just barely fall outside our selection criteria, with a cluster value 0.04. This leaves 78 coincidences that are not nuclear recoils based on topology, consistent with the 71 accidentals. Conversely, of the 374 total ionization events identified as nuclear recoils by topology, 36 of them do not coincide with a defect, consistent with the electronic recoils that we expect to be misidentified as nuclear recoils.
Finally, we confirm that the coinciding ionization events are evenly distributed throughout the cold images. The 241Am9Be data were acquired continuously except for a four-hour break between the fourth and fifth (out of 10) images. The number of coincidences above accidentals per image was for the first four and for the last six images, which suggests that defects remain stable for at least the 12 hours that the CCD temperature was kept at 147 K.
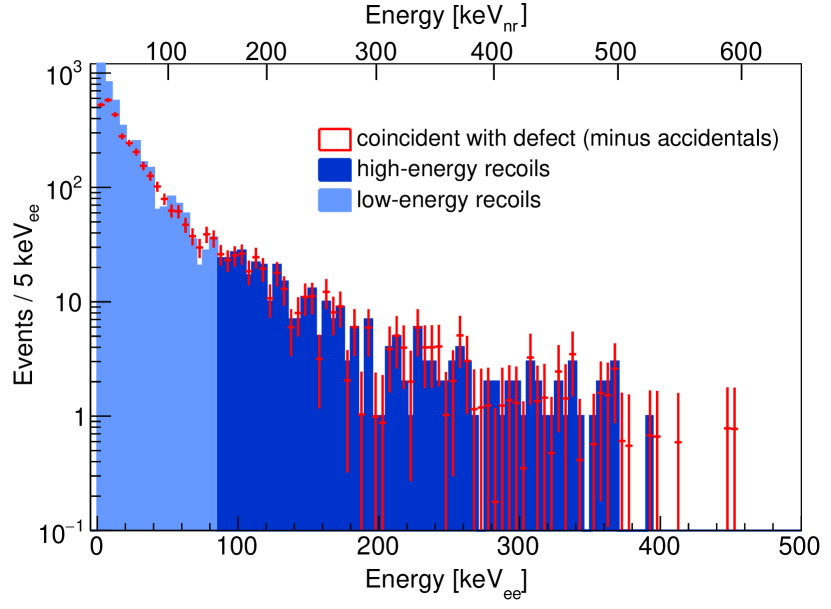
The dashed red line in Fig. 2 shows the charge of defect clusters that coincide with ionization events minus accidentals, while the red line in Fig. 6 shows the corresponding spectrum of the coinciding ionization events. The difference between the red solid and dashed lines in Fig. 2 at high cluster charge corresponds to prominent defects that are missed because they either coincide with ionization clusters that have at least one saturated pixel or are missed altogether because of pile-up. In Fig. 6, the 19 coincident nuclear-recoil events that were misidentified by cluster topology have been added to the spectrum of high-energy nuclear recoils (dark blue). The low-energy nuclear-recoil spectrum estimated by subtracting the scaled, background-subtracted 24Na spectrum from the background-subtracted 241Am9Be spectrum (Sec. V.2) is shown in light blue.
VII Nuclear Recoil Defect-Identification Efficiency
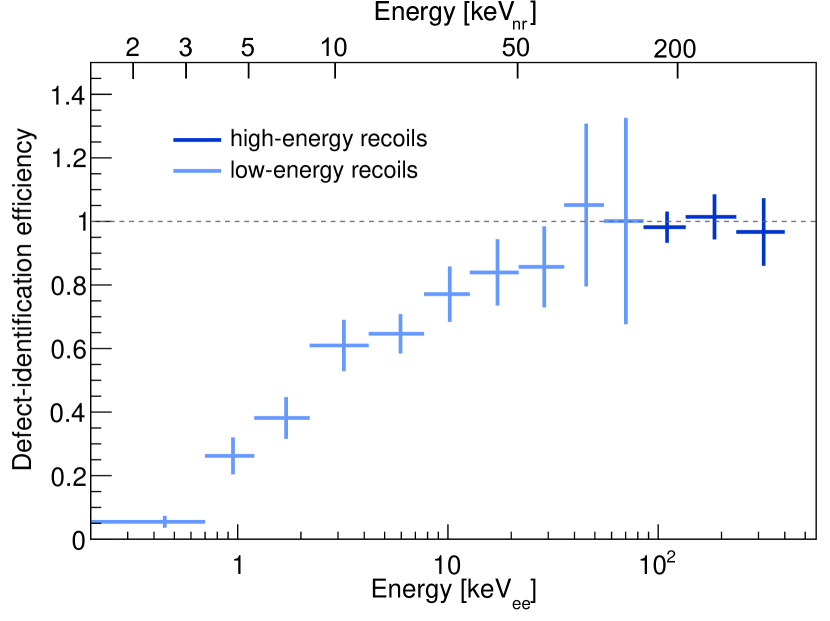
The ionization spectra of nuclear recoils and events that are spatially correlated with defects agree very well at high energies (Fig. 6), confirming full identification efficiency of nuclear recoils for keVee (150 keVnr). The agreement continues down to 45 keVee (90 keVnr), below which point there are fewer spatially correlated events. To obtain the efficiency in the identification of nuclear recoils from the spatial correlation between the primary ionization event and the defect, we divide the coincident spectrum by the nuclear-recoil spectrum. Figure 7 shows the resulting efficiency as a function of energy, with the electron-equivalent (nuclear-recoil) energy scale in the bottom (top) axis. Above 85 keVee (150 keVnr), % (95% C.L.) of nuclear recoils produce visible defects, while the fraction reaches (62)% in the lowest-energy bin between 0.2 keVee (1.5 keVnr) and 0.7 keVee (3.5 keVnr).
The dominant systematic uncertainty in our analysis is the assumption that the 24Na spectrum is an accurate model for the spectrum of rays from the 241Am9Be source below 140 keVee. To estimate the impact of deviations in the spectral shape of the ray background, we reconstruct the nuclear-recoil spectrum after applying an exponential multiplicative correction to the 24Na data spectrum. The correction was chosen to provide the best match between the simulated 24Na and 241Am9Be spectra in Fig. 5, with the main effect of increasing the subtracted -ray background by at most 10%. This modification results in an increase in the defect-identification efficiency within the 1- uncertainties in Fig. 7.
Directly comparable values for the nuclear-recoil identification efficiency and electronic-recoil leakage as a function of energy have not recently been reported for competing technologies. Nevertheless, the 50% efficiency at 8 keVnr with leakage provides a reference for the minimum energy at which nuclear recoils can be efficiently identified while rejecting the number of electronic-recoil backgrounds expected in a dark matter search. For comparison, dark matter searches by CRESST-III with scintillating-crystal calorimeters Abdelhameed et al. (2019), LZ with a liquid xenon time projection chamber (TPC) Aalbers et al. (2023), EDELWEISS-III Armengaud et al. (2016, 2017) and SuperCDMS Soudan Agnese et al. (2018) with germanium calorimeters, and DarkSide-50 with a liquid argon TPC Agnes et al. (2018) report results with nuclear/electronic recoil discrimination and similar signal efficiency at 1, 6, 8, 20 and 60 keVnr, respectively.
VIII Conclusion
We have demonstrated for the first time nuclear recoil identification in a silicon CCD. The experimental technique relies on the spatial correlation between the primary ionization event and the defect left behind by the atomic dislocation, later identified by thermal stimulation. Since electronic recoils do not generate visible defects, this technique offers excellent discrimination between nuclear and electronic recoils down to nuclear recoil energies 10 keV, competitive with other technologies for the direct detection of dark matter and CENS. As presented in this paper, the technique can be readily implemented in a CCD dark matter search (e.g., DAMIC-M Arnquist et al. (2023b) and Oscura Aguilar-Arevalo et al. (2022b)) to suppress electronic-recoil backgrounds by orders of magnitude and significantly increase sensitivity in the search for WIMPs with masses GeV . To avoid the daily warmup of the detector to identify defects, future work will focus on understanding the lifetime of defects at cold temperatures. If defects are sufficiently long lived so that the temperature cycle could be performed at most once a month, the deadtime introduced in the dark matter search would be greatly improved.
This is only the first attempt at the identification of nuclear recoils in a CCD, with significant room for improvement. Defect identification was performed at 223 K, which is the highest temperature at which our CCD system would operate reliably. We have yet to optimize defect identification by exploring in detail the temperature dependence of the signal from defects against the background from leakage current. Another avenue is to identify defects by optical stimulation, optimizing the wavelength of the light under flat-field illumination or localized stimulation with a laser García et al. (2017). This result paves the way for future efforts that will bring CCD experiments to the forefront in the search for nuclear recoils from weakly interacting particles.
Acknowledgements.
We are grateful to Alejandro García and Eric Smith at the Center for Experimental Nuclear Physics and Astrophysics (CENPA) for providing the radioactive sources for this study. We acknowledge financial support from the following agencies and organizations: the U.S. Department of Energy Office of Science through the Dark Matter New Initiatives program; the U.S. National Science Foundation through Grant No. NSF PHY-2110585 to the University of Washington and The University of Chicago; Swiss National Science Foundation through Grant No. 200021_153654 and via the Swiss Canton of Zurich; IFCA through project PID2019-109829GB-I00 funded by MCIN/ AEI /10.13039/501100011033. We thank the College of Arts and Sciences at the University of Washington for contributing the first CCDs to the DAMIC-M project. The CCD development at Lawrence Berkeley National Laboratory MicroSystems Lab was supported in part by the Director, Office of Science, of the U.S. Department of Energy under Contract No. DE-AC02-05CH11231.References
- Akerib et al. (2022) D. S. Akerib et al., in Snowmass 2021 (2022) arXiv:2203.08084 [hep-ex] .
- Abdullah et al. (2022) M. Abdullah et al., in Snowmass 2021 (2022) arXiv:2203.07361 [hep-ph] .
- Agnes et al. (2018) P. Agnes et al. (DarkSide), Phys. Rev. D 98, 102006 (2018), arXiv:1802.07198 [astro-ph.CO] .
- Aalbers et al. (2023) J. Aalbers et al. (LUX-ZEPLIN), Phys. Rev. Lett. 131, 041002 (2023), arXiv:2207.03764 [hep-ex] .
- Armengaud et al. (2016) E. Armengaud et al. (EDELWEISS), JCAP 05, 019 (2016), arXiv:1603.05120 [astro-ph.CO] .
- Agnese et al. (2018) R. Agnese et al. (SuperCDMS), Phys. Rev. Lett. 120, 061802 (2018), arXiv:1708.08869 [hep-ex] .
- Abdelhameed et al. (2019) A. H. Abdelhameed et al. (CRESST), Phys. Rev. D 100, 102002 (2019), arXiv:1904.00498 [astro-ph.CO] .
- Holland et al. (2003) S. E. Holland, D. E. Groom, N. P. Palaio, R. J. Stover, and M. Wei, IEEE Trans. Electron. Dev. 50, 225 (2003).
- Tiffenberg et al. (2017) J. Tiffenberg, M. Sofo-Haro, A. Drlica-Wagner, R. Essig, Y. Guardincerri, S. Holland, T. Volansky, and T.-T. Yu (SENSEI), Phys. Rev. Lett. 119, 131802 (2017), arXiv:1706.00028 [physics.ins-det] .
- Aguilar-Arevalo et al. (2020) A. Aguilar-Arevalo et al. (DAMIC), Phys. Rev. Lett. 125, 241803 (2020), arXiv:2007.15622 [astro-ph.CO] .
- Fernandez Moroni et al. (2015) G. Fernandez Moroni, J. Estrada, E. E. Paolini, G. Cancelo, J. Tiffenberg, and J. Molina, Phys. Rev. D 91, 072001 (2015), arXiv:1405.5761 [physics.ins-det] .
- Aguilar-Arevalo et al. (2022a) A. Aguilar-Arevalo et al. (CONNIE), JHEP 05, 017 (2022a), arXiv:2110.13033 [hep-ex] .
- Baxter et al. (2020) D. Baxter et al., JHEP 02, 123 (2020), arXiv:1911.00762 [physics.ins-det] .
- Lee (2023a) S. J. Lee (DAMIC-M), SciPost Phys. Proc. 12, 030 (2023a), arXiv:2210.00469 [physics.ins-det] .
- Lee (2023b) S. J. Lee, Development of Technique to Use Lattice Defects in CCDs to Search for Dark Matter, Ph.D. thesis, University of Zurich, Zurich, Switzerland (2023b), Available at https://www.zora.uzh.ch.
- Nordlund et al. (1998) K. Nordlund, M. Ghaly, R. S. Averback, M. Caturla, T. Diaz de la Rubia, and J. Tarus, Phys. Rev. B 57, 7556 (1998).
- Fretwurst et al. (2002) E. Fretwurst, G. Lindstrom, J. Stahl, and I. Pintilie, in 9th European Symposium on Semiconductor Detectors: New Developments in Radiation Detectors (2002) arXiv:physics/0211118 .
- Srour et al. (2003) J. Srour, C. Marshall, and P. Marshall, IEEE Trans. Nucl. Sci. 50, 653 (2003).
- Sassi et al. (2022) S. Sassi, M. Heikinheimo, K. Tuominen, A. Kuronen, J. Byggmästar, K. Nordlund, and N. Mirabolfathi, Phys. Rev. D 106, 063012 (2022), arXiv:2206.06772 [hep-ph] .
- Arnquist et al. (2023a) I. Arnquist et al. (DAMIC-M), Phys. Rev. Lett. 130, 171003 (2023a), arXiv:2302.02372 [hep-ex] .
- Norcini et al. (2022) D. Norcini et al. (DAMIC-M), Phys. Rev. D 106, 092001 (2022), arXiv:2207.00809 [physics.ins-det] .
- Ramanathan and Kurinsky (2020) K. Ramanathan and N. Kurinsky, Phys. Rev. D 102, 063026 (2020), arXiv:2004.10709 [astro-ph.IM] .
- Lindhard et al. (1963) J. Lindhard, V. Nielsen, M. Scharff, and P. V. Thomsen, Mat. Fys. Medd. Dan. Vid. Selsk. 33, 10:1 (1963).
- Chagani et al. (2008) H. Chagani, P. Majewski, E. J. Daw, V. A. Kudryavtsev, and N. J. C. Spooner, JINST 3, P06003 (2008), arXiv:0806.1916 [physics.ins-det] .
- Agnese et al. (2017) R. Agnese et al. (SuperCDMS), Phys. Rev. D 95, 082002 (2017), arXiv:1610.00006 [physics.ins-det] .
- Aguilar-Arevalo et al. (2016) A. Aguilar-Arevalo et al. (DAMIC), Phys. Rev. D 94, 082006 (2016), arXiv:1607.07410 [astro-ph.CO] .
- Agostinelli et al. (2003) S. Agostinelli et al. (GEANT4), Nucl. Instrum. Meth. A 506, 250 (2003).
- Kluge and Weise (1982) H. Kluge and K. Weise, Radiat. Prot. Dosim. 2, 85 (1982).
- Duke et al. (2016) M. J. M. Duke, A. L. Hallin, C. B. Krauss, P. Mekarski, and L. Sibley, Appl. Radiat. Isot. 116, 51 (2016), arXiv:1506.05417 [physics.ins-det] .
- Basunia and Chakraborty (2022) M. S. Basunia and A. Chakraborty, Nucl. Data Sheets 186, 3 (2022).
- Armengaud et al. (2017) E. Armengaud et al. (EDELWEISS), JINST 12, P08010 (2017), arXiv:1706.01070 [physics.ins-det] .
- Arnquist et al. (2023b) I. J. Arnquist et al. (DAMIC-M), SciPost Phys. Proc. 12, 014 (2023b), arXiv:2210.12070 [hep-ex] .
- Aguilar-Arevalo et al. (2022b) A. Aguilar-Arevalo et al. (Oscura), (2022b), arXiv:2202.10518 [astro-ph.IM] .
- García et al. (2017) M. F. García, J. G. Sánchez, R. J. Echeverría, M. Moll, R. M. Santos, D. Moya, R. Palomo Pinto, and I. Vila, Nucl. Instrum. Meth. A 845, 69 (2017).