This article may be downloaded for personal use only. Any other use requires prior permission of the author and AIP Publishing. This article appeared in J. Appl. Phys. 134 (9) and may be found at https://doi.org/10.1063/5.0157208.
High-sensitivity transition-edge-sensed bolometers: improved speed and characterization with AC and DC bias
Abstract
We report on efforts to improve the speed of low-G far-infrared transition-edged-sensed bolometers. We use a fabrication process that does not require any dry etch steps to reduce heat capacity on the suspended device and measure a reduction in the detector time constant. However, we also measure an increase in the temperature-normalized thermal conductance (G), and a corresponding increase in the noise-equivalent power (NEP). We employ a new near-IR photon-noise technique using a near-IR laser to calibrate the frequency-domain multiplexed AC system and compare the results to a well-understood DC circuit. We measure an NEP white noise level of 0.8 aW/rtHz with a 1/f knee below 0.1 Hz and a time constant of 3.2 ms.
I Introduction
Transition-edge sensed (TES) bolometers and their SQUID-based readout systems have been the detectors of choice for many recent ground-based astrophysics and cosmology experiments in the trans-millimeter bands [ACT (2015) Thornton et al. (2016); Ward et al. (2016), Bicep2 Ade et al. (2014), Bicep3 Ade et al. (2022a), GISMO Staguhn et al. (2014), HAWK+ Harper et al. (2018), Keck Experiment Kernasovskiy et al. (2012), PolarBear The Polarbear Collaboration et al. (2020), SPIDER Ade et al. (2022b), SPT Sobrin et al. (2022), etc.].
TES bolometer arrays have generally demonstrated excellent systematic performance in deep microwave background measurements (BICEP-Keck/SPIDER Collaboration 2015 Ade et al. (2015), SPT 2018 Everett et al. (2018), BICEP-Keck Collaboration 2022 Ade et al. (2022a), ACT Ward et al. (2016)). They are, thus, a strong candidate for future space missions, which would have lower backgrounds, both in the CMB bands (EPICBock et al. (2009), LitebirdLiteBIRD Collaboration et al. (2023)) and also in the far-infrared (far-IR), where no commercial high-performance detector systems exist. The far-IR is particularly compelling for a space mission because of the very low natural backgrounds across a full decade in wavelength from 25 to 300 m. A cryogenically-cooled telescope in this band offers large potential scientific gains for a range of astrophysical applications from planet formation to galaxy evolution Meixner et al. (2019); ori (2021); Roelfsema et al. (2018); Glenn et al. (2021), particularly via moderate-resolution () spectroscopy Bradford et al. (2021). However, fully capitalizing on the low-background platform requires sensitivity matching the detector sensitivity to the photon shot noise in the narrow band - this results in a target noise equivalent power (NEP) of or lower.
The ultralow-noise requirement poses new challenges. The devices must have low thermal conductance (G) in the suspension, while maintaining sufficient speed; therefore, fabrication techniques must maintain low heat capacity in the released devices. Additionally, characterization is challenging at the very low loadings (of order 1 aW or less), since bolometers are susceptible to all forms of radiation; both the electronics and the thermal radiation must be heavily filtered. Early pioneering work in low-G far-IR TES sensors was made at JPL Kenyon et al. (2006); Beyer et al. (2012, 2014); Kenyon et al. (2014), where NEPs approaching were demonstrated with DC voltage bias Irwin (1995); Irwin et al. (1997), albeit with the speed of response of several milliseconds. Subsequent work at SRON reported comparable sensitivity with speeds below 1 ms Audley et al. (2016); Khosropanah et al. (2016); Ridder et al. (2016); Suzuki et al. (2016), using the SRON AC bias system van der Kuur et al. (2011); Hijmering et al. (2016).
Here, we report the development of a low-heat-capacity wet-release process for fabricating low-G far-IR TES sensors and characterization of these devices. We employ both AC and DC biasing schemes and present a novel absolute power calibration technique using near-IR (1550 nm) shot noise, which overcomes uncertainties in the electrical transfer through the system. We find a two to four times improvement in device speeds relative to our previous dry-release devices, but thermal conductances and associated noise-equivalent powers are five to ten times higher than the previously published ones for devices with similar geometries Kenyon et al. (2014).
This paper is organized as follows: following the introduction in Sec. I is the array design and fabrication in Sec. II. Sec. III describes the experimental setup, which covers both the DC and AC setup, and the setup for the measurement of the noise using the near-IR laser. Sections IV and V describe the detail of AC and DC measurements, respectively. These measurements include time constants, optical responsivity, and noise. Sec. VI is the summary.
II Array Design and Fabrication
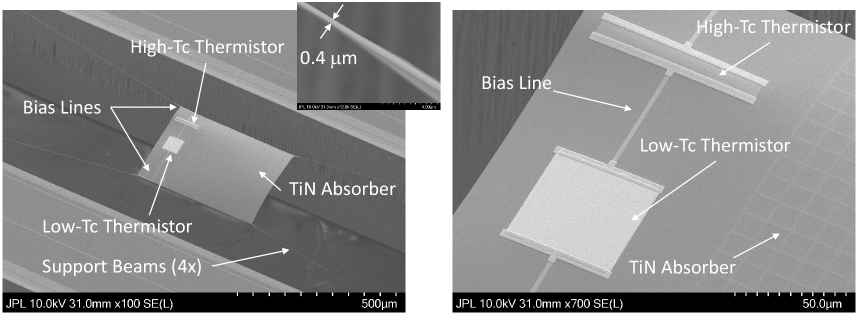
Each TES sensor consists of a free-standing low-stress silicon nitride (LSN) membrane (0.25 x 400 x 300 ) which connects to the substrate through four 0.25 thick s 1000 long s 0.4 wide LSN support beams. Niobium wires (30 nm thick) run along two of the support beams and electrically connect to an 80 x 8 high- titanium thermistor (100 nm) in series with a 50 x 50 low- bilayer consisting of titanium (50 nm) and gold (150 nm). A grid of titanium nitride wires (1.5 wide x 12 long x 30 nm thick) with a of define the optical absorber, which has an effective sheet resistance of . Each TES sensor is arranged in an array with a format size of 5 x 12 with a column and row spacing of 3.73 and 0.99 mm, respectively. Micrographs of a single pixel are presented in Fig. 1.
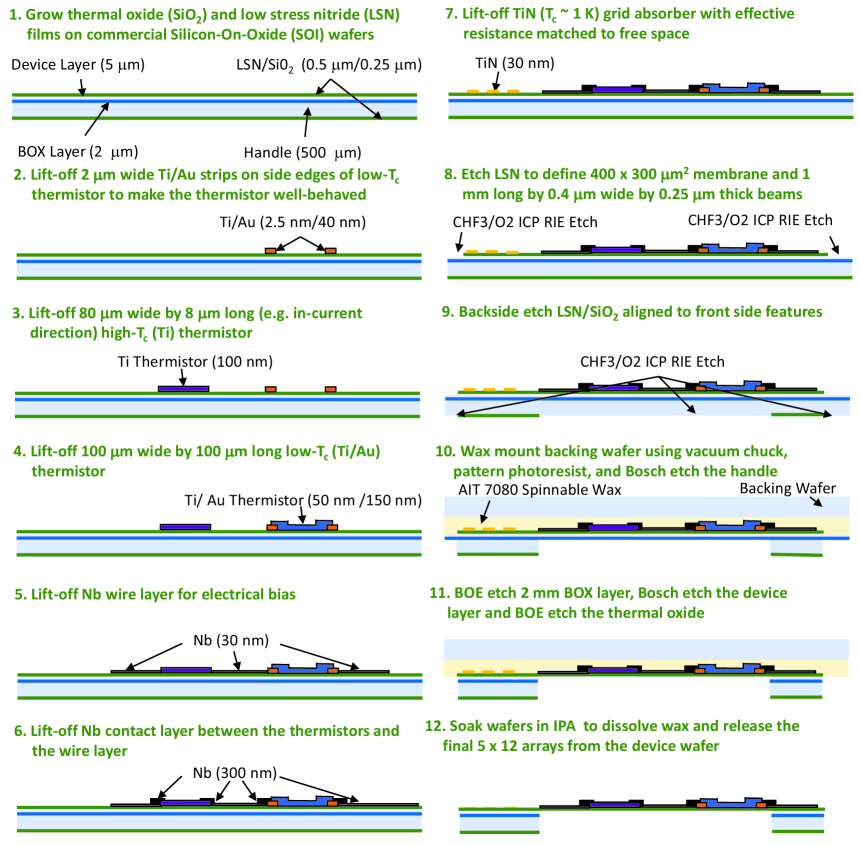
Based on prior measurements, it was determined that dry etching the LSN membrane causes surface roughness on the membrane, which manifests as excess heat capacity Beyer et al. (2010). This excess heat capacity slows the response time of the TES sensor beyond the requirement. Therefore, a fabrication process was developed that does not require any dry etch steps that etch the top and bottom surface of the LSN. Key details of this process are presented in Fig. 2 and described as follows: (1) 500 nm thermal oxide and 250 nm low pressure, chemical vapor deposition silicon nitride (LPCVD) (-200 MPa compressive stress) were grown on bare 100 mm silicon-on-insulator (SOI) wafers (500 handle; 2 buffered oxide layer (BOX); 5 device) at the Jet Propulsion Laboratory’s (JPL) Microdevices Laboratory. (2) Ti (2.5 nm)/Au (40 nm) strips (2 wide) were patterned to passivate the edges of the low- thermistor so that its overall properties are well-behaved. (3) a thermistor consisting of Ti (100 nm) was patterned via dc sputtering and a lift-off technique. (4) A thermistor consisting of a bilayer of Ti (50 nm)/Au (150 nm) was patterned via dc sputtering and a lift-off technique. (5) Nb wires (30 nm) to bias the two thermistors were defined using dc sputtering and a lift-off technique. (6) A Nb contact layer (300 nm) was sputtered on the edges of the thermistors to ensure good electrical contact between the bias lines and the thermistors. (7) A TiN absorber (30 nm) was patterned via dc sputtering with a . (8) The LSN membrane was patterned using a dry CHF3/O2 ICP RIE process into a 400 x 300 membrane and four 1 mm long x 0.4 wide x 0.25 thick support beams. (9) The backside LSN/SiO2 was etched using a dry CHF3/O3 ICP RIE process aligned to the front side membrane and support beams. (10) The device wafer was wax mounted to a 150 mm backing wafer using AIT 7080 spinnable wax and a vacuum mounting technique. The handle of the SOI wafer was removed using a Bosch process and a photoresist to define openings underneath the suspended membrane and support beams. (11) The BOX layer was removed using a buffered buffered oxided etch (BOE). The device layer was removed using a Bosch process. The thermal oxide underneath the LSN membrane was removed using buffered BOE; (12) The arrays were removed by soaking the device wafer and a 150 mm backing wafer in IPA using a fixture, which allowed the 12 x 5 arrays to separate from the backing wafer.
III Experimental Setup
The TESs were tested in a BlueFors LD250 Dilution Refrigerator (DR) system ld_ (2019) at JPL. The temperature is controlled using a PID loop with a Lake Shore Cryotronics Model 372 AC Resistance Bridge lak (2023). The thermometer and heater are mounted on the mixing chamber plate near the TES sample box. The temperatures presented in this paper are measured using the same thermometer as the PID loop. The TESs are biased with a Tektronix AFG 31000 Series Arbitrary Function Generator afg (2022). The bias voltage is reduced with a voltage divider before entering the cryostat. The bias and readout lines in the cryostat are phosphor-bronze shielded twisted pairs. The cabling connects to the TES housing box shown in Fig. 3 using a 37-pin micro-D connector. The TES housing box and the mixing chamber plate are gold-plated copper, and the fasteners are brass to ensure good thermal contact while cold. The bias lines pass through a 20 MHz RC low-pass filter on a printed circuit board and are wirebonded into a chip containing a Magnicon 2-stage SQUID int (2022). The SQUID is fed back and read out with Magnicon XXF-1 electronics xxf (2011). The output of the SQUID electronics is recorded with a Pico Technology PicoScope 6403E pic (2022) USB oscilloscope. The bias and readout system is set up in either a DC or an AC mode depending on the measurement. The AC setup is described in Sec. III.1 and the DC setup is described in Sec. III.2.
III.1 AC Setup
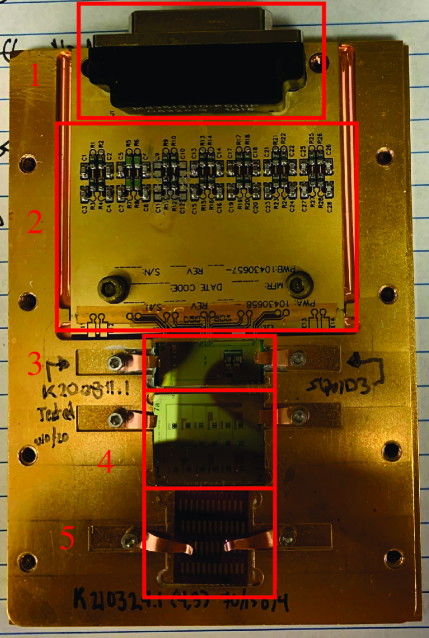
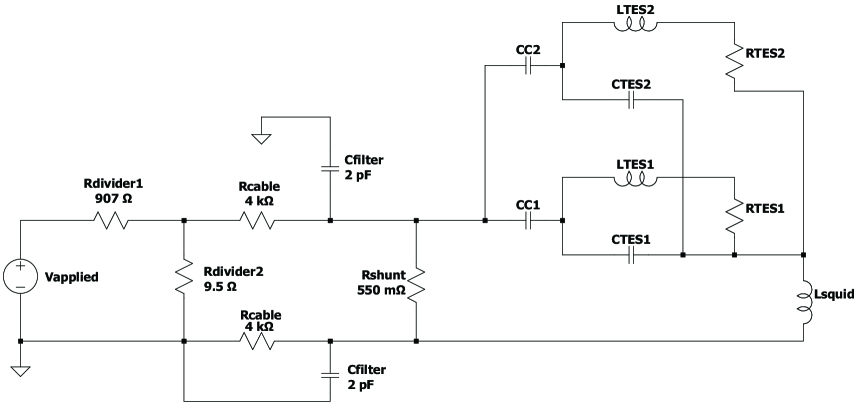
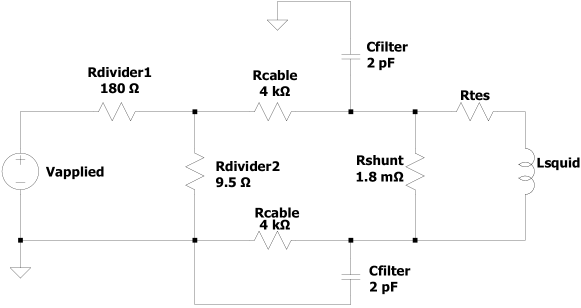
The AC setup uses a cryogenic LC resonant filter array designed and fabricated at the Netherlands Institute for Space Research (SRON), developed as part of their AC multiplexing schemevan der Kuur et al. (2004), which has successfully supported 160 far-IR TES pixels in a single circuit Hijmering et al. (2014). Our work used an 18-channel test chip with resonance frequencies between 1 and 5 MHz (component 4 in Fig. 3). A circuit model of the AC system is presented in Fig. 4. Each TES is wirebonded into one of the LC resonant circuits. The 18-channels are connected to two TESs without absorbers, two TESs with absorbers, four thermistors, and 10 shorts.
The MHz band of the AC bias circuit is beyond the closed-loop bandwidth of the SQUID and commercial electronics; therefore, the SQUID is operated in an open-loop mode for the AC setup.
The SQUID is operated in the regime where the current to voltage conversion is linear to within 5%. The current scale is calibrated by measuring the voltage response of a single flux quantum, and using the reported input coil coupling for the SQUID from the Magnicon datasheet (measured at 320 mK). Measurements that use the AC setup are presented in Sec. IV.
III.2 DC Setup
We complement our AC measurements with DC measurements, in which the LC chip is bypassed to measure a single TES with a more traditional DC bias. The DC measurements provided an independent check on the absolute power scale for the device without the uncertainties in the AC measurement, validating our photon-noise calibration approach presented in Sec. IV.1 The circuit model for the DC system is shown in Fig. 5. The readout and function generator are the same in the DC and AC setup. The SQUID is operated with feedback for the DC measurements. Measurements with the DC setup are presented in Sec. V.
III.3 Near-IR Laser Setup
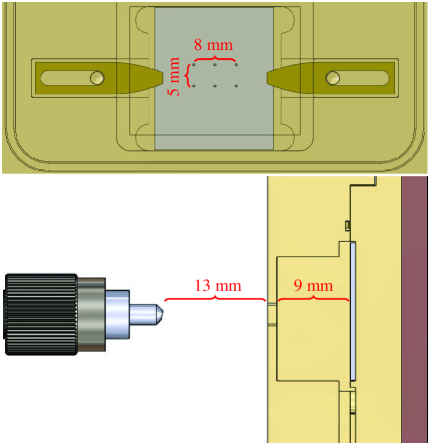
To overcome the uncertainties in the electrical power calibration of low-G TESs, we have developed a near-IR photon-noise calibration technique. For this measurement, six 0.5-mm diameter holes are drilled in the cover of the TES housing box over the detector array. The holes are drilled in an array of three (with 4 mm spacing) by two (with 5 mm spacing). The hole array is located above the four detectors that were tested with the AC setup. A fiber-optic cable with standard fiber connectors (FC connectors) is positioned about 1.3 cm in front of the holes, and the opening of the holes is 9 mm above the detector wafer. The FC connector is allowed to spray photons freely over the holes in the TES housing box. A CAD model of the laser setup is shown in Fig. 6. A ThorLabs S5FC1550S-A2 fiber-coupled super-luminescent diode (SLD) sourcetho (2022a) is used for the measurements presented in this paper.
IV AC Measurements
Two TESs with absorbers and two TESs without absorbers were studied sequentially with the AC system, all at a bath temperature of 100 mK. The resonance frequencies of the four LC filter channels associated with the TESs are given in Table 1. Current vs voltage curves are measured for each TES, and bias voltages for the subsequent response and noise measurements are chosen such that the TES is at 1/2 the normal resistance. DC current vs voltage curves are presented in Sec. V.1.
IV.1 Photon-noise Calibration
IV.1.1 Approach
The absolute current and voltage scales in the AC setup are not known accurately due to uncertainty in the shunt resistor value, difficulty in establishing the open-loop MHz SQUID response, and reactive effects in the TES resonant circuit. To overcome these obstacles and provide absolute electrical power calibration, we have developed a technique using shot noise from a 1550 nm laser. When the laser is turned off, the current is and the NEI is . Shot noise in the near-IR photon stream incident on the TES has a noise-equivalent power (NEP) of Zmuidzinas (2003)
| (1) |
Here is the photon power absorbed by the detector, is the photon energy, and the expression has units of . The corresponding noise-equivalent current (NEI) generated by the fluctuating photon power absorbed by the TES is
| (2) |
where is the current to power responsivity. The frequency dependence of the responsivity is given by
| (3) |
where the rolloff is produced by the time constant of the TES, . The mean value of the current also changes as the near-IR power is introduced, creating an additional constraint
| (4) |
which is an excellent approximation for a voltage-biased TES so long as the responsivity is constant. The power of absorbed photons is eliminated by combining Eqs. 2 and 4 with Eq. 1
| (5) |
where is the photon shot-noise contribution to the NEI. The measured NEI is the quadrature addition of the photon NEI and the NEI with the laser off,
| (6) |
| (7) |
where
| (8) | ||||
| (9) |
The responsivity of the TES can be calculated from a fit to Eq. 7 without knowledge of the total laser power incident on the detector. This calibration allows for a measurement of the absolute NEP from the measured NEI, even if the absolute NEI is not known, assuming that the NEP is proportional to the measured NEI with a constant multiplicative factor.
IV.1.2 Measurements
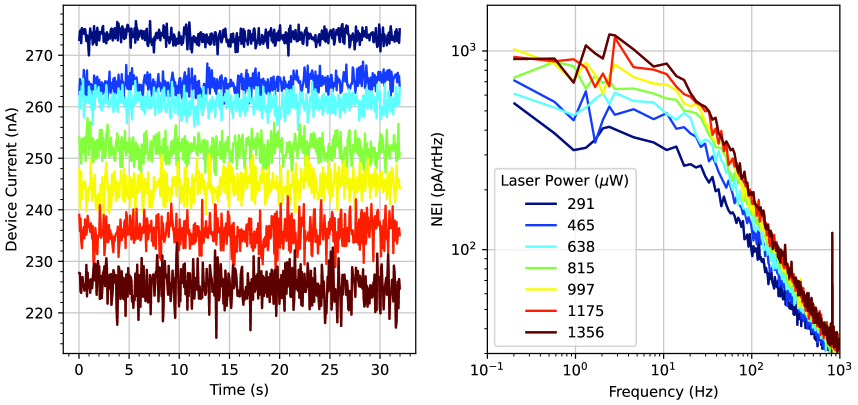
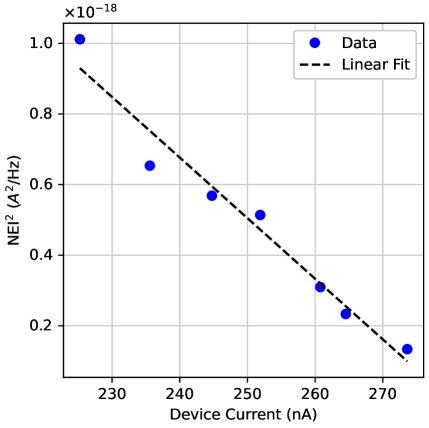
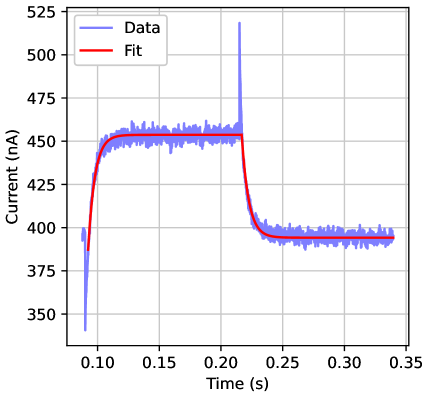
With the bias voltage fixed, a timestream of the TES current is measured for a range of laser powers. The TES current is the mean of the timestream data. The NEI is calculated from an FFT of the timestream data and is averaged over frequencies below the rolloff, but above any low-frequency excess, to capture the white noise value. An example of a TES timestream and the corresponding NEI is plotted in Fig. 7. The frequencies over which the NEI is averaged for this example are 0.3-3 Hz. The squared averaged NEI and the current corresponding to this example are plotted in Fig. 8, with a linear fit. The fit parameter is used to extract using Eq. 8. This calibration technique works for the TESs with and without absorbers. We see a factor of 5 higher absorption at 1550 nm in the TESs with absorbers.
To ensure that power fluctuations in the laser source (Thorlabs SLD) are not corrupting the measurement somehow, we repeated the experiment with a different source, a Thorlabs S3FC1550 distributed-feedback (DFB) lasertho (2022b). We obtained the same results to within the measurement uncertainty.
IV.2 Time Constant
Time constants are measured from a detector response to a modulated electrical signal. A small square-wave modulation is applied to the TES bias voltage. The function generator time constant is sufficiently fast to measure the detector response. The response is fitted to an exponential function to extract the time constant. An example of the detector response to the modulated signal is plotted in Fig. 9 with exponential fits. 64 time constants are fitted and averaged for each TES (32 ascending and 32 descending). The averaged time constants for each of the four detectors are given in Table 1. Our devices are slower than those from SRON Khosropanah et al. (2016); Ridder et al. (2016); Suzuki et al. (2016). Those measurements were obtained while biased deeper in the transition (), and were generally at bath temperatures of 40-60 mK, both of which increase the electrothermal feedback and, thus, the speed relative to the conditions of our measurements: biased at and a bath temperature of 100 mK. We may also have excess heat capacity on these devices. The fact that our devices with absorbers are slower than those without suggests additional heat capacity in the superconducting film, an aspect that is anomalous and may indicate excess heat capacity in the metallic components generally.
| TES | Frequency (MHz) | Time constant (ms) | (nA / fW) | |
|---|---|---|---|---|
| ABS 1 | 2.346 970 | 0.538 | 6.4 | -70.1 |
| ABS 2 | 3.476 124 | 0.467 | 9.1 | -29.2 |
| NO ABS 1 | 2.423 641 | 0.449 | 3.7 | -51.1 |
| NO ABS 2 | 4.273 528 | 0.526 | 4.0 | -14.8 |
IV.3 AC Setup NEP
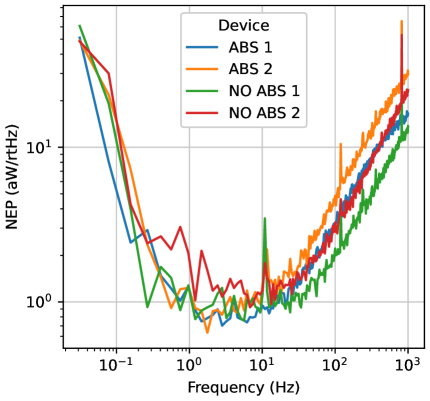
The responsivity is calculated using the photon-noise calibration method described in Sec. IV.1. The responsivities are presented in Table 1, along with the time constants that are used to calculate the frequency dependence of the responsivities. The spread in responsivities is an artifact of the laser calibration: the responsivities include the frequency-dependent gain of the system, an aspect that is removed from the NEP through the calibration. The calculated NEPs for the four TESs are shown in Fig. 10. The NEPs show a white noise of and rolloffs of 30 Hz set by the measured time constant.
V DC Setup Measurements
As a check on the AC measurements and the inference from the near-IR shot noise, we employed the well-understood DC bias setup (Sec. III.2) to both directly measure the TES properties and to repeat the laser shot-noise calibration measurement. For the DC measurements, we focused on the single device labeled ABS1 in Sec. IV.
V.1 Current vs voltage
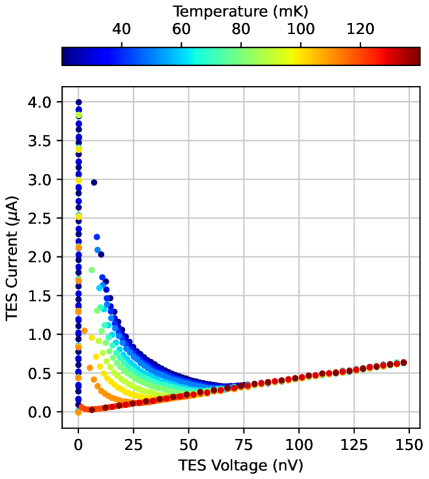
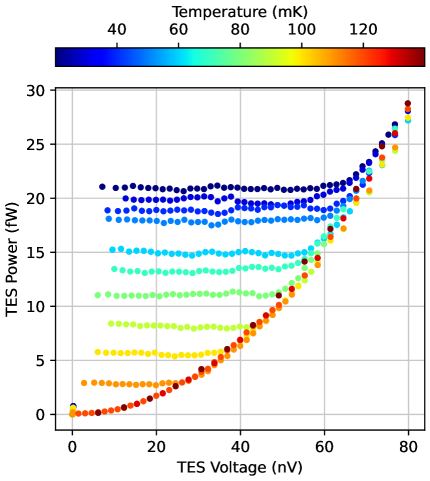
The total current through the parallel combination of the shunt resistor and TES is defined as . is calculated from the applied function generator voltage using the circuit model in Fig. 5. The TES current is measured through the SQUID. For these DC measurements, the SQUID is operated with feedback, and the current calibration is confirmed to match the datasheet using the built in generator. The voltage is swept from high to low for multiple bath temperatures, and the TES current is plotted vs the TES Voltage in Fig. 11. The TES power is calculated from and plotted vs the TES voltage in Fig. 12. The resistance of the TES is calculated from . The ratio is 0.977 for the superconducting branch, and 0.008 47 for the normal branch, corresponding to a negligible series resistance and a normal resistance of .
V.2 Resistance vs temperature
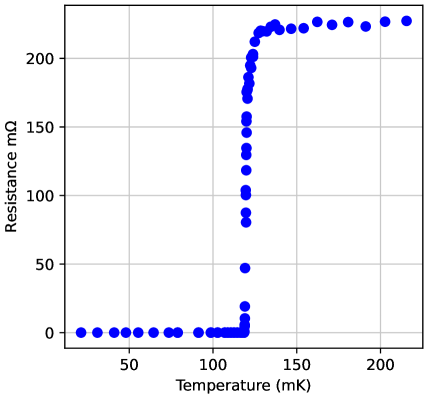
For a range of temperatures, the TES resistance can be measured from the TES voltage vs current. For each temperature, a linear fit to current vs voltage (in the regime where heating is negligible) determines the resistance at each temperature. The resistance vs temperature is presented in Fig. 13.
V.3 Thermal Conductance
The temperature dependence of the thermal conductance is modeled asKenyon et al. (2006)
| (10) |
The power vs temperature relation can be calculated by integrating with defined in Eq. 10. The integrated equation is
| (11) |
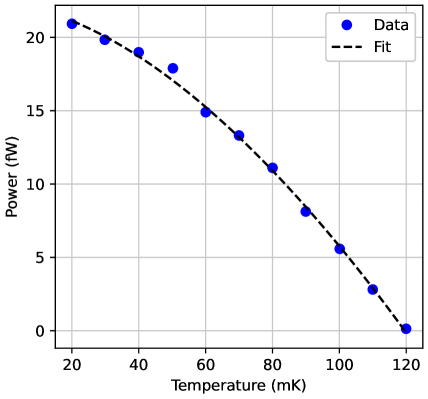
The power vs temperature data are extracted from the TES current vs voltage curves by averaging the power for each temperature in the transition. The power is plotted in Fig. 12. The negative slope in some of the power vs voltage curves is due to a small error in the current calibration. This error is negligible for our purpose of calculating the thermal conductance. The data are fit to Eq. 11. The data and fit are presented in Fig. 14. The fit parameters are presented in Table 2. Note that is not a reliable measurement of the actual dark power because an accurate fit to requires a dark measurement of and the measurement of was under the same loading conditions as the power vs temperature data.
| (fW/K) | (fW) | |
|---|---|---|
| 0.682 | 313 | 0.1411 |
V.4 Photon-Noise Calibration
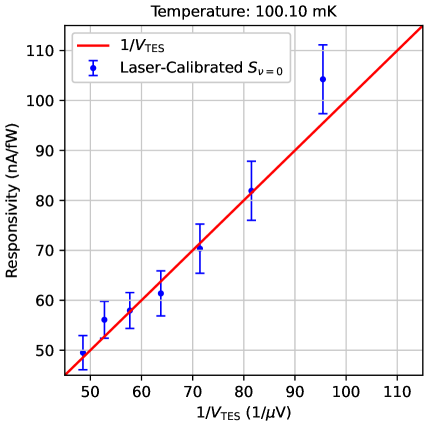
The photon-noise calibration was repeated with the DC setup. The DC electrical responsivity is equal to the inverse of the TES voltage, which is calculated from the circuit model in Fig. 5. The photon-noise calibration was repeated at several bias voltages at 100.10 mK. The results are plotted in Fig. 15 with the electrical responsivity. The error bars are propagated from the uncertainty in the linear fits to vs .
V.5 NEP Common-Mode Reduction
In order to determine whether the 1/f noise is intrinsic to the detector or due to the measurement setup, an array was tested with a time-domain readout system at the Goddard Spaceflight Center. The time-domain system allows for common-mode reduction in the noise spectra of multiple detectors that were measured simultaneously. Four detectors without absorbers were measured.
V.5.1 Experimental Setup
The laboratory Dewar is a custom-built cryostat designed at Goddard. It is a combination of parts from Simon Chase Cryogenics (4He sorption Cooler), High Precision Devices (ADR) and CryoMech ( PT-407). A custom-built set of readout electronics is used to read and run all of the thermometers and control the PID loop for the ADR at a level of less than .
Clocking and grounding are controlled and synchronized for electrical noise performance. Vibrational dampers are used to control acoustic noise that can be introduced from floor and air vibration.
The thermal and electrical control provides a clean environment for bolometer testing. To provide a regime that makes it possible to test low-noise bolometers, a specially designed package was developed at Goddard. This package utilizes superconducting thermal filters that isolate the SQUID readout chips (the time-domain SQUID multiplexers and series arrays were provided by NIST/Boulder) from the detector chip under test. Both regions in the package are darkened with a special EMI/Thermally black paint developed at GoddardChuss et al. (2017) and then closed out with a metal to metal stepped edge to block external light from getting in. The multiplexed detector signals were read out using the Multi Channel Electronics (MCE) from UBCBattistelli et al. (2008).
V.5.2 Measurements and Data Reduction
The data for the plots were taken with a base temperature of 88 mK. The data were taken at night to minimize interference from other sources. There were three runs with different bias settings, each operating the detector on a different place on the transition. Data were taken for each of those runs. The sample rate is 50 MHz and there were 4 pixels (rows) with a dead time of 4.8 s (240 samples) for settling and a dwell time of 1.2 s (60 samples) on each row. Thus, there were 33.33 Msamples for each row/run.
In two of these row/runs a single jump was noted. The data before the jump were averaged and the mean was subtracted. The data after the jump were also averaged and the mean was subtracted. Then, for each row/run, a straight line fit (offset and slope) was removed. The slope is minimal and probably not important. There is an arbitrary offset set in at the time the feedback is locked. The data were then Fourier transformed, the absolute value was applied, and half the results were binned into frequency bins. The remaining half is a mirror image and, thus, redundant. This forms a standard power spectrum. The gain was determined by the voltage setting on the TES and the counts to generate a in the feedback. The current to power responsivity is given as the standard . The shunt resistor is .
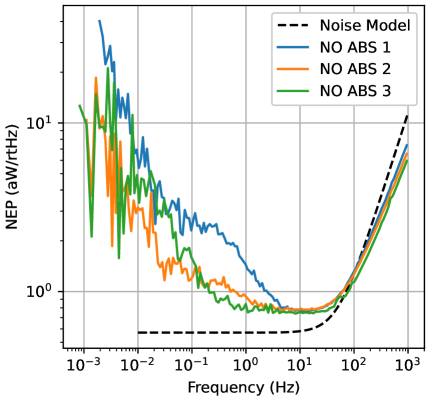
The resulting power spectra were then averaged (RMS) into equal log bins in frequency. Those at the lower end of the spectrum are still individual points in the FFT. The frequencies were averaged to get an average frequency for each bin. This has the effect of smoothing the data at high frequency although some sharp lines still appear. The lowest frequency is limited by the duration () of the data. The PID controller was turned on but was not properly tuned for the temperature setting. We show results for three of the devices (there was a data glitch during the measurements of the fourth device). The noise data are presented in Fig. 16. The white noise level is , and the single-pole rolloff is at 50 Hz (3.2 ms time constant). NO ABS 2 and 3 have a 1/f knee below 0.1 Hz, and NO ABS 1 has a higher 1/f knee of below 1 Hz. The 1/f noise is reduced from the measurements in Sec. IV.3 by up to a factor of 10.
The noise model in Fig. 16 includes the G noise, the Johnson noise, and the SQUID noise. The G noise is , where G is measured in Sec. V.3. The SQUID noise was measured using an off-resonance bias, and matches the Magnicon datasheet. The SQUID noise divided by the average responsivity of the TESs is . The Johnson noise is calculated from , where and are the operating temperature and resistance of the TESs. The average value of the Johnson noise divided by the average responsivity is . The sum of the G, SQUID, and Johnson noise is .
VI Summary
We present development and testing of low-thermal-conductance transition-edge-sensed (TES) bolometers for far-IR space astrophysics. Our new wet-release process is compatible with large arrays of devices with 1-mm long legs on 1/4-micron silicon nitride, and yields an improved speed of response (3–10 ms) relative to previous low-G devices developed at the JPL Microdevices Lab (10-30 ms)Beyer et al. (2012, 2014); Kenyon et al. (2014). However, in a careful calibration in both AC and DC bias schemes and multiple experimental setups, we find that the thermal conductances (Gs) are ten times higher than previously measured with the same leg geometries in the old dry-release process. We do note that a similar wet-release approach used for higher-G, higher-temperature devices (not presented here) confirms an increase in speed with fixed G relative to the dry process; therefore, the heat capacity improvements are real. The higher G in our low-G wet-release devices may be due to a reduction in phonon scattering along the legs due to the smoothness associated with the wet release.
In characterizing these devices, we have developed a near-IR photon-shot-noise calibration technique which offers a rapid and unambiguous measure to total power on the TESs. While not a replacement for far-IR optical characterization, the near-IR technique is very convenient for assessing electrical properties. This is especially useful when the bias transfer is uncertain, as is often the case in AC bias systems. It works in the regime in which the power to current responsivity is constant, the bulk of the operating regime for TES devices. In future experiments, stray light could be reduced using a simple near-IR bandpass filter.
The time-domain multiplexing system at Goddard yields better sensitivities than the AC setup, a fact we attribute to improved filtration and stray light blockage, rather than a fundamental difference in the approach. Through a careful 1/f reduction, the noise is further reduced to an electrical noise-equivalent power as low as . This is only modestly larger than the , which is expected from the fluctuations in the thermal transport (the G noise), the Johnson noise, and the SQUID noise. The floor is very white, suggesting that it may be due to stray light. We measure a 1/f knee frequency as low as 0.1 Hz, ample for large-scale mapping experiments envisioned for the cryogenic space missions.
Acknowledgements.
The research was carried out at the Jet Propulsion Laboratory, California Institute of Technology, under a contract with the National Aeronautics and Space Administration (80NM0018D0004). This work was funded by the NASA (Award No. 141108.04.02.01.47)—to Dr. C. M. Bradford. We would like to thank Jonathan Hunacek and Brian Steinbach for helpful discussions.Data Availability Statement
The data that support the findings of this study are available from the corresponding author upon reasonable request.
References
- Thornton et al. (2016) R. J. Thornton, P. A. R. Ade, S. Aiola, F. E. Angilè, M. Amiri, J. A. Beall, D. T. Becker, H.-M. Cho, S. K. Choi, P. Corlies, K. P. Coughlin, R. Datta, M. J. Devlin, S. R. Dicker, R. Dünner, J. W. Fowler, A. E. Fox, P. A. Gallardo, J. Gao, E. Grace, M. Halpern, M. Hasselfield, S. W. Henderson, G. C. Hilton, A. D. Hincks, S. P. Ho, J. Hubmayr, K. D. Irwin, J. Klein, B. Koopman, D. Li, T. Louis, M. Lungu, L. Maurin, J. McMahon, C. D. Munson, S. Naess, F. Nati, L. Newburgh, J. Nibarger, M. D. Niemack, P. Niraula, M. R. Nolta, L. A. Page, C. G. Pappas, A. Schillaci, B. L. Schmitt, N. Sehgal, J. L. Sievers, S. M. Simon, S. T. Staggs, C. Tucker, M. Uehara, J. v. Lanen, J. T. Ward, and E. J. Wollack, “THE ATACAMA COSMOLOGY TELESCOPE: THE POLARIZATION-SENSITIVE ACTPol INSTRUMENT,” The Astrophysical Journal Supplement Series 227, 21 (2016).
- Ward et al. (2016) J. T. Ward, J. Austermann, J. A. Beall, S. K. Choi, K. T. Crowley, M. J. Devlin, S. M. Duff, P. A. Gallardo, S. W. Henderson, S.-P. P. Ho, G. Hilton, J. Hubmayr, N. Khavari, J. Klein, B. J. Koopman, D. Li, J. McMahon, G. Mumby, F. Nati, M. D. Niemack, L. A. Page, M. Salatino, A. Schillaci, B. L. Schmitt, S. M. Simon, S. T. Staggs, R. Thornton, J. N. Ullom, E. M. Vavagiakis, and E. J. Wollack, “Mechanical designs and development of TES bolometer detector arrays for the Advanced ACTPol experiment,” (Edinburgh, United Kingdom, 2016) p. 991437.
- Ade et al. (2014) P. A. R. Ade, R. W. Aikin, M. Amiri, D. Barkats, S. J. Benton, C. A. Bischoff, J. J. Bock, J. A. Brevik, I. Buder, E. Bullock, G. Davis, P. K. Day, C. D. Dowell, L. Duband, J. P. Filippini, S. Fliescher, S. R. Golwala, M. Halpern, M. Hasselfield, S. R. Hildebrandt, G. C. Hilton, K. D. Irwin, K. S. Karkare, J. P. Kaufman, B. G. Keating, S. A. Kernasovskiy, J. M. Kovac, C. L. Kuo, E. M. Leitch, N. Llombart, M. Lueker, C. B. Netterfield, H. T. Nguyen, R. O’Brient, R. W. Ogburn, A. Orlando, C. Pryke, C. D. Reintsema, S. Richter, R. Schwarz, C. D. Sheehy, Z. K. Staniszewski, K. T. Story, R. V. Sudiwala, G. P. Teply, J. E. Tolan, A. D. Turner, A. G. Vieregg, P. Wilson, C. L. Wong, K. W. Yoon, and B. Collaboration), “Bicep2. II. EXPERIMENT AND THREE-YEAR DATA SET,” The Astrophysical Journal 792, 62 (2014), publisher: The American Astronomical Society.
- Ade et al. (2022a) P. A. R. Ade, Z. Ahmed, M. Amiri, D. Barkats, R. B. Thakur, C. A. Bischoff, D. Beck, J. J. Bock, H. Boenish, E. Bullock, V. Buza, J. R. Cheshire IV, J. Connors, J. Cornelison, M. Crumrine, A. Cukierman, E. V. Denison, M. Dierickx, L. Duband, M. Eiben, S. Fatigoni, J. P. Filippini, S. Fliescher, N. Goeckner-Wald, D. C. Goldfinger, J. Grayson, P. Grimes, G. Hall, G. Halal, M. Halpern, E. Hand, S. Harrison, S. Henderson, S. R. Hildebrandt, G. C. Hilton, J. Hubmayr, H. Hui, K. D. Irwin, J. Kang, K. S. Karkare, E. Karpel, S. Kefeli, S. A. Kernasovskiy, J. M. Kovac, C. L. Kuo, K. Lau, E. M. Leitch, A. Lennox, K. G. Megerian, L. Minutolo, L. Moncelsi, Y. Nakato, T. Namikawa, H. T. Nguyen, R. O’Brient, R. W. Ogburn IV, S. Palladino, T. Prouve, C. Pryke, B. Racine, C. D. Reintsema, S. Richter, A. Schillaci, R. Schwarz, B. L. Schmitt, C. D. Sheehy, A. Soliman, T. S. Germaine, B. Steinbach, R. V. Sudiwala, G. P. Teply, K. L. Thompson, J. E. Tolan, C. Tucker, A. D. Turner, C. Umiltà, C. Vergès, A. G. Vieregg, A. Wandui, A. C. Weber, D. V. Wiebe, J. Willmert, C. L. Wong, W. L. K. Wu, H. Yang, K. W. Yoon, E. Young, C. Yu, L. Zeng, C. Zhang, and S. Zhang, “Bicep/Keck XV: The Bicep3 Cosmic Microwave Background Polarimeter and the First Three-year Data Set,” The Astrophysical Journal 927, 77 (2022a).
- Staguhn et al. (2014) J. G. Staguhn, A. Kovács, R. G. Arendt, D. J. Benford, R. Decarli, E. Dwek, D. J. Fixsen, G. C. Hilton, K. D. Irwin, C. A. Jhabvala, A. Karim, S. Leclercq, S. F. Maher, T. M. Miller, S. H. Moseley, E. H. Sharp, F. Walter, and E. J. Wollack, “THE GISMO TWO-MILLIMETER DEEP FIELD IN GOODS-N,” The Astrophysical Journal 790, 77 (2014), publisher: The American Astronomical Society.
- Harper et al. (2018) D. A. Harper, M. C. Runyan, C. D. Dowell, C. J. Wirth, M. Amato, T. Ames, M. Amiri, S. Banks, A. Bartels, D. J. Benford, M. Berthoud, E. Buchanan, S. Casey, N. L. Chapman, D. T. Chuss, B. Cook, R. Derro, J. L. Dotson, R. Evans, D. Fixsen, I. Gatley, J. A. Guerra, M. Halpern, R. T. Hamilton, L. A. Hamlin, C. J. Hansen, S. Heimsath, A. Hermida, G. C. Hilton, R. Hirsch, M. I. Hollister, C. F. Hostetter, K. Irwin, C. A. Jhabvala, M. Jhabvala, J. Kastner, A. Kovács, S. Lin, R. F. Loewenstein, L. W. Looney, E. Lopez-Rodriguez, S. F. Maher, J. M. Michail, T. M. Miller, S. H. Moseley, G. Novak, R. J. Pernic, T. Rennick, H. Rhody, E. Sandberg, D. Sandford, F. P. Santos, R. Shafer, E. H. Sharp, P. Shirron, J. Siah, R. Silverberg, L. M. Sparr, R. Spotz, J. G. Staguhn, A. S. Toorian, S. Towey, J. Tuttle, J. Vaillancourt, G. Voellmer, C. G. Volpert, S.-i. Wang, and E. J. Wollack, “HAWC+, the Far-Infrared Camera and Polarimeter for SOFIA,” J. Astron. Instrum. 07, 1840008 (2018).
- Kernasovskiy et al. (2012) S. Kernasovskiy, P. A. R. Ade, R. W. Aikin, M. Amiri, S. Benton, C. Bischoff, J. J. Bock, J. A. Bonetti, J. A. Brevik, B. Burger, G. Davis, C. D. Dowell, L. Duband, J. P. Filippini, S. Fliescher, S. R. Golwala, M. Halpern, M. Hasselfield, G. Hilton, V. V. Hristov, K. Irwin, J. M. Kovac, C. L. Kuo, E. Leitch, M. Lueker, C. B. Netterfield, H. T. Nguyen, R. O’Brient, R. W. Ogburn, C. L. Pryke, C. Reintsema, J. E. Ruhl, M. C. Runyan, R. Schwarz, C. D. Sheehy, Z. Staniszewski, R. Sudiwala, G. Teply, J. E. Tolan, A. D. Turner, A. Vieregg, D. V. Wiebe, P. Wilson, and C. L. Wong, “Optimization and sensitivity of the Keck array,” (Amsterdam, Netherlands, 2012) p. 84521B.
- The Polarbear Collaboration et al. (2020) . The Polarbear Collaboration, S. Adachi, M. A. O. A. Faúndez, K. Arnold, C. Baccigalupi, D. Barron, D. Beck, S. Beckman, F. Bianchini, D. Boettger, J. Borrill, J. Carron, S. Chapman, K. Cheung, Y. Chinone, K. Crowley, A. Cukierman, M. Dobbs, H. E. Bouhargani, T. Elleflot, J. Errard, G. Fabbian, C. Feng, T. Fujino, N. Galitzki, N. Goeckner-Wald, J. Groh, G. Hall, N. Halverson, T. Hamada, M. Hasegawa, M. Hazumi, C. A. Hill, L. Howe, Y. Inoue, G. Jaehnig, O. Jeong, D. Kaneko, N. Katayama, B. Keating, R. Keskitalo, S. Kikuchi, T. Kisner, N. Krachmalnicoff, A. Kusaka, A. T. Lee, D. Leon, E. Linder, L. N. Lowry, A. Mangu, F. Matsuda, Y. Minami, M. Navaroli, H. Nishino, A. T. P. Pham, D. Poletti, G. Puglisi, C. L. Reichardt, Y. Segawa, M. Silva-Feaver, P. Siritanasak, N. Stebor, R. Stompor, A. Suzuki, O. Tajima, S. Takakura, S. Takatori, D. Tanabe, G. P. Teply, C. Tsai, C. Verges, B. Westbrook, and Y. Zhou, “A Measurement of the Degree-scale CMB B-mode Angular Power Spectrum with Polarbear,” The Astrophysical Journal 897, 55 (2020), publisher: The American Astronomical Society.
- Ade et al. (2022b) P. A. R. Ade, M. Amiri, S. J. Benton, A. S. Bergman, R. Bihary, J. J. Bock, J. R. Bond, J. A. Bonetti, S. A. Bryan, H. C. Chiang, C. R. Contaldi, O. Doré, A. J. Duivenvoorden, H. K. Eriksen, M. Farhang, J. P. Filippini, A. A. Fraisse, K. Freese, M. Galloway, A. E. Gambrel, N. N. Gandilo, K. Ganga, R. Gualtieri, J. E. Gudmundsson, M. Halpern, J. Hartley, M. Hasselfield, G. Hilton, W. Holmes, V. V. Hristov, Z. Huang, K. D. Irwin, W. C. Jones, A. Karakci, C. L. Kuo, Z. D. Kermish, J. S.-Y. Leung, S. Li, D. S. Y. Mak, P. V. Mason, K. Megerian, L. Moncelsi, T. A. Morford, J. M. Nagy, C. B. Netterfield, M. Nolta, R. O’Brient, B. Osherson, I. L. Padilla, B. Racine, A. S. Rahlin, C. Reintsema, J. E. Ruhl, M. C. Runyan, T. M. Ruud, J. A. Shariff, E. C. Shaw, C. Shiu, J. D. Soler, X. Song, A. Trangsrud, C. Tucker, R. S. Tucker, A. D. Turner, J. F. van der List, A. C. Weber, I. K. Wehus, S. Wen, D. V. Wiebe, and E. Y. Young, “A Constraint on Primordial B-modes from the First Flight of the Spider Balloon-borne Telescope,” The Astrophysical Journal 927, 174 (2022b).
- Sobrin et al. (2022) J. A. Sobrin, A. J. Anderson, A. N. Bender, B. A. Benson, D. Dutcher, A. Foster, N. Goeckner-Wald, J. Montgomery, A. Nadolski, A. Rahlin, P. A. R. Ade, Z. Ahmed, E. Anderes, M. Archipley, J. E. Austermann, J. S. Avva, K. Aylor, L. Balkenhol, P. S. Barry, R. B. Thakur, K. Benabed, F. Bianchini, L. E. Bleem, F. R. Bouchet, L. Bryant, K. Byrum, J. E. Carlstrom, F. W. Carter, T. W. Cecil, C. L. Chang, P. Chaubal, G. Chen, H.-M. Cho, T.-L. Chou, J.-F. Cliche, T. M. Crawford, A. Cukierman, C. Daley, T. d. Haan, E. V. Denison, K. Dibert, J. Ding, M. A. Dobbs, W. Everett, C. Feng, K. R. Ferguson, J. Fu, S. Galli, A. E. Gambrel, R. W. Gardner, R. Gualtieri, S. Guns, N. Gupta, R. Guyser, N. W. Halverson, A. H. Harke-Hosemann, N. L. Harrington, J. W. Henning, G. C. Hilton, E. Hivon, G. P. Holder, W. L. Holzapfel, J. C. Hood, D. Howe, N. Huang, K. D. Irwin, O. B. Jeong, M. Jonas, A. Jones, T. S. Khaire, L. Knox, A. M. Kofman, M. Korman, D. L. Kubik, S. Kuhlmann, C.-L. Kuo, A. T. Lee, E. M. Leitch, A. E. Lowitz, C. Lu, S. S. Meyer, D. Michalik, M. Millea, T. Natoli, H. Nguyen, G. I. Noble, V. Novosad, Y. Omori, S. Padin, Z. Pan, P. Paschos, J. Pearson, C. M. Posada, K. Prabhu, W. Quan, C. L. Reichardt, D. Riebel, B. Riedel, M. Rouble, J. E. Ruhl, B. Saliwanchik, J. T. Sayre, E. Schiappucci, E. Shirokoff, G. Smecher, A. A. Stark, J. Stephen, K. T. Story, A. Suzuki, C. Tandoi, K. L. Thompson, B. Thorne, C. Tucker, C. Umilta, L. R. Vale, K. Vanderlinde, J. D. Vieira, G. Wang, N. Whitehorn, W. L. K. Wu, V. Yefremenko, K. W. Yoon, and M. R. Young, “The Design and Integrated Performance of SPT-3G,” The Astrophysical Journal Supplement Series 258, 42 (2022).
- Ade et al. (2015) P. A. R. Ade, R. W. Aikin, M. Amiri, D. Barkats, S. J. Benton, C. A. Bischoff, J. J. Bock, J. A. Bonetti, J. A. Brevik, I. Buder, E. Bullock, G. Chattopadhyay, G. Davis, P. K. Day, C. D. Dowell, L. Duband, J. P. Filippini, S. Fliescher, S. R. Golwala, M. Halpern, M. Hasselfield, S. R. Hildebrandt, G. C. Hilton, V. Hristov, H. Hui, K. D. Irwin, W. C. Jones, K. S. Karkare, J. P. Kaufman, B. G. Keating, S. Kefeli, S. A. Kernasovskiy, J. M. Kovac, C. L. Kuo, H. G. LeDuc, E. M. Leitch, N. Llombart, M. Lueker, P. Mason, K. Megerian, L. Moncelsi, C. B. Netterfield, H. T. Nguyen, R. O’Brient, R. W. O. Iv, A. Orlando, C. Pryke, A. S. Rahlin, C. D. Reintsema, S. Richter, M. C. Runyan, R. Schwarz, C. D. Sheehy, Z. K. Staniszewski, R. V. Sudiwala, G. P. Teply, J. E. Tolan, A. Trangsrud, R. S. Tucker, A. D. Turner, A. G. Vieregg, A. Weber, D. V. Wiebe, P. Wilson, C. L. Wong, K. W. Yoon, J. Zmuidzinas, and for the Bicep2, Keck Array, and Spider Collaborations, “ANTENNA-COUPLED TES BOLOMETERS USED IN BICEP2, Keck Array , AND SPIDER,” The Astrophysical Journal 812, 176 (2015).
- Everett et al. (2018) W. Everett, P. A. R. Ade, Z. Ahmed, A. J. Anderson, J. E. Austermann, J. S. Avva, R. B. Thakur, A. N. Bender, B. A. Benson, J. E. Carlstrom, F. W. Carter, T. Cecil, C. L. Chang, J. F. Cliche, A. Cukierman, E. V. Denison, T. de Haan, J. Ding, M. A. Dobbs, D. Dutcher, A. Foster, R. N. Gannon, A. Gilbert, J. C. Groh, N. W. Halverson, A. H. Harke-Hosemann, N. L. Harrington, J. W. Henning, G. C. Hilton, W. L. Holzapfel, N. Huang, K. D. Irwin, O. B. Jeong, M. Jonas, T. Khaire, A. M. Kofman, M. Korman, D. Kubik, S. Kuhlmann, C. L. Kuo, A. T. Lee, A. E. Lowitz, S. S. Meyer, D. Michalik, J. Montgomery, A. Nadolski, T. Natoli, H. Nguyen, G. I. Noble, V. Novosad, S. Padin, Z. Pan, J. Pearson, C. M. Posada, A. Rahlin, J. E. Ruhl, L. J. Saunders, J. T. Sayre, I. Shirley, E. Shirokoff, G. Smecher, J. A. Sobrin, A. A. Stark, K. T. Story, A. Suzuki, Q. Y. Tang, K. L. Thompson, C. Tucker, L. R. Vale, K. Vanderlinde, J. D. Vieira, G. Wang, N. Whitehorn, V. Yefremenko, K. W. Yoon, and M. R. Young, “Design and Bolometer Characterization of the SPT-3G First-Year Focal Plane,” J. Low Temp. Phys. 193, 1085–1093 (2018).
- Bock et al. (2009) J. Bock, A. Aljabri, A. Amblard, D. Baumann, M. Betoule, T. Chui, L. Colombo, A. Cooray, D. Crumb, P. Day, C. Dickinson, D. Dowell, M. Dragovan, S. Golwala, K. Gorski, S. Hanany, W. Holmes, K. Irwin, B. Johnson, B. Keating, C.-L. Kuo, A. Lee, A. Lange, C. Lawrence, S. Meyer, N. Miller, H. Nguyen, E. Pierpaoli, N. Ponthieu, J.-L. Puget, J. Raab, P. Richards, C. Satter, M. Seiffert, M. Shimon, H. Tran, B. Williams, and J. Zmuidzinas, “Study of the Experimental Probe of Inflationary Cosmology (EPIC)-Intemediate Mission for NASA’s Einstein Inflation Probe,” (2009), arXiv:0906.1188 [astro-ph].
- LiteBIRD Collaboration et al. (2023) . LiteBIRD Collaboration, E. Allys, K. Arnold, J. Aumont, R. Aurlien, S. Azzoni, C. Baccigalupi, A. J. Banday, R. Banerji, R. B. Barreiro, N. Bartolo, L. Bautista, D. Beck, S. Beckman, M. Bersanelli, F. Boulanger, M. Brilenkov, M. Bucher, E. Calabrese, P. Campeti, A. Carones, F. J. Casas, A. Catalano, V. Chan, K. Cheung, Y. Chinone, S. E. Clark, F. Columbro, G. D’Alessandro, P. de Bernardis, T. de Haan, E. de la Hoz, M. De Petris, S. Della Torre, P. Diego-Palazuelos, M. Dobbs, T. Dotani, J. M. Duval, T. Elleflot, H. K. Eriksen, J. Errard, T. Essinger-Hileman, F. Finelli, R. Flauger, C. Franceschet, U. Fuskeland, M. Galloway, K. Ganga, M. Gerbino, M. Gervasi, R. T. Génova-Santos, T. Ghigna, S. Giardiello, E. Gjerløw, J. Grain, F. Grupp, A. Gruppuso, J. E. Gudmundsson, N. W. Halverson, P. Hargrave, T. Hasebe, M. Hasegawa, M. Hazumi, S. Henrot-Versillé, B. Hensley, L. T. Hergt, D. Herman, E. Hivon, R. A. Hlozek, A. L. Hornsby, Y. Hoshino, J. Hubmayr, K. Ichiki, T. Iida, H. Imada, H. Ishino, G. Jaehnig, N. Katayama, A. Kato, R. Keskitalo, T. Kisner, Y. Kobayashi, A. Kogut, K. Kohri, E. Komatsu, K. Komatsu, K. Konishi, N. Krachmalnicoff, C. L. Kuo, L. Lamagna, M. Lattanzi, A. T. Lee, C. Leloup, F. Levrier, E. Linder, G. Luzzi, J. Macias-Perez, T. Maciaszek, B. Maffei, D. Maino, S. Mandelli, E. Martínez-González, S. Masi, M. Massa, S. Matarrese, F. T. Matsuda, T. Matsumura, L. Mele, M. Migliaccio, Y. Minami, A. Moggi, J. Montgomery, L. Montier, G. Morgante, B. Mot, Y. Nagano, T. Nagasaki, R. Nagata, R. Nakano, T. Namikawa, F. Nati, P. Natoli, S. Nerval, F. Noviello, K. Odagiri, S. Oguri, H. Ohsaki, L. Pagano, A. Paiella, D. Paoletti, A. Passerini, G. Patanchon, F. Piacentini, M. Piat, G. Pisano, G. Polenta, D. Poletti, T. Prouvé, G. Puglisi, D. Rambaud, C. Raum, S. Realini, M. Reinecke, M. Remazeilles, A. Ritacco, G. Roudil, J. A. Rubino-Martin, M. Russell, H. Sakurai, Y. Sakurai, M. Sasaki, D. Scott, Y. Sekimoto, K. Shinozaki, M. Shiraishi, P. Shirron, G. Signorelli, F. Spinella, S. Stever, R. Stompor, S. Sugiyama, R. M. Sullivan, A. Suzuki, T. L. Svalheim, E. Switzer, R. Takaku, H. Takakura, Y. Takase, A. Tartari, Y. Terao, J. Thermeau, H. Thommesen, K. L. Thompson, M. Tomasi, M. Tominaga, M. Tristram, M. Tsuji, M. Tsujimoto, L. Vacher, P. Vielva, N. Vittorio, W. Wang, K. Watanuki, I. K. Wehus, J. Weller, B. Westbrook, J. Wilms, B. Winter, E. J. Wollack, J. Yumoto, and M. Zannoni, “Probing Cosmic Inflation with the LiteBIRD Cosmic Microwave Background Polarization Survey,” Progress of Theoretical and Experimental Physics 2023, 042F01 (2023), arXiv:2202.02773 [astro-ph].
- Meixner et al. (2019) M. Meixner, A. Cooray, D. Leisawitz, J. Staguhn, L. Armus, C. Battersby, J. Bauer, E. Bergin, C. M. Bradford, K. Ennico-Smith, J. Fortney, T. Kataria, G. Melnick, S. Milam, D. Narayanan, D. Padgett, K. Pontoppidan, A. Pope, T. Roellig, K. Sandstrom, K. Stevenson, K. Su, J. Vieira, E. Wright, J. Zmuidzinas, K. Sheth, D. Benford, E. E. Mamajek, S. Neff, E. De Beck, M. Gerin, F. Helmich, I. Sakon, D. Scott, R. Vavrek, M. Wiedner, S. Carey, D. Burgarella, S. H. Moseley, E. Amatucci, R. C. Carter, M. DiPirro, C. Wu, B. Beaman, P. Beltran, J. Bolognese, D. Bradley, J. Corsetti, T. D’Asto, K. Denis, C. Derkacz, C. P. Earle, L. G. Fantano, D. Folta, B. Gavares, J. Generie, L. Hilliard, J. M. Howard, A. Jamil, T. Jamison, C. Lynch, G. Martins, S. Petro, D. Ramspacher, A. Rao, C. Sandin, E. Stoneking, S. Tompkins, and C. Webster, “Origins space telescope mission concept study report,” (2019).
- ori (2021) “Origins space telescope,” Available at htps://asd.gsfc.nasa.gov/firs/docs/ (accessed August 29, 2023) (2021).
- Roelfsema et al. (2018) P. R. Roelfsema, H. Shibai, L. Armus, D. Arrazola, M. Audard, M. D. Audley, C. Bradford, I. Charles, P. Dieleman, Y. Doi, and et al., “Spica—a large cryogenic infrared space telescope: Unveiling the obscured universe,” Publ. Astron. Soc. Aust. 35, e030 (2018).
- Glenn et al. (2021) J. Glenn, C. M. Bradford, E. Rosolowsky, R. Amini, K. Alatalo, L. Armus, A. J. Benson, T.-C. Chang, J. Darling, P. K. Day, J. Domber, D. Farrah, B. Hensley, S. Lipscy, B. Moore, S. Oliver, J. Perido, D. Redding, M. Rodgers, R. Shirley, H. A. Smith, J. B. Steeves, C. Tucker, and J. Zmuidzinas, “Galaxy Evolution Probe,” Journal of Astronomical Telescopes, Instruments, and Systems 7, 034004 (2021), arXiv:2109.00614 [astro-ph.GA] .
- Bradford et al. (2021) C. M. Bradford, B. Cameron, B. Moore, S. Hailey-Dunsheath, E. Amatucci, D. Bradley, J. Corsetti, D. Leisawitz, M. DiPirro, J. Tuttle, A. Brown, D. McBirney, A. Pope, L. Armus, M. Meixner, and K. Pontoppidan, “Origins Survey Spectrometer: revealing the hearts of distant galaxies and forming planetary systems with far-IR spectroscopy,” Journal of Astronomical Telescopes, Instruments, and Systems 7, 011017 (2021).
- Kenyon et al. (2006) M. Kenyon, P. K. Day, C. M. Bradford, J. J. Bock, and H. G. Leduc, “Progress on background-limited membrane-isolated TES bolometers for far-IR/submillimeter spectroscopy,” (Orlando, Florida , USA, 2006) p. 627508.
- Beyer et al. (2012) A. D. Beyer, M. E. Kenyon, P. M. Echternach, T. Chui, B. H. Eom, P. K. Day, J. J. Bock, W. A. Holmes, and C. M. Bradford, “Ultra-sensitive Transition-Edge Sensors for the Background Limited Infrared/Sub-mm Spectrograph (BLISS),” J. Low Temp. Phys. 167, 182–187 (2012).
- Beyer et al. (2014) A. D. Beyer, M. E. Kenyon, B. Bumble, M. C. Runyan, P. E. Echternach, W. A. Holmes, J. J. Bock, and C. M. Bradford, “Comparing Transition-Edge Sensor Response Times in a Modified Contact Scheme with Different Support Beams,” J. Low Temp. Phys. 176, 299–303 (2014).
- Kenyon et al. (2014) M. Kenyon, A. D. Beyer, B. Bumble, P. M. Echternach, W. A. Holmes, and C. M. Bradford, “Toward a detector/readout architecture for the background-limited far-ir/submm spectrograph (bliss),” J. Low Temp. Phys. 176, 376–382 (2014).
- Irwin (1995) K. D. Irwin, “An application of electrothermal feedback for high resolution cryogenic particle detection,” Appl. Phys. Lett. 66, 1998–2000 (1995).
- Irwin et al. (1997) K. D. Irwin, E. N. Grossman, C. Reintsema, and J. M. Martinis, “Multiplexed SQUID Readout of Large Format Superconducting Bolometer Arrays,” in APS March Meeting Abstracts, APS Meeting Abstracts (1997) p. F20.05.
- Audley et al. (2016) M. D. Audley, G. de Lange, J.-R. Gao, P. Khosropanah, R. Hijmering, M. Ridder, P. D. Mauskopf, D. Morozov, N. A. Trappe, and S. Doherty, “Optical performance of an ultra-sensitive horn-coupled transition-edge-sensor bolometer with hemispherical backshort in the far infrared,” Rev. Sci. Instrum. 87, 043103 (2016), arXiv:1603.07944 [astro-ph.IM] .
- Khosropanah et al. (2016) P. Khosropanah, T. Suzuki, M. L. Ridder, R. A. Hijmering, H. Akamatsu, L. Gottardi, J. van der Kuur, J. R. Gao, and B. D. Jackson, “Ultra-low noise TES bolometer arrays for SAFARI instrument on SPICA,” in Millimeter, Submillimeter, and Far-Infrared Detectors and Instrumentation for Astronomy VIII, Society of Photo-Optical Instrumentation Engineers (SPIE) Conference Series, Vol. 9914, edited by W. S. Holland and J. Zmuidzinas (2016) p. 99140B.
- Ridder et al. (2016) M. L. Ridder, P. Khosropanah, R. A. Hijmering, T. Suzuki, M. P. Bruijn, H. F. C. Hoevers, J. R. Gao, and M. R. Zuiddam, “Fabrication of Low-Noise TES Arrays for the SAFARI Instrument on SPICA,” J. Low Temp. Phys. 184, 60–65 (2016).
- Suzuki et al. (2016) T. Suzuki, P. Khosropanah, M. L. Ridder, R. A. Hijmering, J. R. Gao, H. Akamatsu, L. Gottardi, J. van der Kuur, and B. D. Jackson, “Development of Ultra-Low-Noise TES Bolometer Arrays,” J. Low Temp. Phys. 184, 52–59 (2016).
- van der Kuur et al. (2011) J. van der Kuur, L. Gottardi, M. P. Borderias, B. Dirks, P. de Korte, M. Lindeman, P. Khosropanah, R. den Hartog, and H. Hoevers, “Small-Signal Behavior of a TES Under AC Bias,” IEEE Trans. Appl. Supercond. 21, 281–284 (2011).
- Hijmering et al. (2016) R. A. Hijmering, R. den Hartog, M. Ridder, A. J. van der Linden, J. van der Kuur, J. R. Gao, and B. Jackson, “Readout of a 176 pixel FDM system for SAFARI TES arrays,” in Millimeter, Submillimeter, and Far-Infrared Detectors and Instrumentation for Astronomy VIII, Society of Photo-Optical Instrumentation Engineers (SPIE) Conference Series, Vol. 9914, edited by W. S. Holland and J. Zmuidzinas (2016) p. 99141C.
- Beyer et al. (2010) A. D. Beyer, M. E. Kenyon, P. M. Echternach, B.-H. Eom, J. Bueno, P. K. Day, J. J. Bock, and C. M. Bradford, “Characterizing Si x N y absorbers and support beams for far-infrared/submillimeter transition-edge sensors,” (San Diego, California, USA, 2010) p. 774121.
- ld_(2019) “LD dilution refrigerator measurement system,” Available at https://bluefors.com/products/ld-dilution-refrigerator/ (accessed August 25, 2022) (2019).
- lak (2023) “Model 372 AC Resistance Bridge,” Available at https://lakeshore.com/products/categories/overview/temperature-products/ac-resistance-bridges/model-372-ac-resistance- bridge-temperature-controller (accessed July 31, 2023) (2023).
- afg (2022) “AFG31000,” Available at https://www.tek.com/en/products/signal-generators/arbitrary-function-generator/afg31000 (accessed August 25, 2022) (2022).
- int (2022) “Integrated Two-Stage Current Sensors - Magnicon Research and Instrumentation - SQUID electronics, SQUID sensors, SQUID systems,” Available at http://www.magnicon.com/squid-sensors/integrated-two-stage-current-sensors (accessed September 21, 2022) (2022).
- xxf (2011) “XXF-1 - Magnicon Research and Instrumentation - SQUID electronics, SQUID sensors, SQUID systems,” Available at http://www.magnicon.com/squid-electronics/xxf-1 (accessed August 25, 2022) (2011).
- pic (2022) “PicoScope 6000E Series oscilloscopes,” Available at https://www.picotech.com/oscilloscope/6000/picoscope-6000-overview (accessed August 25, 2022) (2022).
- van der Kuur et al. (2004) J. van der Kuur, P. de Korte, P. de Groene, N. Baars, M. Lubbers, and M. Kiviranta, “Implementation of frequency domain multiplexing in imaging arrays of microcalorimeters,” Nuclear Instruments and Methods in Physics Research Section A: Accelerators, Spectrometers, Detectors and Associated Equipment 520, 551 – 554 (2004), proceedings of the 10th International Workshop on Low Temperature Detectors.
- Hijmering et al. (2014) R. A. Hijmering, R. H. den Hartog, A. J. van der Linden, M. Ridder, M. P. Bruijn, J. van der Kuur, B. J. van Leeuwen, P. van Winden, and B. Jackson, “The 160 TES bolometer read-out using FDM for SAFARI,” (Montréal, Quebec, Canada, 2014) p. 91531E.
- tho (2022a) “Thorlabs - S5FC1550S-A2 SM Benchtop SLD Source, 1550 nm, 2.5 mW, 90 nm Bandwidth,” Available at https://www.thorlabs.com/thorproduct.cfm?partnumber=S5FC1550S-A2 (accessed September 21, 2022) (2022a).
- Zmuidzinas (2003) J. Zmuidzinas, “Thermal noise and correlations in photon detection,” Appl. Opt. 42, 4989 (2003).
- tho (2022b) “Thorlabs - S3FC1550 DFB Benchtop Laser Source, 1550 nm, 1.5 mW, FC/PC,” Available at https://www.thorlabs.com/thorproduct.cfm?partnumber=S3FC1550 (accessed September 21, 2022) (2022b).
- Chuss et al. (2017) D. T. Chuss, K. Rostem, E. J. Wollack, L. Berman, F. Colazo, M. DeGeorge, K. Helson, and M. Sagliocca, “A cryogenic thermal source for detector array characterization,” Rev. Sci. Instrum. 88, 104501 (2017), publisher: American Institute of Physics.
- Battistelli et al. (2008) E. S. Battistelli, M. Amiri, B. Burger, M. Halpern, S. Knotek, M. Ellis, X. Gao, D. Kelly, M. MacIntosh, K. Irwin, and C. Reintsema, “Functional Description of Read-out Electronics for Time-Domain Multiplexed Bolometers for Millimeter and Sub-millimeter Astronomy,” J. Low Temp. Phys. 151, 908–914 (2008).