Less is More for Long Document Summary Evaluation by LLMs
Abstract
Large Language Models (LLMs) have shown promising performance in summary evaluation tasks, yet they face challenges such as high computational costs and the Lost-in-the-Middle problem where important information in the middle of long documents is often overlooked. To address these issues, this paper introduces a novel approach, Extract-then-Evaluate, which involves extracting key sentences from a long source document and then evaluating the summary by prompting LLMs. The results reveal that the proposed method not only significantly reduces evaluation costs but also exhibits a higher correlation with human evaluations. Furthermore, we provide practical recommendations for optimal document length and sentence extraction methods, contributing to the development of cost-effective yet more accurate methods for LLM-based text generation evaluation.111The code is available at https://github.com/megagonlabs/llm-longeval
1 Introduction
The evaluation of text generation plays a crucial role in the development of high-quality text generation systems Celikyilmaz et al. (2020). However, the alignment of automatic evaluation metrics with human judgment remains a challenging task Bhandari et al. (2020); Fabbri et al. (2021). Recently, large language models (LLMs) have shown promising results in this regard Chiang and Lee (2023); Liu et al. (2023b); Fu et al. (2023), demonstrating a strong correlation with human evaluations. Despite their effectiveness, they face challenges such as high computational cost and the Lost-in-the-middle problem Liu et al. (2023a) where important information in the middle of long documents is often overlooked for long document summary evaluation.
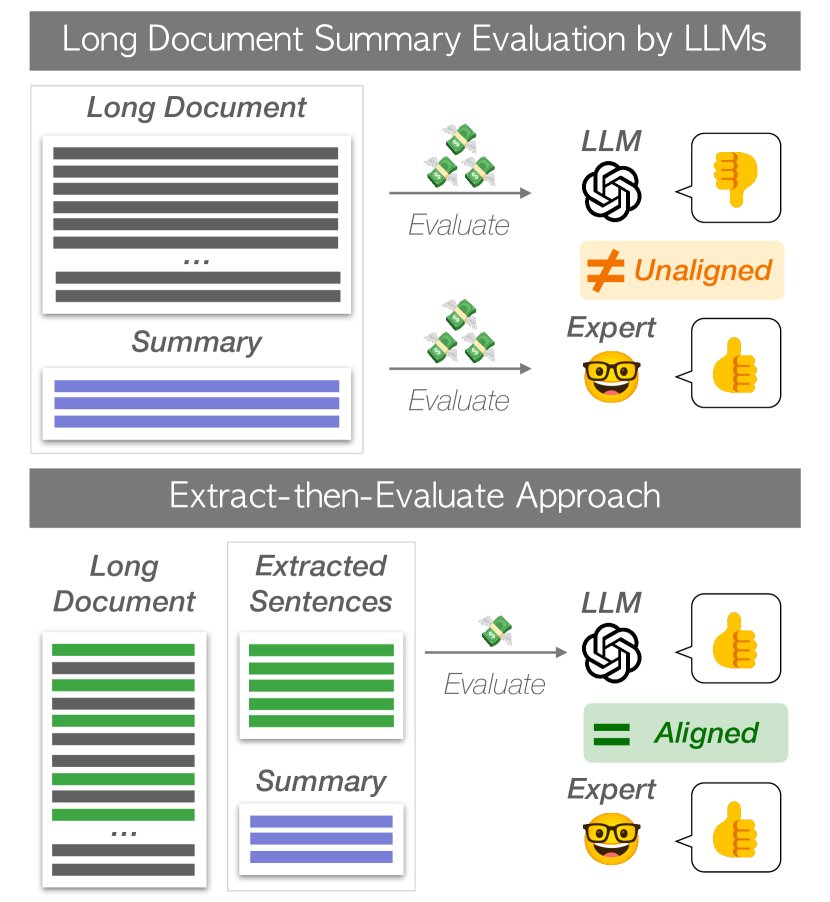
In this paper, we propose a simple yet effective approach to address these issues, which we refer to as the Extract-then-Evaluate. This method involves extracting important sentences from a long source document and concatenating them until the extracted document reaches a pre-defined length. Then, we evaluate the quality of the summary with regard to the extracted document using LLMs. We experiment with various sentence extraction methods—covering both matching- and model-based approaches—including LEAD, ROUGE, BERTScore, and NLI, and evaluate their performance on arXiv, GovReport, PubMed, and SQuALITY datasets Koh et al. (2022); Krishna et al. (2023).
Our contributions are as follows:
-
•
Develops cost-effective and efficient methods for text generation evaluation.
-
•
Reduces evaluation costs and exhibits a higher correlation with human evaluations.
-
•
Provides practical recommendations for optimal document length and sentence extraction methods.
2 Methods
Summarization evaluation metrics assign a rating to a model-generated summary . The higher the correlation between this score and the human judgment score , the better the evaluation metric is. To assign a rating , existing studies use either the reference summary or the input document , as well as the generated summary .
To use LLMs as evaluators, previous approaches commonly use the model-generated summaries , and the source document as inputs, where , but the Extract-then-Evaluate method comprises two steps to use LLMs as illustrated in Figure 1: (1) Extract important sentences for summary evaluation from the long source document until it reaches the pre-defined length , and compose a short but information-dense document . (2) Evaluate the quality of the summary by prompting LLMs Liu et al. (2023b). Design prompts 222All prompts used are listed in the Appendix. that can take both the extracted source document and summary as inputs and generate a rating scale as output:
To extract sentences, we considered the following approaches:
-
•
LEAD: Extract the first tokens from . This is considered a strong baseline for extractive summarization See et al. (2017).
-
•
ROUGE: Extract sentences from that maximize recall of ROUGE score Lin (2004) with until it reaches tokens.333https://github.com/Diego999/py-rouge
-
•
BERTScore: Extract sentences as in ROUGE, but use the recall of BERTScore Zhang et al. (2020) as the criteria.
-
•
NLI: Extract sentences that are entailed or contradicted by each sentence in as premises using NLI models Reimers and Gurevych (2019) until it reaches tokens. This process aims to extract sentences that are semantically relevant to the summary.
The source document is divided into sentences; then, important sentences are extracted based on the criteria above; if the extracted sentences reach the predefined length limit, they are rearranged to match the order in the source document.
| #instance | Document avg length | Summary avg length | |
|---|---|---|---|
| arXiv | 204 | 5723 | 178 |
| GovReport | 204 | 8553 | 500 |
| PubMed | 40 | 7333 | 403 |
| SQuALITY | 40 | 4331 | 236 |
| Consistency | Relevance | Faithfulness | ||||||||||||||||
| arXiv | GovReport | arXiv | GovReport | PubMed | SQuALITY | |||||||||||||
| Methods | ||||||||||||||||||
| Reference-based metrics | ||||||||||||||||||
| ROUGE-1 | -0.08 | -0.13 | - | -0.12 | -0.11 | - | 0.29 | 0.25 | - | 0.53 | 0.52 | - | 0.32 | 0.30 | - | -0.33 | -0.13 | - |
| BERTScore | -0.09 | -0.10 | - | 0.00 | -0.04 | - | 0.22 | 0.18 | - | 0.38 | 0.38 | - | 0.49 | 0.49 | - | -0.12 | 0.02 | - |
| BARTScore | 0.32 | 0.36 | - | 0.51 | 0.48 | - | 0.00 | 0.03 | - | 0.18 | 0.24 | - | 0.49 | 0.47 | - | -0.06 | -0.17 | - |
| Reference-free metrics | ||||||||||||||||||
| FactCC | 0.22 | 0.19 | - | 0.28 | 0.27 | - | 0.13 | 0.13 | - | 0.05 | 0.04 | - | -0.09 | -0.14 | - | 0.13 | 0.14 | - |
| SummaC | 0.32 | 0.32 | - | 0.39 | 0.38 | - | 0.09 | 0.08 | - | 0.05 | 0.04 | - | 0.51 | 0.55 | - | 0.18 | 0.24 | - |
| Reference-free metrics with LLM (ours) | ||||||||||||||||||
| Full document | 0.61 | 0.46 | $0.15 | 0.33 | 0.34 | $0.10 | 0.58 | 0.52 | $0.15 | 0.12 | 0.11 | $0.10 | 0.64 | 0.70 | $0.11 | 0.51 | 0.38 | $0.14 |
| Best extraction | 0.71 | 0.50 | $0.05 | 0.62 | 0.60 | $0.09 | 0.63 | 0.58 | $0.07 | 0.36 | 0.40 | $0.07 | 0.76 | 0.80 | $0.07 | 0.85 | 0.81 | $0.04 |
| Pareto efficient | 0.71 | 0.50 | $0.05 | 0.60 | 0.61 | $0.05 | 0.55 | 0.48 | $0.04 | 0.37 | 0.37 | $0.05 | 0.75 | 0.75 | $0.05 | 0.85 | 0.81 | $0.04 |
3 Experiments
3.1 Settings
This study meta-evaluates automatic evaluation metrics for summarization by assessing their alignment with human judgment. Specifically, each metric assigns a numerical score to the model-generated summary and measures its Pearson correlation and Spearman’s rank correlation with the human evaluation score to measure the alignment. We also calculated the average evaluation cost of using LLMs to investigate the efficiency of our method to see how much we can save with our method.444Calculated as $0.03 per 1k tokens of input. For the meta-evaluation, we used the following datasets: arXiv Cohan et al. (2018) and GovReport Huang et al. (2021), scientific and general domain of summarization datasets, respectively, with human evaluations of Consistency and Relevance collected by Koh et al. (2022). PubMed Cohan et al. (2018) and SQuALITY Wang et al. (2022), biomedical science and story domain of summarization datasets, with human evaluations of Faithfullness collected by Krishna et al. (2023).555We found an issue in the original evaluation, so the baseline correlation such as ROUGE-1 is inconsistent with the original paper. Please refer to the Appendix for more details. We used fine-grained faithfulness scores as human judgments. Table 1 shows the statistics of the datasets.
3.2 Implementation Details
We used GPT-4 OpenAI (2023) as our evaluator Liu et al. (2023b).666gpt-4-0613 checkpoint is used. See Appendix C for reasons to use GPT4. As described in §2, we design prompts based on the definition of each evaluation criterion and derive rating scales that evaluate the summary with deterministic predictions.777This setting is slightly different from that of Liu et al. (2023b); more details in the Appendix. Note that at the time of submission, access to GPT4 with 32k was not permitted, so if the prompt was longer 8k tokens, we truncated the source document to meet the length limit.
For sentence extraction, we experimented with 128, 256, 512, 768, 1024, 1536, 2048, and 4096 tokens, as the length limit of the extracted source document. For the ROUGE-based sentence extraction, we used recall of ROUGE-1, ROUGE-2, and the sum of them (ROUGE-1+2). For the BERTScore, we used DeBERTa-Large model He et al. (2021) fine-tuned on MNLI Williams et al. (2018).888https://huggingface.co/microsoft/deberta-large-mnli For the NLI, we used DeBERTa-base model fine-tuned on SNLI Bowman et al. (2015) and MNLI Williams et al. (2018).999https://huggingface.co/cross-encoder/nli-deberta-v3-base
3.3 Baselines
For the baseline, we use two groups of metrics: reference-based and reference-free. For the reference-based metrics, we use ROUGE-1 F1 Lin (2004), BERTScore Zhang et al. (2020), and BARTScore Yuan et al. (2021). For the reference-free metrics, we use FactCC Kryscinski et al. (2020), and SummaC Laban et al. (2022). Also, we use the LLM-based evaluation without sentence extraction as a baseline (Full document).
3.4 Results
Due to space constraints, we only provide results for two of our variations in Table 2: Best extraction, yielding the highest correlation among all variations, and Pareto efficient, which is a cost-effective approach, offering the highest correlation with the input extracted source document length under 1024 tokens. Results for all variations are shown in Table 3 in the Appendix.
First, LLM mostly showed a significant improvement in correlation with human judgment compared to the non-LLM baselines. However, the evaluation costs definitely increased due to the entire prompt length (Full document).
Next, we observed that extracting information from the source document and then evaluating it not only lowers costs but also improves performance (Best Extraction). This could be attributed to the Lost-in-the-middle Liu et al. (2023a), where LLMs struggle to efficiently use important information in the middle of long documents. In other words, LLMs would better understand shorter but more informative documents for evaluation. Note that this observation is not limited to the best extraction setting; we have observed a trend where performance increases as the size of the document decreases.
Finally, even when evaluated on a limited budget, we confirmed comparable performance to the highest performance settings (Pareto Efficient). Specifically, for the consistency of GovReport data, our approach demonstrated similar performance to the best extraction option while reducing costs by half.
4 Discussion
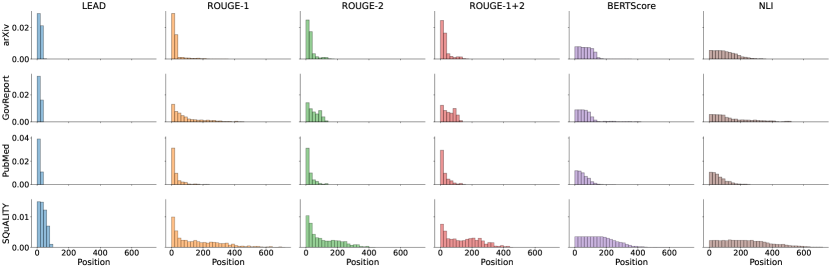
How are extracted sentences distributed?
We analyzed the positions of sentences extracted by each method. Figure 2 displays the distribution of sentence positions when limiting the length to 1024 tokens. For the scientific domain (i.e., arXiv and PubMed), ROUGE-based methods tend to extract sentences from positions similar to the LEAD, suggesting that important information is mostly located at the beginning of these documents.
In contrast, for the general domain (i.e., GovReport and SQuALITY), ROUGE-based methods tend to extract sentences not only from the beginning but also from various positions throughout documents, indicating that important information might be distributed throughout documents. Meanwhile, model-based methods (i.e., BERTScore and NLI) extract sentences from various positions within the document, regardless of the dataset.
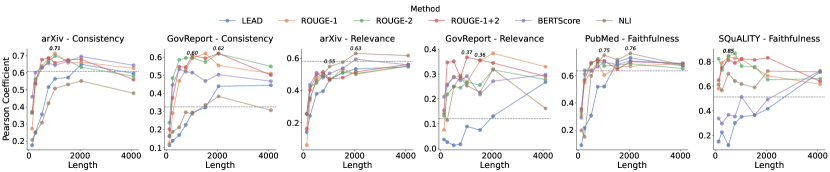
How long is the optimal document length?
Figure 3 shows the relationship between Pearson correlation and the length of documents for various datasets and evaluation criteria. The dashed lines correspond to the Full document setting. We observed a strong correlation within the document length range of 1000 to 2000 tokens across all datasets. Notably, extracted documents should generally be longer than the summaries, while long documents pose the Lost-in-the-Middle challenges for LLMs Liu et al. (2023a), causing the correlation curves to initially rise and then decline.
Which sentence extraction method is the best?
As shown in Figure 3 (more detailed numbers can be found in Table 3 in the Appendix), the best extraction settings differ for each data and evaluation criteria: LEAD consistently shows a lower correlation than the other methods, while the BERTScore and NLI are mixed across data and criteria. However, the ROUGE-based methods consistently show high correlations regardless of data and criteria.
Practical Recommendations:
To summarize the discussion above, we offer the following recommendations: (1) Prompting the LLM demonstrates a strong correlation with human judgment in summary evaluation, although it’s not imperative to utilize the entire source document if it’s too long. (2) Our experiments indicate that the source document’s length should ideally range from 1000 to 2000 tokens, and it should surpass the length of the summary. (3) To extract sentences for evaluation, the ROUGE-based method proves to be a straightforward yet highly effective approach.
5 Conclusion
In this study, we proposed the Extract-then-Evaluate method for evaluating long document summaries using LLMs. Our findings demonstrated that this approach not only reduces evaluation costs but also aligns more closely with human evaluations compared to existing automatic metrics. Furthermore, we provided practical recommendations for optimal document length and sentence extraction methods, contributing to the development of more efficient and cost-effective methods for text generation evaluation using LLMs.
Limitations
While our method achieves superior performance, it still suffers from several limitations. Previous works (Liu et al., 2023b; Deutsch et al., 2022) suggest that LLM-based evaluators introduce bias toward model-generated text, affecting their reliability to assess the quality of summaries fairly.
In this work, we mainly focus on one LLM-based evaluator utilizing GPT-4 & GPT-3.5 due to our limited budget and computational resources. Also, we rely on correlation with human annotations to evaluate the quality of metrics, which is shown to be not very reliable specifically for long document summarization (Krishna et al., 2023). Further investigation of the Extract-then-Evaluate impact on other LLM-based evaluators and introduction of better evaluation methodology remains an open venue for future works
References
- Adams et al. (2023) Griffin Adams, Jason Zucker, and Noémie Elhadad. 2023. A meta-evaluation of faithfulness metrics for long-form hospital-course summarization. arXiv preprint arXiv:2303.03948.
- Beltagy et al. (2020) Iz Beltagy, Matthew E Peters, and Arman Cohan. 2020. Longformer: The long-document transformer. arXiv preprint arXiv:2004.05150.
- Bhandari et al. (2020) Manik Bhandari, Pranav Narayan Gour, Atabak Ashfaq, Pengfei Liu, and Graham Neubig. 2020. Re-evaluating evaluation in text summarization. In Proceedings of the 2020 Conference on Empirical Methods in Natural Language Processing (EMNLP), pages 9347–9359, Online. Association for Computational Linguistics.
- Bowman et al. (2015) Samuel R. Bowman, Gabor Angeli, Christopher Potts, and Christopher D. Manning. 2015. A large annotated corpus for learning natural language inference. In Proceedings of the 2015 Conference on Empirical Methods in Natural Language Processing, pages 632–642, Lisbon, Portugal. Association for Computational Linguistics.
- Celikyilmaz et al. (2020) Asli Celikyilmaz, Elizabeth Clark, and Jianfeng Gao. 2020. Evaluation of text generation: A survey. arXiv preprint arXiv:2006.14799.
- Chiang and Lee (2023) Cheng-Han Chiang and Hung-yi Lee. 2023. Can large language models be an alternative to human evaluations? In Proceedings of the 61st Annual Meeting of the Association for Computational Linguistics (Volume 1: Long Papers), pages 15607–15631, Toronto, Canada. Association for Computational Linguistics.
- Cohan et al. (2018) Arman Cohan, Franck Dernoncourt, Doo Soon Kim, Trung Bui, Seokhwan Kim, Walter Chang, and Nazli Goharian. 2018. A discourse-aware attention model for abstractive summarization of long documents. In Proceedings of the 2018 Conference of the North American Chapter of the Association for Computational Linguistics: Human Language Technologies, Volume 2 (Short Papers), pages 615–621, New Orleans, Louisiana. Association for Computational Linguistics.
- Dao et al. (2022) Tri Dao, Dan Fu, Stefano Ermon, Atri Rudra, and Christopher Ré. 2022. Flashattention: Fast and memory-efficient exact attention with io-awareness. In Advances in Neural Information Processing Systems, volume 35, pages 16344–16359. Curran Associates, Inc.
- Deutsch et al. (2022) Daniel Deutsch, Rotem Dror, and Dan Roth. 2022. On the limitations of reference-free evaluations of generated text. In Proceedings of the 2022 Conference on Empirical Methods in Natural Language Processing, pages 10960–10977, Abu Dhabi, United Arab Emirates. Association for Computational Linguistics.
- Fabbri et al. (2021) Alexander R. Fabbri, Wojciech Kryściński, Bryan McCann, Caiming Xiong, Richard Socher, and Dragomir Radev. 2021. SummEval: Re-evaluating summarization evaluation. Transactions of the Association for Computational Linguistics, 9:391–409.
- Fu et al. (2023) Jinlan Fu, See-Kiong Ng, Zhengbao Jiang, and Pengfei Liu. 2023. GPTScore: Evaluate as you desire. arXiv preprint arXiv:2302.04166.
- Gu et al. (2022) Albert Gu, Karan Goel, and Christopher Re. 2022. Efficiently modeling long sequences with structured state spaces. In International Conference on Learning Representations.
- He et al. (2021) Pengcheng He, Xiaodong Liu, Jianfeng Gao, and Weizhu Chen. 2021. DeBERTa: Decoding-enhanced BERT with Disentangled Attention. In International Conference on Learning Representations.
- Huang et al. (2021) Luyang Huang, Shuyang Cao, Nikolaus Parulian, Heng Ji, and Lu Wang. 2021. Efficient attentions for long document summarization. In Proceedings of the 2021 Conference of the North American Chapter of the Association for Computational Linguistics: Human Language Technologies, pages 1419–1436, Online. Association for Computational Linguistics.
- Jiang et al. (2023) Albert Q. Jiang, Alexandre Sablayrolles, Arthur Mensch, Chris Bamford, Devendra Singh Chaplot, Diego de las Casas, Florian Bressand, Gianna Lengyel, Guillaume Lample, Lucile Saulnier, Lélio Renard Lavaud, Marie-Anne Lachaux, Pierre Stock, Teven Le Scao, Thibaut Lavril, Thomas Wang, Timothée Lacroix, and William El Sayed. 2023. Mistral 7b.
- Koh et al. (2022) Huan Yee Koh, Jiaxin Ju, He Zhang, Ming Liu, and Shirui Pan. 2022. How far are we from robust long abstractive summarization? In Proceedings of the 2022 Conference on Empirical Methods in Natural Language Processing, pages 2682–2698, Abu Dhabi, United Arab Emirates. Association for Computational Linguistics.
- Krishna et al. (2023) Kalpesh Krishna, Erin Bransom, Bailey Kuehl, Mohit Iyyer, Pradeep Dasigi, Arman Cohan, and Kyle Lo. 2023. LongEval: Guidelines for human evaluation of faithfulness in long-form summarization. In Proceedings of the 17th Conference of the European Chapter of the Association for Computational Linguistics, pages 1650–1669, Dubrovnik, Croatia. Association for Computational Linguistics.
- Kryscinski et al. (2020) Wojciech Kryscinski, Bryan McCann, Caiming Xiong, and Richard Socher. 2020. Evaluating the factual consistency of abstractive text summarization. In Proceedings of the 2020 Conference on Empirical Methods in Natural Language Processing (EMNLP), pages 9332–9346, Online. Association for Computational Linguistics.
- Laban et al. (2022) Philippe Laban, Tobias Schnabel, Paul N. Bennett, and Marti A. Hearst. 2022. SummaC: Re-visiting NLI-based models for inconsistency detection in summarization. Transactions of the Association for Computational Linguistics, 10:163–177.
- Lin (2004) Chin-Yew Lin. 2004. ROUGE: A package for automatic evaluation of summaries. In Text Summarization Branches Out, pages 74–81, Barcelona, Spain. Association for Computational Linguistics.
- Liu et al. (2023a) Nelson F Liu, Kevin Lin, John Hewitt, Ashwin Paranjape, Michele Bevilacqua, Fabio Petroni, and Percy Liang. 2023a. Lost in the middle: How language models use long contexts. arXiv preprint arXiv:2307.03172.
- Liu et al. (2023b) Yang Liu, Dan Iter, Yichong Xu, Shuohang Wang, Ruochen Xu, and Chenguang Zhu. 2023b. G-eval: NLG evaluation using gpt-4 with better human alignment. In Proceedings of the 2023 Conference on Empirical Methods in Natural Language Processing, pages 2511–2522, Singapore. Association for Computational Linguistics.
- OpenAI (2023) OpenAI. 2023. GPT-4 Technical Report. arXiv preprint arXiv:2303.08774.
- Reimers and Gurevych (2019) Nils Reimers and Iryna Gurevych. 2019. Sentence-BERT: Sentence embeddings using Siamese BERT-networks. In Proceedings of the 2019 Conference on Empirical Methods in Natural Language Processing and the 9th International Joint Conference on Natural Language Processing (EMNLP-IJCNLP), pages 3982–3992, Hong Kong, China. Association for Computational Linguistics.
- See et al. (2017) Abigail See, Peter J. Liu, and Christopher D. Manning. 2017. Get to the point: Summarization with pointer-generator networks. In Proceedings of the 55th Annual Meeting of the Association for Computational Linguistics (Volume 1: Long Papers), pages 1073–1083, Vancouver, Canada. Association for Computational Linguistics.
- Wang et al. (2022) Alex Wang, Richard Yuanzhe Pang, Angelica Chen, Jason Phang, and Samuel R. Bowman. 2022. SQuALITY: Building a long-document summarization dataset the hard way. In Proceedings of the 2022 Conference on Empirical Methods in Natural Language Processing, pages 1139–1156, Abu Dhabi, United Arab Emirates. Association for Computational Linguistics.
- Williams et al. (2018) Adina Williams, Nikita Nangia, and Samuel Bowman. 2018. A broad-coverage challenge corpus for sentence understanding through inference. In Proceedings of the 2018 Conference of the North American Chapter of the Association for Computational Linguistics: Human Language Technologies, Volume 1 (Long Papers), pages 1112–1122, New Orleans, Louisiana. Association for Computational Linguistics.
- Yuan et al. (2021) Weizhe Yuan, Graham Neubig, and Pengfei Liu. 2021. Bartscore: Evaluating generated text as text generation. In Advances in Neural Information Processing Systems, volume 34, pages 27263–27277. Curran Associates, Inc.
- Zhang et al. (2020) Tianyi Zhang, Varsha Kishore, Felix Wu, Kilian Q. Weinberger, and Yoav Artzi. 2020. Bertscore: Evaluating text generation with bert. In International Conference on Learning Representations.
Appendix A List of the Prompts
Appendix B Correlation performance between human ratings and model-based scoring
| Consistency | Relevance | Faithfulness | |||||||||||
|---|---|---|---|---|---|---|---|---|---|---|---|---|---|
| arXiv | GovReport | arXiv | GovReport | PubMed | SQuALITY | ||||||||
| Methods | Length | ||||||||||||
| LEAD | 128 | 0.1759 | 0.1104 | 0.1135 | 0.1075 | 0.1412 | 0.1542 | 0.0358 | 0.0249 | 0.0881 | 0.0483 | 0.1496 | 0.1234 |
| 256 | 0.2526 | 0.1834 | 0.1384 | 0.1261 | 0.2420 | 0.2097 | 0.0253 | 0.0221 | 0.2157 | 0.1749 | 0.2256 | 0.2995 | |
| 512 | 0.3566 | 0.2434 | 0.1701 | 0.1340 | 0.3785 | 0.3173 | 0.0127 | 0.0064 | 0.3057 | 0.3488 | 0.1200 | 0.2246 | |
| 768 | 0.5161 | 0.4190 | 0.2262 | 0.1917 | 0.3951 | 0.3399 | 0.0167 | 0.0248 | 0.5184 | 0.5199 | 0.3001 | 0.3646 | |
| 1024 | 0.5650 | 0.4424 | 0.2938 | 0.2876 | 0.4657 | 0.3853 | 0.0885 | 0.0937 | 0.5199 | 0.5479 | 0.3514 | 0.3718 | |
| 1536 | 0.5722 | 0.4940 | 0.3216 | 0.3319 | 0.5094 | 0.4242 | 0.0741 | 0.0844 | 0.7009 | 0.7336 | 0.3636 | 0.3881 | |
| 2048 | 0.6493 | 0.5352 | 0.4390 | 0.4586 | 0.5332 | 0.4443 | 0.1300 | 0.1263 | 0.7313 | 0.7478 | 0.4162 | 0.4853 | |
| 4096 | 0.5963 | 0.4433 | 0.4445 | 0.4413 | 0.5471 | 0.4864 | 0.2670 | 0.2883 | 0.6704 | 0.6905 | 0.7156 | 0.4996 | |
| ROUGE-1 | 128 | 0.2727 | 0.2036 | 0.1242 | 0.0946 | 0.0596 | -0.0024 | 0.0741 | 0.0687 | 0.3127 | 0.2706 | 0.5793 | 0.4068 |
| 256 | 0.5305 | 0.3803 | 0.2909 | 0.2767 | 0.3389 | 0.1939 | 0.2584 | 0.2406 | 0.5484 | 0.5938 | 0.7881 | 0.6592 | |
| 512 | 0.6393 | 0.4290 | 0.4690 | 0.4581 | 0.4810 | 0.3759 | 0.2864 | 0.3109 | 0.6385 | 0.6715 | 0.8381 | 0.7709 | |
| 768 | 0.6818 | 0.4349 | 0.5315 | 0.5302 | 0.5018 | 0.4170 | 0.2952 | 0.2932 | 0.6958 | 0.7140 | 0.8259 | 0.7279 | |
| 1024 | 0.7134 | 0.4964 | 0.5940 | 0.5785 | 0.4638 | 0.3543 | 0.2652 | 0.2961 | 0.6040 | 0.6559 | 0.8167 | 0.6936 | |
| 1536 | 0.6586 | 0.4603 | 0.6206 | 0.5963 | 0.5332 | 0.4555 | 0.3536 | 0.3374 | 0.6613 | 0.6835 | 0.7501 | 0.5840 | |
| 2048 | 0.6616 | 0.4676 | 0.5541 | 0.5562 | 0.4996 | 0.4250 | 0.3830 | 0.3563 | 0.6688 | 0.7110 | 0.6847 | 0.5560 | |
| 4096 | 0.6264 | 0.4463 | 0.5094 | 0.4914 | 0.5526 | 0.4759 | 0.3293 | 0.3174 | 0.6883 | 0.7080 | 0.6154 | 0.3281 | |
| ROUGE-2 | 128 | 0.3640 | 0.2426 | 0.2382 | 0.2110 | 0.2548 | 0.0628 | 0.1317 | 0.1349 | 0.3370 | 0.3906 | 0.8219 | 0.7283 |
| 256 | 0.5620 | 0.3608 | 0.4845 | 0.4659 | 0.4221 | 0.2972 | 0.2174 | 0.1720 | 0.6111 | 0.5874 | 0.7299 | 0.6378 | |
| 512 | 0.6274 | 0.3864 | 0.5855 | 0.5769 | 0.4460 | 0.3334 | 0.2495 | 0.2276 | 0.6859 | 0.7119 | 0.8461 | 0.8067 | |
| 768 | 0.6673 | 0.3888 | 0.5952 | 0.5781 | 0.4881 | 0.3950 | 0.2446 | 0.2799 | 0.7222 | 0.7627 | 0.8658 | 0.7526 | |
| 1024 | 0.6975 | 0.4482 | 0.5959 | 0.6117 | 0.4712 | 0.3651 | 0.2673 | 0.3098 | 0.6708 | 0.7030 | 0.7624 | 0.6763 | |
| 1536 | 0.6707 | 0.3924 | 0.5727 | 0.5589 | 0.5120 | 0.4198 | 0.2556 | 0.2738 | 0.6770 | 0.7108 | 0.7576 | 0.6844 | |
| 2048 | 0.6322 | 0.4135 | 0.6194 | 0.5883 | 0.5043 | 0.4197 | 0.3171 | 0.2872 | 0.6876 | 0.7043 | 0.6524 | 0.5210 | |
| 4096 | 0.5794 | 0.3844 | 0.5484 | 0.5230 | 0.5509 | 0.4734 | 0.2771 | 0.2545 | 0.6523 | 0.6983 | 0.6600 | 0.4149 | |
| ROUGE-1+2 | 128 | 0.3705 | 0.2235 | 0.2013 | 0.1525 | 0.1618 | -0.0189 | 0.1535 | 0.1480 | 0.3553 | 0.3485 | 0.6482 | 0.6282 |
| 256 | 0.5397 | 0.3581 | 0.3744 | 0.3623 | 0.4019 | 0.2792 | 0.3470 | 0.3054 | 0.5670 | 0.5980 | 0.7501 | 0.6522 | |
| 512 | 0.6770 | 0.4224 | 0.5473 | 0.5205 | 0.4998 | 0.3954 | 0.3508 | 0.3332 | 0.6953 | 0.7095 | 0.8110 | 0.6452 | |
| 768 | 0.6865 | 0.4310 | 0.5450 | 0.5303 | 0.5147 | 0.4219 | 0.2858 | 0.2974 | 0.7148 | 0.7441 | 0.7881 | 0.7055 | |
| 1024 | 0.6581 | 0.4435 | 0.6091 | 0.5919 | 0.4700 | 0.3656 | 0.3669 | 0.3712 | 0.7088 | 0.7479 | 0.8218 | 0.7283 | |
| 1536 | 0.6758 | 0.4393 | 0.5933 | 0.5891 | 0.4791 | 0.3750 | 0.3560 | 0.4030 | 0.6476 | 0.6774 | 0.8135 | 0.7370 | |
| 2048 | 0.6784 | 0.4569 | 0.6202 | 0.6031 | 0.5150 | 0.4359 | 0.3442 | 0.3066 | 0.7024 | 0.7267 | 0.8300 | 0.7117 | |
| 4096 | 0.5600 | 0.3681 | 0.5005 | 0.4688 | 0.5611 | 0.4866 | 0.2904 | 0.2757 | 0.6883 | 0.7143 | 0.6389 | 0.5220 | |
| BERTScore | 128 | 0.4590 | 0.3179 | 0.1662 | 0.1337 | 0.2529 | 0.0459 | 0.2078 | 0.2158 | 0.2910 | 0.3228 | 0.3379 | 0.5015 |
| 256 | 0.6008 | 0.3543 | 0.4464 | 0.4081 | 0.4351 | 0.3001 | 0.2547 | 0.2019 | 0.6392 | 0.6539 | 0.2959 | 0.3722 | |
| 512 | 0.6313 | 0.4060 | 0.5330 | 0.5244 | 0.5102 | 0.3971 | 0.2885 | 0.2420 | 0.6355 | 0.6731 | 0.3669 | 0.4941 | |
| 768 | 0.6561 | 0.4079 | 0.5193 | 0.5356 | 0.4794 | 0.3710 | 0.2742 | 0.1953 | 0.6658 | 0.6971 | 0.3532 | 0.3245 | |
| 1024 | 0.6445 | 0.4110 | 0.5149 | 0.5099 | 0.5053 | 0.4132 | 0.2915 | 0.2334 | 0.6988 | 0.7226 | 0.5121 | 0.5310 | |
| 1536 | 0.6673 | 0.4069 | 0.4683 | 0.4513 | 0.5372 | 0.4666 | 0.2176 | 0.2035 | 0.6825 | 0.7227 | 0.3653 | 0.4106 | |
| 2048 | 0.6951 | 0.4468 | 0.5032 | 0.5265 | 0.5935 | 0.5268 | 0.2709 | 0.2117 | 0.7084 | 0.7403 | 0.4921 | 0.5091 | |
| 4096 | 0.6438 | 0.5180 | 0.4670 | 0.4454 | 0.5585 | 0.4796 | 0.2976 | 0.2650 | 0.6904 | 0.7342 | 0.7250 | 0.5543 | |
| NLI | 128 | 0.2068 | 0.2044 | 0.1618 | 0.1369 | 0.2549 | 0.2815 | 0.1414 | 0.1307 | 0.1977 | 0.1966 | 0.6132 | 0.3684 |
| 256 | 0.2473 | 0.1840 | 0.1873 | 0.1964 | 0.3520 | 0.3060 | 0.1135 | 0.0979 | 0.1499 | 0.1500 | 0.5651 | 0.3486 | |
| 512 | 0.3080 | 0.2241 | 0.2131 | 0.2099 | 0.4610 | 0.4122 | 0.2495 | 0.2454 | 0.5983 | 0.5765 | 0.7019 | 0.5427 | |
| 768 | 0.4211 | 0.3288 | 0.2959 | 0.3063 | 0.4990 | 0.4276 | 0.2893 | 0.3008 | 0.6973 | 0.6756 | 0.6414 | 0.4565 | |
| 1024 | 0.5078 | 0.3010 | 0.2864 | 0.2848 | 0.5479 | 0.4822 | 0.2533 | 0.2936 | 0.7500 | 0.7478 | 0.6175 | 0.3985 | |
| 1536 | 0.5316 | 0.2834 | 0.3355 | 0.3486 | 0.5747 | 0.5009 | 0.2262 | 0.2520 | 0.7163 | 0.7316 | 0.5898 | 0.4783 | |
| 2048 | 0.5518 | 0.3422 | 0.3831 | 0.4005 | 0.6298 | 0.5798 | 0.3195 | 0.3600 | 0.7636 | 0.7996 | 0.7219 | 0.5753 | |
| 4096 | 0.4804 | 0.3111 | 0.3071 | 0.3254 | 0.6159 | 0.5676 | 0.1613 | 0.2452 | 0.6766 | 0.6759 | 0.7158 | 0.4570 | |
Appendix C Correlation performance by GPT-3.5
As an ablation study, Table 4 shows the results of experiments using GPT-3.5, a smaller model than GPT-4. Unlike G-Eval, GPT-3.5 showed an overwhelmingly lower correlation than GPT4 in all data sets and settings, meaning that a GPT-4 scale model should be used as the backbone for long-document summary evaluation. We also tested open LLM alternatives such as Mistral-7B Jiang et al. (2023), but we observed similar trends with GPT-3.5. Thus, we only utilize GPT-4 in this study.
| Consistency | Relevance | Faithfulness | |||||||||||
| arXiv | GovReport | arXiv | GovReport | PubMed | SQuALITY | ||||||||
| Methods | Length | ||||||||||||
| LEAD | 128 | -0.0631 | -0.1246 | -0.0816 | -0.0875 | 0.1558 | 0.0523 | 0.0179 | -0.0150 | 0.3237 | 0.3638 | -0.1130 | 0.0167 |
| 256 | 0.0907 | 0.0612 | -0.0943 | -0.1975 | 0.2838 | 0.0848 | 0.0765 | 0.0680 | 0.3746 | 0.4273 | -0.0551 | 0.1174 | |
| 512 | 0.1018 | 0.0836 | 0.0304 | 0.0063 | 0.3264 | 0.1809 | -0.0144 | 0.0112 | 0.4784 | 0.4774 | -0.2493 | -0.0656 | |
| 768 | 0.1120 | 0.1282 | -0.1631 | -0.1420 | 0.3208 | 0.1279 | -0.0131 | 0.0119 | 0.4779 | 0.4929 | 0.0444 | 0.1804 | |
| 1024 | 0.1345 | 0.1924 | -0.1232 | -0.1065 | 0.3589 | 0.2247 | -0.0883 | -0.0615 | 0.5467 | 0.5365 | 0.0769 | 0.3077 | |
| 1536 | 0.0243 | 0.0510 | -0.0972 | -0.1063 | 0.4035 | 0.2878 | -0.1134 | -0.1159 | 0.4573 | 0.4729 | 0.2153 | 0.2649 | |
| 2048 | 0.0648 | 0.0944 | 0.1180 | 0.0419 | 0.3629 | 0.1862 | -0.0850 | -0.0646 | 0.4834 | 0.4387 | -0.0742 | 0.1291 | |
| 4096 | 0.1432 | 0.2804 | 0.0076 | -0.0320 | 0.4003 | 0.2877 | -0.0810 | -0.1366 | 0.4887 | 0.5235 | 0.3941 | 0.5443 | |
| ROUGE-1 | 128 | 0.0953 | 0.0308 | 0.1144 | 0.0270 | 0.2975 | -0.0156 | 0.0132 | 0.0197 | 0.3057 | 0.3272 | 0.1416 | 0.1791 |
| 256 | 0.1554 | 0.1664 | -0.0514 | -0.0267 | 0.3669 | 0.2558 | 0.0992 | 0.0875 | 0.5131 | 0.5748 | 0.3521 | 0.4076 | |
| 512 | 0.1778 | 0.1719 | -0.1018 | -0.0676 | 0.3381 | 0.1484 | -0.0120 | -0.0092 | 0.5950 | 0.6350 | 0.4577 | 0.4663 | |
| 768 | 0.1025 | 0.0756 | -0.0687 | -0.0827 | 0.3907 | 0.1474 | 0.0370 | 0.0512 | 0.5308 | 0.5892 | 0.3026 | 0.3691 | |
| 1024 | 0.0466 | 0.0197 | -0.0296 | -0.0305 | 0.4263 | 0.2693 | 0.0085 | 0.0355 | 0.5364 | 0.5990 | 0.3094 | 0.2800 | |
| 1536 | 0.0091 | 0.0183 | -0.1424 | -0.1922 | 0.4150 | 0.2807 | -0.0167 | 0.0245 | 0.5344 | 0.5465 | 0.2559 | 0.3434 | |
| 2048 | 0.0582 | 0.0929 | 0.0412 | -0.0523 | 0.3718 | 0.1942 | -0.0983 | -0.0861 | 0.5765 | 0.6302 | 0.3316 | 0.3250 | |
| 4096 | 0.1276 | 0.1803 | -0.0294 | -0.0926 | 0.3365 | 0.2667 | -0.1158 | -0.1489 | 0.5377 | 0.5381 | 0.3466 | 0.3996 | |
| ROUGE-2 | 128 | 0.0364 | 0.0423 | 0.0024 | 0.0122 | 0.3004 | 0.0800 | 0.0241 | 0.0265 | 0.5430 | 0.5401 | 0.1911 | 0.1416 |
| 256 | 0.1788 | 0.2386 | 0.1411 | 0.0606 | 0.3431 | 0.1536 | 0.0311 | -0.0030 | 0.5061 | 0.5506 | 0.2393 | 0.2552 | |
| 512 | 0.1457 | 0.1493 | 0.0128 | 0.0028 | 0.3525 | 0.1269 | 0.0116 | 0.0283 | 0.5243 | 0.6459 | 0.4363 | 0.5286 | |
| 768 | 0.1986 | 0.1910 | -0.0876 | -0.0379 | 0.3698 | 0.1799 | 0.0384 | 0.0608 | 0.5795 | 0.5781 | 0.4342 | 0.4749 | |
| 1024 | 0.1456 | 0.1295 | -0.0335 | -0.0578 | 0.3868 | 0.2088 | 0.0561 | 0.1093 | 0.5534 | 0.5801 | 0.2674 | 0.3082 | |
| 1536 | 0.0832 | 0.0774 | -0.0373 | 0.0298 | 0.3612 | 0.1097 | -0.0325 | -0.0142 | 0.5631 | 0.5948 | 0.3126 | 0.1937 | |
| 2048 | 0.0856 | 0.0809 | -0.0570 | -0.1089 | 0.3271 | 0.1432 | -0.0601 | -0.0584 | 0.5113 | 0.5279 | 0.2365 | 0.2271 | |
| 4096 | 0.1308 | 0.2052 | 0.0108 | 0.0160 | 0.3897 | 0.2617 | -0.1390 | -0.2079 | 0.4865 | 0.4215 | 0.4343 | 0.4465 | |
| ROUGE-1+2 | 128 | 0.0743 | 0.0574 | 0.0817 | 0.0436 | 0.3436 | 0.1484 | 0.0868 | 0.0550 | 0.5588 | 0.5502 | 0.3269 | 0.3056 |
| 256 | 0.1901 | 0.2732 | 0.0833 | 0.0554 | 0.3159 | 0.1260 | 0.0922 | 0.0784 | 0.4652 | 0.4570 | 0.3900 | 0.3796 | |
| 512 | 0.1638 | 0.1769 | 0.1723 | 0.0819 | 0.3426 | 0.1366 | 0.0289 | 0.0472 | 0.5413 | 0.5490 | 0.2555 | 0.3559 | |
| 768 | 0.1467 | 0.1171 | -0.0991 | -0.0729 | 0.4152 | 0.2936 | -0.0403 | -0.0218 | 0.5379 | 0.5685 | 0.2959 | 0.3098 | |
| 1024 | 0.1211 | 0.1103 | 0.0083 | -0.0058 | 0.3679 | 0.1893 | 0.0008 | 0.0246 | 0.5615 | 0.5845 | 0.3195 | 0.3410 | |
| 1536 | 0.0772 | 0.0493 | 0.0436 | 0.0227 | 0.3998 | 0.2343 | -0.0225 | 0.0036 | 0.5691 | 0.6258 | 0.2155 | 0.2465 | |
| 2048 | 0.0499 | 0.0513 | 0.1118 | 0.0377 | 0.3657 | 0.1798 | -0.0429 | -0.0030 | 0.4922 | 0.5270 | 0.1963 | 0.3031 | |
| 4096 | 0.0663 | 0.1394 | -0.0139 | -0.0087 | 0.4393 | 0.3549 | -0.0462 | -0.0996 | 0.5561 | 0.5543 | 0.3961 | 0.4997 | |
| BERTScore | 128 | 0.0528 | 0.0205 | -0.1043 | -0.1016 | 0.3069 | 0.1131 | 0.0587 | 0.0540 | 0.4424 | 0.4715 | 0.0307 | 0.1545 |
| 256 | 0.1018 | 0.1392 | 0.0628 | -0.0017 | 0.2960 | 0.1543 | 0.0762 | 0.0758 | 0.4203 | 0.4399 | 0.1307 | 0.1077 | |
| 512 | 0.1097 | 0.1385 | -0.0048 | -0.0009 | 0.3392 | 0.1337 | 0.0018 | 0.0214 | 0.4852 | 0.4943 | 0.1338 | 0.2019 | |
| 768 | 0.0937 | 0.1192 | 0.0145 | 0.0416 | 0.2732 | 0.0460 | -0.0179 | 0.0195 | 0.5522 | 0.5970 | 0.0702 | 0.1630 | |
| 1024 | 0.1283 | 0.1432 | -0.0370 | -0.0340 | 0.3719 | 0.2157 | -0.0342 | 0.0083 | 0.6066 | 0.5695 | 0.1325 | 0.1403 | |
| 1536 | 0.0085 | -0.0191 | -0.0914 | -0.1322 | 0.3975 | 0.2347 | -0.0684 | -0.0904 | 0.6035 | 0.6215 | 0.1883 | 0.4055 | |
| 2048 | -0.0135 | 0.0233 | -0.0181 | -0.0131 | 0.3929 | 0.1843 | -0.1325 | -0.1087 | 0.5058 | 0.4803 | 0.2679 | 0.3719 | |
| 4096 | 0.1096 | 0.2106 | -0.0675 | -0.1011 | 0.3472 | 0.2168 | -0.0838 | -0.1240 | 0.4476 | 0.4480 | 0.3188 | 0.3158 | |
| NLI | 128 | -0.0260 | -0.0689 | 0.0117 | 0.0824 | 0.3635 | 0.2411 | 0.0086 | -0.0107 | 0.5041 | 0.5647 | 0.1202 | 0.2608 |
| 256 | 0.0152 | -0.0043 | -0.0119 | 0.0548 | 0.2937 | 0.1005 | -0.0263 | -0.0365 | 0.4199 | 0.3586 | 0.0890 | 0.1729 | |
| 512 | 0.0841 | 0.0836 | 0.0434 | 0.0034 | 0.3480 | 0.2177 | -0.0558 | -0.0369 | 0.4783 | 0.4905 | 0.1185 | 0.1280 | |
| 768 | 0.0651 | 0.0741 | -0.0624 | -0.0847 | 0.3491 | 0.0833 | 0.0128 | 0.0177 | 0.3564 | 0.4090 | 0.2651 | 0.3405 | |
| 1024 | 0.0769 | 0.0800 | -0.0105 | -0.0207 | 0.3813 | 0.1694 | 0.0212 | 0.0397 | 0.5264 | 0.5492 | 0.0781 | 0.1539 | |
| 1536 | 0.0986 | 0.0605 | -0.0190 | -0.0318 | 0.4322 | 0.3107 | -0.1126 | -0.0961 | 0.5368 | 0.5467 | 0.0161 | 0.2438 | |
| 2048 | 0.0839 | 0.0725 | -0.0183 | 0.0097 | 0.4139 | 0.2372 | -0.0292 | -0.0113 | 0.5071 | 0.5701 | -0.1031 | 0.1544 | |
| 4096 | 0.0493 | 0.0783 | -0.0033 | 0.0081 | 0.4562 | 0.3065 | -0.0401 | -0.0502 | 0.4496 | 0.4980 | 0.1686 | 0.1988 | |
| Full | - | 0.0786 | 0.1205 | 0.2994 | 0.3551 | -0.0173 | -0.0144 | 0.0344 | -0.0107 | 0.4904 | 0.4617 | 0.1397 | 0.1489 |
| Full (GPT-4) | - | 0.6078 | 0.4561 | 0.325 | 0.3404 | 0.5801 | 0.5185 | 0.1197 | 0.1061 | 0.6352 | 0.6964 | 0.5119 | 0.3758 |
Appendix D Analysis of source document length distribution under various length limitations
We evaluated the length distribution of the extracted source documents across various length limitations. As illustrated in Table 5, there is generally no significant difference in length distribution under different length limitations, suggesting minimal information loss. However, an exception is observed when the length limitation is set to a longer value, such as 4096 tokens. This discrepancy is attributable to some original source documents being shorter than 4096 tokens, which influences the average length due to the presence of these shorter instances.
| arXiv | GovReport | PubMed | SQuALITY | ||||||||||
|---|---|---|---|---|---|---|---|---|---|---|---|---|---|
| Methods | Length | avg. | 25% | 75% | avg. | 25% | 75% | avg. | 25% | 75% | avg. | 25% | 75% |
| LEAD | 128 | 108.8 | 105.0 | 116.0 | 98.5 | 93.0 | 112.0 | 94.6 | 84.8 | 116.2 | 112.3 | 108.8 | 119.2 |
| 256 | 223.5 | 217.0 | 228.0 | 227.6 | 218.0 | 239.0 | 228.3 | 220.5 | 237.0 | 233.0 | 229.0 | 237.2 | |
| 512 | 477.6 | 472.0 | 488.0 | 474.1 | 461.0 | 490.0 | 475.0 | 466.2 | 486.8 | 475.6 | 471.0 | 480.2 | |
| 768 | 722.5 | 719.0 | 732.0 | 727.9 | 718.0 | 738.0 | 709.0 | 675.5 | 733.2 | 712.3 | 701.2 | 725.5 | |
| 1024 | 970.7 | 961.0 | 982.0 | 969.4 | 958.0 | 987.0 | 974.9 | 967.0 | 983.2 | 954.6 | 950.8 | 962.0 | |
| 1536 | 1,456.5 | 1,448.0 | 1,467.0 | 1,457.9 | 1,449.0 | 1,469.0 | 1,450.0 | 1,450.0 | 1,480.2 | 1,433.9 | 1,411.8 | 1,448.2 | |
| 2048 | 1,921.1 | 1,939.0 | 1,960.0 | 1,963.4 | 1,955.0 | 1,976.0 | 1,889.5 | 1,927.5 | 1,973.0 | 1,916.1 | 1,894.0 | 1,939.5 | |
| 4096 | 3,639.1 | 3,886.0 | 3,943.0 | 3,752.1 | 3,634.0 | 3,965.0 | 3,015.2 | 2,297.8 | 3,917.2 | 3,834.0 | 3,795.0 | 3,882.2 | |
| ROUGE-1 | 128 | 103.7 | 95.8 | 122.0 | 64.5 | 0.0 | 103.0 | 85.6 | 70.2 | 111.5 | 96.2 | 83.0 | 115.2 |
| 256 | 239.5 | 232.8 | 250.0 | 226.4 | 208.0 | 243.0 | 226.6 | 220.2 | 244.2 | 236.5 | 227.8 | 248.0 | |
| 512 | 491.6 | 486.0 | 501.0 | 478.0 | 466.0 | 499.0 | 488.1 | 477.0 | 501.0 | 497.0 | 489.0 | 506.2 | |
| 768 | 746.8 | 741.0 | 758.0 | 739.5 | 732.0 | 754.0 | 740.6 | 729.0 | 756.0 | 757.5 | 752.8 | 764.0 | |
| 1024 | 1,005.6 | 999.0 | 1,015.0 | 999.8 | 990.8 | 1,014.0 | 1,001.4 | 994.0 | 1,016.2 | 1,015.4 | 1,010.5 | 1,020.2 | |
| 1536 | 1,511.2 | 1,505.0 | 1,524.0 | 1,511.2 | 1,504.0 | 1,524.0 | 1,486.8 | 1,491.8 | 1,519.0 | 1,529.6 | 1,524.8 | 1,538.2 | |
| 2048 | 1,990.8 | 2,010.8 | 2,035.0 | 2,021.1 | 2,012.8 | 2,035.0 | 1,942.2 | 2,000.8 | 2,030.0 | 2,047.3 | 2,041.8 | 2,055.0 | |
| 4096 | 3,739.2 | 4,025.5 | 4,072.0 | 3,822.1 | 3,634.0 | 4,073.2 | 3,046.9 | 2,297.8 | 4,014.2 | 4,109.4 | 4,093.0 | 4,121.0 | |
| ROUGE-2 | 128 | 113.0 | 106.0 | 122.0 | 82.8 | 71.8 | 114.0 | 96.5 | 91.8 | 116.5 | 107.8 | 103.8 | 123.0 |
| 256 | 236.4 | 228.0 | 247.0 | 224.2 | 212.8 | 243.0 | 224.1 | 215.2 | 242.0 | 241.3 | 231.0 | 250.2 | |
| 512 | 492.5 | 487.0 | 504.0 | 482.7 | 472.0 | 500.2 | 480.1 | 471.0 | 494.5 | 496.6 | 487.0 | 506.0 | |
| 768 | 747.9 | 741.0 | 758.0 | 740.7 | 733.0 | 756.2 | 738.8 | 731.2 | 756.0 | 755.1 | 751.0 | 762.2 | |
| 1024 | 1,002.7 | 994.0 | 1,014.0 | 994.6 | 983.5 | 1,012.0 | 1,000.6 | 996.0 | 1,017.0 | 1,012.9 | 1,007.5 | 1,021.2 | |
| 1536 | 1,509.7 | 1,503.0 | 1,522.0 | 1,511.6 | 1,504.0 | 1,524.0 | 1,492.1 | 1,500.8 | 1,527.0 | 1,530.0 | 1,522.8 | 1,538.0 | |
| 2048 | 1,991.0 | 2,015.0 | 2,033.0 | 2,015.5 | 2,015.0 | 2,033.2 | 1,945.8 | 2,002.0 | 2,031.0 | 2,049.2 | 2,043.8 | 2,056.0 | |
| 4096 | 3,739.2 | 4,025.5 | 4,072.0 | 3,822.1 | 3,634.0 | 4,073.2 | 3,046.9 | 2,297.8 | 4,014.2 | 4,109.4 | 4,093.0 | 4,121.0 | |
| ROUGE-1+2 | 128 | 108.2 | 101.8 | 122.0 | 75.7 | 61.5 | 109.0 | 95.0 | 90.5 | 119.0 | 100.0 | 93.8 | 117.2 |
| 256 | 238.5 | 232.0 | 249.0 | 225.0 | 206.0 | 244.2 | 225.4 | 215.0 | 242.5 | 240.6 | 234.5 | 250.0 | |
| 512 | 491.3 | 484.0 | 501.2 | 479.0 | 467.0 | 499.0 | 485.3 | 477.0 | 502.2 | 498.6 | 492.8 | 505.2 | |
| 768 | 747.3 | 740.8 | 760.0 | 741.6 | 728.8 | 757.0 | 736.1 | 726.8 | 751.5 | 755.2 | 746.8 | 763.2 | |
| 1024 | 1,004.2 | 996.0 | 1,014.0 | 996.6 | 988.0 | 1,012.2 | 997.0 | 988.5 | 1,015.2 | 1,016.2 | 1,012.5 | 1,021.2 | |
| 1536 | 1,511.1 | 1,502.8 | 1,524.0 | 1,506.4 | 1,498.0 | 1,522.0 | 1,482.8 | 1,491.2 | 1,522.2 | 1,530.3 | 1,524.0 | 1,536.8 | |
| 2048 | 1,989.5 | 2,011.0 | 2,032.2 | 2,022.6 | 2,014.0 | 2,035.2 | 1,938.7 | 1,990.2 | 2,026.0 | 2,047.1 | 2,041.5 | 2,052.2 | |
| 4096 | 3,739.2 | 4,025.5 | 4,072.0 | 3,822.1 | 3,634.0 | 4,073.2 | 3,046.9 | 2,297.8 | 4,014.2 | 4,109.4 | 4,093.0 | 4,121.0 | |
| BERTScore | 128 | 109.7 | 101.0 | 122.0 | 77.5 | 67.2 | 112.2 | 90.0 | 87.0 | 111.0 | 110.2 | 113.2 | 125.0 |
| 256 | 237.6 | 226.0 | 248.2 | 232.9 | 219.0 | 246.0 | 221.3 | 203.2 | 240.0 | 243.0 | 236.8 | 252.2 | |
| 512 | 483.7 | 475.0 | 502.0 | 490.5 | 481.0 | 504.0 | 472.9 | 453.0 | 498.5 | 503.0 | 497.8 | 510.0 | |
| 768 | 749.8 | 738.0 | 758.0 | 746.7 | 742.0 | 756.0 | 736.4 | 718.8 | 753.0 | 759.6 | 751.8 | 769.0 | |
| 1024 | 997.3 | 989.8 | 1,012.0 | 1,001.0 | 993.8 | 1,013.0 | 990.2 | 976.8 | 1,007.5 | 1,019.1 | 1,014.0 | 1,021.0 | |
| 1536 | 1,511.4 | 1,501.0 | 1,524.2 | 1,513.2 | 1,503.8 | 1,526.0 | 1,488.7 | 1,497.8 | 1,518.5 | 1,532.5 | 1,525.8 | 1,543.2 | |
| 2048 | 1,988.9 | 2,014.0 | 2,034.2 | 2,023.0 | 2,013.0 | 2,036.0 | 1,945.5 | 1,999.8 | 2,031.2 | 2,047.0 | 2,040.0 | 2,055.2 | |
| 4096 | 3,736.2 | 3,947.2 | 4,074.0 | 3,823.7 | 3,634.0 | 4,076.0 | 3,048.0 | 2,297.8 | 4,035.8 | 4,107.4 | 4,092.5 | 4,119.0 | |
| NLI | 128 | 105.9 | 97.0 | 116.0 | 107.0 | 100.8 | 115.2 | 100.4 | 93.0 | 117.5 | 110.7 | 105.8 | 116.0 |
| 256 | 229.6 | 222.0 | 240.0 | 230.3 | 223.0 | 239.2 | 228.9 | 224.8 | 238.5 | 228.4 | 225.2 | 233.2 | |
| 512 | 472.7 | 466.0 | 484.0 | 473.3 | 465.0 | 483.0 | 471.8 | 460.8 | 485.2 | 466.3 | 460.0 | 474.0 | |
| 768 | 719.9 | 711.0 | 731.0 | 720.3 | 711.0 | 731.0 | 720.7 | 717.5 | 737.5 | 707.5 | 700.5 | 715.2 | |
| 1024 | 962.3 | 957.8 | 977.0 | 966.7 | 956.8 | 980.0 | 973.8 | 968.8 | 988.2 | 946.1 | 938.0 | 958.0 | |
| 1536 | 1,456.1 | 1,446.0 | 1,471.0 | 1,460.7 | 1,450.0 | 1,475.0 | 1,444.8 | 1,454.0 | 1,476.2 | 1,426.4 | 1,415.5 | 1,442.2 | |
| 2048 | 1,924.1 | 1,930.8 | 1,960.0 | 1,954.0 | 1,943.0 | 1,970.0 | 1,895.0 | 1,936.0 | 1,974.0 | 1,905.6 | 1,896.0 | 1,922.0 | |
| 4096 | 3,637.2 | 3,875.0 | 3,942.2 | 3,736.6 | 3,634.0 | 3,953.2 | 3,013.2 | 2,297.0 | 3,915.5 | 3,827.2 | 3,801.5 | 3,865.0 | |
Appendix E Dataset license
Table 6 provides a summary of the licenses associated with datasets used in this work.
| Data | Data License | Annotation | Annotation License |
|---|---|---|---|
| arXiv Cohan et al. (2018) | Apache License 2.0 | Koh et al. (2022) | Unspecified |
| GovReport Huang et al. (2021) | Unspecified | Koh et al. (2022) | Unspecified |
| PubMed Cohan et al. (2018) | Apache License 2.0 | Krishna et al. (2023) | Apache License 2.0 |
| SQuALITY Wang et al. (2022) | Unspecified | Krishna et al. (2023) | Apache License 2.0 |
Appendix F The design choice of LLM-based evaluator
In our preliminary experiments, we attempted to conduct summary evaluation using the prompting approach based on the G-Eval setting Liu et al. (2023b), which sets the temperature parameter to 1 and the number of completions n to 20. However, when we applied this approach to the long-document summarization evaluation dataset, we encountered a "Rate limit issue." Since we did not encounter this error when we set the parameter n to 1, we suspect it may be an issue on the API side.
As an alternative method, we considered making 20 API calls to obtain 20 samples. However, this could lead to a 20-fold increase in the cost of evaluating a single instance, which is not a practical solution, even though the original pricing formula is num_tokens(input) + max_tokens * max(n, best_of).101010https://openai.com/pricing
In addition to this, we conducted further preliminary experiments in the benchmark for short-text summarization evaluation using the SummEval dataset Fabbri et al. (2021). Specifically, we performed sub-sampling to create a smaller subset of the dataset and conducted summary evaluations in two settings: the original G-Eval setting with temperature = 1 and n = 20, and a deterministic setting111111Theoretically speaking, a language model with a temperature setting of 0 should produce deterministic output. However, it is known that GPT-4 can still generate random outputs even when the temperature is set to 0. Nevertheless, in our specific setup, where the output is limited to a single token and unlike typical text generation problems, error propagation is not a concern. In fact, when we set the temperature to 0 and generated output 10 times for 10 different instances, we observed that in one instance, 7 out of 10 times, it was estimated to be 5, and 3 out of 10 times, it was estimated to be 4. In other words, we found that deterministic inference was possible approximately 97% of the time. with temperature = 0 and n = 1. This small study revealed that we obtained nearly identical results in both cases.
Based on these observations, in our main experiments, we evaluated the summaries with temperature = 0, which allowed us to achieve relatively higher reproducibility of results compared to the original setting without facing "Rate limit issue".
Appendix G Additional results
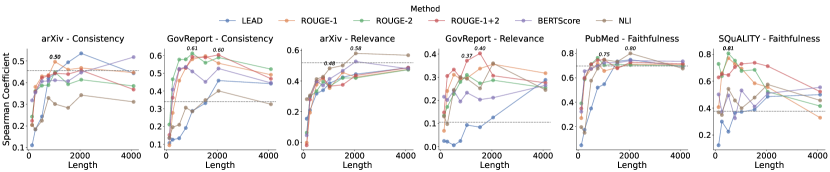
We show the same plot as shown in Figure 3 (Figure 7 repeats here for convenience of readers), but we use Spearman’s rank correlation instead of Pearson’s in Figure 8. The observation is nearly the same as in the Pearson case.

Appendix H SQuALITY dataset issue
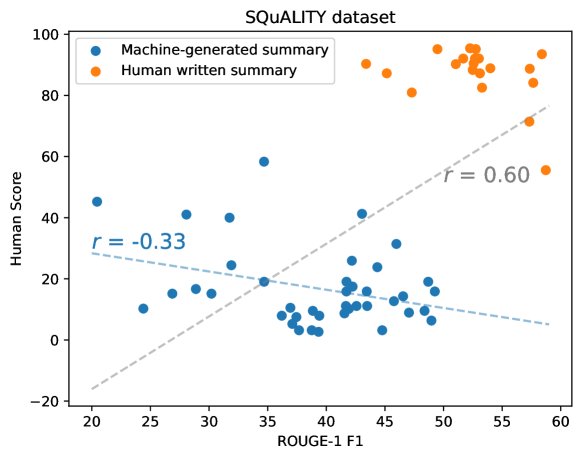
We conducted experiments using manually annotated human scores for the SQuALITY dataset by Krishna et al. (2023). However, in our preliminary experiments, we observed significant differences in correlation when using baseline metrics, such as ROUGE-1 F1 scores, compared to those reported in the paper.
Upon closer examination, we discovered that Krishna et al. (2023) used reference summaries to compute correlations in the SQuALITY dataset. As depicted in Figure 9, the reference summary (orange dot) is generally evaluated as faithful, resulting in excessively high automatic evaluation scores and a correlation of .
In fact, when we re-evaluated the correlation between the ROUGE-1 F1 score and the human scores without using human-written summaries (blue dot), we found a significant drop in correlation to . Therefore, the results presented in Table 2 are inconsistent with those reported in the original paper Krishna et al. (2023).
Appendix I Relevant Work
Evaluation of Text Generation:
Evaluation of text generation plays a critical role in the development of high-quality text generation systems Celikyilmaz et al. (2020). However, most automatic evaluation metrics do not always correlate well with human evaluation Kryscinski et al. (2020); Bhandari et al. (2020); Fabbri et al. (2021); Adams et al. (2023). Recently, LLMs have shown a strong alignment with human judgment for the evaluation of text generation Chiang and Lee (2023); Liu et al. (2023b); Fu et al. (2023). Still, LLMs are computationally expensive, meaning that long document summary evaluation can be costly. Our study shows that extracting important sentences in advance not only reduces inference costs but also exhibits a higher correlation with human evaluations.
NLP for Long Sequence:
NLP studies have begun to shift from focusing on individual sentences to long documents. In particular, there has been a lot of effort in developing Transformer models that can effectively analyze longer sequences Beltagy et al. (2020); Gu et al. (2022); Dao et al. (2022). However, such models often perform poorly when important information is in the middle Liu et al. (2023a). Our study identified a similar problem with long document summary evaluation and introduced a cost-effective solution.