Overcoming near-degeneracy in the autologistic actor attribute model
Abstract
The autologistic actor attribute model, or ALAAM, is the social influence counterpart of the better-known exponential-family random graph model (ERGM) for social selection. Extensive experience with ERGMs has shown that the problem of near-degeneracy which often occurs with simple models can be overcome by using “geometrically weighted” or “alternating” statistics. In the much more limited empirical applications of ALAAMs to date, the problem of near-degeneracy, although theoretically expected, appears to have been less of an issue. In this work I present a comprehensive survey of ALAAM applications, showing that this model has to date only been used with relatively small networks, in which near-degeneracy does not appear to be a problem. I show near-degeneracy does occur in simple ALAAM models of larger empirical networks, define some geometrically weighted ALAAM statistics analogous to those for ERGM, and demonstrate that models with these statistics do not suffer from near-degeneracy and hence can be estimated where they could not be with the simple statistics.
Keywords— autologistic actor attribute model, ALAAM, exponential-family random graph model, ERGM, near-degeneracy
1 Introduction
The autologistic actor attribute model (ALAAM) is a statistical model of social influence, or contagion on a social network. The ALAAM, first introduced by Robins et al. (2001) and extended by Daraganova (2009) to its current form, is a variant of the exponential-family random graph model (ERGM), a widely-used model for social networks (Lusher et al., 2013; Ghafouri and Khasteh, 2020). Both ALAAM and ERGM are models for cross-sectional data, that is, a network and nodal attributes observed at one point in time (or preferably, for the ALAAM, the network and nodal attributes at one point, and the outcome binary attribute at a suitable later point (Parker et al., 2022)). The distinction between the ERGM and the ALAAM is that the ERGM models the probability of network ties, conditional on nodal attributes, while the ALAAM models the probability of a (binary) nodal attribute, conditional on the network (and other nodal attributes).
The ALAAM, modeling the probability of attribute (a vector of binary attributes) given the network (a matrix of binary tie variables) can be expressed as (Daraganova and Robins, 2013):
| (1) |
where is the parameter corresponding to the network-attribute statistic , in which the “configuration” is defined by a combination of dependent (outcome) attribute variables , network variables , and actor covariates , and is a normalizing quantity which ensures a proper probability distribution. Table 1 shows some simple configurations for undirected networks used in this work, while Table 2 shows a more extensive list of configurations for directed networks used in this work.
| Name | Illustration | Description |
|---|---|---|
| Density |
|
Baseline attribute density (incidence). Also used with directed networks |
| Activity |
|
Tendency for actor with the attribute to have ties |
| Contagion |
|
Tendency for actor with the attribute to be tied to an actor also with the attribute |
| attribute_oOc |
|
Covariate effect for continuous covariate attribute. The “_oOc” notation is from IPNet (Wang et al., 2009a), and we may omit this when there is no ambiguity, e.g. “Age_oOc” may also be written simply as “Age”. Also used in directed networks |
| Legend: | |
|---|---|
|
|
Node with outcome attribute |
|
|
Node irrespective of outcome attribute |
| Name | Illustration | Description |
|---|---|---|
| Sender |
|
Tendency of actors with the attribute to have outgoing ties (activity) |
| Receiver |
|
Tendency of actors with the attribute to have incoming ties (popularity) |
| Contagion |
|
Tendency of the attribute to be present in both actors connected by directed tie |
| Reciprocity |
|
Tendency of the attribute to be present in an actor connected to another by a reciprocated (mutual) tie |
| Contagion reciprocity |
|
Also known as mutual contagion. Tendency of the attribute to be present in both actors connected by a reciprocated tie |
| Ego in-two-star |
|
Tendency of the attribute to be present in an actor with additional incoming ties over Receiver |
| Ego out-two-star |
|
Tendency of the attribute to be present in an actor with additional outgoing ties over Sender |
| Mixed-two-star |
|
Tendency of the attribute to be present in an actor in the broker position between two other nodes (local brokerage) |
| Mixed-two-star source |
|
Tendency of the attribute to be present in an actor in the source position in local brokerage |
| Mixed-two-star sink |
|
Tendency of the attribute to be present in an actor in the sink position in local brokerage |
| Transitive triangle T1 |
|
Tendency of the attribute to be present in an actor in a transitive triangle, the broker position in Mixed-two-star bypassed by a transitive tie |
| Transitive triangle T3 |
|
Contagion clustering: tendency of the attribute to be present in all three actors in a transitive triangle |
Both ERGMs and ALAAMs, because of the presence of the intractable normalizing constant, in (1), usually require Markov chain Monte Carlo (MCMC) methods for maximum likelihood estimation (MLE) of the parameters (Snijders, 2002; Hunter and Handcock, 2006; Hunter et al., 2012; Lusher et al., 2013; Amati et al., 2018; Koskinen, 2020). Once the parameters and their standard errors are estimated, they can be used for inferences regarding the corresponding configurations. A parameter estimate that is statistically significant and positive indicates an over-representation of the corresponding configuration, conditional on all the other parameters in the model. Conversely, a parameter that is statistically significant and negative indicates an under-representation of that configuration given all the others in the model.
A well-known problem with ERGMs is that simple model specifications can lead to “near-degeneracy” in which the MLE does not exist, or the model generates distributions of graphs in which most of the probability mass is placed on (nearly) empty or (nearly) complete graphs (Handcock, 2003; Snijders et al., 2006; Hunter, 2007; Schweinberger, 2011; Chatterjee and Diaconis, 2013; Schweinberger et al., 2020). This problem is usually overcome by the use of more complex “alternating” or “geometrically weighted” configurations (Snijders et al., 2006; Robins et al., 2007; Hunter, 2007; Lusher et al., 2013), however other forms of additional mathematical structure can also be used to solve (or avoid) the problem of near-degeneracy (Schweinberger et al., 2020)
Since the ALAAM, like the ERGM, is a type of Gibbs random field, and specifically the ALAAM derives from the autologistic Ising model (Besag, 1972), it is to be expected, that, like the ERGM, problems of near-degeneracy would arise due to the well-known phase transition behaviour in such models (Fellows and Handcock, 2017; Stoehr, 2017). It has, however, been observed that for ALAAMs “this is less of an issue” (Koskinen and Daraganova, 2022, p.1856), and indeed “alternating” or “geometrically weighted” statistics have to date not been described for ALAAMs, with published models using simple configurations such as those shown in Table 1 and Table 2.
In this work I will show that this could be due to the somewhat limited experience with ALAAMs to date, and specifically that their use has been restricted to relatively small networks. I demonstrate that near-degeneracy does occur in ALAAMs with empirical networks, and propose new geometrically weighted statistics, analogous to the geometrically weighted degree statistics for ERGMs, that overcome this problem and allow estimation of ALAAM models that could not be estimated using, for undirected networks, the Activity statistic (Table 1) or, for directed networks, the Sender and Receiver statistics (Table 2).
2 Survey of ALAAM applications
As noted by Parker et al. (2022, p. 517), empirical experience with ALAAMs is recent and limited. This is particularly so relative to the social selection model ERGM, which is widely used across a variety of domains; for a recent survey see Ghafouri and Khasteh (2020), as well as, for example Lusher et al. (2013); Amati et al. (2018); Cimini et al. (2019). It is therefore practical to present a comprehensive survey of empirical ALAAM usage. I used Google Scholar to search for “autologistic actor attribute model” (search date 24 August 2023), which resulted in 34 hits. Note that, as is well known, Google Scholar includes not just peer-reviewed publications, but “grey literature” such as PhD theses, unpublished preprints and technical reports, among others. I chose not to restrict this literature survey to peer-reviewed publications, but to also include preprints, conference presentations, and PhD theses, as long as they met the same criteria I defined for publications, namely:
-
1.
The ALAAM model is applied to empirical data. This excludes, for example, Stivala et al. (2020b), which is a simulation study, rather than an application to empirical data.
-
2.
The model used was an ALAAM as described in this work; the family of model implemented for example by IPNet (Wang et al., 2009a) and its successor software MPNet (Wang et al., 2014, 2022). Note that this excludes the original ALAAM paper (Robins et al., 2001), in which the outcome variable is not dichotomous (binary), but rather polytomous (three values). This paper also predates the introduction of the name “autologistic actor attribute model”, and uses maximum pseudo-likelihood for estimation. This criterion also excludes the more recent exponential-family random network model (ERNM), a generalization of the ERGM and ALAAM, which models both social selection and social influence simultaneously (Fellows and Handcock, 2012, 2013; Wang et al., 2023).
-
3.
The work is either publicly available, or available to me via my affiliation at Università della Svizzera italiana.
This initial search was supplemented by searching for the same terms using Clarivate Web of Science and Elsevier Scopus (search date 30 August 2023). These searches results in 7 and 34 results, respectively, with a large overlap with the Google Scholar results. I further supplemented these results by adding some works with which I was personally familiar, because, for example, I am an author or I was informed of their existence by an author. The final list of 19 works, containing 25 empirical ALAAM models, is shown in Table LABEL:tab:survey.
| Citation | Network description | Outcome description | Network | Estimation | Comments |
|---|---|---|---|---|---|
| size | method | ||||
| Barnes et al. (2020) | Multilevel social-ecological: households with communication relationships, fish species with trophic relationships, cross-level fishing targets | Two models: Adaptive action and transformative action | 198 | MPNet | Multilevel network with 138 households, 60 fish species |
| Bodin and Chen (2023) | Multilevel social-ecological: affective relations, organization-based collaboration, rangeland use, and species dispersal and livestock movement | Highly adaptive (dichotomized from continuous measure of change in number of grazing patches) | ? | MPNet | Network size not specified, but from figures in S.I. appears to be less than 100 |
| Bryant et al. (2017) | Social network in a post-disaster community | Two models: Probably depression and probably posttraumatic stress disorder (PTSD) | 558 | MPNet | Directed network |
| Daraganova and Robins (2013) | Social network in a high unemployment region | Unemployment | 551 | IPNet | Two-wave snowball sample. Includes geographic proximity covariate |
| Diviák et al. (2020) | Collaboration network among organized crime offenders | Female gender | 1390 | IPNet | Not being used as a social influence model, rather a network discriminant analysis. Includes pre-existing ties network as a setting network covariate |
| Fujimoto et al. (2019) | Multilevel referral-affiliation network of client-referral ties from community-based organizations (CBOs) to PrEP providers and utilization by young men who have sex with men (YMSM) of CBOs and PrEP providers | Pre-exposure prophylactic (PrEP) uptake | 284 | MPNet | Houston (25 venues and 259 YMSM) |
| 308 | Chicago (24 venues and 284 YMSM) | ||||
| Gallagher (2019) | Core discussion network among English-for-Academic-Purposes international students | Willingness to communicate in English (dichotomized from percentage of time) | 67 | MPNet | Directed network |
| Kashima et al. (2013) | Social network in a regional community | Perceived descriptive norm of high community engagement (dichotomized from continuous scale) | 104 | IPNet | Two-wave snowball sample |
| Koskinen and Daraganova (2022) | Directed friendship network in an all-male school | High masculinity index (dichotomized from Masculine Attitudes Index) | 106 | R code | Bayesian inference with missing data. Also includes re-analysis of the Daraganova and Robins (2013) unemployment data |
| Directed friendship network from Stockholm Birth Cohort data | Intention to proceed to higher secondary education | 403 | |||
| Letina (2016) | Co-authorship network for two fields of social science in Croatia | High productivity (two models: dichotomized from number of publications, or H-index) | 125 | MPNet | Psychology |
| 102 | Sociology | ||||
| Letina et al. (2016) | Co-authorship network for three fields of social science in Croatia | One or more ties outside the national and/or disciplinary community (NDC) | 160 | MPNet | Psychology |
| 136 | Sociology | ||||
| 250 | Educational sciences | ||||
| Matous and Bodin (2021) | Advice network regarding cocoa farming practices | Farmers’ use of fertilizer | 71 | MPNet | Undirected network. Fourteen networks from size 25 to 199 (mean 71) |
| Neidhardt (2016) | Friendship network of schoolchildren in Glasgow | Smoking behaviour (dichotomized from occasionally or regularly) | 160 | IPNet | Undirected network |
| Partners (co-players) in an online game | Cancelled subscription to game | 2587 | Took two days to estimate in IPNet and the results are not stable (Neidhardt, 2016, p. 106) | ||
| Ocelik et al. (2021) | Long-term cooperation network of people opposed to the rescinding of coal-mining limits in the Czech Republic | High-level participation (dichotomized from continuous differential participation scale) | 38 | MPNet | Undirected network |
| Parker et al. (2022) | Directed advice network among students in a management course | Two models: high performance and low performance (dichotomized from grades) | 133 | MPNet | |
| Rank (2014) | Collaboration network among top managers of all member companies and organizations in a regional biotech network | Firm survival | 53 | IPNet | Undirected network. Paper refers to the ALAAM model as ERGM for social influence |
| Song et al. (2020) | Social network of an online weight-loss community | Self-monitoring performance (dichotomized from continuous score) | 724 | IPNet | Undirected network. Estimation method not reported, but effect names indicate IPNet |
| Stadtfeld et al. (2019) | Positive interactions, friendship, and studying together networks among engineering undergraduate students | Passing the final exam | 163 | MPNet | Analysis uses stochastic actor-oriented model (SAOM) (Snijders, 2017) for network evolution, with ERGM for robustness check, and linear regression for final exam result, with logistic regression, network autocorrelation, and ALAAM as robustness checks |
| Stivala et al. (2023b) | Director interlock network | Female gender | 12058 | ALAAMEE | As in Diviák et al. (2020), not being used as a social influence model, rather a network discriminant analysis. Bipartite network, 9971 directors and 2087 companies. Estimated with stochastic approximation |
| Wood (2019) | Friendship network in a novel mobile platform | Commitment to vote in an election | 74 | MPNet | Undirected network |
In all but two cases, the ALAAM was estimated with stochastic approximation (Snijders, 2002), using either the IPNet or MPNet software. The first exception is Koskinen and Daraganova (2022), which describes Bayesian estimation of the ALAAM, accompanied by R code which implements this method. The second exception is Stivala et al. (2023b), in which the ALAAM is estimated using the ALAAMEE software (Stivala et al., 2023a), also used in this work. In Stivala et al. (2023b), ALAAM models for the 12058 node bipartite director interlock network were estimated using stochastic approximation (the same algorithm implemented in IPNet and MPNet). However a converged ALAAM for the larger director interlock network (Evtushenko and Gastner, 2020) with 356638 nodes (321869 directors and 34769 companies) could not be found, using either the stochastic approximation or equilibrium expectation algorithms implemented in ALAAMEE. In contrast, converged ERGM models for both networks, using “alternating” star statistics for bipartite networks (Wang et al., 2009b) were found, using the EstimNetDirected software (Stivala et al., 2020a)
The mean network size (number of nodes) in Table LABEL:tab:survey is 832.1, the median is 160, and the maximum is 12058. (Of the 26 models, one did not specify the network size, and hence these results are over 25 networks.) However, excluding the single use of ALAAMEE, the mean is 364.4, the median 160, and the maximum 2587. Even for this 2587 node network, it is noted that the estimation using IPNet took two days, and the results were “not stable” (Neidhardt, 2016, p. 106). The largest network for which estimation (with IPNet) was not problematic is the 1390 node network in Diviák et al. (2020).
The largest network used in the simulation studies described in Stivala et al. (2020b) is 4430 nodes, however although this is an empirical network, the binary outcome attribute is not itself an empirical covariate, but rather simulated from an ALAAM model for the purposes of testing statistical inference using a model with known parameters.
3 Near-degeneracy with standard ALAAM parameters
In this and the following sections, three networks will be used as examples. First, a network of friendship relations between students in a high school in Marseilles, France, collected in December 2013 by the SocioPatterns research collaboration (Mastrandrea et al., 2015). This is a directed network of friendship relations, where an arc from a node to a node indicates that student reported a friendship with student . The school class and gender (male or female) of each student is known (one is unknown), and male gender is used as the binary “outcome” attribute. In this way, the ALAAM is not being used as a social influence model (it is not assumed that gender is affected by network position), but rather as a way of making inferences about the structural positions of males in the network, as was done for female gender in Diviák et al. (2020); Stivala et al. (2023b). Similar considerations apply to the other two networks: I am not actually using ALAAM as a social influence model, but merely using these examples to illustrate problems of near-degeneracy and how to overcome it with the new geometrically weighted activity statistic.
The second network is a large online social network of GitHub (an online platform for software development) software developers, collected in June 2019 (Rozemberczki et al., 2021). Nodes are developers (who have “starred” at least ten repositories) and undirected edges are mutual “follower” relationships between them. This data set was created for binary node classification, and the target binary feature, which is used here as the binary outcome attribute, is the developer type, either “web” or “machine learning” (Rozemberczki et al., 2021). Here this developer type is used as the outcome variable — it is not clear which developer type the nonzero value of this variable indicates, so I do not ascribe any meaning to ALAAM inferences regarding this variable (and, again, nor do I actually make the assumption that the developer type is subject to social influence).
The third network is the “Pokec” online social network, at one time the most popular such network in Slovakia (Takac and Zabovsky, 2012). Arcs in this network represent directed “friendship” relations, and the nodes are annotated with a number of attributes, including age and gender. Again, male gender is used as the binary “outcome” attribute here. As described Stivala et al. (2020a), the 20 “hub” nodes with degree greater than 1000 are removed. Two versions of this network are considered here, the original directed version, and an undirected version in which only mutual “friendship” relations are retained, as is done in Kleineberg and Boguñá (2014).
Descriptive statistics of the networks are shown in Table 4, and of the nodes with () and without () the outcome attribute in Table 5. The high school network is of a size that is typical of current publications using the ALAAM (see Section 2), but the GitHub and Pokec networks are orders of magnitude larger. These are too large to estimate in practical time using the stochastic approximation algorithm, and so although the high school network models will be estimated using stochastic approximation, the GitHub and Pokec models will be estimated using the equilibrium expectation algorithm instead, which is suitable for very large networks (Byshkin et al., 2016, 2018; Borisenko et al., 2020; Stivala et al., 2020a)
| Network | Directed | Nodes | Size of giant | Mean | Max. | Max. | Density | Clustering |
|---|---|---|---|---|---|---|---|---|
| component | degree | in-degree | out-degree | coefficient | ||||
| GitHub | No | 37700 | 37700 | 15.33 | 9458 | 9458 | 0.00041 | 0.01236 |
| Pokec | No | 1632783 | 1197779 | 10.16 | 671 | 671 | 0.00001 | 0.06854 |
| Pokec | Yes | 1632783 | 1632199 | 18.69 | 949 | 998 | 0.00001 | 0.05369 |
| High school | Yes | 134 | 128 | 4.99 | 15 | 16 | 0.03748 | 0.47540 |
Network statistics computed using the igraph (Csárdi and Nepusz, 2006) R package. “Clustering coefficient” is the global clustering coefficient (transitivity)
| Network | Directed | |||||
|---|---|---|---|---|---|---|
| nodes % | Outcome nodes | Outcome nodes | ||||
| Mean | Mean | Mean | Mean | |||
| in-degree | out-degree | in-degree | out-degree | |||
| GitHub | No | 26 | 17.67 | 17.67 | 8.63 | 8.63 |
| Pokec | No | 49 | 10.68 | 10.68 | 9.62 | 9.62 |
| Pokec | Yes | 49 | 20.55 | 18.34 | 16.78 | 19.06 |
| High school | Yes | 40 | 4.79 | 4.69 | 5.28 | 5.43 |
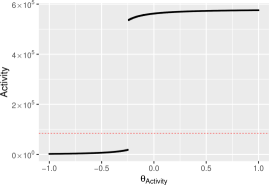
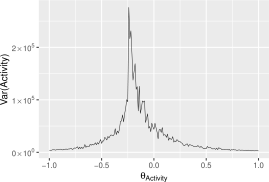
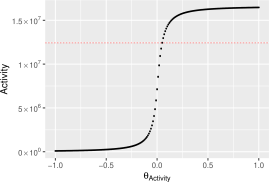
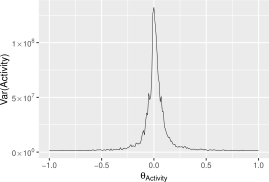
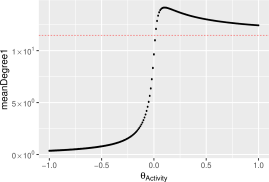
The motivation for this work was my inability to find converged (non-degenerate) ALAAM models for large networks, such as the Pokec and GitHub networks, when the Activity parameter was included, as it typically is in an ALAAM model. Figure 1 shows why this is so. These plots show, for the (undirected) GitHub and Pokec networks, the value of the Activity statistic in simulated ALAAM outcome vectors, as the corresponding parameter is varied from to in increments of . Each data point is the result of one of 100 samples from the ALAAM distribution drawn every iterations after a burn-in period of iterations, using the simulateALAAM function of ALAAMEE (Stivala et al., 2023a). The Density and Contagion parameters are fixed at and , respectively, for GitHub, and and , respectively, for Pokec. These values were chosen to be in the vicinity of the estimated values in the (non-converged) models. It is clear that there is a near discontinuity in the Activity statistic, with a strong peak in its variance, characteristic of the phase transition in the Ising and Potts models (Stoehr, 2017). This is similar to the well-known near-degeneracy in Markov (for example, edge-star and edge-triangle) ERGM models, as described in, for example, Handcock (2003); Snijders et al. (2006); Robins et al. (2007); Koskinen and Daraganova (2013), which often prevents the estimation of such models.
4 A geometrically weighted activity statistic
Since this near-degeneracy in the ALAAM with the Activity parameter appears very similar to that which occurs in the ERGM with the star parameter, the solution may well also be similar. In the ERGM, near-degeneracy in such models is usually avoided by using, rather than two-star, three-star, etc. terms, an “alternating -star” or “geometrically weighted degree” parameter (Robins et al., 2007; Lusher et al., 2013), as proposed by Snijders et al. (2006); Hunter (2007).
Here I will follow Snijders et al. (2006, s. 3.1.1) in using geometrically weighted degree counts for ERGMs, in order to create a geometrically weighted activity statistic for ALAAMs.
First, note that the Activity statistic is
| (2) |
where denotes the degree of node . That is, it is the sum of the degrees of each node for which the outcome binary attribute . And hence the change statistic (Hunter and Handcock, 2006; Snijders et al., 2006; Hunter et al., 2012), that is, the change in the statistic when is changed from 0 to 1 for some node , for the Activity statistic, is just .
The geometrically weighted degree count for ERGM is defined by Snijders et al. (2006, (Eq. 11)) as
| (3) |
where is the number of nodes, is the number of nodes of degree , and is the degree weighting parameter, controlling the geometric rate of decrease of weights as node degree increases (Snijders et al., 2006, p. 112). Analogously, I define the geometrically weighted activity (GWActivity) statistic for ALAAMs as
| (4) |
The change statistic for GWActivity is then simply
| (5) |
Note that is not a model parameter, but rather is fixed at a given value (although of course it may be adjusted as necessary for better convergence or model fit). For large values of , the contribution of higher degree nodes with the outcome attribute is decreased. As decreases to zero, increasing weight is placed on ALAAM outcome vectors with the outcome attribute on high degree nodes.
If , or an equivalent parameter, is estimated as part of the model, then the model becomes a member of the curved exponential family (Hunter, 2007). However in this work the value of is fixed at the “traditional” value of as in Snijders et al. (2006). Via the mathematical relationships described in Snijders et al. (2006); Hunter (2007), this corresponds to the default value of the decay parameter for the alternating -star parameter (Robins et al., 2007) familiar to users of the PNet and MPNet software.
As described in Snijders et al. (2006, p. 114), the ERGM change statistic corresponding to the geometrically weighted degree statistic (3) is a non-decreasing function, with the change becoming smaller as the degrees become larger, and for the change statistic is negative. Hence the conditional log-odds of a tie is greater for a tie between high degree nodes than for a tie between low degree nodes.
The ALAAM change statistic for GWActivity (5), by contrast, is positive, and a non-increasing function, when . Changing a node outcome attribute from zero to one causes the GWActivity statistic (4) to increase, but by a larger amount for low degree nodes than high degree nodes. Hence the conditional log-odds for a node having the outcome attribute is greater for a low degree node than for a high degree node, but in a non-linear fashion, with the marginal decrease in log-odds decreasing geometrically with degree.
Note that the geometrically weighted activity statistic for ALAAMs I have defined here is analogous to the that for ERGMs defined by Snijders et al. (2006), and not the different geometrically weighted degree statistic defined by Hunter (2007), and familiar to users of the statnet ERGM software packages (Handcock et al., 2008, 2016, 2022; Krivitsky et al., 2023). The relationship between those statistics is discussed Hunter (2007, p. 222).
For directed networks, I also define GWSender, the geometrically weighted sender statistic, as
| (6) |
where is the out-degree of node . GWReceiver, the geometrically weighted receiver statistic is
| (7) |
where is the in-degree of node . The corresponding change statistics are
| (8) |
and
| (9) |
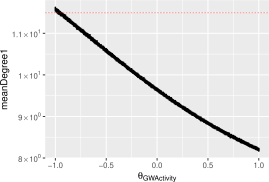
In order to examine the behaviour of the new GWActivity statistic to verify that it removes the near-degenerate behaviour apparent with the standard Activity statistic, I conducted simulation experiments similar to those described above for Figure 1. Figure 2 shows, for the same two networks, the value of the GWActivity statistic as the corresponding parameter is varied (again in increments of 0.01, and with the same burn-in and iterations). The Density and Contagion parameters are fixed at and for GitHub, and the same as described for Figure 1 for Pokec. These parameters were chosen to be in the vicinity of estimated parameters (from models similar to those described in Section 5.2).
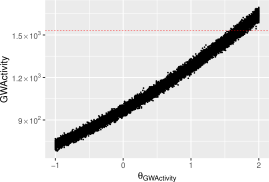
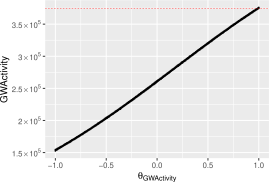
Figure 2 shows that the phase transition apparent in Figure 1 no longer occurs with this parameterization, with the statistic instead being a smoothly non-decreasing function of the parameter. Furthermore, the curve of the statistic values intersects with the observed value at a point where the slope of curve is not extreme, and there is no near discontinuity (unlike Figure 1), suggesting that maximum likelihood estimation is less likely to be problematic.
4.1 Interpretation of the new parameters
As described in Daraganova and Robins (2013), the interpretation of the Activity parameter is that, if it is positive, it means that an actor with multiple ties is more likely to have the outcome attribute. The two-star and three-star parameters then allow for nonlinear dependence on the number of ties. Interpretation of the GWActivity parameter, however, is not quite so straightforward.
Snijders et al. (2006), in the context of the ERGM, describes how the geometrically weighted degree statistic can be re-written in terms of the numbers of -stars, where the weights on the -stars have alternating signs, so that the positive weights of some are balanced by the negative weights of the others. In this way, the single alternating -star parameter replaces a whole series of two-star, three-star, etc. parameters, which when estimated from empirical networks, tend to have parameters with alternating signs (Koskinen and Daraganova, 2013). The interpretation of the alternating -star in ERGM, then, is in terms of the the degree distribution: a positive parameter indicates centralization based on high-degree nodes (“hub” nodes are more likely), and a negative parameter a relatively more equal degree distribution (Robins et al., 2007; Koskinen and Daraganova, 2013). Confusingly (Levy et al., 2016; Martin, 2020; Stivala, 2020b), the interpretation of the statnet gwdegree parameter defined in Hunter (2007) has the opposite interpretation regarding the sign: a negative gwdegree parameter indicates centralization of edges, and a positive gwdegree parameter indicates dispersion of edges (Levy, 2016; Levy et al., 2016).
In the present context, that of the ALAAM, however, the degree distribution is not being modeled, as the network is fixed. Instead, the binary outcome vector is being modeled. Therefore it is not useful to examine the effect of a parameter on the degree distribution of the whole network, but rather of the degree distribution of those nodes which have the outcome attribute (nodes such that ). As discussed above, when , the definition fo the ALAAM change statistic for GWActivity (5) means that the conditional log-odds of a node having the outcome attribute () is higher for a low degree node than a high degree node, and hence a positive value of the corresponding parameter will result in more low degree nodes having the outcome attribute than would otherwise be the case. Regrettably, this would seem likely to lead to confusion similar to that described by Levy et al. (2016): it seems counter-intuitive that a positive parameter should lead to a preference for the outcome attribute on low degree nodes (rather than high degree nodes).
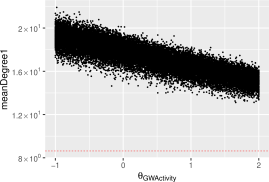
Figure 3 shows the effect of the Activity and GWActivity parameters on the mean degree of nodes with the outcome attribute. (These are from the same simulations as those described for Figure 1 and Figure 2). It is evident that the mean degree of nodes with the outcome attribute does not have a simple relationship to the Activity parameter, first increasing, then after a near discontinuity, decreasing. In contrast, the mean degree of such nodes decreases smoothly as the GWActivity parameter is increased.
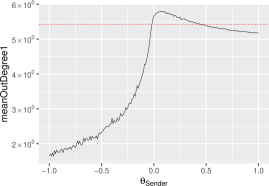
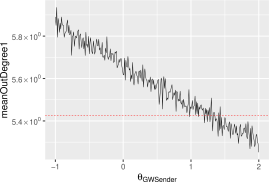
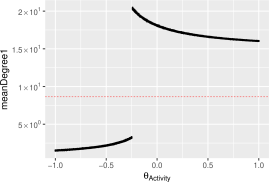
Figure 4 shows similar plots for the, much smaller, high school friendship network. Being a directed network, this plot shows the effect of the GWSender parameter on mean out-degree of nodes with the outcome attribute. For this small network, there is no near-discontinuity when using the Sender statistic (and in fact, an ALAAM for this network can be estimated with the Sender and Receiver parameters, as shown in Section 5.1). The pattern of the mean out-degree of nodes with increasing with the Sender parameter, and then decreasing, while the GWSender parameter results in a smooth decrease, is, however, again apparent.

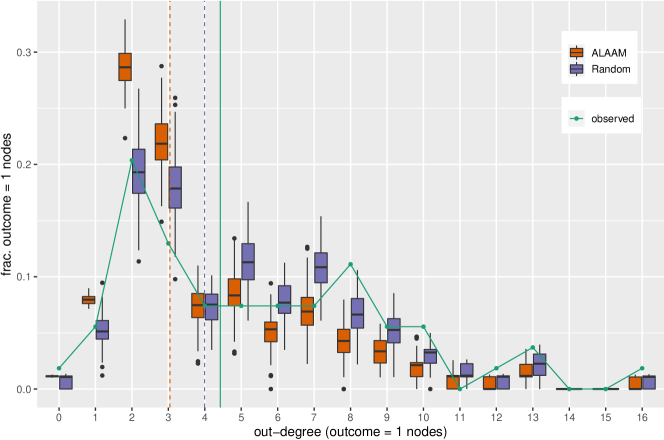
The small size of the high school friendship network also makes it more practical to visualize the degree distributions in order to more closely examine the effect of the GWSender parameter. Figure 5 shows the effect of large magnitude negative and positive GWSender parameters on the distribution of the out-degree of nodes with the outcome attribute, compared with the distribution resulting from a random assignment of the outcome attribute to the nodes. The ALAAM models were simulated with the Density parameter , where is the observed relative frequency of nodes with the outcome attribute, male gender. The random outcome vectors have each element one with probability (where is the th () ALAAM sample), so that the mean attribute density is the same as as that from the ALAAM simulations. For the negative GWSender parameter (), , and for the positive GWSender parameter (, .
For the negative GWSender parameter (Fig. 55(a)), the distribution is less skewed than for the positive GWSender parameter (Fig. 55(b)). The mean out-degree of nodes with the outcome attribute is higher than that for the random (and observed) outcomes for the negative parameter value, and lower than that for the random (and observed) outcomes for the positive parameter value. This reflects the interpretation discussed above (in the context of the undirected GWActivity parameter), that a positive GWSender parameter will lead to a tendency for the outcome attribute to be present on low (rather than high) out-degree nodes.
5 Empirical examples of ALAAMs with the new parameters
5.1 Small network
Table 6 shows six ALAAM models for the high school friendship network, with male gender as the “outcome” binary variable. Table 7 shows the goodness-of fit-results for these models: in all cases, the t-ratio is less than in magnitude, indicating a good fit for that statistic. Models 1–3 are relatively simple models, starting with Sender and Receiver and progressively adding EgoInTwoStar and EgoOutTwoStar (Model 2) and then also EgoInThreeStar and EgoOutThreeStar (Model 3). Model 4 is an equivalent model, but using GWSender and GWReceiver instead of the Sender, Receiver and in- and out-star effects. Model 5 adds a number of additional effects, including transitive triangles and homophily on school class, to the Sender/Receiver/star model (Model 3), while Model 6 adds the extra effects to the GWSender/GWReceiver model (Model 4).
The only parameter that is statistically significant across multiple models is Contagion, which is positive and significant in all cases (except Model 5, where it is not significant). This indicates homophily on (male) gender, consistent with ERGM models for (an undirected version of) this network (Stivala, 2020a; Kevork and Kauermann, 2021). (I estimated an ERGM model similar to that in Stivala (2020a), but for the original directed network, which finds a positive but non-significant effect for gender homophily; data not shown).
| Effect | Model 1 | Model 2 | Model 3 | Model 4 | Model 5 | Model 6 |
|---|---|---|---|---|---|---|
| Density | ||||||
| Sender | — | — | ||||
| EgoOutTwoStar | — | — | — | |||
| EgoOutThreeStar | — | — | — | — | ||
| Receiver | — | — | ||||
| EgoInTwoStar | — | — | — | |||
| EgoInThreeStar | — | — | — | — | ||
| GWSender [] | — | — | — | — | ||
| GWReceiver [] | — | — | — | — | ||
| Contagion | ||||||
| Reciprocity | — | — | — | — | ||
| Contagion Reciprocity | — | — | — | — | ||
| MixedTwoStarSink | — | — | — | — | ||
| MixedTwoStarSource | — | — | — | — | ||
| TransitiveTriangleT1 | — | — | — | — | ||
| TransitiveTriangleT3 | — | — | — | — | ||
| SenderMatch Class | — | — | — | — | ||
| ReceiverMatch Class | — | — | — | — | ||
| ReciprocityMatch Class | — | — | — | — |
Parameter estimates that are statistically significant at the nominal level are shown in bold.
| Effect | Model 1 | Model 2 | Model 3 | Model 4 | Model 5 | Model 6 |
|---|---|---|---|---|---|---|
| AlterInTwoStar2 | ||||||
| AlterOutTwoStar2 | ||||||
| Contagion | ||||||
| Contagion Reciprocity | ||||||
| CyclicTriangleC1 | ||||||
| CyclicTriangleC3 | ||||||
| Density | ||||||
| EgoInThreeStar | — | — | — | — | ||
| EgoInTwoStar | ||||||
| EgoOutThreeStar | — | — | — | — | ||
| EgoOutTwoStar | ||||||
| GWReceiver [] | — | — | — | — | ||
| GWSender [] | — | — | — | — | ||
| MixedTwoStar | ||||||
| MixedTwoStarSink | ||||||
| MixedTwoStarSource | ||||||
| Receiver | ||||||
| ReceiverMatch Class | — | — | — | — | ||
| Reciprocity | ||||||
| ReciprocityMatch Class | — | — | — | — | ||
| Sender | ||||||
| SenderMatch Class | — | — | — | — | ||
| TransitiveTriangleD1 | ||||||
| TransitiveTriangleT1 | ||||||
| TransitiveTriangleT3 | ||||||
| TransitiveTriangleU1 |
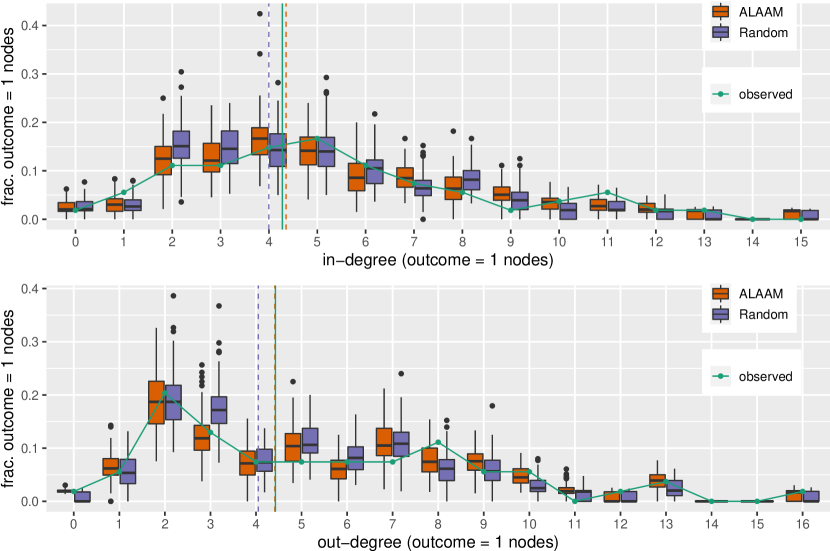
Although they are statistically non-significant, so we can make no inferences from them, it is instructive to compare the estimated Sender, EgoOutTwoStar, EgoOutThreeStar, Receiver, EgoInTwoStar, and EgoInThreeStar parameters in Model 5, with the GWSender and GWReceiver parameter estimates in Model 6 (Table 6). In Model 5, Sender is negative, EgoOutTwoStar is positive, and EgoOutThreeStar is negative; they have alternating signs, as discussed in Section 4.1. Receiver is negative, EgoInTwoStar positive, and EgoInThreeStar negative, so again the signs are alternating (note that Receiver and EgoInTwoStar have swapped signs relative to Model 3, however). In Model 6, GWSender is positive, while GWReceiver is negative. Figure 6 shows that Model 6 fits the in-degree and out-degree distributions of nodes with the outcome attribute well, although a simple random assignment of the outcome attribute with the same density is not much worse (which, given that the GWSender and GWReceiver parameters are not statistically significant, should not be surprising).
5.2 Large networks
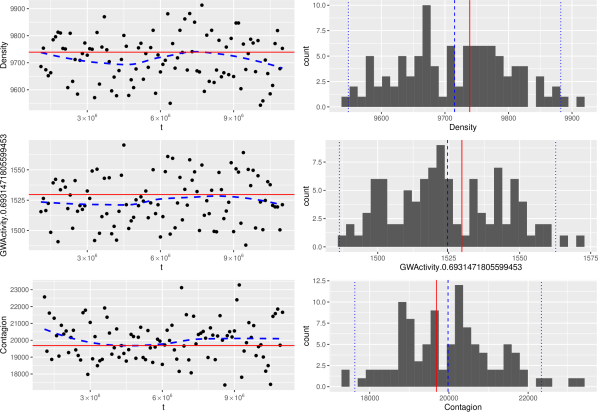
Table 8 shows ALAAM parameters estimated for the GitHub network with developer type as the “outcome” binary attribute. I was unable to estimate a converged (non-degenerate) model for this data using the Density, Activity, and Contagion parameters, but using GWActivity instead the model is converged and non-degenerate, as shown in Figure 7, which shows trace plots and histograms of outcome vectors simulated from the model in Table 8, along with the observed values of the statistics corresponding to the parameters in the model. The observed values are central in the (approximately normal) distribution of the simulated values, indicating that the model is converged and not near-degenerate. The only parameter (other than Density) that is statistically significant in this model is GWActivity, which is positive. As discussed in Section 4.1, this means we expect that more low-degree nodes will have the outcome attribute than would otherwise be the case (conditional on all the other effects in the model, and on the degree distribution itself, since the network is fixed in the ALAAM). This is consistent with what we observe simply from the degrees of the nodes with and without the outcome attribute shown in Table 5; nodes with the outcome attribute have lower mean degree than the overall mean degree.
| Effect | Estimate | Std. error | |
|---|---|---|---|
| Density | -1.287 | 0.033 | * |
| GWActivity [] | 1.712 | 0.127 | * |
| Contagion | 0.002 | 0.001 |
Asterisks indicate statistical significance at the level. Results from 100 parallel runs.
An ALAAM model for the undirected Pokec network with male gender as the “outcome” attribute is shown in Table 9, with the degeneracy check plots in Figure 8 showing that the model is converged. I was unable to estimate a converged (non-degenerate) model with this network when the Activity parameter was included, but using GWActivity instead solves this problem. All the parameters in this model are statistically significant. The negative Contagion parameter indicates heterophily on (male) gender, while the positive Age parameter indicates that males are likely to be older than females. This is consistent with simple descriptive statistics for this data: assortativity (Newman, 2003) on the “male” binary attribute is negative (), and the mean age for male actors () is higher than that for non-male actors () with the difference significant according to Welch’s -test (). The positive GWActivity parameter indicates, as discussed in Section 4.1, that low degree nodes are more likely to represent male actors than would otherwise be the case. This is as we might expect, given that male (outcome ) nodes have lower mean degree than the mean degree than others (Table 5).
| Effect | Estimate | Std. error | |
|---|---|---|---|
| Density | -0.188 | < 0.001 | * |
| GWActivity [] | 0.077 | 0.001 | * |
| Contagion | -0.005 | < 0.001 | * |
| Age | 0.009 | < 0.001 | * |
Asterisks indicate statistical significance at the level. Results from 100 parallel runs.
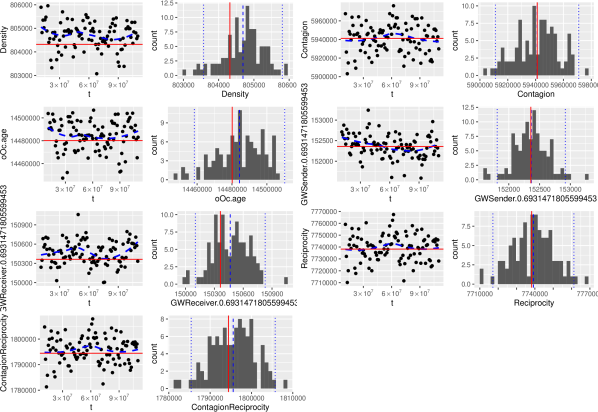
A more complex ALAAM model for the directed Pokec network with male gender as “outcome” variable, is shown in Table 10. I could not find a converged (non-degenerate) ALAAM model for this network using the Sender and Receiver parameters, but as shown in Figure 9, this model using GWSender and GWReceiver converges well. Again, all the parameters in this model are statistically significant. As we expect given the results for the undirected network, the Age effect is positive and the Contagion effect negative; this is also consistent with the ERGM model of this network in Stivala et al. (2020a). However Contagion Reciprocity is positive, indicating that actors connected by a reciprocated (mutual) tie are more likely to both be male (given the other effects in the model, including specifically the negative Contagion parameter, indicating that a male actor on both ends of a tie is under-represented). The GWSender and GWReceiver parameters are of different signs: GWSender is negative, and GWReceiver positive. Again, as per the discussion Section 4.1, this is as we expect, given that male actors have higher mean out-degree, but lower mean in-degree than others (Table 5).
| Effect | Estimate | Std. error | |
|---|---|---|---|
| Density | -0.015 | 0.002 | * |
| GWSender [] | -0.509 | 0.011 | * |
| GWReceiver [] | 0.517 | 0.011 | * |
| Reciprocity | 0.023 | < 0.001 | * |
| Contagion | -0.028 | < 0.001 | * |
| Contagion Reciprocity | 0.019 | 0.001 | * |
| Age | 0.008 | < 0.001 | * |
Asterisks indicate statistical significance at the level. Results from 100 parallel runs.

6 Conclusions and future work
I have shown that the problem of near-degeneracy can occur in simple ALAAMs applied to empirical networks, preventing the estimation of such models in some examples. I defined the geometrically weighted activity, geometrically weighted sender, and geometrically weighted receiver statistics, analogous to the geometrically weighted degree statistics for ERGMs described by Snijders et al. (2006), and showed that they avoid this problem, and allow ALAAM parameters to be estimated for these networks. I described the interpretation of these new parameters, with illustrative examples.
In this work, I defined these statistics and demonstrated the use for one-mode undirected and directed networks. A simple extension would be to two-mode (bipartite) networks, which might allow a converged ALAAM to be found for the larger director interlock network (Evtushenko and Gastner, 2020) which I was unable to find, while I could find a converged ALAAM for the smaller director interlock network in Stivala et al. (2023b),
In the examples shown here, I found that only the geometrically weighted activity (or sender and receiver) statistic was necessary to overcome the problem of near-degeneracy: the Contagion statistic, when used with geometrically weighted activity (or sender and receiver) statistics, did not seem to be problematic. Indeed, when I experimented with a “geometrically weighted contagion” statistic, I found it to be not just unnecessary, but actually deleterious to model convergence. Given that I used only simple models for the large network examples, this leaves open the question of whether or not geometrically weighted statistics are necessary or useful for triangular configurations in the ALAAM (as they are in ERGM).
Some problems remain, however. As discussed in Section 4.1, interpretation of the new parameters is likely to be confusing, given the counter-intuitive meaning of a positive parameter indicating a propensity for the outcome attribute to be present on low (rather than high) degree nodes. Simulation experiments such as those shown in Figure 5, which, not coincidentally, somewhat resembles the output of the interactive R application created to help with the interpretation of the statnet gwdegree parameter (Levy, 2016), could help with this. However the interpretation is (aside from the potential for the sign-based confusion), inherently difficult, as it is linked to the degree distribution of nodes with the outcome attribute, and conditional not only on all the other parameters in the model, but also on the degree distribution of the network itself (which is fixed in the ALAAM). This is particularly complicated in the case of directed networks, in which there is both an in-degree and out-degree distribution, and interpretation of the GWSender and GWReceiver parameters are conditional on each other. In this work I have described the interpretation of these parameters as illustrative examples, however in empirical applications it might be advisable to refrain from making substantive claims based on these parameters, and just consider them as “controls” for the degree distribution of nodes with the outcome attribute, needed for correct interpretation of the Contagion (and other) parameters. Of course, this is assuming that parameter interpretation is actually want we want do — and perhaps it is not, and we would rather use the model to generate simulations in order test predictions regarding their inability to fit some statistic (Martin, 2020), or to experiment with simulations from different models with slightly modified parameters (Steglich and Snijders, 2022).
Another avenue for future work is that a value for the decay parameter has to be specified. The default value of appears to work well on the examples in this work, but it may have to be adjusted for better convergence or model fit on other networks, which would involve a process of trial and error, or, more systematically, “grid search” as, for example, done for the analogous parameter in ERGMs in Stivala and Lomi (2021). Estimating this parameter would make the model a “curved ALAAM”, which cannot be estimated by the methods used in this work.
In this work, I overcame the problem of near-degeneracy in ALAAMs by defining a geometrically weighted activity statistic, analogous to the most frequently used technique of avoiding the problem in ERGMs. There are, however, other ways of avoiding this problem in ERGMs, which could potentially be applied to ALAAMs. These included the “tapering” method (Fellows and Handcock, 2017; Blackburn and Handcock, 2023), and the “degeneracy-restricted” method (Karwa et al., 2022), as well as other forms of additional structure discussed in Schweinberger et al. (2020) such as multilevel, block and spatial structure. An alternative approach might be to consider an ALAAM analogue of the latent order logistic (LOLOG) model (Fellows, 2018; Clark and Handcock, 2022).
Funding
This work was funded by the Swiss National Science Foundation (SNSF) project number 200778.
Acknowledgements
This work was performed on the OzSTAR national facility at Swinburne University of Technology. The OzSTAR program receives funding in part from the Astronomy National Collaborative Research Infrastructure Strategy (NCRIS) allocation provided by the Australian Government, and from the Victorian Higher Education State Investment Fund (VHESIF) provided by the Victorian Government.
Discussions at weekly MelNet meetings hosted by Dr Peng Wang at Swinburne University of Technology were useful in inspiring this work, and I also thank Dr Wang for arranging access to the OzSTAR supercomputing facility at Swinburne University of Technology. I am grateful to Prof. Alessandro Lomi for funding as responsible applicant for SNSF grant number 200778, and for general discussion of the ALAAM.
Data availability statement
The SocioPatterns high school friendship data (Mastrandrea et al., 2015) is available from http://www.sociopatterns.org/datasets/high-school-contact-and-friendship-networks/. The “Pokec” (Takac and Zabovsky, 2012) data is available from the Stanford large network dataset collection (Leskovec and Krevl, 2014) at http://snap.stanford.edu/data/soc-Pokec.html. The “GitHub” (Rozemberczki et al., 2021) online social network data is available from the same collection at http://snap.stanford.edu/data/github-social.html. All other data, source code, and scripts are freely available from https://github.com/stivalaa/ALAAMEE.
References
- Amati et al. (2018) V. Amati, A. Lomi, and A. Mira. Social network modeling. Annual Review of Statistics and its Application, 5:343–369, 2018.
- Barnes et al. (2020) M. L. Barnes, P. Wang, J. E. Cinner, N. A. Graham, A. M. Guerrero, L. Jasny, J. Lau, S. R. Sutcliffe, and J. Zamborain-Mason. Social determinants of adaptive and transformative responses to climate change. Nature Climate Change, 10(9):823–828, 2020.
- Besag (1972) J. E. Besag. Nearest-neighbour systems and the auto-logistic model for binary data. Journal of the Royal Statistical Society Series B: Statistical Methodology, 34(1):75–83, 1972.
- Blackburn and Handcock (2023) B. Blackburn and M. S. Handcock. Practical network modeling via tapered exponential-family random graph models. Journal of Computational and Graphical Statistics, 32(2):388–401, 2023.
- Bodin and Chen (2023) Ö. Bodin and H. Chen. A network perspective of human–nature interactions in dynamic and fast-changing landscapes. National Science Review, 10(7):nwad019, 2023.
- Borisenko et al. (2020) A. Borisenko, M. Byshkin, and A. Lomi. A simple algorithm for scalable Monte Carlo inference. arXiv preprint arXiv:1901.00533v4, 2020.
- Bryant et al. (2017) R. A. Bryant, H. C. Gallagher, L. Gibbs, P. Pattison, C. MacDougall, L. Harms, K. Block, E. Baker, V. Sinnott, G. Ireton, et al. Mental health and social networks after disaster. American Journal of Psychiatry, 174(3):277–285, 2017.
- Byshkin et al. (2016) M. Byshkin, A. Stivala, A. Mira, R. Krause, G. Robins, and A. Lomi. Auxiliary parameter MCMC for exponential random graph models. Journal of Statistical Physics, 165(4):740–754, 2016.
- Byshkin et al. (2018) M. Byshkin, A. Stivala, A. Mira, G. Robins, and A. Lomi. Fast maximum likelihood estimation via equilibrium expectation for large network data. Scientific Reports, 8:11509, 2018.
- Chatterjee and Diaconis (2013) S. Chatterjee and P. Diaconis. Estimating and understanding exponential random graph models. The Annals of Statistics, 41(5):2428–2461, 2013.
- Cimini et al. (2019) G. Cimini, T. Squartini, F. Saracco, D. Garlaschelli, A. Gabrielli, and G. Caldarelli. The statistical physics of real-world networks. Nature Reviews Physics, 1:58–71, 2019.
- Clark and Handcock (2022) D. A. Clark and M. S. Handcock. Comparing the real-world performance of exponential-family random graph models and latent order logistic models for social network analysis. Journal of the Royal Statistical Society Series A: Statistics in Society, 185(2):566–587, 2022.
- Csárdi and Nepusz (2006) G. Csárdi and T. Nepusz. The igraph software package for complex network research. InterJournal, Complex Systems:1695, 2006. URL https://igraph.org.
- Daraganova (2009) G. Daraganova. Statistical models for social networks and network-mediated social influence processes: Theory and application. PhD thesis, The University of Melbourne, 2009.
- Daraganova and Robins (2013) G. Daraganova and G. Robins. Autologistic actor attribute models. In D. Lusher, J. Koskinen, and G. Robins, editors, Exponential Random Graph Models for Social Networks, chapter 9, pages 102–114. Cambridge University Press, New York, 2013.
- Diviák et al. (2020) T. Diviák, J. A. Coutinho, and A. D. Stivala. A man’s world? Comparing the structural positions of men and women in an organized criminal network. Crime, Law and Social Change, 74:547–569, 2020.
- Evtushenko and Gastner (2020) A. Evtushenko and M. T. Gastner. Beyond Fortune 500: Women in a global network of directors. In H. Cherifi, S. Gaito, J. F. Mendes, E. Moro, and L. M. Rocha, editors, Complex Networks and Their Applications VIII, pages 586–598, Cham, 2020. Springer International Publishing.
- Fellows and Handcock (2017) I. Fellows and M. Handcock. Removing phase transitions from Gibbs measures. In A. Singh and J. Zhu, editors, Proceedings of the 20th International Conference on Artificial Intelligence and Statistics, volume 54 of Proceedings of Machine Learning Research, pages 289–297, 20–22 Apr 2017.
- Fellows and Handcock (2012) I. Fellows and M. S. Handcock. Exponential-family random network models. arXiv preprint arXiv:1208.0121, 2012.
- Fellows (2018) I. E. Fellows. A new generative statistical model for graphs: The latent order logistic (LOLOG) model. arXiv preprint arXiv:1804.04583, 2018.
- Fellows and Handcock (2013) I. E. Fellows and M. S. Handcock. Analysis of partially observed networks via exponential-family random network models. arXiv preprint arXiv:1303.1219, 2013.
- Fujimoto et al. (2019) K. Fujimoto, P. Wang, C. A. Flash, L. M. Kuhns, Y. Zhao, M. Amith, and J. A. Schneider. Network modeling of PrEP uptake on referral networks and health venue utilization among young men who have sex with men. AIDS and Behavior, 23:1698–1707, 2019.
- Gallagher (2019) H. C. Gallagher. Social networks and the willingness to communicate: Reciprocity and brokerage. Journal of Language and Social Psychology, 38(2):194–214, 2019.
- Ghafouri and Khasteh (2020) S. Ghafouri and S. H. Khasteh. A survey on exponential random graph models: an application perspective. PeerJ Computer Science, 6:e269, 2020.
- Handcock (2003) M. S. Handcock. Assessing degeneracy in statistical models of social networks. Technical Report 39, Center for Statistics and the Social Sciences, University of Washington, 2003. URL https://csss.uw.edu/Papers/wp39.pdf.
- Handcock et al. (2008) M. S. Handcock, D. R. Hunter, C. T. Butts, S. M. Goodreau, Morris, and Martina. statnet: Software tools for the representation, visualization, analysis and simulation of network data. Journal of Statistical Software, 24(1):1–11, 2008. URL http://www.jstatsoft.org/v24/i01.
- Handcock et al. (2016) M. S. Handcock, D. R. Hunter, C. T. Butts, S. M. Goodreau, P. N. Krivitsky, S. Bender-deMoll, and M. Morris. statnet: Software Tools for the Statistical Analysis of Network Data. The Statnet Project (http://www.statnet.org), 2016. URL http://CRAN.R-project.org/package=statnet. R package version 2019.6.
- Handcock et al. (2022) M. S. Handcock, D. R. Hunter, C. T. Butts, S. M. Goodreau, P. N. Krivitsky, and M. Morris. ergm: Fit, Simulate and Diagnose Exponential-Family Models for Networks. The Statnet Project (http://www.statnet.org), 2022. URL http://CRAN.R-project.org/package=ergm. R package version 4.3.2.
- Hunter (2007) D. R. Hunter. Curved exponential family models for social networks. Social Networks, 29(2):216–230, 2007.
- Hunter and Handcock (2006) D. R. Hunter and M. S. Handcock. Inference in curved exponential family models for networks. Journal of Computational and Graphical Statistics, 15(3):565–583, 2006.
- Hunter et al. (2012) D. R. Hunter, P. N. Krivitsky, and M. Schweinberger. Computational statistical methods for social network models. Journal of Computational and Graphical Statistics, 21(4):856–882, 2012.
- Karwa et al. (2022) V. Karwa, S. Petrović, and D. Bajić. DERGMs: Degeneracy-restricted exponential family random graph models. Network Science, 10(1):82–110, 2022. doi: 10.1017/nws.2022.5.
- Kashima et al. (2013) Y. Kashima, S. Wilson, D. Lusher, L. J. Pearson, and C. Pearson. The acquisition of perceived descriptive norms as social category learning in social networks. Social Networks, 35(4):711–719, 2013.
- Kevork and Kauermann (2021) S. Kevork and G. Kauermann. Iterative estimation of mixed exponential random graph models with nodal random effects. Network Science, 9(4):478–498, 2021. doi: 10.1017/nws.2021.22.
- Kleineberg and Boguñá (2014) K.-K. Kleineberg and M. Boguñá. Evolution of the digital society reveals balance between viral and mass media influence. Physical Review X, 4(3):031046, 2014.
- Koskinen (2020) J. Koskinen. Exponential random graph modelling. In P. Atkinson, S. Delamont, A. Cernat, J. Sakshaug, and R. Williams, editors, SAGE Research Methods Foundations. SAGE, London, 2020. doi: 10.4135/9781526421036888175.
- Koskinen and Daraganova (2013) J. Koskinen and G. Daraganova. Exponential random graph model fundamentals. In D. Lusher, J. Koskinen, and G. Robins, editors, Exponential Random Graph Models for Social Networks, chapter 6, pages 49–76. Cambridge University Press, New York, 2013.
- Koskinen and Daraganova (2022) J. Koskinen and G. Daraganova. Bayesian analysis of social influence. Journal of the Royal Statistical Society Series A: Statistics in Society, 185(4):1855–1881, 2022.
- Krivitsky et al. (2023) P. N. Krivitsky, D. R. Hunter, M. Morris, and C. Klumb. ergm 4: New features for analyzing exponential-family random graph models. Journal of Statistical Software, 105(6):1–44, 2023. doi: 10.18637/jss.v105.i06.
- Leskovec and Krevl (2014) J. Leskovec and A. Krevl. SNAP Datasets: Stanford large network dataset collection. http://snap.stanford.edu/data, June 2014.
- Letina (2016) S. Letina. Network and actor attribute effects on the performance of researchers in two fields of social science in a small peripheral community. Journal of Informetrics, 10(2):571–595, 2016.
- Letina et al. (2016) S. Letina, G. Robins, and D. Maslić Seršić. Reaching out from a small scientific community: the social influence models of collaboration across national and disciplinary boundaries for scientists in three fields of social sciences. Revija za sociologiju, 46(2):103–139, 2016.
- Levy (2016) M. Levy. gwdegree: Improving interpretation of geometrically-weighted degree estimates in exponential random graph models. Journal of Open Source Software, 1(3):36, 2016.
- Levy et al. (2016) M. Levy, M. Lubell, P. Leifeld, and S. Cranmer. Interpretation of gw-degree estimates in ERGMs, June 2016. URL https://doi.org/10.6084/m9.figshare.3465020.v1.
- Lusher et al. (2013) D. Lusher, J. Koskinen, and G. Robins, editors. Exponential Random Graph Models for Social Networks. Structural Analysis in the Social Sciences. Cambridge University Press, New York, 2013.
- Martin (2020) J. L. Martin. Comment on geodesic cycle length distributions in delusional and other social networks. Journal of Social Structure, 21(1):77–93, 2020. doi: 10.21307/joss-2020-003.
- Mastrandrea et al. (2015) R. Mastrandrea, J. Fournet, and A. Barrat. Contact patterns in a high school: a comparison between data collected using wearable sensors, contact diaries and friendship surveys. PLoS ONE, 10(9):e0136497, 2015.
- Matous and Bodin (2021) P. Matous and Ö. Bodin. Hub-and-spoke social networks among Indonesian cocoa farmers homogenize farming practices. Preprint available at Research Square, 2021. URL https://doi.org/10.21203/rs.3.rs-502220/v1.
- Neidhardt (2016) J. Neidhardt. Modeling and understanding social influence in groups and networks. PhD thesis, Technische Universität Wien, 2016.
- Newman (2003) M. E. Newman. Mixing patterns in networks. Physical Review E, 67(2):026126, 2003.
- Ocelik et al. (2021) P. Ocelik, L. Lehotskỳ, and F. Černoch. Beyond our backyard: Social networks, differential participation, and local opposition to coal mining in europe. Energy Research & Social Science, 72:101862, 2021.
- Parker et al. (2022) A. Parker, F. Pallotti, and A. Lomi. New network models for the analysis of social contagion in organizations: an introduction to autologistic actor attribute models. Organizational Research Methods, 25(3):513–540, 2022.
- Rank (2014) O. N. Rank. The effect of structural embeddedness on start-up survival: a case study in the German biotech industry. Journal of Small Business & Entrepreneurship, 27(3):275–299, 2014.
- Robins et al. (2001) G. Robins, P. Pattison, and P. Elliott. Network models for social influence processes. Psychometrika, 66(2):161–189, 2001.
- Robins et al. (2007) G. Robins, T. A. B. Snijders, P. Wang, M. Handcock, and P. Pattison. Recent developments in exponential random graph () models for social networks. Social Networks, 29(2):192–215, 2007.
- Rozemberczki et al. (2021) B. Rozemberczki, C. Allen, and R. Sarkar. Multi-scale attributed node embedding. Journal of Complex Networks, 9(2):cnab014, 2021.
- Schweinberger (2011) M. Schweinberger. Instability, sensitivity, and degeneracy of discrete exponential families. Journal of the American Statistical Association, 106(496):1361–1370, 2011. doi: 10.1198/jasa.2011.tm10747.
- Schweinberger et al. (2020) M. Schweinberger, P. N. Krivitsky, C. T. Butts, and J. R. Stewart. Exponential-family models of random graphs: inference in finite, super and infinite population scenarios. Statistical Science, 35(4):627–662, 2020.
- Snijders (2002) T. A. B. Snijders. Markov chain Monte Carlo estimation of exponential random graph models. Journal of Social Structure, 3(2):1–40, 2002.
- Snijders (2017) T. A. B. Snijders. Stochastic actor-oriented models for network dynamics. Annual Review of Statistics and its Application, 4:343–363, 2017.
- Snijders et al. (2006) T. A. B. Snijders, P. E. Pattison, G. L. Robins, and M. S. Handcock. New specifications for exponential random graph models. Sociological Methodology, 36(1):99–153, 2006.
- Song et al. (2020) X. Song, J. Jin, Y.-H. Liu, and X. Yan. Lose your weight with online buddies: behavioral contagion in an online weight-loss community. Information Technology & People, 33(1):22–36, 2020.
- Stadtfeld et al. (2019) C. Stadtfeld, A. Vörös, T. Elmer, Z. Boda, and I. J. Raabe. Integration in emerging social networks explains academic failure and success. Proceedings of the National Academy of Sciences of the USA, 116(3):792–797, 2019.
- Steglich and Snijders (2022) C. E. G. Steglich and T. A. B. Snijders. Stochastic network modeling as generative social science. In K. Gërxhani, N. de Graaf, and W. Raub, editors, Handbook of Sociological Science: Contributions to Rigorous Sociology, chapter 5, pages 73–99. Edward Elgar Publishing, New York, 2022.
- Stivala (2020a) A. Stivala. Geodesic cycle length distributions in delusional and other social networks. Journal of Social Structure, 21(1):35–76, 2020a. doi: 10.21307/joss-2020-002.
- Stivala (2020b) A. Stivala. Reply to “Comment on geodesic cycle length distributions in delusional and other social networks”. Journal of Social Structure, 21(1):94–106, 2020b. doi: 10.21307/joss-2020-004.
- Stivala and Lomi (2021) A. Stivala and A. Lomi. Testing biological network motif significance with exponential random graph models. Applied Network Science, 6(1):91, 2021.
- Stivala et al. (2020a) A. Stivala, G. Robins, and A. Lomi. Exponential random graph model parameter estimation for very large directed networks. PLoS ONE, 15(1):e0227804, 2020a.
- Stivala et al. (2023a) A. Stivala, P. Wang, and A. Lomi. ALAAMEE, 2023a. URL https://github.com/stivalaa/ALAAMEE.
- Stivala et al. (2023b) A. Stivala, P. Wang, and A. Lomi. Numbers and structural positions of women in a national director interlock network. Talk preseented at INSNA Sunbelt XLIII Conference, June 2023b. URL https://doi.org/10.5281/zenodo.8092829.
- Stivala et al. (2020b) A. D. Stivala, H. C. Gallagher, D. A. Rolls, P. Wang, and G. L. Robins. Using sampled network data with the autologistic actor attribute model. arXiv preprint arXiv:2002.00849, 2020b.
- Stoehr (2017) J. Stoehr. A review on statistical inference methods for discrete Markov random fields. arXiv preprint arXiv:1704.03331, 2017.
- Takac and Zabovsky (2012) L. Takac and M. Zabovsky. Data analysis in public social networks. In International Scientific Conference and International Workshop Present Day Trends of Innovations, volume 1, pages 1–6, 2012. URL http://snap.stanford.edu/data/soc-pokec.pdf.
- Wang et al. (2009a) P. Wang, G. Robins, and P. Pattison. PNet: A program for the simulation and estimation of exponential random graph models. Melbourne School of Psychological Sciences, The University of Melbouxrne, 2009a. URL http://www.melnet.org.au/s/PNetManual.pdf.
- Wang et al. (2009b) P. Wang, K. Sharpe, G. L. Robins, and P. E. Pattison. Exponential random graph (p*) models for affiliation networks. Social Networks, 31(1):12–25, 2009b.
- Wang et al. (2014) P. Wang, G. Robins, P. Pattison, and J. Koskinen. MPNet: Program for the simulation and estimation of (p*) exponential random graph models for multilevel networks. Melbourne School of Psychological Sciences, The University of Melbourne, 2014. URL http://www.melnet.org.au/s/MPNetManual.pdf.
- Wang et al. (2022) P. Wang, A. Stivala, G. Robins, P. Pattison, J. Koskinen, and A. Lomi. PNet: Program for the simulation and estimation of (p*) exponential random graph models for multilevel networks, 2022. URL http://www.melnet.org.au/s/MPNetManual2022.pdf.
- Wang et al. (2023) Z. Wang, I. E. Fellows, and M. S. Handcock. Understanding networks with exponential-family random network models. Social Networks, 2023. doi: 10.1016/j.socnet.2023.07.003.
- Wood (2019) M.-A. Wood. Do personality traits drive online commitment to vote in social networks? PhD thesis, The University of Melbourne, 2019.