User Training with Error Augmentation for Electromyogram-based Gesture Classification
Abstract
We designed and tested a system for real-time control of a user interface by extracting surface electromyographic (sEMG) activity from eight electrodes in a wrist-band configuration. sEMG data were streamed into a machine-learning algorithm that classified hand gestures in real-time. After an initial model calibration, participants were presented with one of three types of feedback during a human-learning stage: veridical feedback, in which predicted probabilities from the gesture classification algorithm were displayed without alteration, modified feedback, in which we applied a hidden augmentation of error to these probabilities, and no feedback. User performance was then evaluated in a series of minigames, in which subjects were required to use eight gestures to manipulate their game avatar to complete a task. Experimental results indicated that, relative to baseline, the modified feedback condition led to significantly improved accuracy and improved gesture class separation. These findings suggest that real-time feedback in a gamified user interface with manipulation of feedback may enable intuitive, rapid, and accurate task acquisition for sEMG-based gesture recognition applications.
Index Terms:
Myoelectric control, Gesture recognition, Human-computer interaction, Error augmentation, Co-adaptation, Surface Electromyography (sEMG),I Introduction
Surface electromyography (EMG) provides a convenient sensor modality for human-computer interaction (HCI) applications [1]. In the past two decades, research efforts have sought to translate the electrical activity associated with muscle contraction into control commands for general use computing, prosthetic control, and motor rehabilitation [2, 3].
Traditional approaches to EMG-based gesture recognition assumed stationarity of the muscle activation to gesture mapping, and did not consider the user’s ability to adapt their behavior to feedback about the performance of the algorithm used for gesture classification. The emergence of co-adaptive learning algorithms in the past decade represented a marked shift, acknowledging the human and machine learning as part of integrated system [4, 5, 6, 7, 8]. One key finding from these approaches is that when the human receives continuous feedback about the mapping of muscle activation to gesture, they can increase classification performance [9] through behavioral adaptation to increase class separability [10] or increase movement repeatability [11]. However, to-date, little attention has been paid to how feedback about about classifier performance impacts behavioral adaptations of human learner.
The ability to shape human behavioral adaptation and motor skill learning through the use of augmented feedback is well established. Strategies such as error augmentation [12, 13, 14] and reward manipulation [15, 16] have been shown to affect the rate and retention of learning as well as the behavioral variability. Yet, to our knowledge the use of augmented feedback has not been tested for co-adaptation approaches to EMG-based gesture recognition.
In this study subjects were given real-time feedback on predicted gesture probabilities from a machine learning model under three conditions: no feedback, veridical feedback, and modified feedback via error augmentation. Participants were asked to freely explore gesture positions while viewing feedback in order to find optimal muscle activation patterns for producing a desired gesture using a fixed model. Modified feedback was produced by a hidden softening of the model probabilities toward a uniform distribution, to guide participants to increase the class separability of their muscle activation patterns. We hypothesized that users who explored hand positions under the more challenging modified feedback condition would learn to create more distinct gestures, thereby improving future classification performance.
II Experimental Design
All protocols were approved by the Northeastern University Institutional Review Board (IRB number 15-10-22) in conformance with the declaration of Helsinki.
II-A Subjects
Forty-four right-handed subjects (21 male/ 23 female, mean age 1 standard deviation: years) participated after providing IRB-approved written informed consent. Subjects were free of orthopedic or neurological disease that could interfere with the task and had normal or corrected-to-normal vision.
II-B Experimental Setup

Subjects viewed a computer display while seated at a table with their right arm positioned comfortably in an armrest trough. Surface electromyography (sEMG) (Trigno, Delsys Inc., sampling frequency: 1926 Hz) was collected from the muscles of the right forearm. Eight sEMG electrodes were positioned at equidistant positions around the circumference of the forearm, at a four finger-width distance from the ulnar styloid (the subject’s left hand was wrapped around the right forearm at the ulnar styloid to determine the sEMG placement). The first electrode was placed mid-line on the dorsal aspect of the forearm, and the other electrodes were then equally spaced (see Figure 1).
II-C Data Acquisition
Subjects were randomly assigned to one of three groups and performed a series of tasks as described below. Subjects who were unable to complete all tasks were excluded from further analysis. Each subject group was assigned a different feedback condition: no feedback (“Control”, N=), veridical feedback (“Veridical”, N=), or modified feedback (“Modified”, N=) (see Section II-C4 for details).
II-C1 Gesture Timing
Subjects performed a series of tasks composed of one or more gesture trials to move an avatar dice (see details of user interface below). Prior to the start of a trial, the subject’s forearm and wrist rested in a pronated position on the trough with the wrist neutral. In each trial, subjects were required to rest or to produce one of eight active gestures (label and action provided in brackets): index-thumb pinch [“Pinch”, decrease number on avatar dice], index-thumb key press [“Thumb”, increase number on avatar dice], closed fist [“Fist”, decrease size of avatar dice], full finger extension [“Open”, increase size of avatar dice], wrist extension [“Up”, move up], wrist flexion [“Down”, move down], wrist ulnar deviation [“Left”, move left], radial wrist deviation [“Right”, move right]. Each trial began with a ‘prompting’ epoch ( sec) cued by a yellow bounding box the participant’s display and a picture of the instructed gesture (Calibration and Instructed blocks only, see below), a ‘gesture production’ epoch ( sec) cued by a green bounding box, and a ‘recovery’ epoch ( sec) cued by a red bounding box. See Figure 2 for example timing.

Each session was divided into four blocks.
II-C2 Block One: Calibration
Subjects from all groups were instructed to perform five consecutive repetitions of each active gesture and eight repetitions of a rest gesture [“Rest”] in which they were asked to relax the hand. This consecutive structure was chosen to help keep the task simple while the participant initially learned the set of available gestures. A classification model was trained on this small dataset before continuing to the next experimental block.
II-C3 Block Two: Instructed Games
Subjects from all groups engaged in four practice mini-games. In each mini-game, subjects were instructed to perform a sequence of six gestures to bring an avatar that was shown on the computer screen from a starting position to a desired goal state (e.g. see Figure 3). The trial timing epochs (prompting, gesture production, and rest) were as described above. In this block, the classifier model’s predicted probabilities were displayed as post-hoc feedback to the user, but was not used to modify the avatar position or state; the avatar always moved one step closer to the goal after each trial, so that each game lasted exactly six moves. These games were structured so that the total gestures ( games with moves each) were evenly distributed among the active gestures. After this block, the classification model was retrained from scratch using the labeled data from blocks one and two. This training set comprised examples for each of the classes ( active gestures and “Rest”).
II-C4 Block Three: Live Feedback
Only subjects in the veridical feedback and modified feedback groups participated in this block. Subjects engaged in mini-games while receiving different types of real-time feedback ( sec duration in the ‘gesture production’ epoch to produce active gestures). Subjects were asked to freely explore their hand posture in order to maximize the predicted probability of the current gesture class, visible as real-time output of the trained model. For the veridical feedback group, predicted class probabilities were displayed without modification, whereas the modified feedback group was shown probabilities that were softened. This softening procedure is described in detail in Section III-C, and serves to adjust the model’s predicted probabilities towards a uniform distribution, with the hope that this encourages participants to compensate by performing more precise gestures. Subjects in the modified feedback group were not informed about this softening procedure.
II-C5 Block Four: Free Games
All subjects were instructed to perform a series of mini-games. The mini-games had the same structure as in block two, with each game requiring a minimum of six moves to bring the avatar from its starting position to a desired goal state. However, unlike the practice mini-games of block two, subjects were tasked with bringing the avatar to its goal state by planning and producing a gesture sequence of their choice. Critically, the avatar only changed its state when the classifier assigned one class a predicted probability above a decision threshold of . The experimenter manually recorded each attempted gesture to serve as labels for subsequent analysis, and the participant’s hand movements were also recorded on video to cross-check these labels.
III Signal Modeling
III-A Feature Extraction
As described in Section II-C1, we extracted raw data for classification from the final ms of the active gesture production period of each gesture trial. From each of the sensor channels of raw sEMG, we computed the Root-Mean-Square (RMS) and median frequency after Fourier transform, resulting in -dimension features. Given a data vector , RMS is defined as:
| (1) |
The Median Power Frequency is defined as the frequency value that divides the Power Spectral Density (PSD) into two regions with equal power [17]:
| (2) |
III-B Classification Model
Given extracted features, we used a two-stage classification pipeline to predict among possible gestures: Up, Thumb, Right, Pinch, Down, Fist, Left, Open, Rest. The classification model consisted of an encoder formed from Support Vector Machine (SVM) models that produced a latent representation, and a logistic regression classifier that produced predicted class probabilities. In the encoder portion of the model, we trained a one-vs-one (OVO) SVM classifier [18] for each of the pairs of gestures. Each of these OVO-SVM models produced a scalar output (representing the probability of assigning to the first of its two classes); these scalars were stacked into a latent vector and passed to the logistic regression model.
Given a supervised training dataset, we first fit the one-vs-one SVM models using linear programming with the CVXPY Python library [19]. The linear programming objective we used was based on the semi-supervised SVM formulation of [20], to allow future semi-supervised extensions. Specifically, the SVM parameters were trained according to the following optimization problem:
| (3) | ||||
| s.t. |
where were the parameters to be optimized, were slack variables allowing misclassification of individual points, and is a fixed penalty parameter controlling the margin’s strictness.
We implemented the logistic regression classifier with the PyTorch Python library [21] using a single linear layer and a SoftMax function. After the SVM encoder portion of the model was trained, it was held fixed while the logistic regression classifier model was trained by stochastic gradient descent to minimize the cross-entropy loss. We trained the classifier model for epochs with a batch size of and AdamW [22] optimizer. See Algorithm 1 for a summary of our classifier training procedure.
Smoothing
As noted, participants in the veridical feedback and modified feedback groups were shown real-time output from the model. Due to the high sampling frequency of the sEMG sensors used, and the relatively computationally simple prediction model, the system was capable of making very fast adjustments to the predicted output, which can result in unwanted jitter due to slight fluctuations in raw signal or hand positioning. Therefore, we used an exponential moving average (EMA) to smooth the model’s predictions in time. At time-step , the model produces a raw probability vector , which is then mixed with the previous probability vector using a momentum parameter to produce a smoothed vector :
| (4) |
For values of close to , this causes the probability vector to update more slowly.
III-C Modified Feedback
As mentioned above, subjects in the modified feedback group were shown modified real-time output from the trained classifier during Block Three of the experiment. Specifically, the vector of predicted probabilities from the model was modified according to the following formula:
| (5) |
where the modification exponent was set to , and represents the classes used.
III-D User Interface and Software Design
Figure 4 shows the user interface (UI) displayed to participants. All components of the UI were implemented using PyQt [23] Python package. On the top left, the UI displayed an instructed gesture via image and text during blocks one and two (see Section II-C2 and II-C3). On the bottom left, the UI showed post-hoc predicted probabilities for each gesture as a radial plot. The length of each line was scaled according to the value; the outer circle represented a value of , and the inner circle represented a value of (i.e. the model’s decision threshold). The opacity of gesture images around the radial plot were also scaled according to the value. The outer edge of the UI was colored yellow, green, or red to indicate gesture timing epoch as described in Section II-C1. On the right of the UI was the task window in which the mini-games were played during blocks two and four (see Section II-C3 and II-C5). As described previously, participants used one of active gestures to move their avatar (the blue die). The goal of each mini-game in blocks two and four was to use these gestures to match the blue die to the gray target die.

Error Augmentation in Live Feedback
During block three (see Section II-C4), participants who received real-time feedback were presented with a different display, as shown in Figure 5. Here, the probability of each class was displayed using a bar plot that was updated in real-time. The participant’s goal during this block of the experiment was to explore hand positions in order to maximize the predicted probability of the current gesture class.

Data Streaming with LabGraph
Our experimental platform was built using the LabGraph[24] Python package. The software was implemented as a collection of LabGraph nodes to separately manage raw data collection, preprocessing, feature extraction, classification, and UI. These nodes were connected using a declarative syntax in a directed acyclic graph. At runtime, LabGraph spawned processes to run each node, and automates both the delivery and logging of messages.
III-E Classifier Metrics
As mentioned in Section II-C5, the experimenter recorded each intended gesture made by the participant, so that model accuracy could be evaluated after-the-fact. Accuracy was defined as the fraction of correctly classified items. In addition to the active gestures and the “rest” class, the decision threshold of that was used resulted in another possible outcome for gesture trials when no gesture rose above the decision threshold, which we refer to as “NoClass”. Gesture trials in which the subject was not prepared to make a gesture during the “gesture production” epoch were recorded as having a true label of “rest”.
III-F Feature-Space Class Structure
To evaluate how feedback affects human learning, we analyzed the feature-space distribution of trials from different gestures performed in block four of the experiment. This feature-space representation does not depend on the model, since these features are obtained using simple, deterministic transformations of the raw data (RMS and median frequency after Fourier transform). The differences in feature-space class structure across treatment groups can therefore give information about human learning.
Kernel Similarities
We base our analysis of feature-space structure on a Radial Basis Function (RBF) kernel similarity measure. The RBF kernel computes a similarity measure which corresponds to an implicit infinite-dimensional vector space. For two feature vectors belonging to a dataset and a length scale parameter , the RBF kernel similarity is computed as:
| (6) |
The length scale is an important hyperparameter which determines the rate at which similarities decay as two points are moved farther apart. We follow the so-called “median heuristic” [25], in which is set based on the median length scale of a dataset :
| (7) |
We set individually for each subject, based on all of their pooled gesture trials.
Class Similarity Matrices
We use this notion of kernel similarity to construct a class similarity matrix for each subject. For classes , we build a square, symmetric matrix such that the entry at position describes the average RBF kernel similarity between items in classes and :
| (8) |
After computing the entries in a similarity matrix, we normalize the entries to the range so that these matrices may be easily compared across subjects and groups.
Classes which are closer together in feature space will have a higher average similarity and therefore a larger entry in this similarity matrix. A subject whose gestures are easily classifiable may tend to have precise gestures that are also well-separated from each other. This would result in having high average similarity between trials in the same gesture class (diagonal entries of the class similarity matrix) and low average similarity between trials of different classes (off-diagonal entries). See Section IV-D for class similarity matrices from each experimental group, and see Figure 6 for didactic examples of similarity matrix .
Scalar Class Separation Measure
In order to look for trends in the feature-space distribution over time and to identify global trends across groups, we also summarize these normalized class similarity matrices using a scalar class separation measure, , which we define as the average within-class similarity divided by the average between-class similarity. Given a normalized similarity matrix as described above,
| (9) |
As indicated above, larger within-class similarities indicate that trials from the same gesture are precise and repeated with high-fidelity, while smaller between-class similarities indicate that trials from different gestures are easily distinguished. Thus, a dataset with a larger value of may contain gestures that will be more easily classified.
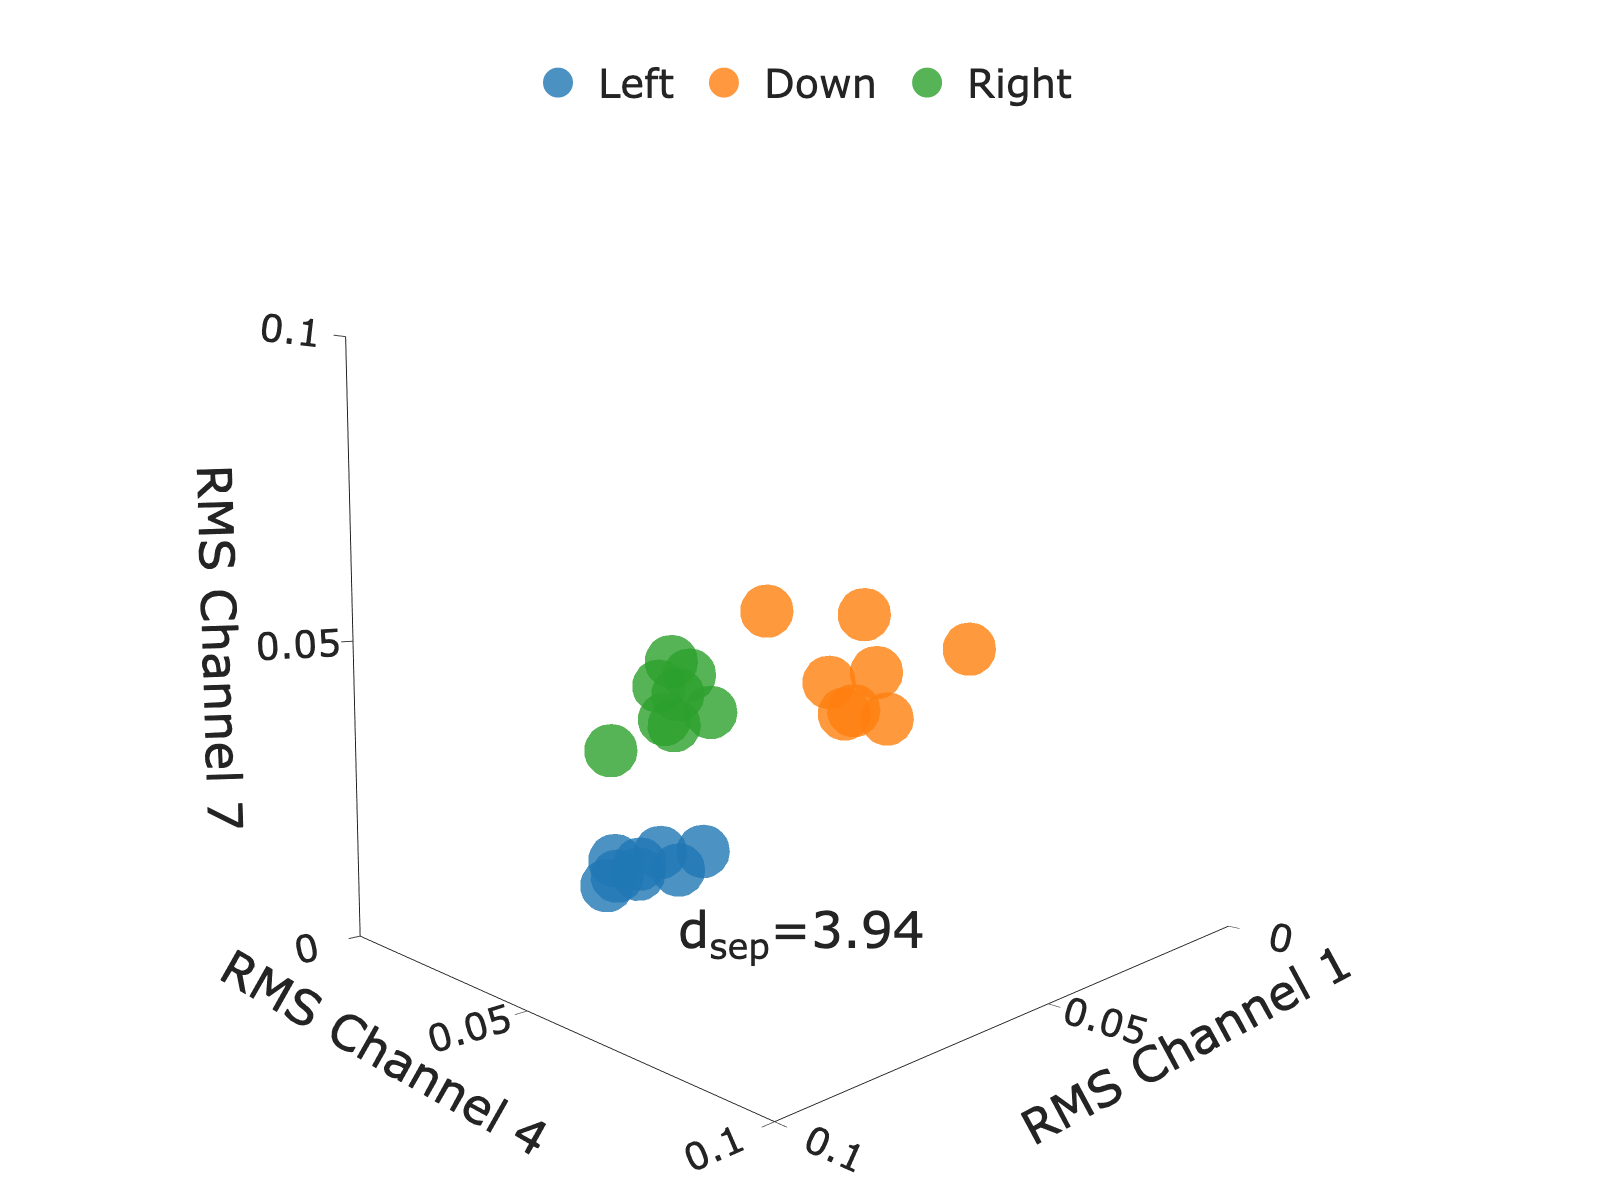
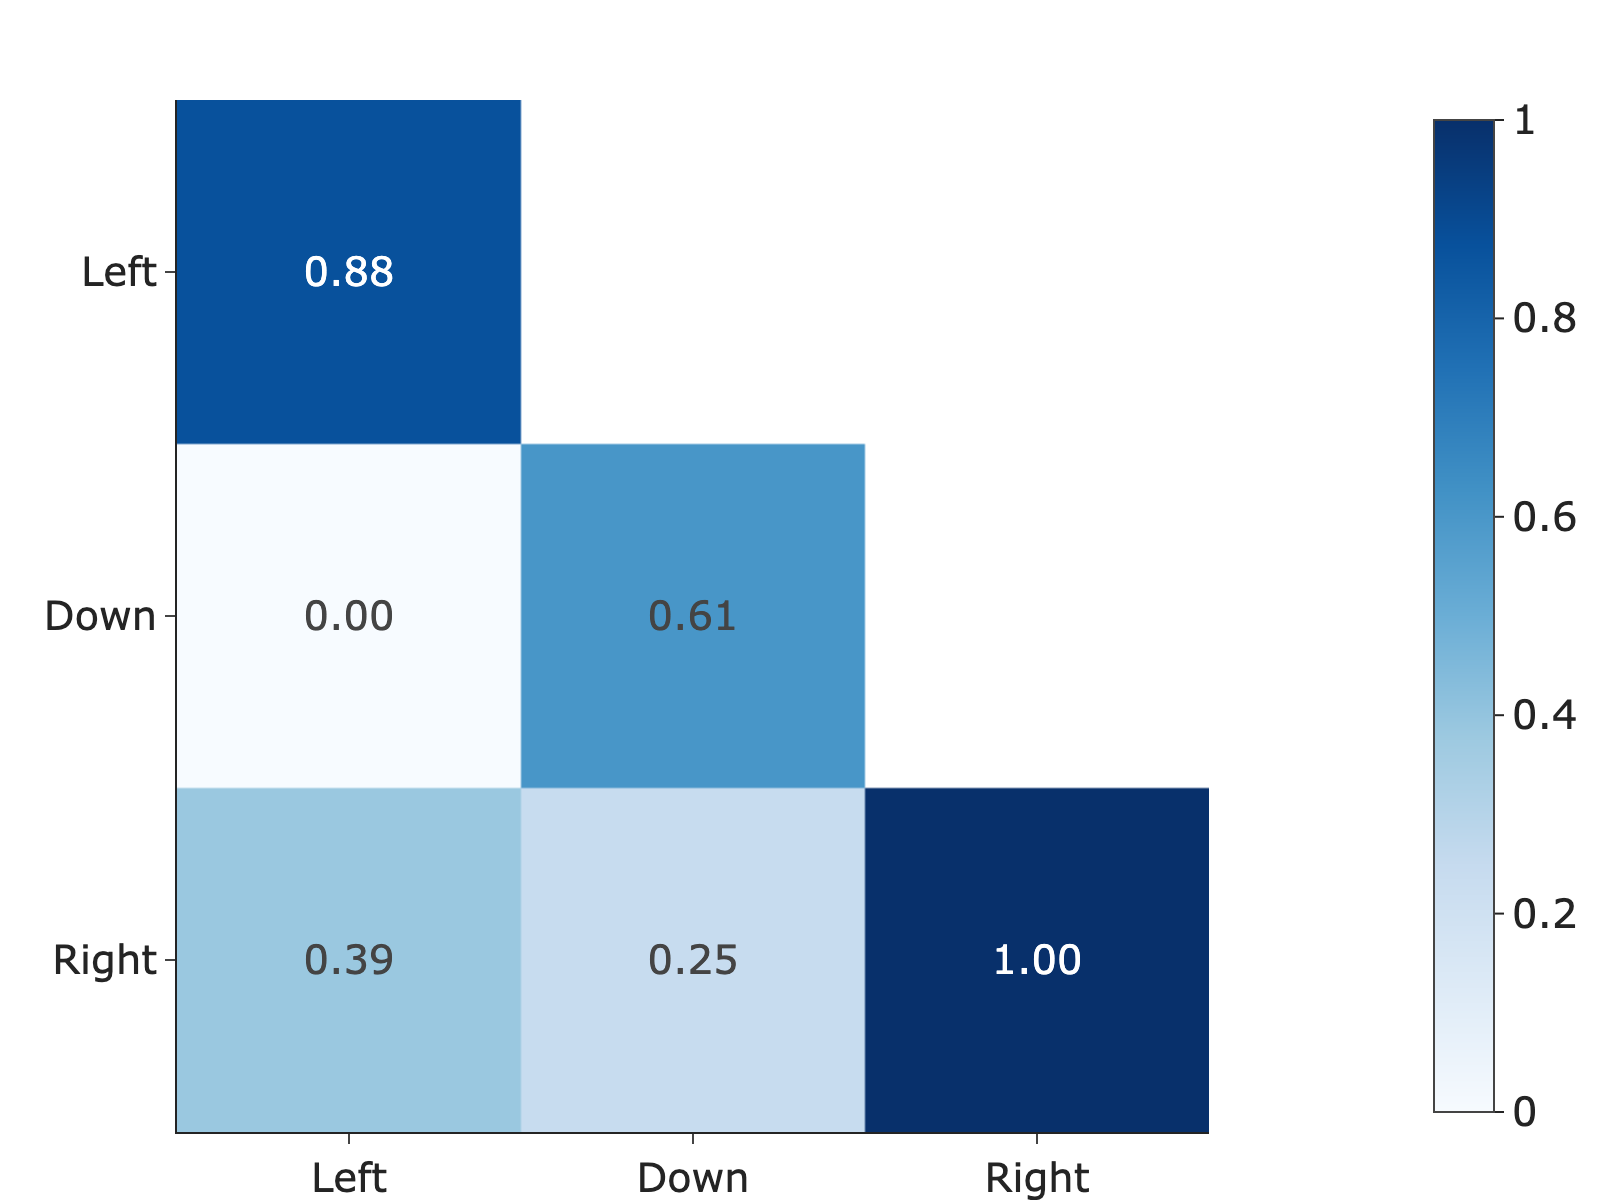
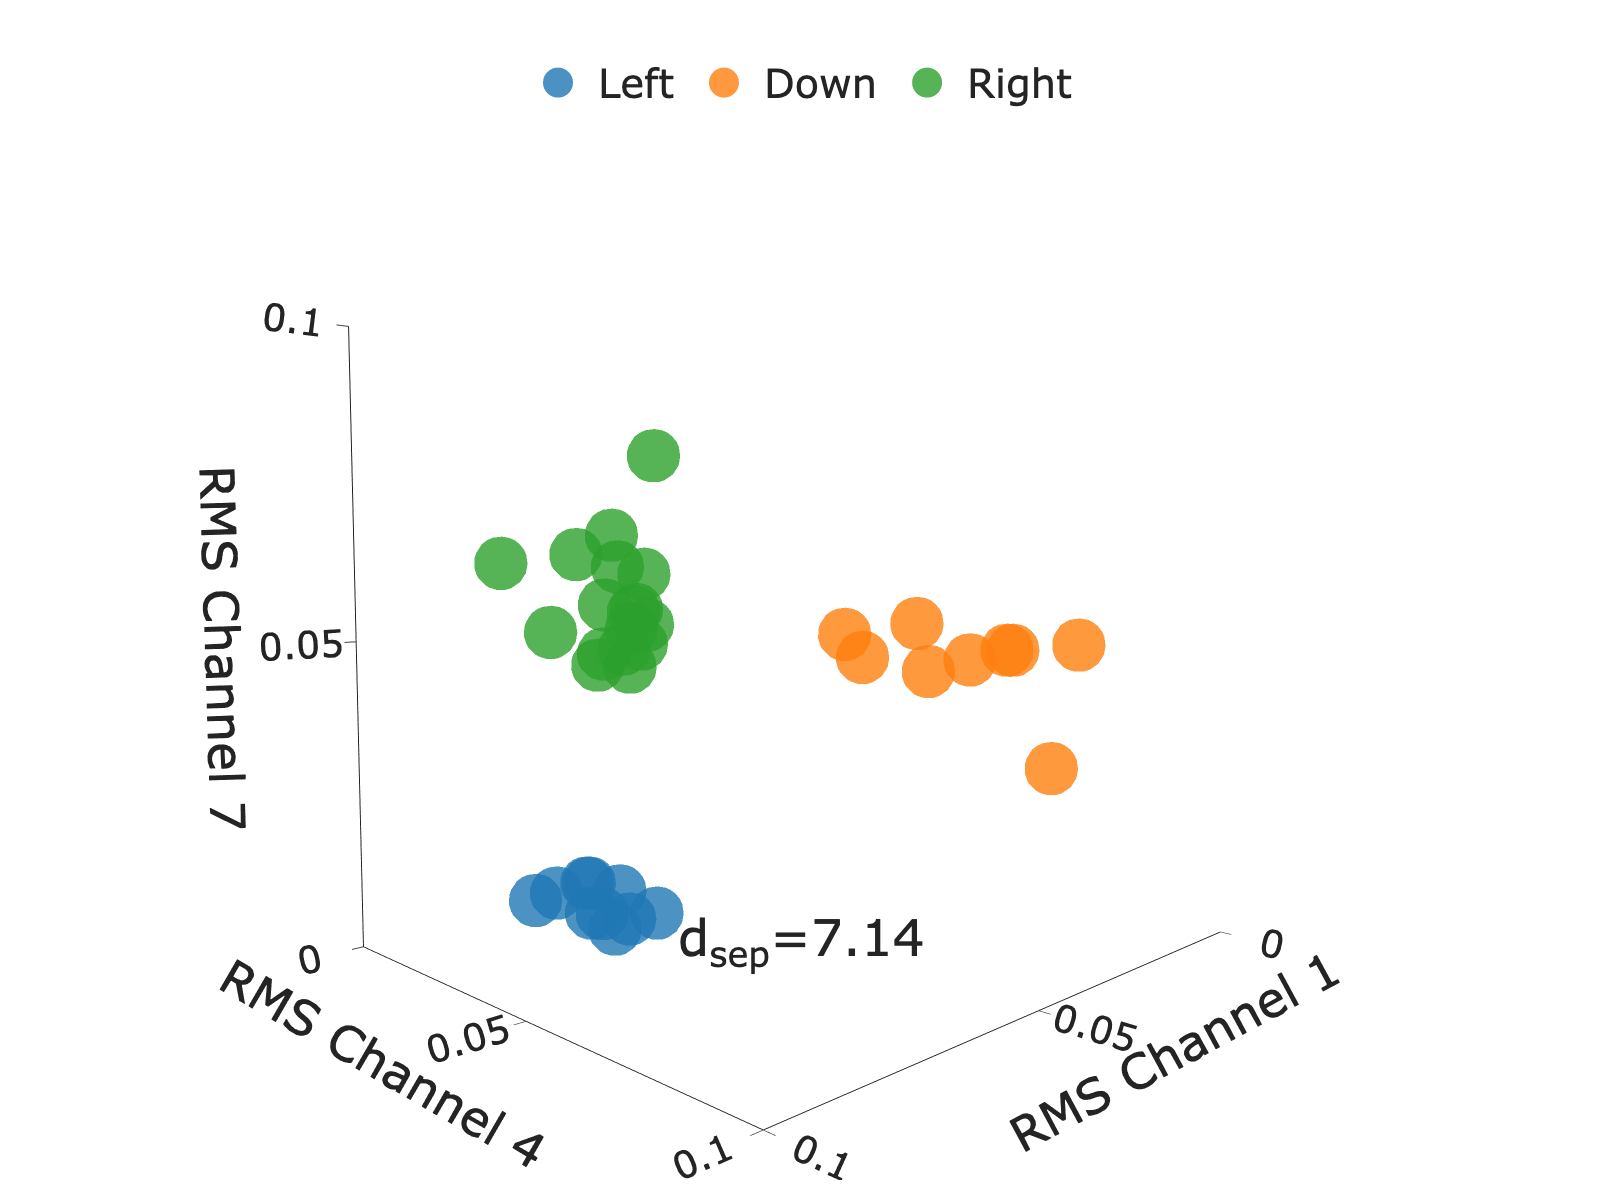
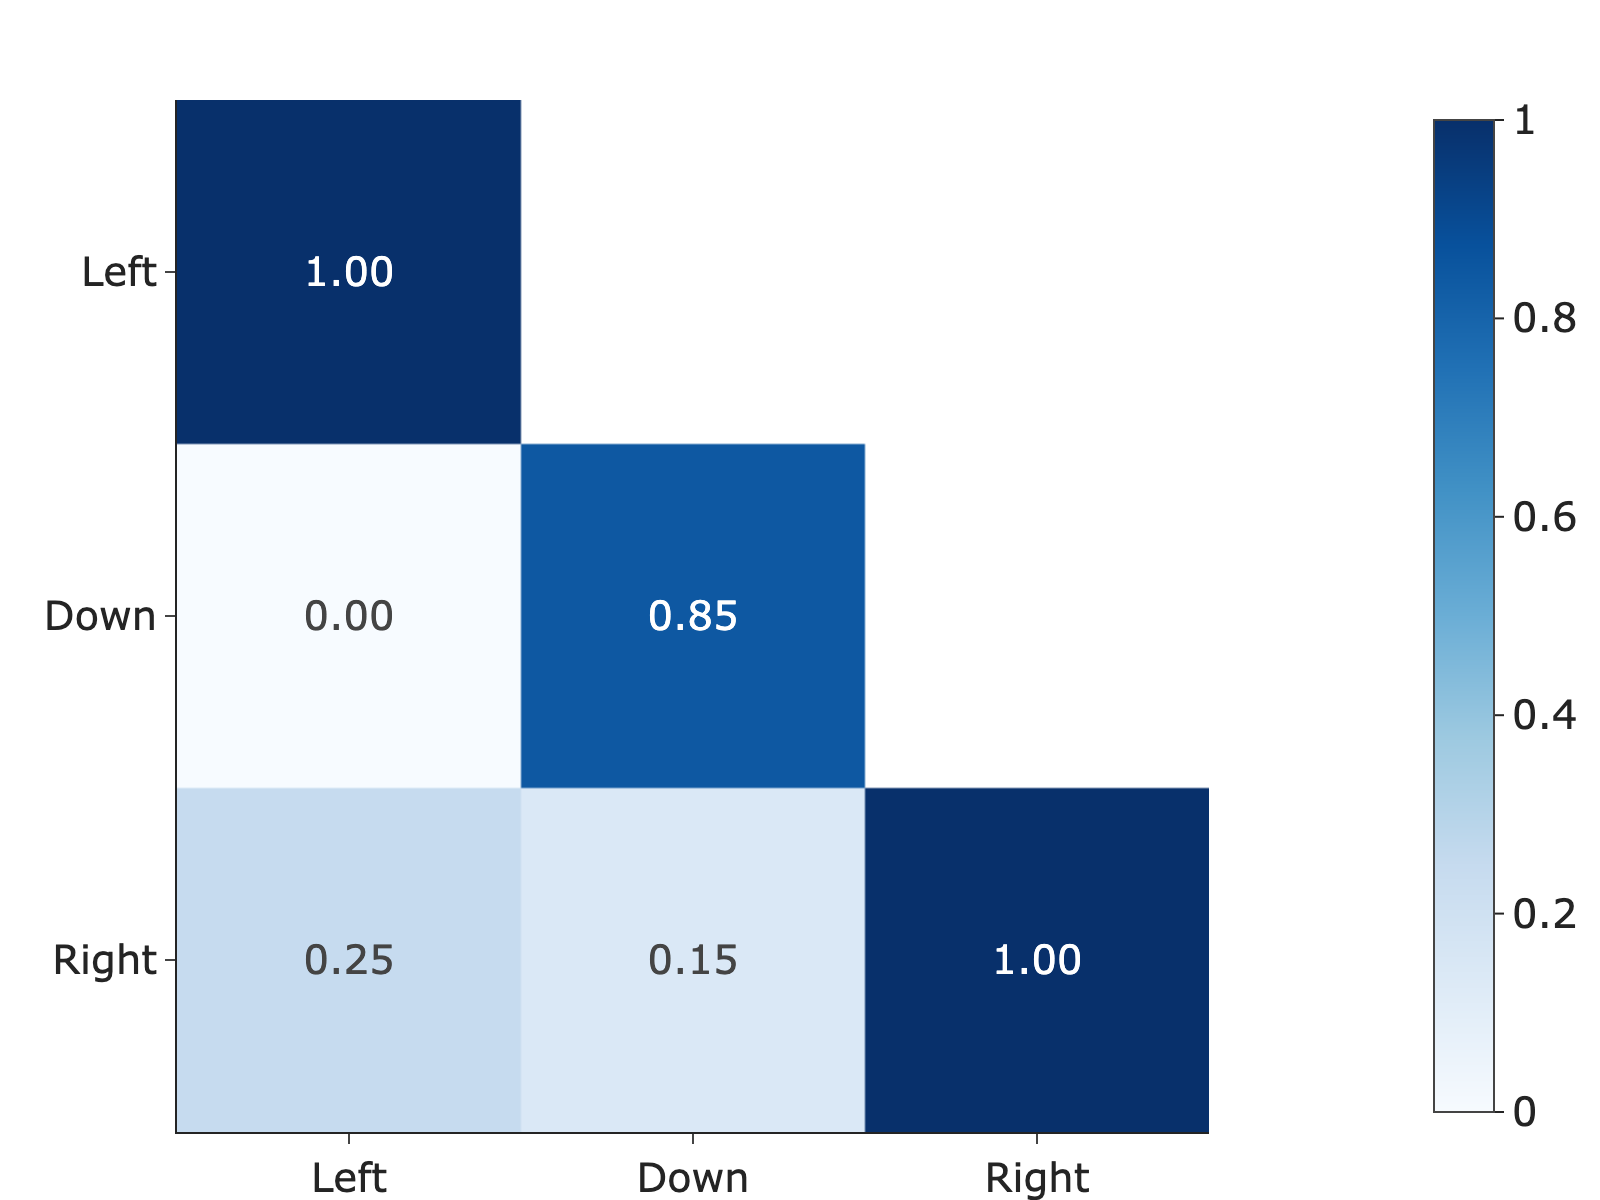
In Figure 6, we show examples of class similarity matrix and scalar similarity measure . To produce an example that can be easily visualized, we select a subject from the “Modified” condition that showed a large improvement in feature-space separation. For this subject, we select three gestures (“Left”, “Down”, and “Right”) and three features (RMS value from electrodes 1, 4, and 7). In the top row, we show metrics for this subject’s data during the “Calibration” and “Instructed” blocks, and in the bottom row, we show metrics from the “Free” block; recall that the subject experiences live feedback training after the “Instructed” block. We observe that the features of each class become more distinct after the user performs live feedback training; this is captured as an increase in the similarities on the diagonal of and a decrease in similarities off-diagonal. These changes in are also summarized in , which increases from to .
III-G Within-Subject Normalization
The focus of this work is to measure the effect of the proposed veridical and modified feedback strategies on subject performance. We note that overall subject performance may be influenced by a relatively large number of factors of variation, such as factors affecting dexterity and motor precision, subject motor learning speed, and subject-intrinsic factors affecting raw sEMG signal-to-noise ratio. Thus, a prohibitively large sample size may be required to natively account for this variation.
We instead adopt a within-subject normalization strategy, obtaining baseline statistics for each subject using only data measured before our interventions.
For each subject, we measure baseline accuracy by training a model from scratch using that subject’s block one data (calibration, Section II-C2), and testing this model’s classification accuracy on the subject’s block two data (instructed games, Section II-C3).
We obtain baselines for class similarity matrices in the same manner. Within each subject, we collect all gesture trials from the first two experimental blocks, and compute a normalized class similarity matrix. This is subtracted from the matrix computed using data from block four (free games, Section II-C5) to visualize the difference in similarity for each class. Note that due to the short experimental design, we have relatively few samples per class with which to construct each matrix, and therefore this representation may be somewhat noisy.
We transform the normalized similarity matrix describing blocks one and two into the scalar class separation measure , and likewise transform the similarity matrix describing block four. This results in a baseline-subtracted class separation measure.
Overall, we measure changes from baseline as follows:
| (10) | ||||
III-H Statistical Analysis
We performed several pre-planned statistical analyses to determine the effect of feedback on classification accuracy and feature space class separation. Differences between Feedback Groups at baseline (, ) were analyzed using a one-way ANOVAs. Likewise, the effect of Feedback group on change scores (, ) were analzyed with one-way ANOVAS (). Alpha level was set at 0.05. Significant findings were further analyzed using post-hoc paired comparisons with Bonferroni correction for multiple comparisons. One sided one sample t-tests with Bonferroni correction for multiple comparisons () were used on change scores to test whether each Feedback Group significantly increased accuracy and distance.
IV Results
All participants were able to successfully complete the experiment, with no reported adverse events.
IV-A Group Baselines
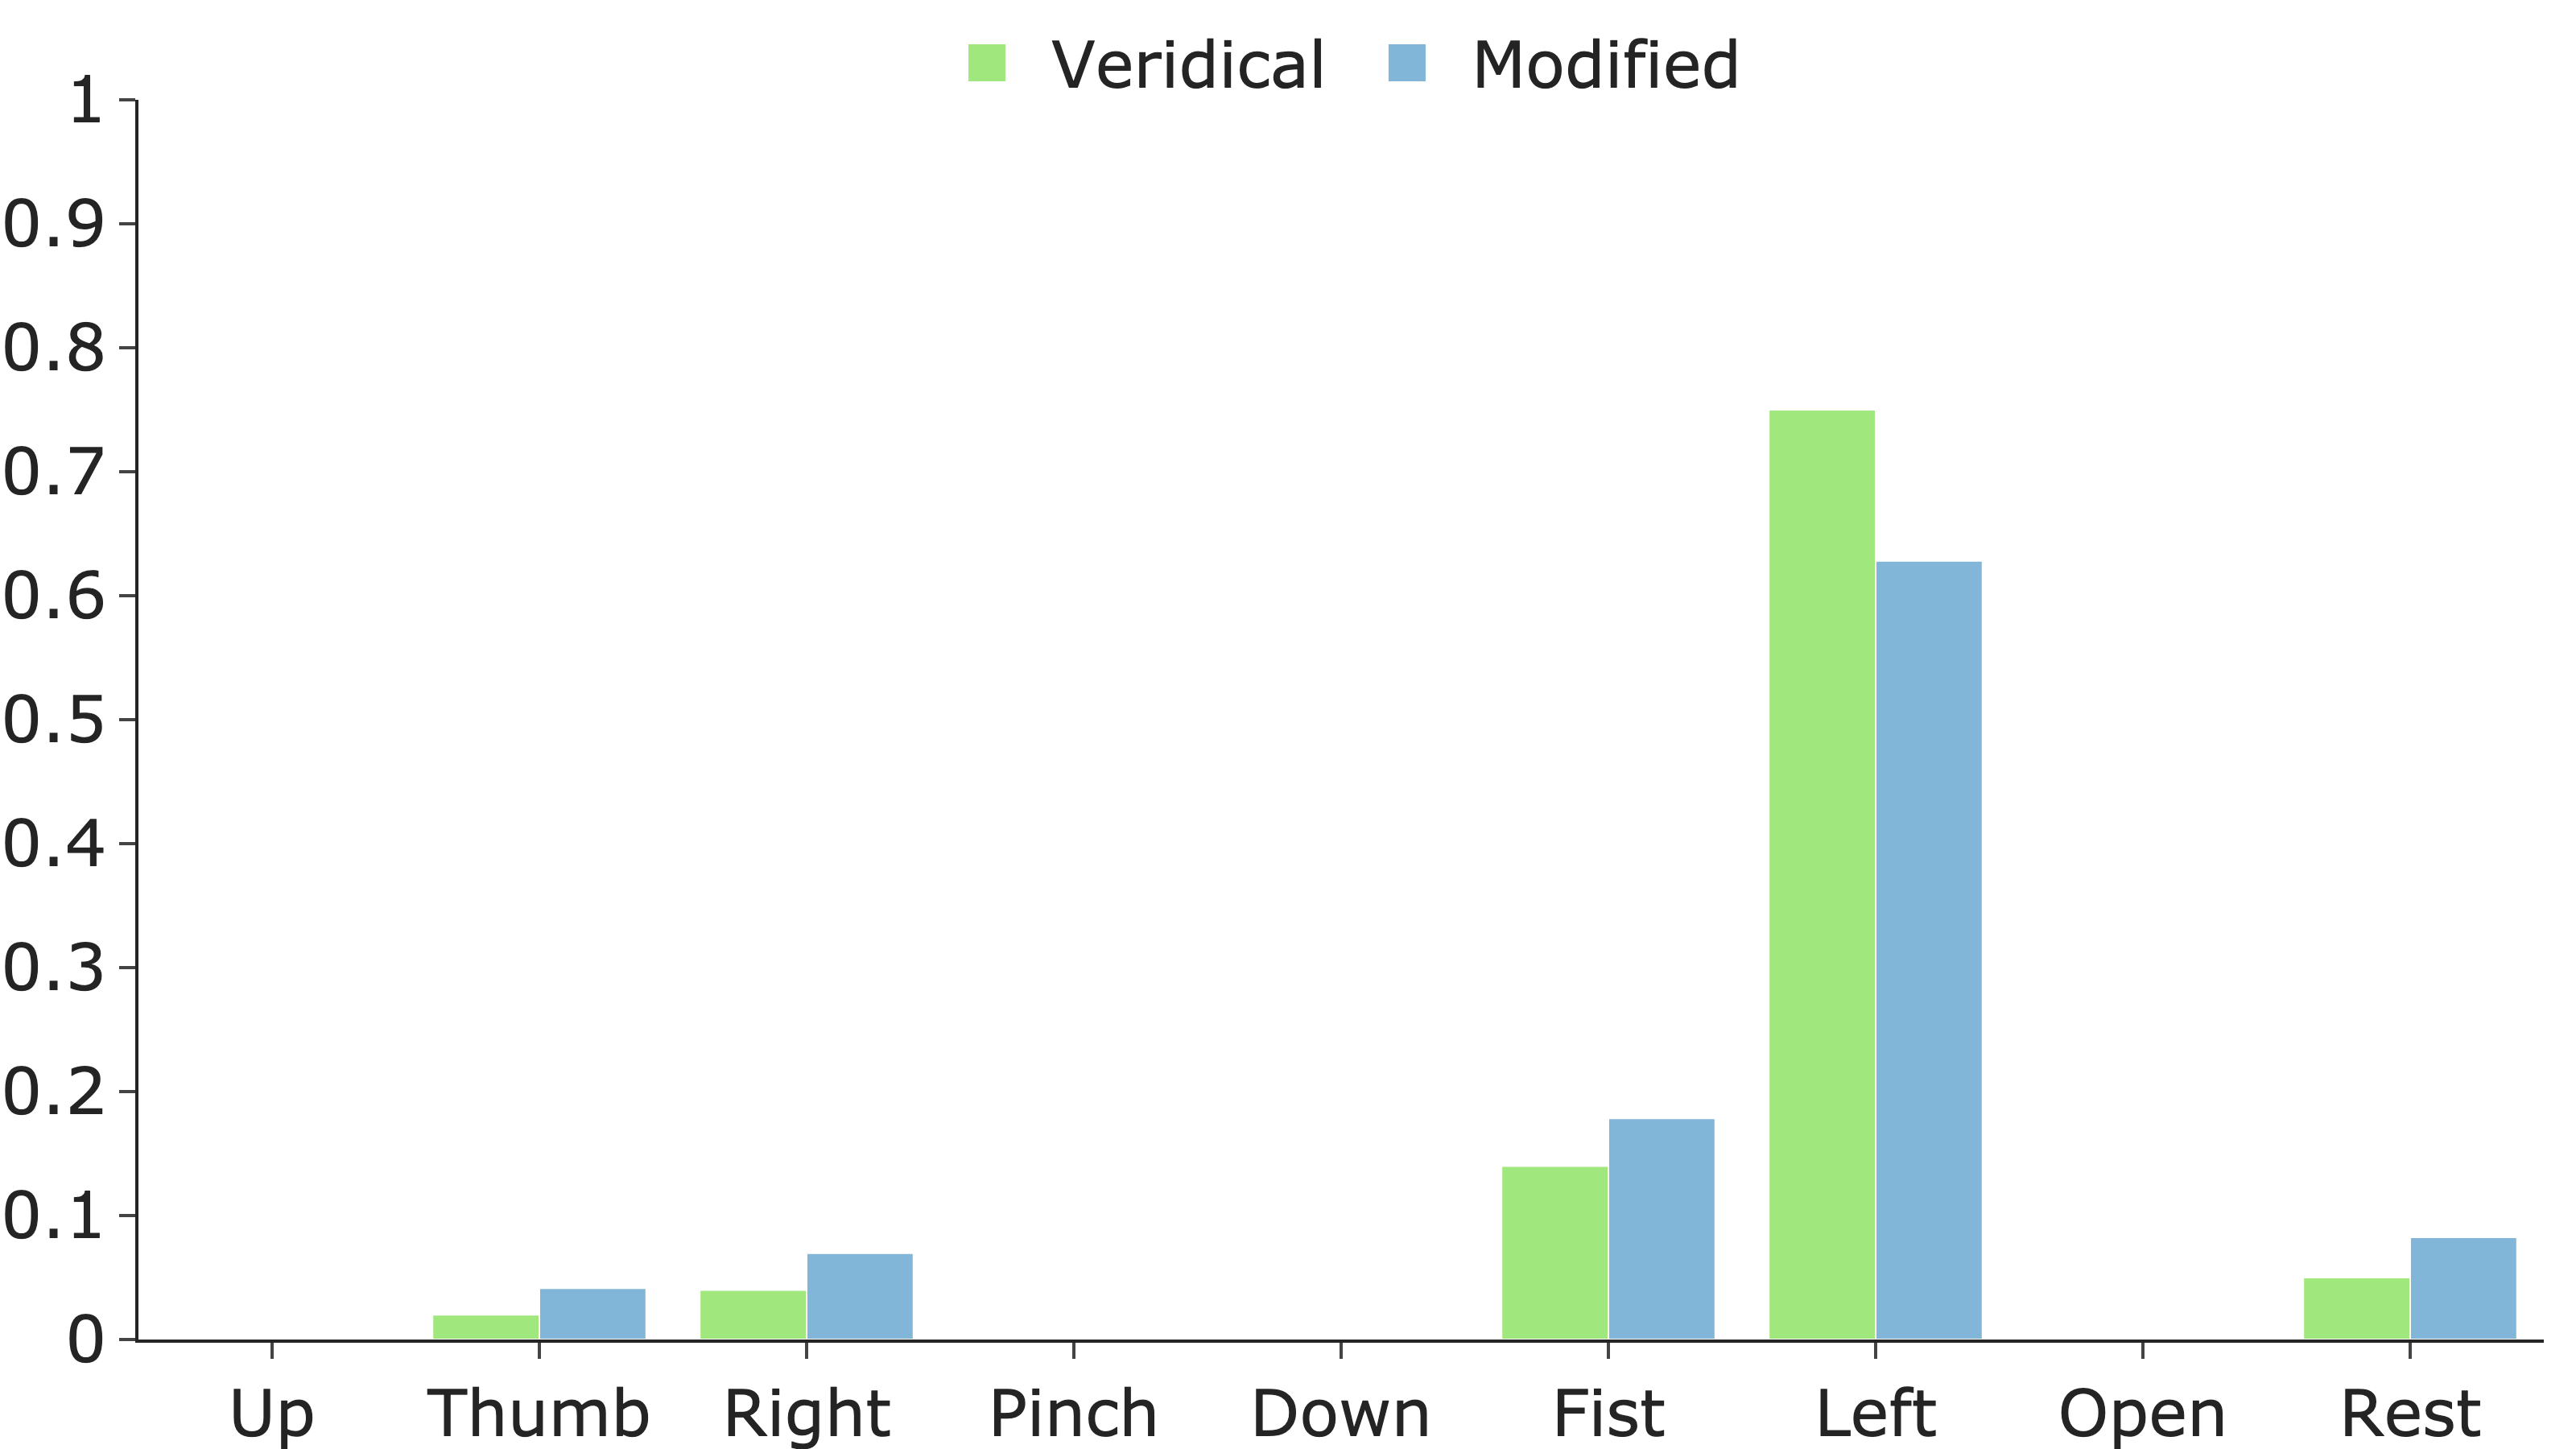
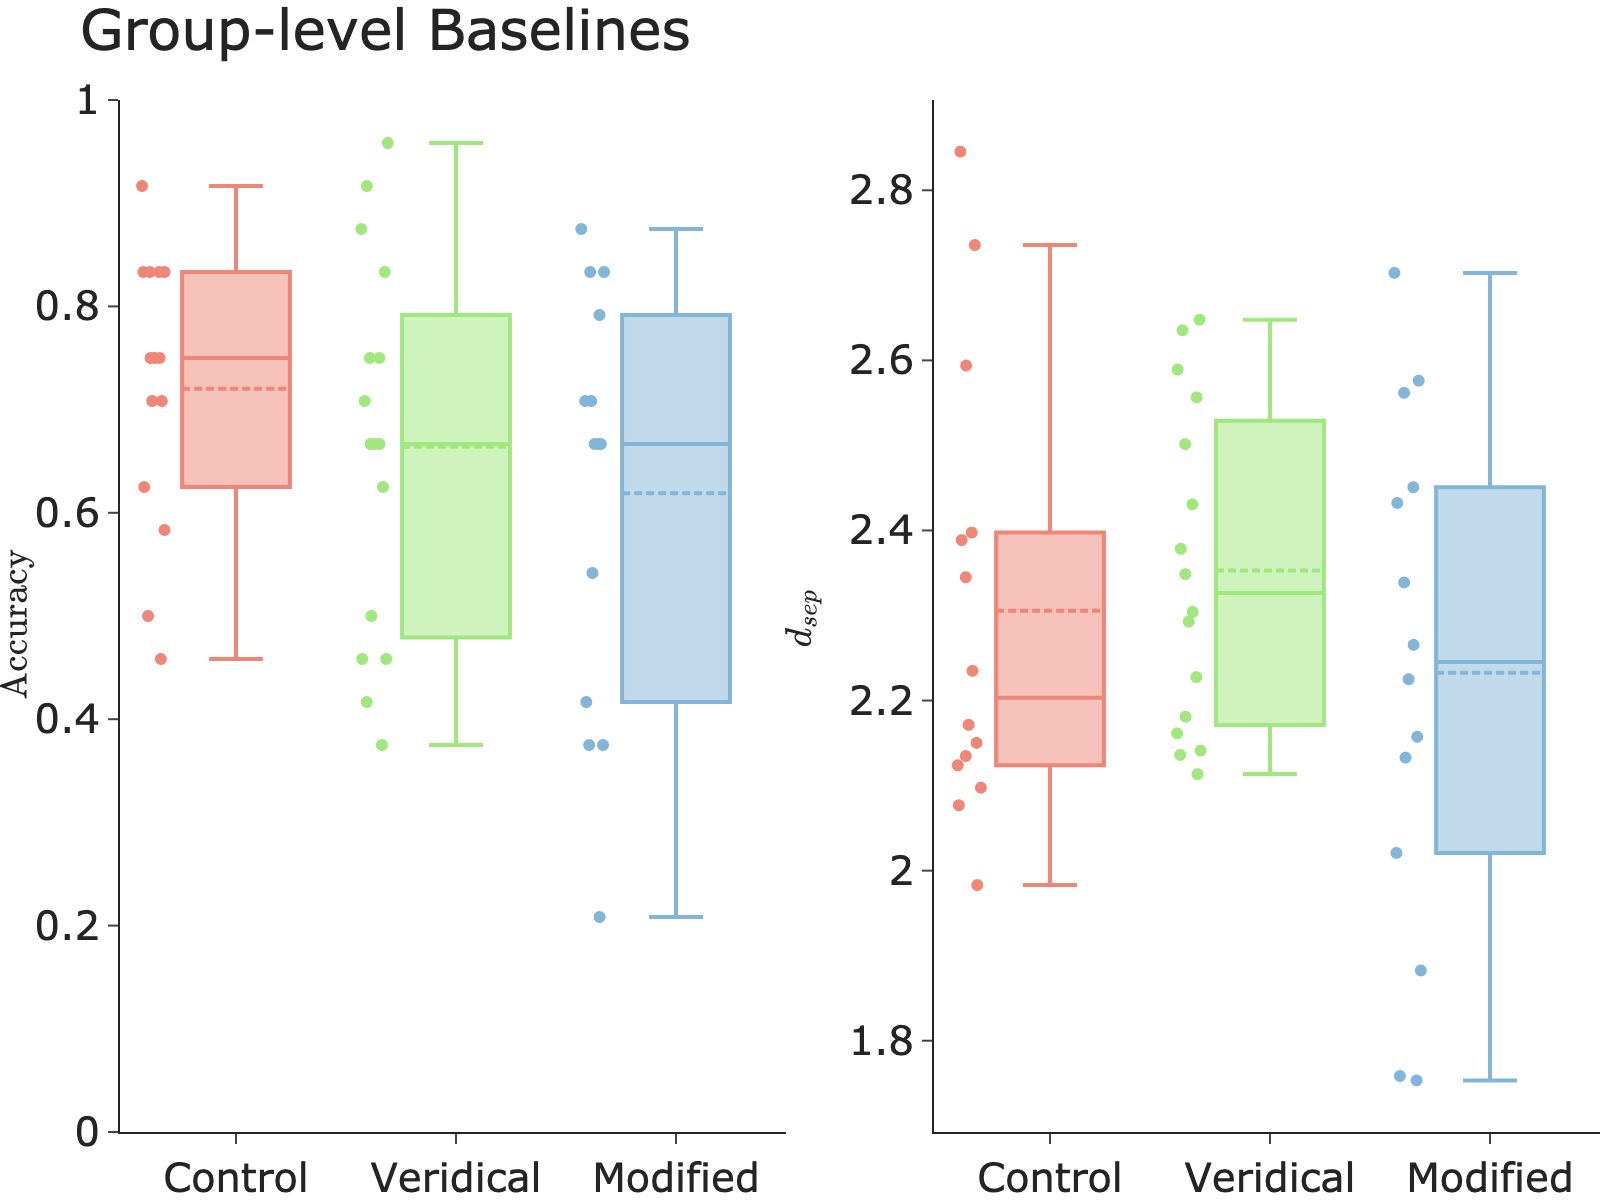
A one-way ANOVA indicated no significant differences in baseline accuracy (, ) or class separation (, ) between Feedback Groups. Figure 7 shows a group-level summary of the baseline accuracy and class separation measure. Though no significant differences were found, mean baseline accuracy and class separation scores were greatest in the Control Group and smallest in the Modified Group.
IV-B Effects of Feedback
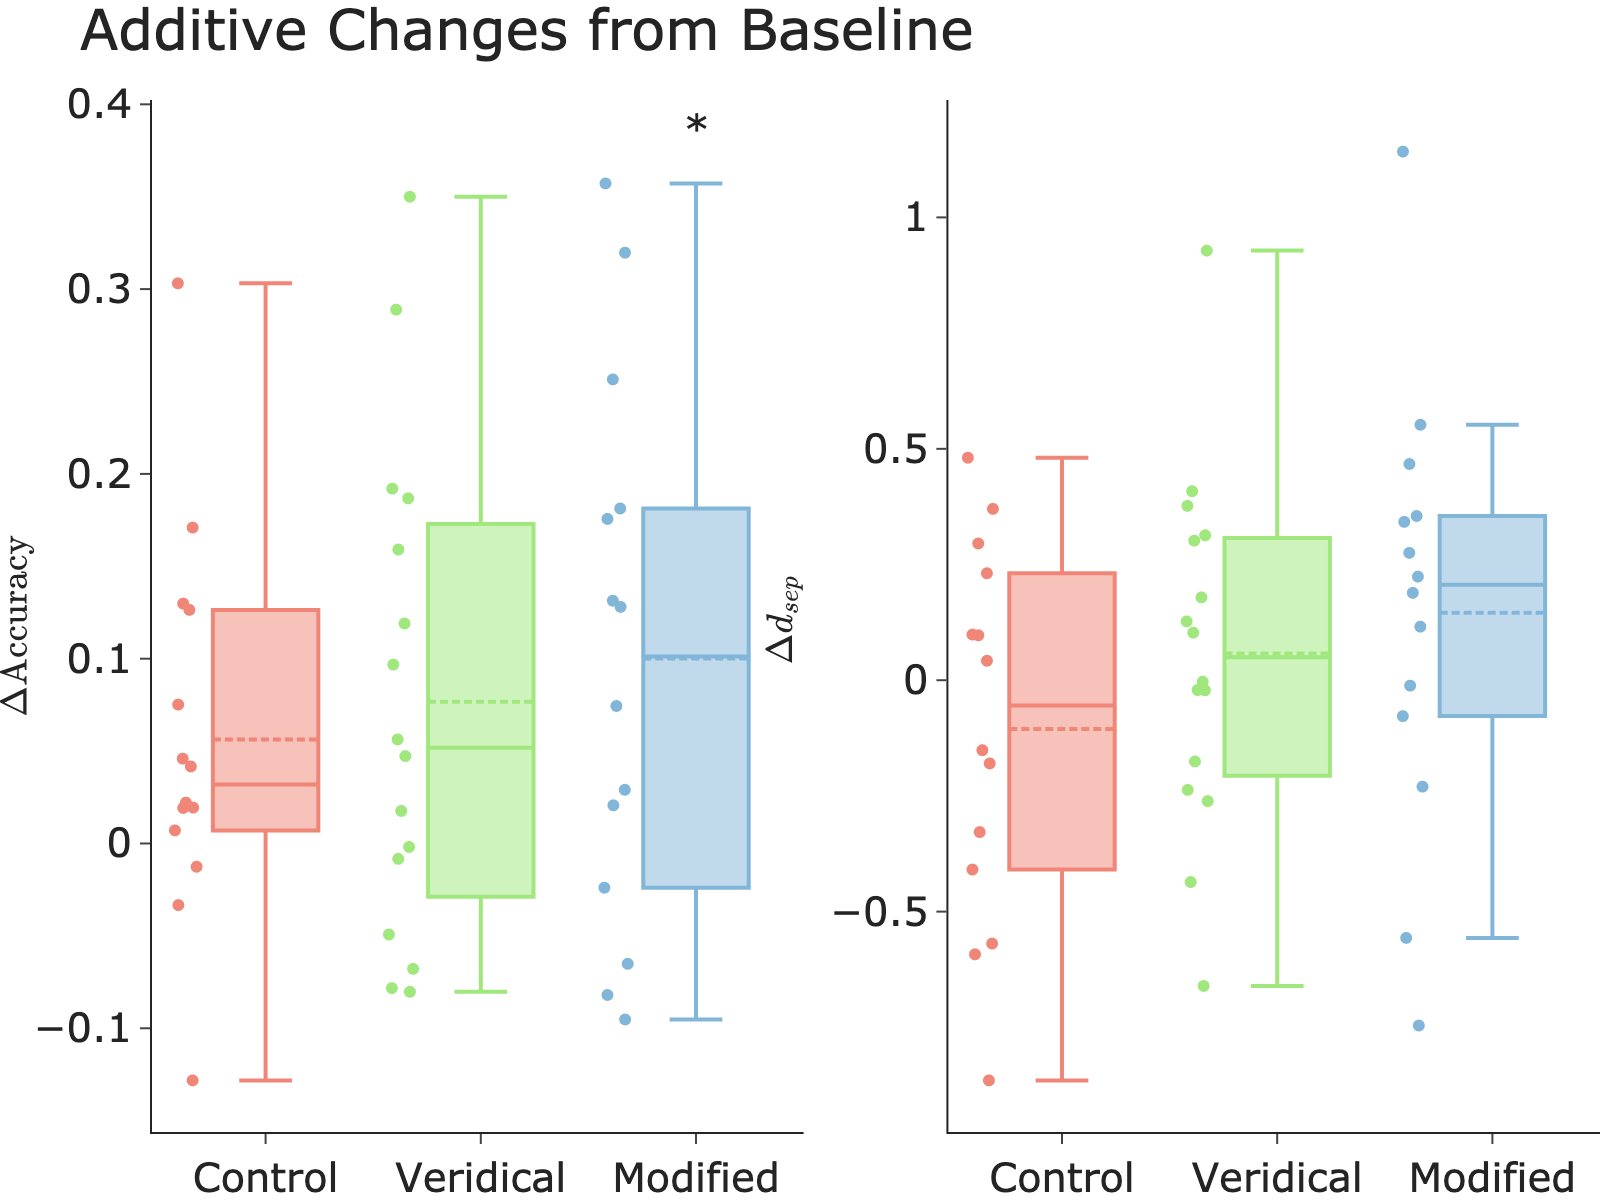
Individual one-sided one-sample t-test were used to test for significant improvement in Free block performance from baseline (Bonferroni corrected for 3 comparisons, ). For accuracy, only the Modified Group showed significant improvement (, ). No group showed a significant improvement in class separation. One-way ANOVAs indicated no significant between-group differences in (, ) or (, ).
Figure 8 shows the average change from baseline performance in each experimental group, as measured in accuracy of gesture classification (left panel) and feature-space class separation measure (right panel). These data demonstrate that, on average, the increase in performance over the course of the experiment was greatest for subjects in the modified feedback group. Note that the variation between subjects is relatively high, resulting in overlapping estimates of mean performance.
IV-C Class Confusion
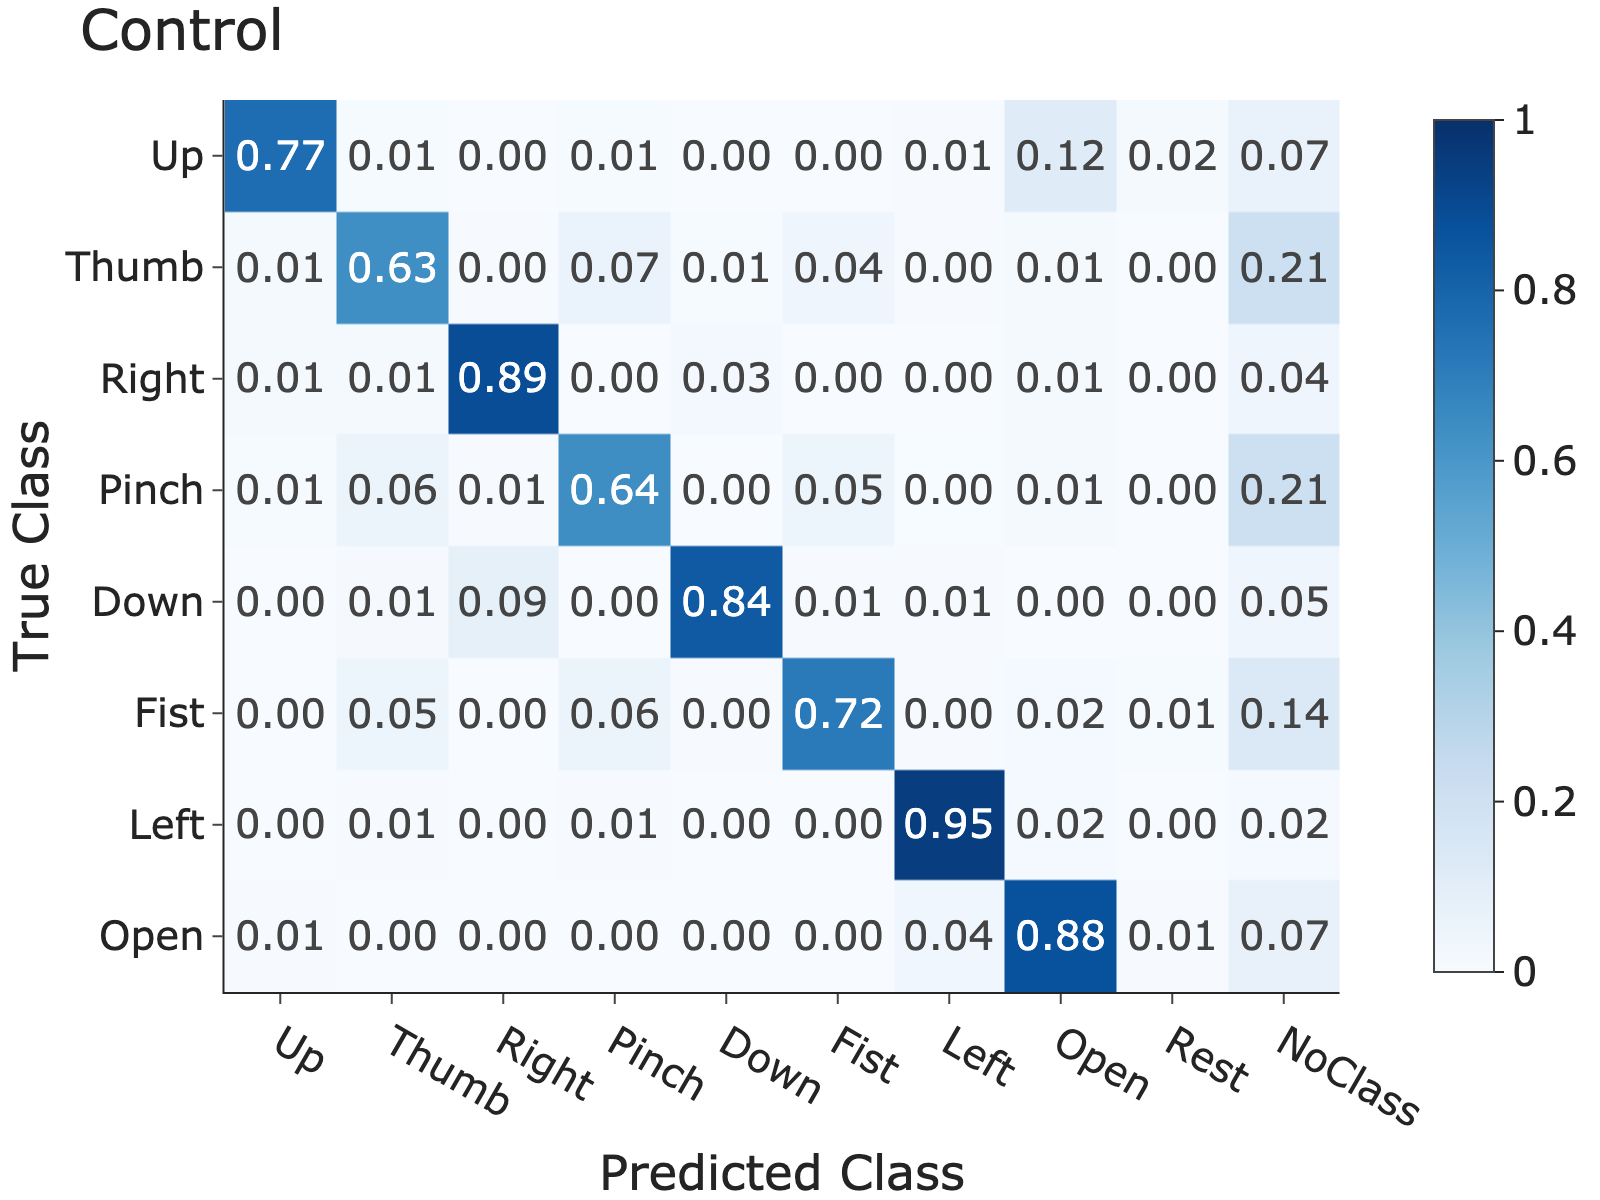
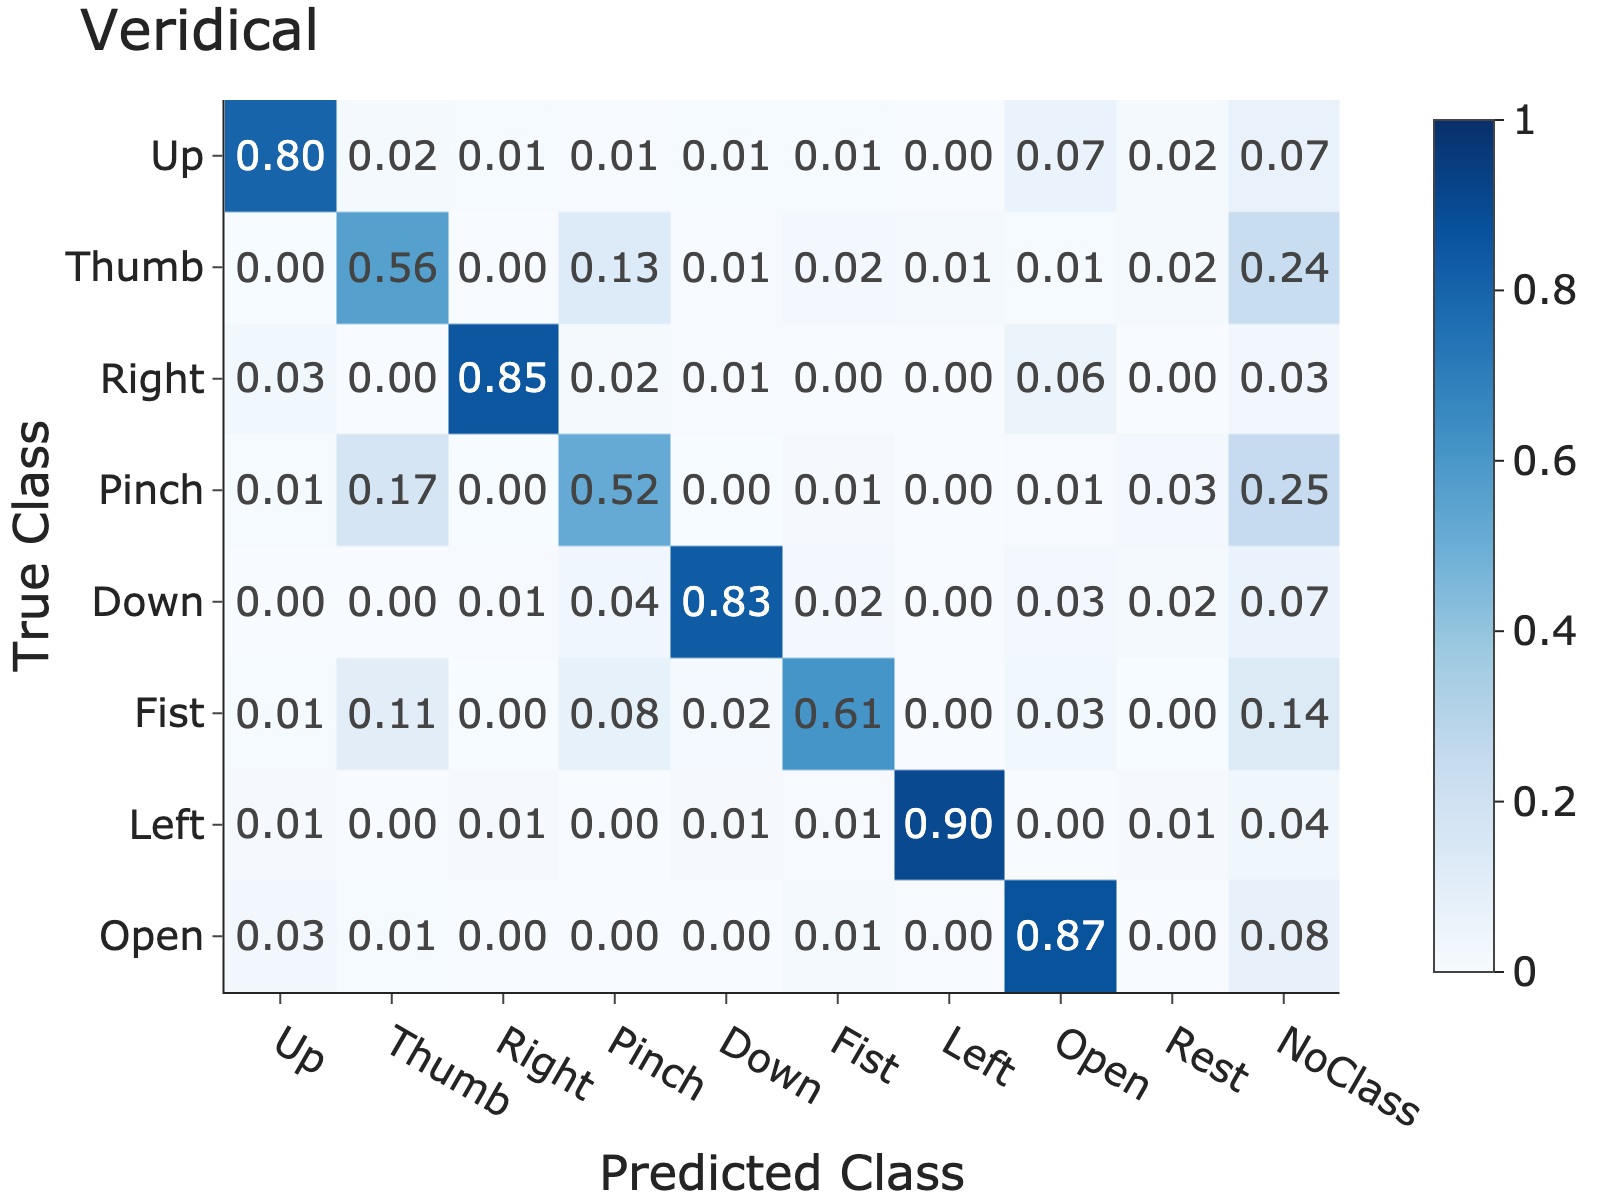
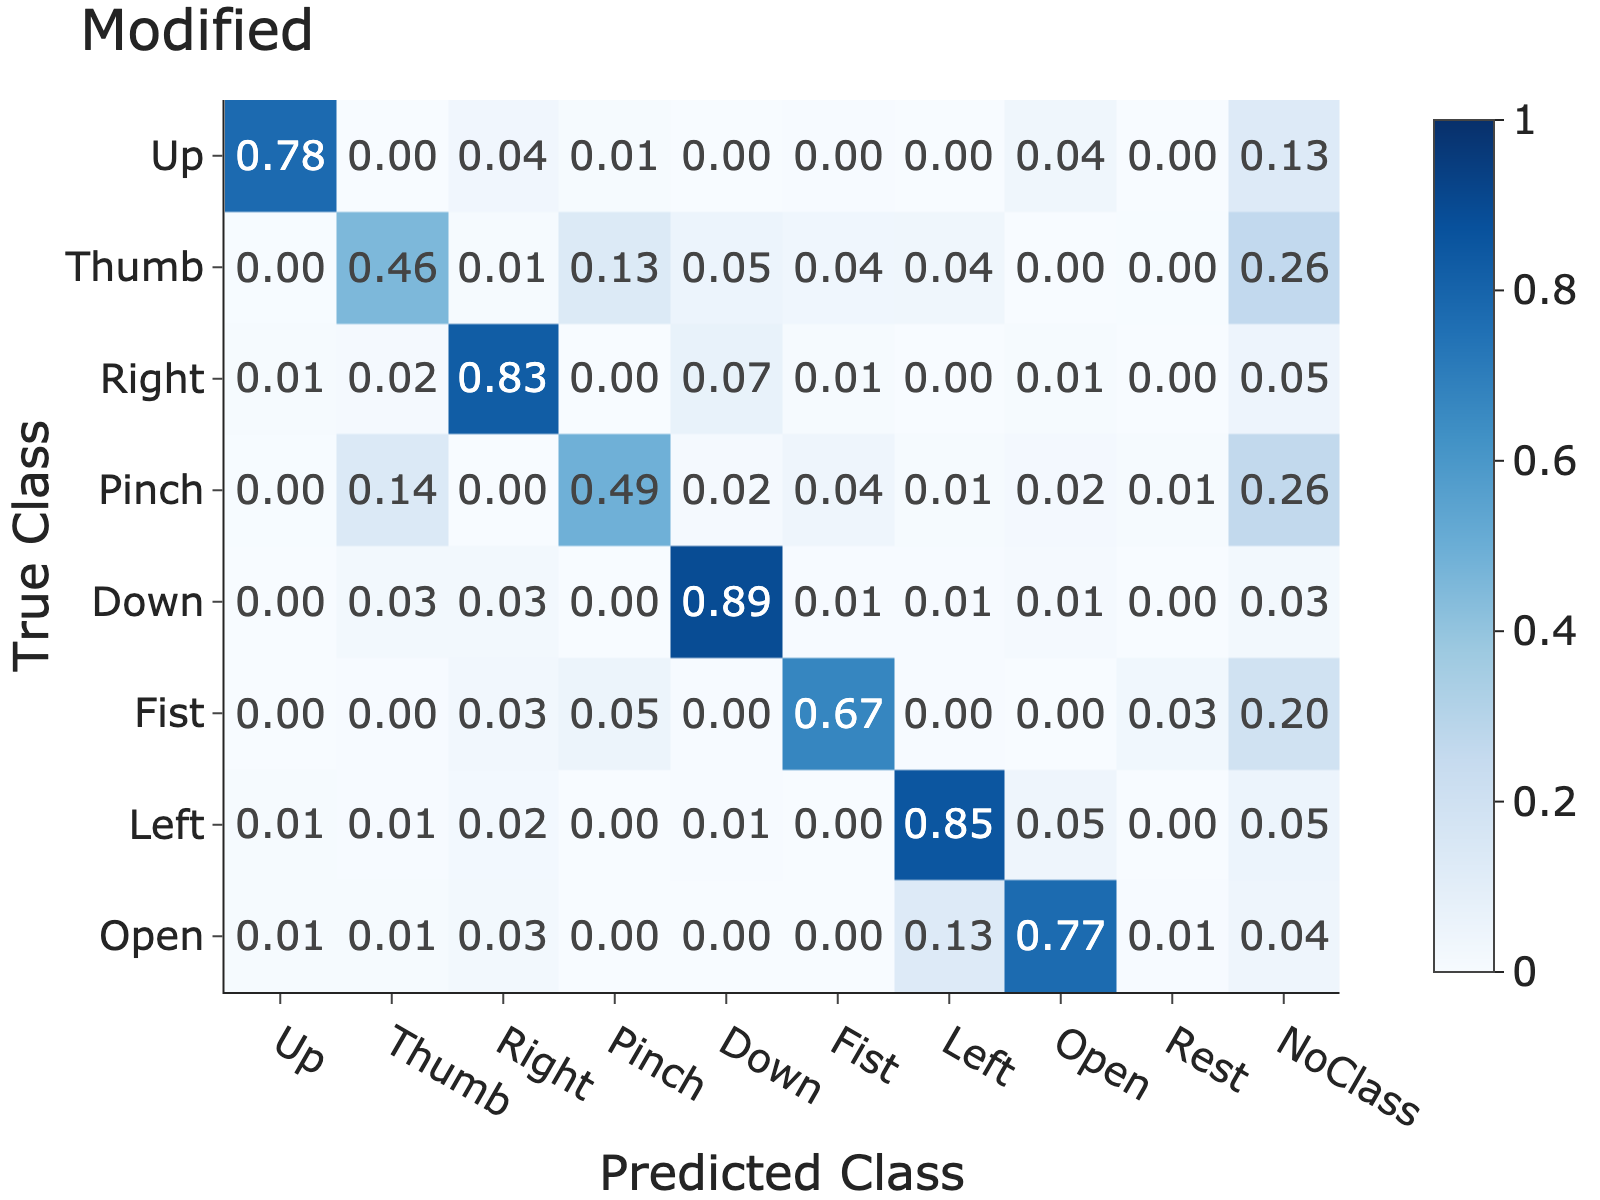
Figure 9 shows the group average confusion matrices of gesture trials during block four (free games) for each group. Rows represent the classification of the attempted gesture, normalized to . There are notable similarities across the groups, indicating several gestures that are intrinsically difficult and gesture pairs that are inherently close. In particular, the “thumb”, “pinch”, and “fist” gestures all have a large fraction (about ) of gestures which fall below the decision threshold. Similarly, there was an overall trend that these three gestures tended to be confused, resulting in non-zero entries for the off-diagonal entries (fist, thumb), (fist, pinch), (thumb, pinch), etc.
IV-D Class Feature Space Similarity


Figure 10 shows the average normalized class similarity matrix of each group. As described previously, a “desirable” pattern for easy downstream classification (in which the subject produced consistent and well-separated gestures) would consist of larger entries on the diagonal and smaller entries off-diagonal. Each group demonstrated a consistent pattern in which the brightest entries were along the diagonal, indicating that the gestures were generally separable, and a consistent pattern of bright off-diagonal cells, indicating overlap between three specific gestures: “pinch”, “fist”, and “thumb”.
V Discussion and Future Work
This study tested the potential of modified continuous feedback of model performance in a gamified user interface for rapid user training on a sEMG-based gesture recognition system for controlling actions on a computer display.
We hypothesized that we could use manipulation of feedback about the gesture class probabilities in a short (4 minute) online learning session to shape user behavior in manner that would increase the separation between muscle activation patterns of different gestures and increase the accuracy of model performance on future attempts. Overall, our results demonstrate that a short user training session using modified feedback has the potential to increase post-calibration performance (accuracy and class separation relative) when compared to veridical feedback and a no-feedback control.
V-A User Calibration
Despite the emergence of research into methods for co-adaptive learning for sEMG-based gesture recognition, there have been few investigations specifically testing the effect of user training as means of rapid calibration. Numerous studies have shown that extended user training on a sEMG-based controller results in significant gains in performance [26, 11, 10]. The majority of these studies have found increased model performance was accompanied by changes in muscle activation patterns that are theoretically favorable to better classification (i.e. increased class separability). In contrast, a recent investigation found low correlation between improved real-time performance and class separability, metrics of muscle activation patterns in feature space and classification performance are unrelated [27]. Krasoulis et. al. first demonstrated that short-term adaptation through biofeedback user training could positively impact prosthetic finger control using sEMG-based decoding [9]. Our results demonstrate that both performance and class separability increase after live feedback training, compared to the no feedback control, and that this increase is greatest when using error-augmented feedback.
V-B Influence of Feedback Manipulation on User Behavior.
The Manipulated feedback group showed the largest change in classification accuracy and class separability. Flattening of the class probabilities as was done in this investigation can be considered a form of error augmentation as subjects were lead to believe the separation between classes was smaller that it actually was. As this made the task more difficult it is most closely related to the feedback involving “error amplification” that has been studied extensively. Feedback of performance outcomes that are worse than actual performance, error amplification, has been previously found to expedite motor adaptations to novel task constraints compared to accurate feedback [28, 29] and amplification of task errors has shown promise as an approach to facilitate motor recovery in patients with neurological disorders [30, 31]. Faster or more complete learning with error amplification has been attributed to more brain processes associated with greater attention to execution of the motor task [32, 33, 34] and reduction of sensorimotor noise [14]. We speculate that increased improvement in classification accuracy with Modified feedback in this study may be a product of similar mechanisms that have been previously attributed to performance improvements with error amplification.
V-C Selected Gestures
We selected gestures that mimicked manipulation of commonplace items such as remote controls and cellphones. No subject commented that the gestures were unfamiliar or difficult to perform. Directional gestures using wrist movements (“Up”, “Down”, “Left”, “Right”) were generally separable and yielded higher classification accuracy compared to gestures using grasping movements (“Pinch”, “Thumb”, “Open”, “Fist”). These gestures recruit similar extrinsic hand muscle groups (where electrodes were placed), and creating separation in the muscle activation patterns used to perform these gestures may not be intuitive. Thus the feature-space similarity that we observed for these gestures is somewhat expected. Importantly, the use of modified feedback appeared to influence the class separation of these gestures specifically compared to control and veridical feedback conditions.
V-D Limitations
There were several limitations of the current work that may have affected the results and interpretations. Only a single classification model was used. Several machine learning methods, including artificial neural networks (ANN), linear discriminant analysis (LDA), support vector machines (SVM), and Gaussian mixture models have been previously used for sEMG-based control. The choice to use a model based on SVM and Logistic Regression was due its simplicity and the popularity of SVM for this application. It is likely that the choice of classifier model affects not only calibration accuracy, but also the way user explores the mapping of muscle activation to gestures. Nevertheless, the user training scheme employed here likely has general benefit for use and understanding of human co-adaptive behavior.
There are a number of possible changes in the signal processing pipeline that may yield improvements in overall model performance. The active window for feature extraction may be tuned, and additional features such as time-frequency domain or higher-dimensional feature vectors may be extracted. The selected features (RMS, and median frequency) were chosen based on their common use in for sEMG-based gesture classification and initial pilot testing. Future work should evaluate how sEMG feature selection effects user training.
Only a single type of feedback manipulation was tested. We used a feedback manipulation that essentially flattened probabilities across classes, making it more difficult to achieve a correct classification. This approach was selected as it was expected that participants would respond by increasing the separation between muscle activation patterns for different gestures. While we find this to be case, the manipulation was not directly optimized for this purpose. Future research should explore the optimization of feedback manipulation for shaping user behavior during co-adaptive sEMG-gesture recognition. Adaptive feedback manipulation based on user and model performance characteristics to target specific class confusions is a attractive future direction.
References
- [1] Zhiwen Yang, Ying Sun Du Jiang, Bo Tao, Xiliang Tong, Guozhang Jiang, Manman Xu, Juntong Yun, Ying Liu, Baojia Chen, and Jianyi Kong. Dynamic gesture recognition using surface emg signals based on multi-stream residual network. Frontiers in Bioengineering and Biotechnology, 9, 2021.
- [2] Dezhen Xiong, Daohui Zhang, Xingang Zhao, and Yiwen Zhao. Deep learning for emg-based human-machine interaction: a review. IEEE/CAA Journal of Automatica Sinica, 8(3):512–533, 2021.
- [3] Jinxian Qi, Guozhang Jiang, Gongfa Li, Ying Sun, and Bo Tao. Intelligent human-computer interaction based on surface emg gesture recognition. IEEE Access, 7:61378–61387, 2019.
- [4] Dalia De Santis. A framework for optimizing co-adaptation in body-machine interfaces. Frontiers in Neurorobotics, 15:40, 2021.
- [5] Janne M Hahne, Sven Dähne, Han-Jeong Hwang, Klaus-Robert Müller, and Lucas C Parra. Concurrent adaptation of human and machine improves simultaneous and proportional myoelectric control. IEEE Transactions on Neural Systems and Rehabilitation Engineering, 23(4):618–627, 2015.
- [6] Mathilde Couraud, Daniel Cattaert, Florent Paclet, Pierre-Yves Oudeyer, and Aymar De Rugy. Model and experiments to optimize co-adaptation in a simplified myoelectric control system. Journal of neural engineering, 15(2):026006, 2018.
- [7] Dennis Yeung, Dario Farina, and Ivan Vujaklija. Directional forgetting for stable co-adaptation in myoelectric control. Sensors, 19(9):2203, 2019.
- [8] Dennis Yeung, Irene Mendez Guerra, Ian Barner-Rasmussen, Emilia Siponen, Dario Farina, and Ivan Vujaklija. Co-adaptive control of bionic limbs via unsupervised adaptation of muscle synergies. IEEE Transactions on Biomedical Engineering, 2022.
- [9] Agamemnon Krasoulis, Sethu Vijayakumar, and Kianoush Nazarpour. Effect of user practice on prosthetic finger control with an intuitive myoelectric decoder. Frontiers in neuroscience, page 891, 2019.
- [10] Nathan E Bunderson and Todd A Kuiken. Quantification of feature space changes with experience during electromyogram pattern recognition control. IEEE Transactions on Neural Systems and Rehabilitation Engineering, 20(3):239–246, 2012.
- [11] Michael A Powell, Rahul R Kaliki, and Nitish V Thakor. User training for pattern recognition-based myoelectric prostheses: Improving phantom limb movement consistency and distinguishability. IEEE Transactions on Neural Systems and Rehabilitation Engineering, 22(3):522–532, 2013.
- [12] Yejun Wei, Preeti Bajaj, Robert Scheidt, and James Patton. Visual error augmentation for enhancing motor learning and rehabilitative relearning. In 9th International Conference on Rehabilitation Robotics, 2005. ICORR 2005., pages 505–510. IEEE, 2005.
- [13] Emanuel Todorov, Reza Shadmehr, and Emilio Bizzi. Augmented feedback presented in a virtual environment accelerates learning of a difficult motor task. Journal of motor behavior, 29(2):147–158, 1997.
- [14] Christopher J Hasson, Zhaoran Zhang, Masaki O Abe, and Dagmar Sternad. Neuromotor noise is malleable by amplifying perceived errors. PLoS computational biology, 12(8):e1005044, 2016.
- [15] Adrian M Haith, Thomas R Reppert, and Reza Shadmehr. Evidence for hyperbolic temporal discounting of reward in control of movements. Journal of neuroscience, 32(34):11727–11736, 2012.
- [16] Meghan E Huber, Nikita Kuznetsov, and Dagmar Sternad. Persistence of reduced neuromotor noise in long-term motor skill learning. Journal of Neurophysiology, 116(6):2922–2935, 2016.
- [17] Hermanus J Hermens, TAMv Bruggen, Christian TM Baten, WLC Rutten, and HBK Boom. The median frequency of the surface emg power spectrum in relation to motor unit firing and action potential properties. Journal of Electromyography and Kinesiology, 2(1):15–25, 1992.
- [18] U Kreßel. Pairwise classification and support vector machines. In B. Schölkopf, C. J. C. Burges, and A. J. Smola, editors, Advances in Kernel Methods — Support Vector Learning, pages 255–268, Cambridge, MA, 1999. MIT Press.
- [19] Steven Diamond and Stephen Boyd. CVXPY: A Python-embedded modeling language for convex optimization. Journal of Machine Learning Research, 17(83):1–5, 2016.
- [20] Kristin Bennett and Ayhan Demiriz. Semi-supervised support vector machines. Advances in Neural Information processing systems, 11, 1998.
- [21] Adam Paszke, Sam Gross, Francisco Massa, Adam Lerer, James Bradbury, Gregory Chanan, Trevor Killeen, Zeming Lin, Natalia Gimelshein, Luca Antiga, et al. Pytorch: An imperative style, high-performance deep learning library. Advances in neural information processing systems, 32, 2019.
- [22] Ilya Loshchilov and Frank Hutter. Decoupled weight decay regularization. arXiv preprint arXiv:1711.05101, 2017.
- [23] PyQT. Pyqt reference guide, 2012.
- [24] Jimmy Feng, Pradeep Damodara, George Gensure, Ryan Catoen, and Allen Yin. Labgraph. https://github.com/facebookresearch/labgraph, 2021.
- [25] Damien Garreau, Wittawat Jitkrittum, and Motonobu Kanagawa. Large sample analysis of the median heuristic. arXiv preprint arXiv:1707.07269, 2017.
- [26] Jiayuan He, Dingguo Zhang, Ning Jiang, Xinjun Sheng, Dario Farina, and Xiangyang Zhu. User adaptation in long-term, open-loop myoelectric training: implications for emg pattern recognition in prosthesis control. Journal of neural engineering, 12(4):046005, 2015.
- [27] Andreas W Franzke, Morten B Kristoffersen, Vinay Jayaram, Corry K van der Sluis, Alessio Murgia, and Raoul M Bongers. Exploring the relationship between emg feature space characteristics and control performance in machine learning myoelectric control. IEEE Transactions on Neural Systems and Rehabilitation Engineering, 29:21–30, 2020.
- [28] Antoinette Domingo and Daniel P Ferris. The effects of error augmentation on learning to walk on a narrow balance beam. Experimental brain research, 206(4):359–370, 2010.
- [29] James L Patton, Mary Ellen Stoykov, Mark Kovic, and Ferdinando A Mussa-Ivaldi. Evaluation of robotic training forces that either enhance or reduce error in chronic hemiparetic stroke survivors. Experimental brain research, 168(3):368–383, 2006.
- [30] Sharon Israely and Eli Carmeli. Error augmentation as a possible technique for improving upper extremity motor performance after a stroke–a systematic review. Topics in stroke rehabilitation, 23(2):116–125, 2016.
- [31] Sergei V Adamovich, Gerard G Fluet, Eugene Tunik, and Alma S Merians. Sensorimotor training in virtual reality: a review. NeuroRehabilitation, 25(1):29–44, 2009.
- [32] Driss Boussaoud and Imane Kermadi. The primate striatum: neuronal activity in relation to spatial attention versus motor preparation. European Journal of Neuroscience, 9(10):2152–2168, 1997.
- [33] Markus Jueptner and Cornelius Weiller. A review of differences between basal ganglia and cerebellar control of movements as revealed by functional imaging studies. Brain: a journal of neurology, 121(8):1437–1449, 1998.
- [34] Navid Shirzad and HF Machiel Van der Loos. Error amplification to promote motor learning and motivation in therapy robotics. In 2012 Annual International Conference of the IEEE Engineering in Medicine and Biology Society, pages 3907–3910. IEEE, 2012.