Diminished circadian and ultradian rhythms in pathological brain tissue in human in vivo
-
1.
CNNP Lab (www.cnnp-lab.com), Interdisciplinary Computing and Complex BioSystems Group, School of Computing, Newcastle University, Newcastle upon Tyne, United Kingdom
-
2.
Faculty of Medical Sciences, Newcastle University, Newcastle upon Tyne, United Kingdom
-
3.
UCL Queen Square Institute of Neurology, Queen Square, London, United Kingdom
* Yujiang.Wang@newcastle.ac.uk
o Joint first authors
Abstract
Chronobiological rhythms, such as the circadian rhythm, have long been linked to neurological disorders, but it is currently unknown how pathological processes affect the expression of biological rhythms in the brain.
Here, we use the unique opportunity of long-term, continuous intracranially recorded EEG from 38 patients (totalling 6338 hours) to delineate circadian and ultradian rhythms in different brain regions. We show that functional circadian and ultradian rhythms are diminished in pathological tissue, independent of regional variations. We further demonstrate that these diminished rhythms are persistent in time, regardless of load or occurrence of pathological events.
These findings provide the first evidence that brain pathology is functionally associated with persistently diminished chronobiological rhythms in vivo in humans, independent of regional variations or pathological events. Future work interacting with, and restoring, these modulatory chronobiological rhythms may allow for novel therapies.
1 Introduction
Physiological processes are often modulated and structured by chronobiological rhythms. The circadian rhythm is perhaps the most pertinent and well-studied rhythm with a central pacemaker in the suprachiasmatic nucleus. Such rhythms are also differentially expressed in a range of tissues and organs, entrained by the central pacemaker. For example, multiple organs have been shown to display their own circadian rhythm in terms of gene expression and translation even in the absence of the pacemaker (20). Even within a single organ, such as the brain, circadian regulation of gene expression is tissue-specific (32, 29). This local, or tissue-level, autonomous rhythmicity allows tissue-specific adaptations in phase or magnitude (46), whilst being coordinated by a central pacemaker. Other chronobiological rhythms also exist on longer and shorter timescales, termed infradian and ultradian rhythms, respectively. However, these are far less well-studied, appear to differ in magnitude and period between individuals, organs, and tissues, and their biological mechanisms are elusive. So far, candidate drivers of some ultradian rhythms have been proposed, such as the pulsatile cortisol secretion in mammals every 1-3 hours (18, 17), where various organs and tissues may react differently (12, 39). Taken together, there is evidence that, with or without a central pacemaker, circadian and ultradian rhythms are differentially expressed at the tissue level to temporally structure and modulate local physiological processes.
Disrupted chronobiological rhythms are often associated with dysfunction and disease. Associations between altered circadian rhythms and neurodevelopmental disorders, mood disorders, epilepsy, Parkinson’s, and dementia are reported (24, 17). Similarly, disrupted ultradian rhythms may also be associated with neurological disorders, although their underpinning mechanisms are only beginning to be explored in animal models (28, 2). Many of the reported associations are linked to behavioural disruptions on circadian and ultradian timescales (e.g. sleep, levels of physical activity). However, tissue level regulation and expression of chronobiological rhythms in brain activity is less well-studied. One ex-vivo study with 16 patients with drug-refractory temporal lobe epilepsy showed that the expression of the circadian clock gene Bmal1 is reduced in surgically resected pathological tissue compared to healthy tissue (45). Similarly, tissue-level disruption to clock gene transcription and translation are found in various animal models of epilepsy (5). Thus, emerging evidence hints at tissue-level alteration of chronobiological rhythms in pathological tissue in brain disorders. However, to date, it is completely unknown if pathological tissue shows different expression of chronobiological rhythms in brain activity and electrophysiology in vivo in humans.
Here, we therefore investigate the rhythmicity of human brain activity in vivo. EEG is a commonly used method to measure brain activity patterns and multiple studies have shown that circadian and multiple ultradian rhythms can also be captured as the rhythmic modulation of particular signal properties (e.g. (37, 38, 36, 35, 34, 31)). In this study, we will use intracranially recorded continuous EEG (iEEG) over multiple days to measure circadian and ultradian rhythms in humans in vivo. Intracranial recordings have the advantage of a high signal-to-noise ratio, and provide excellent spatial resolution, as the electrodes directly sample from the target brain tissue without interference. This allows us to delineate functional chronobiological rhythms in specific locations.
2 Results
2.1 Overview of data and analysis
We analysed long-term iEEG recordings from 38 individuals with refractory focal epilepsy from the National Hospital for Neurology and Neurosurgery (Table 1). From the iEEG recordings of each patient, we localised each recording contact to an anatomical region of interest (ROI) and calculated the relative band power in the delta range (1 - 4 Hz) and the other four frequency bands ( theta : 4 - 8 Hz, alpha : 8 - 13 Hz, beta : 13 - 30 Hz and gamma : 30 - 47.5 Hz, 52.5 - 57.5 Hz, 62.5 - 77.5 Hz) using a non-overlapping 30 second window over the continuous recording in all patients (recording duration between 2-21 days). Circadian (a period of 19 - 31 hours) and ultradian (1-3h, 3-6h, 6-9h, 9-12h, 12-19h periods) rhythms were then isolated by applying band pass filters to the signal of relative band power over days in each ROI.
We used the clinically identified regions where seizures originate (seizure onset zone, or SOZ) as a proxy for pathological tissue. To ensure robustness of our results, we also used the alternative definition of the tissue that was subsequently surgically removed, as it was deemed central to generating epileptic seizures. We obtained similar results (Suppl. S5) with either definition, and will use the broad term of “pathological tissue” throughout the paper to refer to tissue that is most likely functionally (causing seizures) and/or structurally pathological.
| N | 38 |
|---|---|
| Age (mean,SD) | 32.1 (8.5) |
| Sex (M,F) | 17,21 |
| Temporal, extratemporal | 17,21 |
| Side (Left, Right) | 22,16 |
| Num contacts (mean, sd) | 72.8 (25.2) |
| Recording Duration in hours (mean, sd) | 111.5 (58.1 ) |
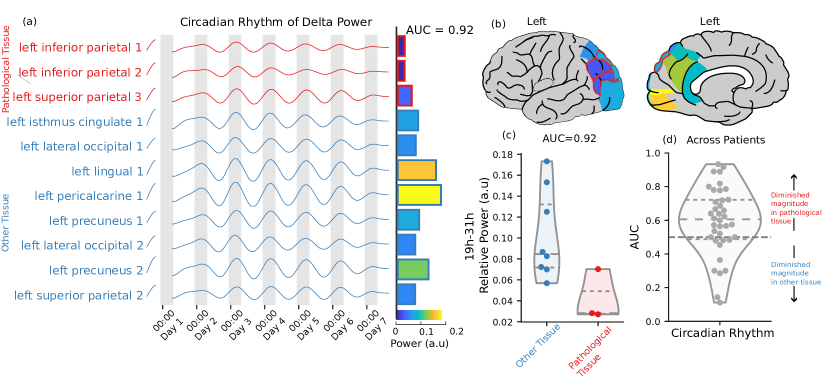
2.2 Circadian rhythms are diminished in pathological brain tissue
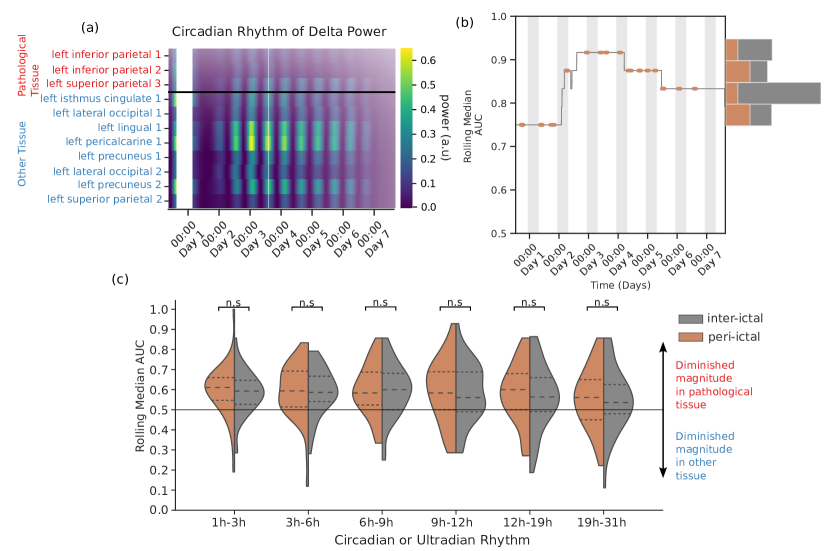
Figure 1 (a) shows the power of the delta EEG band over seven days for an example patient, filtered to isolate only the circadian rhythm (19h-31h). In this patient the regions with the weakest circadian rhythm are within the left inferior parietal lobe, visualized in Figure 1 (b). These comprise two out of the three pathological regions. Figure 1 (c) compares the power of the delta circadian rhythm in regions with pathology against the remaining regions. We quantify this difference using the non-parametric Area Under the Curve (AUC) of a Receiver Operating Characteristics analysis (7). Here, AUC values greater than 0.5 imply diminished power in pathological tissue and the example patient yielded an AUC=0.92. Figure 1 (d) shows the AUC values across all 38 patients - the distribution is substantially greater than 0.5 (median AUC=0.62, p=0.005) implying a diminished circadian rhythm in delta power in the pathological tissue across a majority of patients (66% of subjects with AUC0.5).
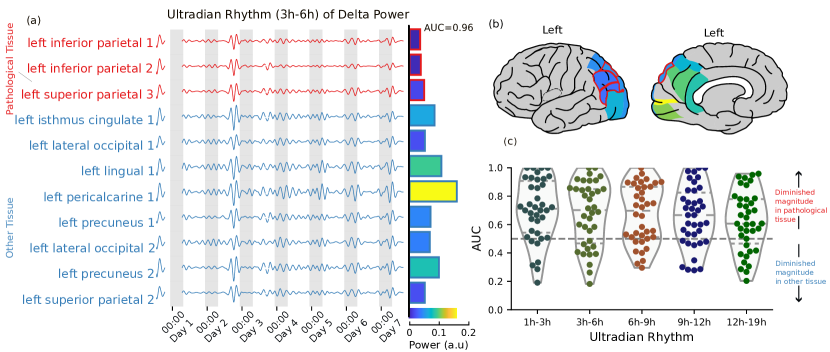
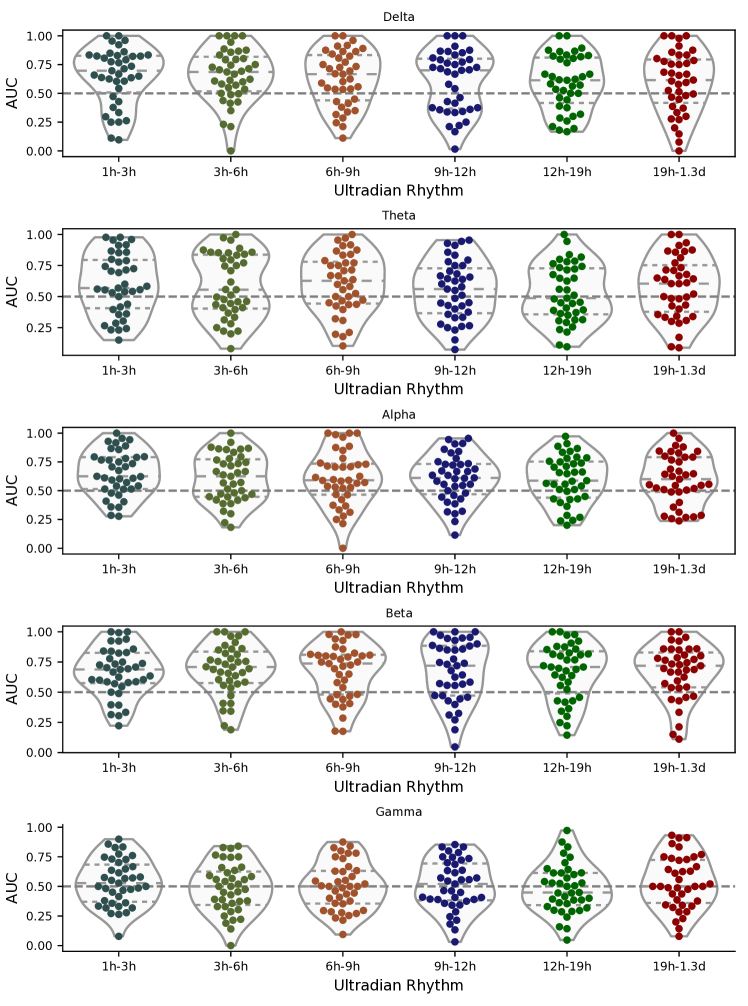
2.3 Multiple ultradian rhythms are diminished in pathological brain tissue
Figure 2 (a) shows the delta band power, filtered to isolate the 3 - 6 hour ultradian rhythm, across regions for the same example patient. As with the circadian rhythm, there was a diminished power in the three pathological regions, quantified with an AUC of 0.96 for this patient and visualized in Figure 2 (b). Diminished ultradian rhythms are present across the cohort, with a median AUC of 0.69 for the 3 - 6 hour rhythm, and median AUC values above 0.5 for all rhythm periods - shown in Figure 2 (c), p0.05 for all.
In Suppl. S4 we further show that these effects in circadian and ultradian rhythms are not simply due to a dimished magnitude of the raw EEG signal in the pathological tissue.
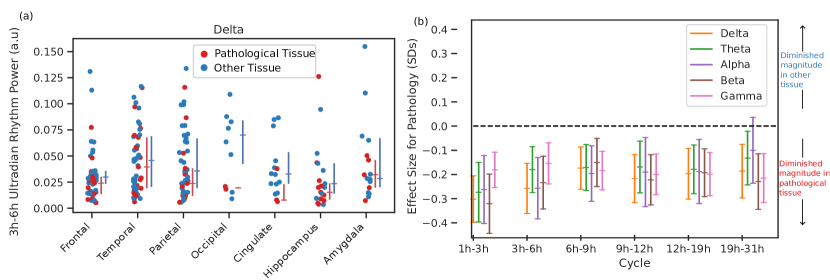
2.4 Pathology is independently associated with diminished chronobiological rhythms
To investigate if our observed effects are potentially explained by the spatial location, or the broad brain lobe (or subcortical region) of the observations, we plotted the power of an example ultradian rhythm in delta grouped by lobe across patients (Figure 3 a). While there is some variation of power of this ultradian rhythm across lobes, the power in the pathological tissue in each area appears consistently diminished.
To show that pathology is independently associated with diminished chronobiological rhythms, we tested the association in a mixed effects regression with the lobe (those shown in figure 3 (a)) as a covariate. This model took the power of the rhythm in each ROI as the dependent variable, the lobe of the ROI and whether the ROI has pathology (is within the SOZ) as independent variables, and grouped by patient. Figure 3 (b) shows the partially standardized fixed effect for pathology () for each ultradian/circadian rhythm in delta band power. All coefficients are below zero, indicating that ultradian/circadian rhythms are diminished in pathological tissue. Applying a likelihood ratio test to compare a model with pathology and brain area to a model with brain area only, we find that the effect of pathology explains the power of cycles significantly better for almost all EEG bands and ultradian/circadian rhythms (see Suppl S2 for details).
Finally, we also checked if any particular type of pathology was associated with diminished rhythmicity, and found that most subjects showed this effect without evidence for the influence of the type of pathology (Suppl. S6).
2.5 Diminished rhythms are persistent in time and independent of seizure occurrence
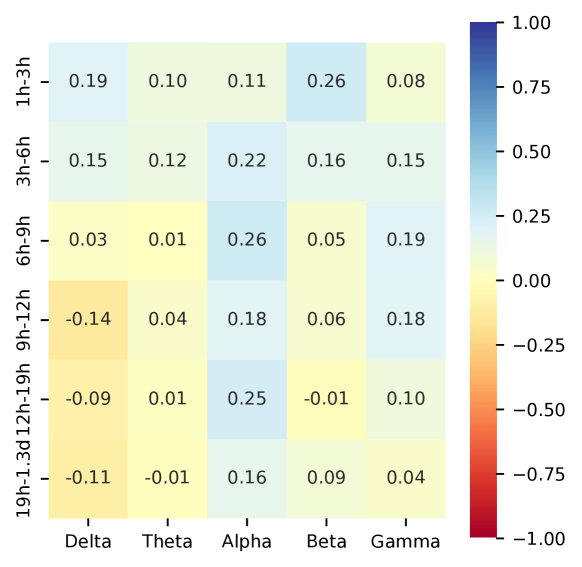
To assess whether the rhythms remained diminished in pathological tissue consistently over time and not only during the period around epileptic seizures (peri-ictal period), we calculated a rolling median of the AUC using a window proportional to the rhythm period (36 hours for the circadian rhythm). We illustrate the circadian rhythm of delta power in our sample patient in figure 4 (a), the rolling AUC is shown in figure 4 (b) along with a histogram showing that the distributions of AUC values are similar during inter-ictal and peri-ictal periods. Figure 4 (c) aggregates results across subjects and rhythms, showing no difference in the AUC distributions of inter-ictal and peri-ictal periods. The overall seizure load (average number of seizures per hour) was also not correlated with the AUC for the circadian rhythm of delta () and no strong correlation was found for any other rhythm (, see Suppl. S3).
3 Discussion
Analysing long-term iEEG recordings from 38 subjects with refractory focal epilepsy, we identified rhythms in the power of canonical EEG bands at circadian and ultradian timescales. We found that these rhythms were diminished in pathological tissue, and that this association remained when we controlled for brain area. We also found that these rhythms remain diminished persistently across time, without dependence on seizure occurrence. Our work provides initial evidence of a link between the strength of chronobiological rhythms and the healthy functioning of brain tissue in humans in vivo.
Circadian clock gene dysfunction has been seen in pathological tissue in multiple animal models (5) and human tissue (45), but a key advance in our study is to also demonstrate a functional abnormality in pathological tissue in terms of electrophysiological function in humans. From animal models we have learned that circadian gene oscillation pattern do not necessarily translate to similar changes in mRNA or protein level (5). It was therefore also unclear if disruptions in these patterns translate to electrophysiological dysfunction, particularly in humans. Although numerous studies have reported circadian and ultradian rhythms in a range of signal properties in human EEG, these have been reported both in healthy participants (1, 41, 6), as well as in e.g. epilepsy patients (27, 31). It was therefore unknown if (i) there was a dysfunction in circadian and ultradian rhythms in electrophysiology associated with pathology in humans and (ii) if so, how the dysfunction would be expressed. Our work therefore serves as crucial evidence that (i) dysfunction is seen in pathology in circadian and ultradian rhythms in electrophysiological function, and (ii) dysfunction is expressed as a persistently diminished rhythm.
Electrophysiological function is, of course, not limited to the signal features of relative band power that we analyzed. Indeed, there is evidence that other EEG signal features may display different rhythms (27). Future work should investigate a fuller range of signal features and seek to answer questions such as whether different pathologies display different profiles of disruption in rhythms. Nevertheless, relative band power is a primary set of features that is both widely accepted and used in neuroscience, making it easier to compare and put our results into context. We are also encouraged that our main results replicate over all frequency bands. Finally, our results are in agreement with a wider literature: diminished rhythmicity appears to be consistently observed in multiple modalities and organs in ageing and pathology (22, 4).
Another open question is if the electrophysiological circadian disruptions are a cause or consequence of the epileptogenic pathology. In our data, we observed no correlation between the resection of diminished rhythms and subsequent surgical outcome. This observation would suggest that sparing regions with diminished rhythms does not cause recurrent seizures after surgery per se. Similarly, we observed no temporal correlation between the magnitude of diminished rhythms and seizure occurrence. These observations should be validated in a larger cohort in future, ideally with more complete spatial sampling. We can nevertheless conclude that we see no evidence of disrupted rhythms causing seizures in our cohort.
Interestingly, circadian and multi-day rhythms have attracted great interest recently: Various EEG and physiological signals display circadian and multi-day rhythms, and seizures occurrence(21, 23, 14), as well as other seizure features(40, 31, 10) couple to the phase of these rhythms in most patients. However, the mechanism of this coupling remains elusive, and the key question is how the seizure-generating process was modulated. Our recordings were too short for most patients to investigate multi-day rhythms, but our work can contribute towards the circadian aspect of the question. Our data suggests the epileptogenic pathology actually experiences a persistently diminished circadian modulation, most likely caused by the pathology itself. Therefore, we suggest that the circadian modulation of seizure occurrence and other seizure features is most likely mediated as a network phenomenon with other non-pathological regions, rather than arising locally within the pathological tissue itself. This supposition is also supported by recent observations that interictal markers of epilepsy are also more persistent, and less rhythmic in pathological tissue, possibly independent of seizure occurrence (33, 44). Future work will investigate if direct evidence of this network modulation can be found.
In general, a bi-directional relationship is often highlighted between circadian rhythmicity and neurological conditions(24), particularly epilepsy(26). A vicious circle is often described, where pathology or pathological events may erode or disrupt circadian rhythms, and disrupted rhythms may in turn exacerbate disease symptoms or even support disease progression. A key component in this vicious circle is sleep, which we have not investigated explicitly in our study. However, future work should consider if alterations in both ultradian and circadian rhythms may reflect a loss of healthy sleep physiology regionally and behaviorally. Much of this complex interplay between rhythms, sleep, and disease is still unknown; nevertheless, our work provides initial evidence for a vital part of this vicious circle: circadian modulation of electrophysiology is indeed impaired in pathological tissue.
A limitation of our study is the coverage of electrodes in each patient. As the implantation of the iEEG is to inform surgery, electrodes are typically confined to a single hemisphere or a series of neighboring or connected regions. This means that each patient does not have complete data across all brain areas, and the AUC values calculated are based only implanted regions. A related limitation is that pathology might be present more broadly across the brain than the implanted region or SOZ (19, 30, 11). It is also possible that the typical chronobiological rhythms of patients could be disrupted by surgery and implantation of the iEEG electrodes, their stay in the epilepsy monitoring unit, and changes to anti-epileptic medication.
Future work will seek to establish a normative map (15, 9, 43, 3) of the expected power of each ultradian and circadian rhythms in healthy tissue. Such a map would allow a better estimation if any particular observed rhythm was abnormal in a given brain region. To create such a normative map, we need to draw on a large and diverse cohort of subjects and assess their healthy tissue to estimate the expected power. This approach has previously shown success in the context of intracranial EEG and epilepsy (43, 3), but was limited to assess short-term signal properties. Future work should extend this line of work into ultradian and circadian rhythms.
Finally, a key limitation was our analysis of the ultradian rhythms. Due to the lack of a central pacemaker, ultradian rhythms are extremely variable between subjects, and possibly also over longer time periods. Our coarse grouping of these rhythms is inspired by literature, but not data-driven. Our results in this context should thus be interpreted as a lack of fluctuations on timescales below one day in pathological tissue, rather than any specific rhythmic activity being diminished. Future work should investigate these fluctuations from the perspective of episodic, but most likely not strictly rhythmic events (13).
In summary, pathological brain regions show weakened chronobiological rhythms. At present, the causal direction of this association is not clear, but the effect is independent of seizure occurrence and brain region. These findings encourage future research to consider chronobiological rhythms in the development of disease models and treatments.
4 Methods
4.1 Preprocessing of long-term iEEG recordings
We analysed long-term iEEG recordings from 38 subjects with refractory focal epilepsy from the National Hospital for Neurology and Neurosurgery (Table 1). For each subject we processed their entire available iEEG recordings. Firstly, we divided each subject’s iEEG data into 30 s non-overlapping, consecutive time segments. All channels in each time segment were re-referenced to a common average reference. In each time segment, we excluded any noisy channels (with outlier amplitude ranges) from the computed common average. To remove power line noise, each time segment was notch filtered at Hz. Finally, segments were band-pass filtered from Hz using a order zero-phase Butterworth filter (second order forward and backward filter applied) and further downsampled to Hz. Missing data were not tolerated in any time segment and denoted as missing for the downstream analysis.
We then calculated the iEEG band power for each 30 s time segment for all channels. We extracted iEEG band power from 30 s non-overlapping iEEG segments in five frequency bands ( Hz, Hz, Hz, Hz and Hz, Hz, Hz) using Welch’s method with 3 s non-overlapping windows. In detail, for each channel in every 2 s window we calculated the power spectral density (PSD) and used Simpson’s rule to obtain the band power values which then averaged over all time windows within a 30 s segment to get the final band power values. In order to remove electrical noise, we selected custom range limits for the gamma frequency band. We -transformed and normalised the band power values to sum to one for each 30 s segment. We then averaged over the relative log band power of all electrodes included in each ROI, thus obtaining, for each subject, one matrix of relative log band power at the ROI level for each frequency band (of size number of ROIs by number of 30 s segments).
In the majority of resulting relative band power matrices had missing data, which we imputed (Suppl. S1) to enable extraction of rhythms and their time-varying characteristics, such as instantaneous frequency and amplitude. Imputed data were not used for subsequent analysis, and segments with imputed data were blanked after extraction of rhythms.
4.2 Extracting chronobiological rhythms using bandpass filter
To extract rhythms of various timescales from the relative log band power, we performed a order zero-phase Butterworth filter (second order forward and backward). Within each subject, we extracted ultradian rhythms in different period bands (1h-3h, 3h-6h, 6h-9h, 9h-12h, 12h-9h). Finally, we denoted a circadian rhythm with period length of 19h-1.3d.
4.3 MRI processing for identifying regions and resected tissue
To map electrode coordinates to brain regions we used the same methods as described previously (44). In brief, we assigned electrodes to one of 128 regions from the Lausanne scale60 atlas (16). We used FreeSurfer to generate volumetric parcellations of each patient’s pre-operative MRI (16, 8). Each electrode contact was assigned to the closest grey matter volumetric region within 5 mm. If the closest grey matter region was 5mm away then the contact was excluded from further analysis.
To identify which regions were later resected, we used previously described methods (42, 43). We registered post-operative MRI to the pre-operative MRI and manually delineated the resection cavity. This manual delineation accounted for post-operative brain shift and sagging into the resection cavity. Electrode contacts within 5mm of the resection were assigned as resected. Regions with 25% of their electrode contacts removed were considered as resected for downstream analysis.
4.4 Determining if chronobiological rhythms are diminished in pathological tissue
In order to quantify the strength of each band power chronobiological rhythm at the ROI level for each subject, we computed the average power of each rhythm obtained from the bandpass filtered signal. In order to compare the strength of each rhythm between pathological and healthy tissue, we computed the area under the curve (AUC). AUC values higher than 0.5 indicate diminished band power rhythms in pathological tissue, while AUCs lower than 0.5 indicate diminished band power rhythms in spared ROIs and finally AUC = 0.5 indicates no discrimination between pathological and healthy tissue.
We used the clinically identified regions where seizures originate (seizure onset zone, or SOZ) as a proxy for pathological tissue. To ensure robustness of our results, we also used the alternative definition of the tissue that was subsequently surgically removed, as it was deemed central to generating epileptic seizures. We obtained similar results (Suppl. S5) with either definition, and will use the broad term of “pathological tissue” throughout the paper to refer to tissue that is most likely functionally (causing seizures) and/or structurally pathological.
4.5 Fitting a mixed effects model to control for brain area
To show that pathological tissue predicted diminished rhythms above any brain area specific effect, we fit a mixed effects model predicting the rhythm power in a given ROI from a categorical variable representing lobe within which the ROI resides, and whether that ROI was pathological, grouping by a random patient offset. Equation 1 describes the model, where is the power of the rhythm for patient in ROI , is the fixed intercept, is the fixed effect for pathological ROI, is a binary variable indicating that ROI of patient is pathological, is the fixed effect of the region being in each lobe - a categorical variable with 7 levels corresponding to the x axis of figure 3 (a), indicates whether ROI of patient is in each lobe, is the random intercept for patient , and is the error. Regions were grouped into 7 possible lobes/areas: frontal, temporal, parietal, occipital, cingulate, hippocampus, amygdala. The dependent variable (rhythm power) was standardized before fitting to give partially standardized coefficients, allowing us to interpret as the expected effect of pathology on rhythm power (in standard deviations) (25). A likelihood ratio test was used to assess whether the effect of pathology was statistically significant - comparing to a reduced model without pathology as a variable. Maximum likelihood estimation was used in the fitting of models, with Python (3.8.10) alongside the statsmodels library (0.14.0) and its MixedLM function providing the software.
| (1) |
4.6 Code and data availability
All analysis was performed using Python (version 3.8) and MATLAB (version R2023a).
Code used in analysis is available at: https://github.com/cnnp-lab/DiminishedRhythmsPathology
Data used in analysis is available at: https://zenodo.org/record/8289342
5 Acknowledgements
We thank members of the Computational Neurology, Neuroscience & Psychiatry Lab (www.cnnp-lab.com) for discussions on the analysis and manuscript; P.N.T. and Y.W. are both supported by UKRI Future Leaders Fellowships (MR/T04294X/1, MR/V026569/1). JSD, JdT are supported by the NIHR UCLH/UCL Biomedical Research Centre.
References
- Aeschbach et al. (1999) Daniel Aeschbach, Jeffery R Matthews, Teodor T Postolache, Michael A Jackson, Holly A Giesen, and Thomas A Wehr. Two circadian rhythms in the human electroencephalogram during wakefulness. American Journal of Physiology-Regulatory, Integrative and Comparative Physiology, 277(6):R1771–R1779, 1999.
- Basu et al. (2021) Trina Basu, Jamie Maguire, and Jay A Salpekar. Hypothalamic-pituitary-adrenal axis targets for the treatment of epilepsy. Neuroscience letters, 746:135618, 2 2021. ISSN 1872-7972. doi: 10.1016/j.neulet.2020.135618.
- Bernabei et al. (2022) John M Bernabei, Nishant Sinha, T Campbell Arnold, Erin Conrad, Ian Ong, Akash R Pattnaik, Joel M Stein, Russell T Shinohara, Timothy H Lucas, Dani S Bassett, Kathryn A Davis, and Brian Litt. Normative intracranial eeg maps epileptogenic tissues in focal epilepsy. Brain : a journal of neurology, 145:1949–1961, 6 2022. ISSN 1460-2156. doi: 10.1093/brain/awab480. URL http://www.ncbi.nlm.nih.gov/pubmed/35640886http://www.pubmedcentral.nih.gov/articlerender.fcgi?artid=PMC9630716.
- Brooks et al. (2023) Thomas Brooks, Nicholas Lahens, Yvette Sheline, Garret Fitzgerald, and Carsten Skarke. Diurnal rhythmicity of wearable device-measured wrist temperature predicts future disease incidence in the uk biobank. Research Square. Preprint., 2 2023. doi: 10.21203/RS.3.RS-2535978/V1.
- Chan and Liu (2021) Felix Chan and Judy Liu. Molecular regulation of brain metabolism underlying circadian epilepsy. Epilepsia, 62:S32–S48, 2021.
- Croce et al. (2018) Pierpaolo Croce, Angelica Quercia, Sergio Costa, and Filippo Zappasodi. Circadian rhythms in fractal features of eeg signals. Frontiers in physiology, 9:1567, 2018.
- Fawcett (2006) Tom Fawcett. An introduction to roc analysis. Pattern Recognition Letters, 27:861–874, 6 2006. ISSN 01678655. doi: 10.1016/j.patrec.2005.10.010. URL https://linkinghub.elsevier.com/retrieve/pii/S016786550500303X.
- Fischl (2012) Bruce Fischl. FreeSurfer. NeuroImage, 62(2):774–781, August 2012. ISSN 10538119. doi: 10.1016/j.neuroimage.2012.01.021. URL https://linkinghub.elsevier.com/retrieve/pii/S1053811912000389.
- Frauscher et al. (2018) Birgit Frauscher, Nicolas Von Ellenrieder, Rina Zelmann, Irena Doležalová, Lorella Minotti, Andre Olivier, Jeffery Hall, Dominique Hoffmann, Dang Khoa Nguyen, Philippe Kahane, et al. Atlas of the normal intracranial electroencephalogram: neurophysiological awake activity in different cortical areas. Brain, 141(4):1130–1144, 2018.
- Gascoigne et al. (2023) Sarah J Gascoigne, Leonard Waldmann, Gabrielle M Schroeder, Mariella Panagiotopoulou, Jess Blickwedel, Fahmida Chowdhury, Alison Cronie, Beate Diehl, John S Duncan, Jennifer Falconer, et al. A library of quantitative markers of seizure severity. Epilepsia, 2023.
- Geier et al. (2015) Christian Geier, Stephan Bialonski, Christian E Elger, and Klaus Lehnertz. How important is the seizure onset zone for seizure dynamics? Seizure, 25:160–6, 2 2015. ISSN 1532-2688. doi: 10.1016/j.seizure.2014.10.013. URL http://www.ncbi.nlm.nih.gov/pubmed/25468511.
- George et al. (2017) Charlotte L George, Matthew T Birnie, Benjamin P Flynn, Yvonne M Kershaw, Stafford L Lightman, and Becky L Conway-Campbell. Ultradian glucocorticoid exposure directs gene-dependent and tissue-specific mrna expression patterns in vivo. Molecular and cellular endocrinology, 439:46–53, 1 2017. ISSN 1872-8057. doi: 10.1016/j.mce.2016.10.019. URL http://www.ncbi.nlm.nih.gov/pubmed/27769714http://www.pubmedcentral.nih.gov/articlerender.fcgi?artid=PMC5131830.
- Goh et al. (2019) Grace H Goh, Shane K Maloney, Peter J Mark, and Dominique Blache. Episodic ultradian events—ultradian rhythms. Biology, 8(1):15, 2019.
- Gregg et al. (2023) Nicholas M Gregg, Tal Pal Attia, Mona Nasseri, Boney Joseph, Philippa Karoly, Jie Cui, Rachel E Stirling, Pedro F Viana, Thomas J Richner, Ewan S Nurse, et al. Seizure occurrence is linked to multiday cycles in diverse physiological signals. Epilepsia, 64(6):1627–1639, 2023.
- Groppe et al. (2013) David M Groppe, Stephan Bickel, Corey J Keller, Sanjay K Jain, Sean T Hwang, Cynthia Harden, and Ashesh D Mehta. Dominant frequencies of resting human brain activity as measured by the electrocorticogram. Neuroimage, 79:223–233, 2013.
- Hagmann et al. (2008) Patric Hagmann, Leila Cammoun, Xavier Gigandet, Reto Meuli, Christopher J Honey, Van J Wedeen, and Olaf Sporns. Mapping the Structural Core of Human Cerebral Cortex. PLoS Biology, 6(7):e159, July 2008. ISSN 1545-7885. doi: 10.1371/journal.pbio.0060159. URL https://dx.plos.org/10.1371/journal.pbio.0060159.
- Hartmann et al. (1997) A. Hartmann, J. D. Veldhuis, M. Deuschle, H. Standhardt, and I. Heuser. Twenty-four hour cortisol release profiles in patients with alzheimer’s and parkinson’s disease compared to normal controls: Ultradian secretory pulsatility and diurnal variation. Neurobiology of Aging, 18:285–289, 5 1997. ISSN 0197-4580. doi: 10.1016/S0197-4580(97)80309-0.
- Henley et al. (2009) D E Henley, J A Leendertz, G M Russell, S A Wood, S Taheri, W W Woltersdorf, and S L Lightman. Development of an automated blood sampling system for use in humans. Journal of medical engineering & technology, 33:199–208, 4 2009. ISSN 1464-522X. doi: 10.1080/03091900802185970. URL http://www.ncbi.nlm.nih.gov/pubmed/19340690.
- Horsley et al. (2023) Jonathan J Horsley, Rhys H Thomas, Fahmida A Chowdhury, Beate Diehl, Andrew W McEvoy, Anna Miserocchi, Jane de Tisi, Skoerd B Vos, Matthew C Walker, Gavin P Winston, et al. Complementary structural and functional abnormalities to localise epileptogenic tissue. arXiv preprint arXiv:2304.03192, 2023.
- Hughey and Butte (2016) Jacob J Hughey and Atul J Butte. Differential phasing between circadian clocks in the brain and peripheral organs in humans. Journal of biological rhythms, 31:588–597, 12 2016. ISSN 1552-4531. doi: 10.1177/0748730416668049.
- Karoly et al. (2021) Philippa J Karoly, Vikram R Rao, Nicholas M Gregg, Gregory A Worrell, Christophe Bernard, Mark J Cook, and Maxime O Baud. Cycles in epilepsy. Nature Reviews Neurology, 17(5):267–284, 2021.
- Kondratova and Kondratov (2012) Anna A Kondratova and Roman V Kondratov. The circadian clock and pathology of the ageing brain. Nature Reviews Neuroscience, 13(5):325–335, 2012.
- Leguia et al. (2021) Marc G Leguia, Ralph G Andrzejak, Christian Rummel, Joline M Fan, Emily A Mirro, Thomas K Tcheng, Vikram R Rao, and Maxime O Baud. Seizure cycles in focal epilepsy. JAMA neurology, 78(4):454–463, 2021.
- Logan and McClung (2019) Ryan W Logan and Colleen A McClung. Rhythms of life: circadian disruption and brain disorders across the lifespan. Nature reviews. Neuroscience, 20:49–65, 1 2019. ISSN 1471-0048. doi: 10.1038/s41583-018-0088-y. URL http://www.ncbi.nlm.nih.gov/pubmed/30459365http://www.pubmedcentral.nih.gov/articlerender.fcgi?artid=PMC6338075.
- Lorah (2018) Julie Lorah. Effect size measures for multilevel models: definition, interpretation, and timss example. Large-scale Assessments in Education, 6:8, 12 2018. ISSN 2196-0739. doi: 10.1186/s40536-018-0061-2. URL https://largescaleassessmentsineducation.springeropen.com/articles/10.1186/s40536-018-0061-2.
- Maganti and Jones (2021) Rama K Maganti and Mathew V Jones. Untangling a web: basic mechanisms of the complex interactions between sleep, circadian rhythms, and epilepsy. Epilepsy Currents, 21(2):105–110, 2021.
- Mitsis et al. (2020) Georgios D. Mitsis, Maria N. Anastasiadou, Manolis Christodoulakis, Eleftherios S. Papathanasiou, Savvas S. Papacostas, and Avgis Hadjipapas. Functional brain networks of patients with epilepsy exhibit pronounced multiscale periodicities, which correlate with seizure onset. Human Brain Mapping, 41(8):2059–2076, 2020. ISSN 1097-0193. doi: 10.1002/hbm.24930. URL https://onlinelibrary.wiley.com/doi/abs/10.1002/hbm.24930.
- Monje et al. (2017) Francisco J. Monje, Ana Cicvaric, Juan Pablo Acevedo Aguilar, Immanuel Elbau, Orsolya Horvath, Weifei Diao, Micaela Glat, and Daniela D. Pollak. Disrupted ultradian activity rhythms and differential expression of several clock genes in interleukin-6-deficient mice. Frontiers in Neurology, 8:22, 3 2017. ISSN 16642295. doi: 10.3389/FNEUR.2017.00099/FULL.
- Mure et al. (2018) Ludovic S Mure, Hiep D Le, Giorgia Benegiamo, Max W Chang, Luis Rios, Ngalla Jillani, Maina Ngotho, Thomas Kariuki, Ouria Dkhissi-Benyahya, Howard M Cooper, et al. Diurnal transcriptome atlas of a primate across major neural and peripheral tissues. Science, 359(6381):eaao0318, 2018.
- Owen et al. (2023) Thomas W Owen, Vytene Janiukstyte, Gerard R Hall, Fahmida A Chowdhury, Beate Diehl, Andrew McEvoy, Anna Miserocchi, Jane de Tisi, John S Duncan, Fergus Rugg-Gunn, et al. Interictal meg abnormalities to guide intracranial electrode implantation and predict surgical outcome. arXiv preprint arXiv:2304.05199, 2023.
- Panagiotopoulou et al. (2022) M. Panagiotopoulou, C. A. Papasavvas, G. M. Schroeder, R. H. Thomas, P. N. Taylor, and Y. Wang. Fluctuations in EEG band power at subject-specific timescales over minutes to days explain changes in seizure evolutions. Human Brain Mapping, 2022. doi: 10.1002/hbm.25796.
- Panda et al. (2002) Satchidananda Panda, Marina P Antoch, Brooke H Miller, Andrew I Su, Andrew B Schook, Marty Straume, Peter G Schultz, Steve A Kay, Joseph S Takahashi, and John B Hogenesch. Coordinated transcription of key pathways in the mouse by the circadian clock. Cell, 109(3):307–320, 2002.
- Petito et al. (2022) Gabrielle T Petito, Jeremy Housekeeper, Jason Buroker, Craig Scholle, Brian Ervin, Clayton Frink, Hansel M Greiner, Jesse Skoch, Francesco T Mangano, Thomas J Dye, et al. Diurnal rhythms of spontaneous intracranial high-frequency oscillations. Seizure, 102:105–112, 2022.
- Philippu (2016) Athineos Philippu. Nitric oxide: A universal modulator of brain function. Current medicinal chemistry, 23:2643–2652, 9 2016. ISSN 1875-533X. doi: 10.2174/0929867323666160627120408. URL https://pubmed.ncbi.nlm.nih.gov/27356532/.
- Philippu (2019) Athineos Philippu. Neurotransmitters are released in brain areas according to ultradian rhythms: Coincidence with ultradian oscillations of eeg waves. Journal of chemical neuroanatomy, 96:66–72, 3 2019. ISSN 1873-6300. doi: 10.1016/J.JCHEMNEU.2018.12.007. URL https://pubmed.ncbi.nlm.nih.gov/30576780/.
- Polich (1997) J. Polich. On the relationship between eeg and p300: individual differences, aging, and ultradian rhythms. International journal of psychophysiology : official journal of the International Organization of Psychophysiology, 26:299–317, 6 1997. ISSN 0167-8760. doi: 10.1016/S0167-8760(97)00772-1. URL https://pubmed.ncbi.nlm.nih.gov/9203011/.
- Polich and Kok (1995) John Polich and Albert Kok. Cognitive and biological determinants of p300: an integrative review. Biological Psychology, 41:103–146, 1995. ISSN 03010511. doi: 10.1016/0301-0511(95)05130-9. URL https://pubmed.ncbi.nlm.nih.gov/8534788/.
- Ravden and Polich (1999) Daran Ravden and John Polich. On p300 measurement stability: habituation, intra-trial block variation, and ultradian rhythms. Biological psychology, 51:59–76, 1999. ISSN 0301-0511. doi: 10.1016/S0301-0511(99)00015-0. URL https://pubmed.ncbi.nlm.nih.gov/10579421/.
- Rozhkova et al. (2021) I. S. Rozhkova, D. L. Teply, and E. D. Bazhanova. Ultradian rhythms and oxidative stress in lymph-node tissue during ontogenesis. Advances in Gerontology, 11:268–273, 7 2021. ISSN 2079-0570. doi: 10.1134/S2079057021030140.
- Schroeder et al. (2020) Gabrielle M Schroeder, Beate Diehl, Fahmida A Chowdhury, John S Duncan, Jane de Tisi, Andrew J Trevelyan, Rob Forsyth, Andrew Jackson, Peter N Taylor, and Yujiang Wang. Seizure pathways change on circadian and slower timescales in individual patients with focal epilepsy. Proceedings of the National Academy of Sciences, 117(20):11048–11058, 2020.
- Tan et al. (2003) Xin Tan, Makoto Uchiyama, Kayo Shibui, Hirokuni Tagaya, Hiroyuki Suzuki, Yuichi Kamei, Kyuja Kim, Sayaka Aritaka, Akiko Ozaki, and Kiyohisa Takahashi. Circadian rhythms in humans’ delta sleep electroencephalogram. Neuroscience letters, 344(3):205–208, 2003.
- Taylor et al. (2018) Peter N. Taylor, Nishant Sinha, Yujiang Wang, Sjoerd B. Vos, Jane de Tisi, Anna Miserocchi, Andrew W. McEvoy, Gavin P. Winston, and John S. Duncan. The impact of epilepsy surgery on the structural connectome and its relation to outcome. NeuroImage: Clinical, 18:202–214, 2018. ISSN 22131582. doi: 10.1016/j.nicl.2018.01.028. URL https://linkinghub.elsevier.com/retrieve/pii/S2213158218300287.
- Taylor et al. (2022) Peter N Taylor, Christoforos A Papasavvas, Thomas W Owen, Gabrielle M Schroeder, Frances E Hutchings, Fahmida A Chowdhury, Beate Diehl, John S Duncan, Andrew W McEvoy, Anna Miserocchi, Jane de Tisi, Sjoerd B Vos, Matthew C Walker, and Yujiang Wang. Normative brain mapping of interictal intracranial EEG to localize epileptogenic tissue. Brain, 145(3):939–949, April 2022. ISSN 0006-8950, 1460-2156. doi: 10.1093/brain/awab380. URL https://academic.oup.com/brain/article/145/3/939/6514463.
- Wang et al. (2023) Yujiang Wang, Gabrielle M Schroeder, Jonathan J Horsley, Mariella Panagiotopoulou, Fahmida A Chowdhury, Beate Diehl, John S Duncan, Andrew W McEvoy, Anna Miserocchi, Jane de Tisi, et al. Temporal stability of intracranial eeg abnormality maps for localizing epileptogenic tissue. Epilepsia, 2023.
- Wu et al. (2021) Hao Wu, Yong Liu, Lishuo Liu, Qiang Meng, Changwang Du, Kuo Li, Shan Dong, Yong Zhang, Huanfa Li, and Hua Zhang. Decreased expression of the clock gene bmal1 is involved in the pathogenesis of temporal lobe epilepsy. Molecular brain, 14:113, 7 2021. ISSN 1756-6606. doi: 10.1186/s13041-021-00824-4. URL http://www.ncbi.nlm.nih.gov/pubmed/34261484http://www.pubmedcentral.nih.gov/articlerender.fcgi?artid=PMC8281660.
- Yeung et al. (2018) Jake Yeung, Jérôme Mermet, Céline Jouffe, Julien Marquis, Aline Charpagne, Frédéric Gachon, and Felix Naef. Transcription factor activity rhythms and tissue-specific chromatin interactions explain circadian gene expression across organs. Genome research, 28:182–191, 2 2018. ISSN 1549-5469. doi: 10.1101/gr.222430.117. URL http://www.ncbi.nlm.nih.gov/pubmed/29254942http://www.pubmedcentral.nih.gov/articlerender.fcgi?artid=PMC5793782.
figuresection tablesection
Supplementary
S1 Imputation of missing data
To facilitate further analysis, we employed imputation techniques to fill any gaps in the relative log band power of each ROI before proceeding with rhythm extraction at various timescales. However, we did not utilise imputed data for the final analysis. We identified missing blocks within each frequency band and imputed them accordingly. If a missing block had a size equal to one, we replaced it with the mean of the value before and after the block. For missing blocks larger than one, we identified the surrounding segments of equal length before and after the block. When the preceding segment was smaller than the missing block or the missing blocks were at the start of the recording, we used only the following segment for imputation. We interpolated the data of missing blocks using the mean of the adjacent segments and added Gaussian noise with a mean of zero and standard deviation of 60% of the standard deviation of the surrounding segments. Any missing data present in the adjacent segments was disregarded. The final values used for analysis were the interpolated ones with added Gaussian noise.
S2 AUC distributions across rhythms and EEG bands
| Wilcoxon rank sum test (p value and % AUC 0.5) | |||||
|---|---|---|---|---|---|
| Rhythm | Delta [p,%] | Theta [p,%] | Alpha [p,%] | Beta [p,%] | Gamma [p,%] |
| 19h-31h | [0.005, 66%] | [0.0151, 63%] | [0.002, 71%] | [0.001, 74%] | [0.001, 74%] |
| 12h-19h | [0.002, 74%] | [0.0722, 50%] | [0.012, 55%] | [0.001, 71%] | [0.046, 55%] |
| 9h-12h | [0.001, 79%] | [0.0135, 66%] | [0.008, 63%] | [0.001, 68%] | [0.001, 71%] |
| 6h-9h | [ 0.001, 76%] | [0.001, 68%] | [ 0.001, 76%] | [0.001, 71%] | [0.001, 68%] |
| 3h-6h | [0.001, 71%] | [0.005, 68%] | [0.001, 79%] | [0.001, 79%] | [0.005, 63%] |
| 1h-3h | [0.001, 82%] | [0.001, 74%] | [0.001, 87%] | [0.001, 84%] | [0.001, 74%] |
| SOZ_Beta | SE | z | 95% CI | ||
| Delta | |||||
| 1h-3h | -0.302 | 0.049 | -6.15 | [-0.398 -0.206] | |
| 3h-6h | -0.258 | 0.053 | -4.869 | [-0.361 -0.154] | |
| 6h-9h | -0.174 | 0.045 | -3.895 | [-0.261 -0.086] | |
| 9h-12h | -0.217 | 0.051 | -4.293 | [-0.316 -0.118] | |
| 12h-19h | -0.197 | 0.053 | -3.7 | [-0.302 -0.093] | |
| 19h-31h | -0.186 | 0.057 | -3.295 | 0.001 | [-0.297 -0.075] |
| Theta | |||||
| 1h-3h | -0.273 | 0.063 | -4.365 | [-0.396 -0.151] | |
| 3h-6h | -0.18 | 0.048 | -3.723 | [-0.274 -0.085] | |
| 6h-9h | -0.171 | 0.048 | -3.541 | [-0.266 -0.076] | |
| 9h-12h | -0.169 | 0.055 | -3.088 | 0.002 | [-0.276 -0.062] |
| 12h-19h | -0.179 | 0.051 | -3.49 | [-0.279 -0.078] | |
| 19h-31h | -0.132 | 0.057 | -2.341 | 0.019 | [-0.243 -0.022] |
| Alpha | |||||
| 1h-3h | -0.262 | 0.072 | -3.661 | [-0.402 -0.122] | |
| 3h-6h | -0.257 | 0.065 | -3.958 | [-0.384 -0.13] | |
| 6h-9h | -0.196 | 0.059 | -3.351 | 0.001 | [-0.311 -0.081] |
| 9h-12h | -0.19 | 0.073 | -2.615 | 0.009 | [-0.333 -0.048] |
| 12h-19h | -0.188 | 0.068 | -2.78 | 0.005 | [-0.32 -0.055] |
| 19h-31h | -0.1 | 0.069 | -1.441 | 0.15 | [-0.236 0.036] |
| Beta | |||||
| 1h-3h | -0.321 | 0.062 | -5.143 | [-0.443 -0.199] | |
| 3h-6h | -0.234 | 0.056 | -4.195 | [-0.343 -0.124] | |
| 6h-9h | -0.15 | 0.051 | -2.962 | 0.003 | [-0.25 -0.051] |
| 9h-12h | -0.222 | 0.053 | -4.197 | [-0.326 -0.118] | |
| 12h-19h | -0.193 | 0.05 | -3.83 | [-0.292 -0.094] | |
| 19h-31h | -0.229 | 0.059 | -3.917 | [-0.344 -0.114] | |
| Gamma | |||||
| 1h-3h | -0.181 | 0.037 | -4.846 | [-0.254 -0.108] | |
| 3h-6h | -0.154 | 0.043 | -3.547 | [-0.239 -0.069] | |
| 6h-9h | -0.184 | 0.041 | -4.531 | [-0.264 -0.105] | |
| 9h-12h | -0.2 | 0.043 | -4.665 | [-0.283 -0.116] | |
| 12h-19h | -0.199 | 0.045 | -4.377 | [-0.288 -0.11] | |
| 19h-31h | -0.215 | 0.051 | -4.183 | [-0.316 -0.114] |
S3 Diminished rhythms and seizure load
In the main paper we show than the diminished rhythms is consistent in time, without dependence on seizure timing. To provide further evidence that seizure load is not driving the result, we here show (figure S1 the correlation between seizure load and AUC. We found either no correlation or weak correlation between seizure load and AUC.
S4 Signal magnitude in the SOZ
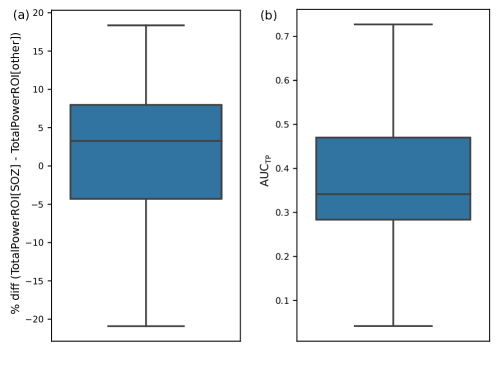
We wished to rule out the possibility that differences in the power of the signal between the SOZ and the rest of the tissue may be driving the diminished rhythms we see. To investigate this we have summed the raw band power values in all frequency bands and across time to obtain the overall signal power in each ROI (equation 2). Where is the number of samples, is a (T x nROI) matrix containing the power of the signal in the delta band, and TotalPowerROI is a vector containing the total power of the signal in each ROI. We then calculated an AUC with the in ROIs within the SOZ against the in ROIs not in the SOZ to get an .
| (2) |
| (3) |
We first tested whether the log of the overall signal power differed in pathological tissue (SOZ) compared to other tissue (Figure S2 a). In terms of percentage difference between pathological and other tissue, there was a wide spread across the cohort from -20% to +20%, and the median as approx +3% indicating little to no difference in overall signal power between tissue types on average. If at all, the pathological tissue may show elevated signal power across the cohort, possibly due to interictal spike or similar. We also tested if overall signal power distinguishes pathological tissue (SOZ) from other tissue using the (Figure S2 b). Over the cohort, again, there was a slight shift towards pathological tissue displaying higher overall signal power than other tissue, again, possibly due to interictal phenomena.
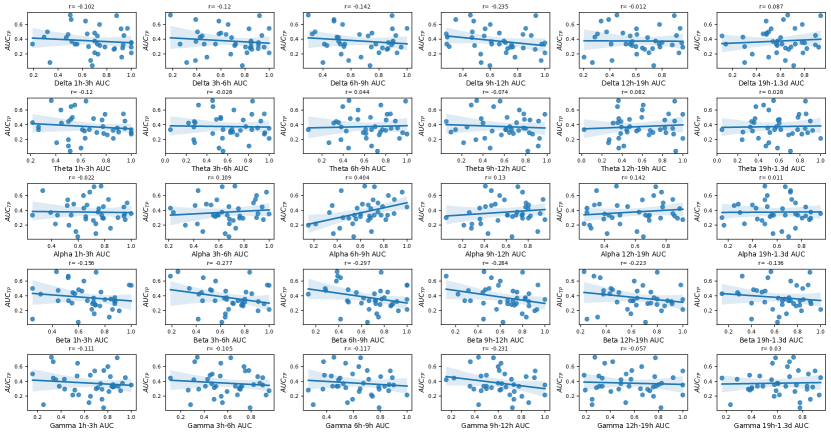
We then directly tested if correlated with the AUC values we obtained in the main results (using the relative band powers in each band). Our results show that this is not the case, most correlations are very weak (), and all correlations are (Figure S3). We conclude that the chronobiological rhythms seen in relative band power are not directly determined by overall signal magnitude, i.e. the reported effects are not simply due to a weaker EEG signal in pathological tissue.
S5 Cycles are also diminished in resected vs. spared tissue
In the main analyses of this paper we have used the seizure onset zone (SOZ) to indicate whether pathology is present in a region. An alternative marker is whether the tissue was resected during surgery. To assess whether chronobiological rhythms remained diminished when using a resection as a marker for pathology, we re-calculated AUC values for each rhythm and EEG band using this instead of SOZ, and present them above. For delta, theta, alpha, and beta, we find median AUC values above 0.5 for most rhythms - similar to the results using SOZ and indicating diminished rhythms in resected tissue. For gamma, we median AUC values around 0.5 - indicating no difference in the strength of the chronobiological rhythms between resected and spared tissue.
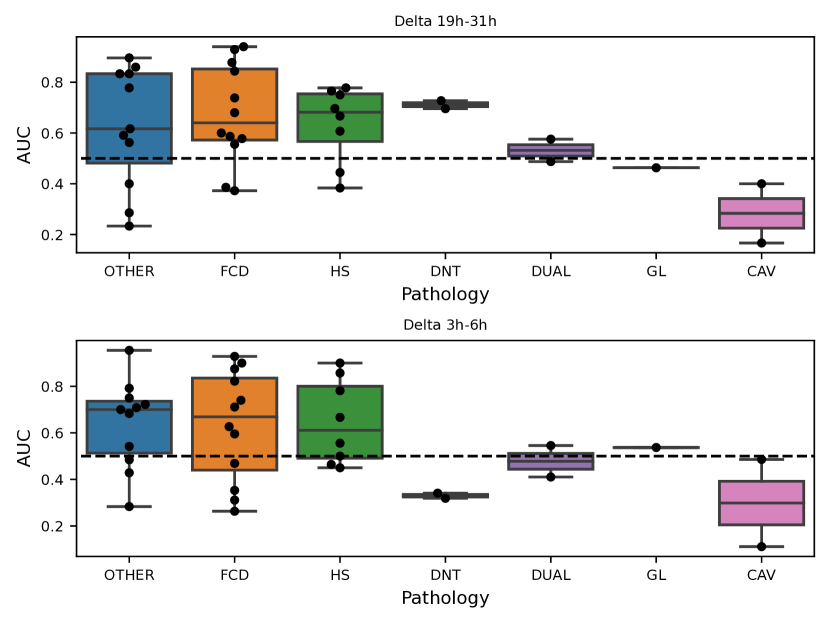
S6 Cycles are diminished in multiple types of pathology
Figure S5 shows the AUC of distinguishing pathological tissue from other tissue in terms of magnitude in the circadian and one example ultradian rhythm in relative delta band power. Our sample was too small to draw definitive conclusion on any individual pathology, but the most common pathologies of hippocampal sclerosis (HS) and focal cortical dysplasia (FCD) both demonstrate the diminished rhythmicity. Also most subjects show this effect, without sufficient evidence for an influence of pathology type.