Monitoring H Emission from the Wide-orbit Brown-dwarf Companion FU Tau B
Abstract
Monitoring mass accretion onto substellar objects provides insights into the geometry of the accretion flows. We use the Lulin One-meter Telescope to monitor H emission from FU Tau B, a 19 brown-dwarf companion at 57 (719 au) from the host star, for six consecutive nights. This is the longest continuous H monitoring for a substellar companion near the deuterium-burning limit. We aim to investigate if accretion near the planetary regime could be rotationally modulated as suggested by magnetospheric accretion models. We find tentative evidence that H mildly varies on hourly and daily timescales, though our sensitivity is not sufficient to definitively establish any rotational modulation. No burst-like events are detected, implying that accretion onto FU Tau B is overall stable during the time baseline and sampling windows over which it was observed. The primary star FU Tau A also exhibits H variations over timescales from minutes to days. This program highlights the potential of monitoring accretion onto substellar objects with small telescopes.
Unified Astronomy Thesaurus concepts: Accretion (14); Brown dwarfs (185); Stellar accretion (1578); Time series analysis (1916); Lomb–Scargle periodogram (1959)
in AJ
1 Introduction
Variability of mass accretion onto giant planets provides clues to their formation timescales and the geometry of the accretion flow. In magnetospheric accretion models (e.g., Königl 1991; Batygin 2018; Thanathibodee et al. 2019), mass inflow along the nearly pole-on magnetic field lines could form hot spots that corotate with the planet, making the shock-induced emission lines potentially variable over the rotation period. On the other hand, unsteady inflow and obscuration from the tilted or puffed inner disk could add stochastic bursts and dips to the rotational modulation (e.g., Bouvier et al. 1999; Cody et al. 2014). It is thus desirable to measure accretion variability on timescales relevant to these phenomena and mechanisms.
While there has been accretion monitoring for T Tauri stars (e.g., Nguyen et al. 2009; Biazzo et al. 2012; Pouilly et al. 2020; Sousa et al. 2021; Zsidi et al. 2022) and young isolated brown dwarfs (e.g., Natta et al. 2004; Scholz & Jayawardhana 2006; Stelzer et al. 2007; Herczeg et al. 2009), such efforts near the planetary regime have been rare. Among the dozens of young substellar companions and protoplanets discovered in direct-imaging surveys, very few of them have multiepoch accretion-rate measurements (e.g., GQ Lup B and GSC 06214–00210 B, Demars et al. 2023; PDS 70 b, Zhou et al. 2021). Moreover, many of these studies were carried out at different observatories, further complicating the interpretations. A monitoring program with identical instrumentation and data reduction is beneficial to measure the mean accretion rate and variability and reduce systematics. This is important to constrain the slope and scatter of the relationship between object mass and accretion rate in the substellar regime, which may reflect the formation mechanism for these wide companions. For instance, Stamatellos & Herczeg (2015) suggested that companions formed via disk fragmentation should tend to be more actively accreting than those formed in collapsing prestellar cores. Constraining mass accretion also helps estimate the dissipation timescale of circumsubstellar disks and therefore the growth timescale of these wide companions and their satellites (e.g., Benisty et al. 2021; Wu et al. 2022).
At optical wavelengths, the H emission at 6563 Å is arguably the best accretion tracer as it is the most prominent hydrogen recombination line—often brighter than the photosphere and the shock-induced continuum excess. Indeed, several young brown-dwarf companions and protoplanets have strong H emission indicative of active accretion (e.g., Zhou et al. 2014, 2021; Santamaría-Miranda et al. 2018; Wagner et al. 2018; Eriksson et al. 2020). Follow-up H monitoring opens the possibility of probing the variability amplitude and periodicity. As wide substellar companions are typically hundreds to thousands of au from their hosts, it is possible to resolve the widest pairs under moderate seeing without resorting to adaptive optics systems. Small telescopes can play an important and complementary role in monitoring accretion in these systems alongside large ground-based and space facilities.
Here we present our six-night H imaging of the FU Tau system with the Lulin One-meter Telescope (LOT) at Lulin Observatory in Taiwan. This is the longest continuous monitoring of an accretion-tracing emission line for a brown-dwarf companion. The primary star111The mass of FU Tau A can be sensitive to the adopted physical parameters. In Section 3.3.2, we show that it might be a low-mass star based on the revised parameters in Bowler et al. (2023). FU Tau A is actively accreting (Luhman et al., 2009; Stelzer et al., 2010, 2013; Rodríguez et al., 2017), and its disk was imaged with the Atacama Large Millimeter/submillimeter Array (ALMA) in 0.88 mm dust continuum (Wu et al., 2020). Bowler et al. (2023) recently determine a stellar inclination of based on sin km s-1 and the rotation period of 3.93 d derived from the observations of the Transiting Exoplanet Survey Satellite (TESS). The wide-orbit brown-dwarf companion FU Tau B, discovered by Luhman et al. (2009), is at 569 and a position angle of (Todorov et al., 2014) from the primary (projected separation of 719 au at a Gaia DR3 distance of pc; Bailer-Jones et al. 2021). Luhman et al. (2009) also detected its strong H emission (equivalent width 70 Å) and near-infrared excess, implying that FU Tau B also harbors an accretion disk. In Section 3.3.1, we estimate a mass of 19 for FU Tau B using the evolutionary models in Baraffe et al. (2015).
| UT Date | Exposure | aafootnotemark: | Average Seeing |
|---|---|---|---|
| 2021-12-04 | 600 s | 27 (22) | |
| 2021-12-05 | 300 s | 81 (72) | |
| 2021-12-06 | 300 s | 83 (73) | |
| 2021-12-07 | 300 s | 69 (60) | |
| 2021-12-08 | 300 s | 100 (90) | |
| 2021-12-09 | 300 s | 111 (96) |
2 Observations and Data Reduction
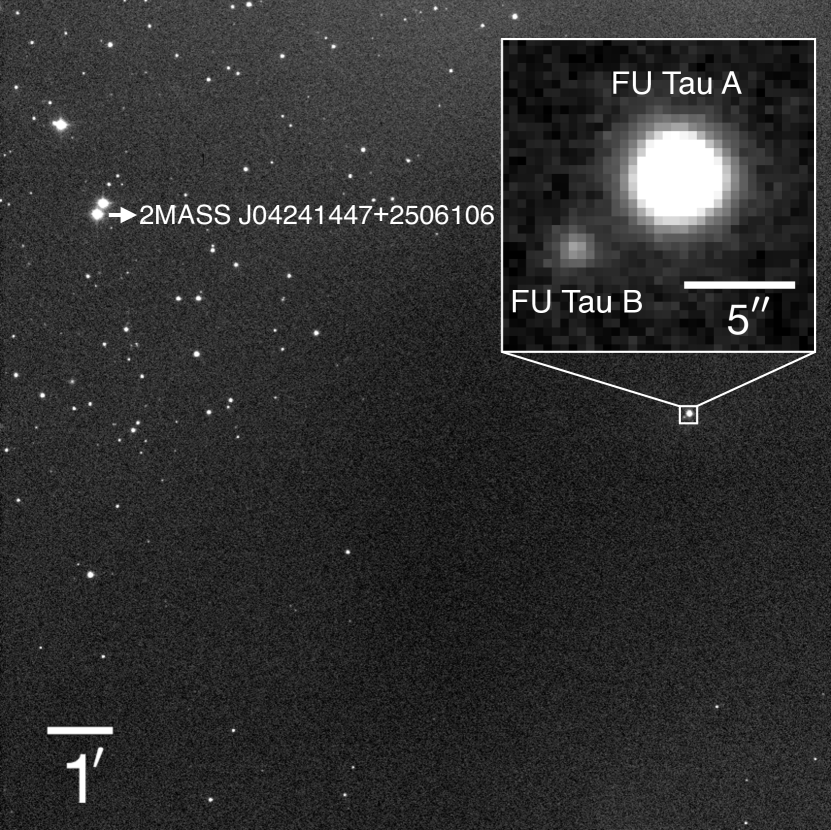
We monitored the FU Tau system at H with the LOT on UT 2021 December 4–9. The central wavelength and the effective width of the H filter are 6562.8 Å and 36.7 Å, respectively. The Lulin CCD camera has a pixel scale of and a field of view of . Figure 1 shows the typical field of our observations. The weather on these nights was photometric, with average seeing ranging from to . We kept imaging FU Tau as long as it was above the telescope elevation limit of 20. The integration time for individual frames is 600 s for the first night and 300 s for the subsequent nights. Table 1 summarizes our observations.
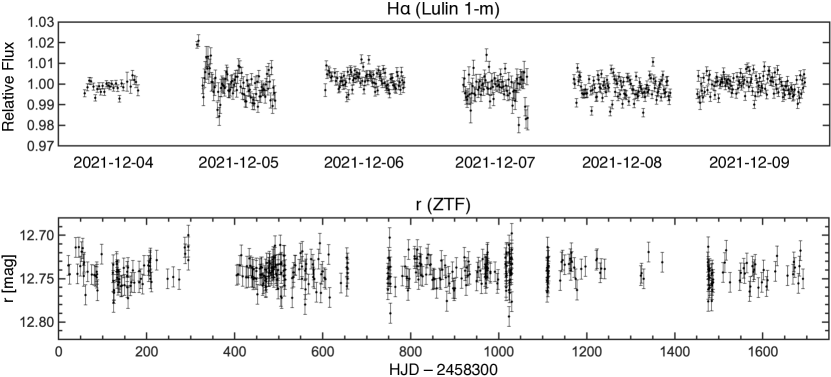
The raw data were dark subtracted, flat corrected, and cross correlated with respect to FU Tau A. As we did not observe a known optical standard star, we searched for a suitable H photometric reference from more than 30 field stars222The number of field stars involved in this iterative process is different each night (36, 32, 37, 37, 34, and 33) due to the slightly different telescope pointings. following the iterative approach in Radigan et al. (2012). In brief, for each reference star candidate, a corrected light curve was computed by dividing its raw light curve by a calibration curve, which was created by median-combining the normalized light curves of the other candidates. Stars with high standard deviations in their corrected light curves were discarded. We iterated the above process and found that 2MASS J042414472506106 (see Figure 1) was the most stable at H over six nights, with standard deviations of 0.3%, 0.7%, 0.4%, 0.6%, 0.5%, and 0.4%, respectively. The top panel of Figure 2 displays its calibrated H light curve. To further understand if it could be chromospherically active, we examined the 1670 day -band data from the Zwicky Transient Facility (ZTF; Bellm et al. 2019; Masci et al. 2019), as shown in the bottom panel of Figure 2. This long-term monitoring demonstrates that 2MASS J042414472506106 is likely stable. We thus measured H, the magnitude difference at H, between FU Tau A and 2MASS J042414472506106 in each frame and listed the results in Table 2.
| Date | ||
|---|---|---|
| 2459553.15508 | 1.900 | 0.005 |
| 2459553.16581 | 1.897 | 0.005 |
| 2459553.17281 | 1.897 | 0.005 |
| 2459558.34847 | 1.945 | 0.008 |
| Date | ||
|---|---|---|
| 2459553.16456 | 7.07 | 0.12 |
| 2459553.18894 | 6.92 | 0.08 |
| 2459553.21100 | 6.97 | 0.09 |
| 2459558.30415 | 6.98 | 0.14 |
To accurately measure the flux density of the companion, we need to remove the primary star. As there were no suitable stars to serve as a point spread function (PSF) template in our data, we subtracted the best-fit elliptical Moffat function derived with the Levenberg–Marquardt algorithm at the position of FU Tau A. To better bring out the companion and enhance the signal-to-noise ratios (S/Ns), we limited our analysis to data with elevations of 30 (the number of frames in parentheses in Table 1). We median combined these PSF-subtracted frames into 30 minutes bins for those taken on UT December 4, 5, 6, 8, 9, and 1 hr bins for data taken on UT December 7 due to poor seeing. Relative photometry between FU Tau B and 2MASS J042414472506106 is listed in Table 3.
3 Results
3.1 Variable H Emission from FU Tau A
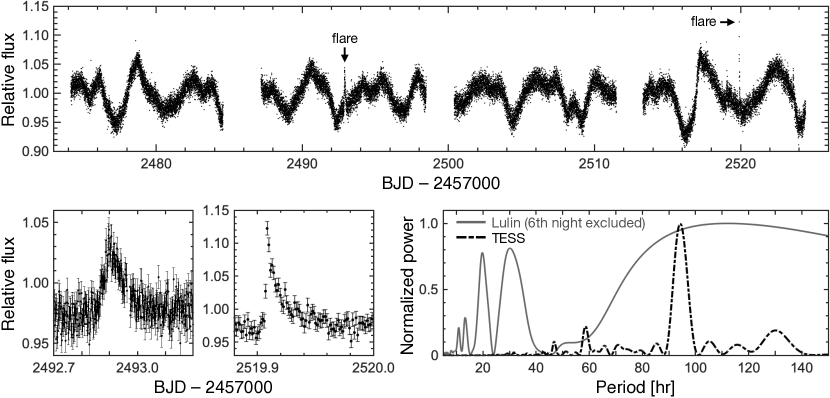
Figure 3 displays the H light curve of FU Tau A. On December 9, we detected a flare that rapidly brightened by about 0.5 mag in 50 minutes and gradually faded in the next 5 hr. We also search for flares in the TESS data by first dividing the original light curve into 1 day segments, from which we subtract a best-fit third-order polynomial and calculate the standard deviation of the residual curve. Flare candidates are selected as having at least three consecutive residual points greater than 3. We visually examine these candidates and identify two flares showing a characteristic rapid rise followed by an exponential decay (Figure 4). Both flares, however, have weaker amplitudes of 7% and 16% and shorter durations of 5 hr and 1.7 hr, respectively. This is consistent with the standard scenario where white-light flares are shorter than chromospheric H flares, reflecting different timescales between nonthermal and thermal heating (e.g., Neupert 1968). The TESS light curve clearly shows a periodic variation from which Bowler et al. (2023) derived a rotation period of 94.3 hr, consistent with the ground-based measurements in Scholz et al. (2012).
To further classify the light curve, we follow the approach in Cody et al. (2014) and Cody & Hillenbrand (2018) to calculate the and metrics. In brief, describes the asymmetry with respect to the mean and reflects the periodicity. We find and , suggesting that FU Tau A is quasiperiodic symmetric, similar to 26% of the Taurus young stars (Cody et al., 2022). In addition, Cody & Hillenbrand (2018) showed that quasiperiodic sources tend to have inclined disks with °. Although FU Tau A’s disk was not spatially resolved with ALMA (Wu et al., 2020), the tentative high disk inclination is in line with a high stellar inclination of discovered by Bowler et al. (2023).
The varying H light curve suggests that accretion onto FU Tau A is constantly changing on minute-to-hour timescales. There appears to be a multiday sinusoidal variation with an amplitude of 0.15 mag that hints a rotational modulation. In the lower-right panel of Figure 4, we compare the Lomb–Scargle periodograms (Lomb, 1976; Scargle, 1982) derived from the TESS and the Lulin data. For the latter, we only include the first five nights to ensure that the derived period is not affected by the prominent flare. The resulting Lulin periodogram has a broad peak that overlaps the rotation period of 94.3 hr, but the peak is also close to the duration of our monitoring. Future H monitoring that covers multiple rotation periods can examine if accretion onto FU Tau A is indeed rotationally modulated.
3.2 Variable H Emission from FU Tau B
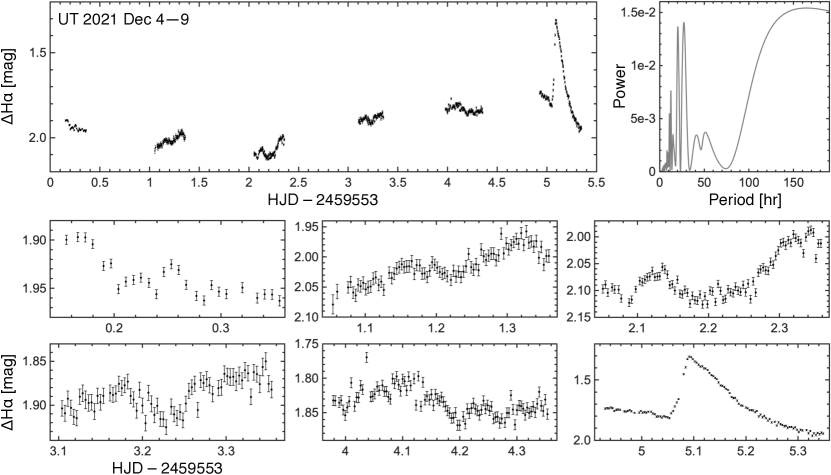
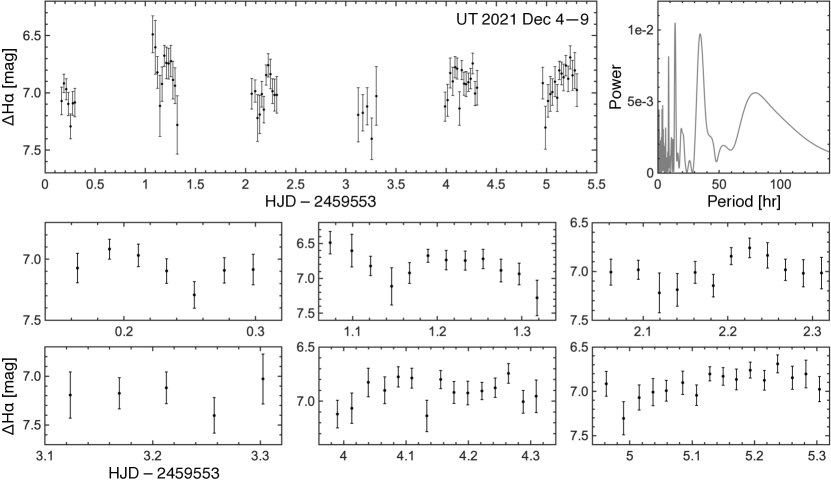
Figure 5 shows the H light curve of FU Tau B. Albeit with large uncertainties of 0.1–0.2 mag, our observations suggest that the H emission of FU Tau B may be variable on timescales of a few hours. There might be some sinusoidal variations in a number of nights, but it is not clear if there is any underlying periodicity that can be ascribed to the rotation period—the periodogram has similar power at around 9, 14, and 35 hr. Whether accretion onto FU Tau B is indeed rotationally modulated awaits more sensitive monitoring. We also note that no powerful accretion bursts or chromospheric flares are detected despite the fact that our monitoring potentially covers a timespan of multiple rotation periods.
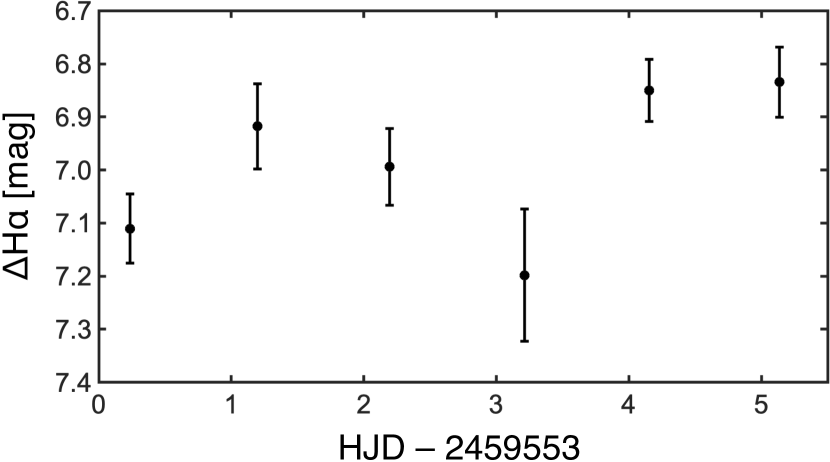
In Figure 6, we examine H variability on a daily timescale by merging all frames each night. Table 4 lists H and the uncertainties. FU Tau B appeared to be 0.3 mag brighter on December 8 and 9 than on December 4 and 7. Our observations hint a possible daily variation with a standard deviation of 0.15 mag. Overall, accretion onto FU Tau B seems to be largely stable with low-level hourly and daily variations, rather than drastically changing on short timescales.
3.3 Converting H Flux Density to an Accretion Rate
3.3.1 FU Tau B
While absolute calibration may be questionable due to the lack of optical standard stars, as 2MASS J042414472506106 appears stable to a 1% level at H, here we assume that all of its detected H comes from the photospheric continuum. We derive a spectral type of K7 by comparing its colors to Pecaut & Mamajek (2013), an effective temperature of 4100 K by fitting the synthetic spectra in Coelho (2014) to the 2MASS and Gaia photometry, and a flux density of erg s-1 cm-2 Å-1 at 6563 Å assuming negligible extinction.
Since FU Tau B is on average 7 mag fainter (Figure 5), we estimate a dereddened H flux density of erg s-1 cm-2 Å-1 assuming that FU Tau B shares the same extinction of as FU Tau A (Stelzer et al., 2013) and propagating all of the uncertainties in a Monte Carlo fashion. This is 20 times higher than the -band photometry in Luhman et al. (2009) and Quanz et al. (2010), so we remove 5% of the value above to account for the contribution from the adjacent continuum and yield erg s-1 cm-2 Å-1. This flux density corresponds to an H line luminosity of by multiplying it by the effective filter width of 36.7 Å and , where is the Gaia DR3 distance to FU Tau (see Section 1). Compared with other substellar companions near the deuterium-burning limit, FU Tau B has a similar to that of SR 12 c (; Santamaría-Miranda et al. 2019) and DH Tau B (; Zhou et al. 2014), but about 10–20 times weaker than that of GSC 06214–00210 B (; Zhou et al. 2014) and GQ Lup B (; Stolker et al. 2021). We also note that of FU Tau B is similar to that of the embedded giant plant PDS 70 b (; Zhou et al. 2021). Despite small number statistics, there is no clear correlation between and the masses and ages of these accreting companions.
As we have no information of the shock-induced UV/optical continuum, we cannot directly measure the accretion luminosity . As a result, we apply the – relationship in Aoyama et al. (2021) to estimate . We then follow Wu et al. (2020) and derive a bolometric luminosity of using the Gaia DR3 distance (see Section 1) and therefore a mass of by comparing with the model grids in Baraffe et al. (2015). Together with an effective temperature of 2400 K (Luhman et al., 2009) and a nominal uncertainty of 100 K, we estimate a radius of . Substituting these numbers and the accretion luminosity into the magnetospheric prescription, , in Gullbring et al. (1998), we calculate an accretion rate of yr-1 for FU Tau B. If considering the scatter in H (6.5 to 7.4 mag), the median value of the accretion rate is within the range of (4–9) yr-1. A value of – yr-1 has been commonly reported for young planetary-mass objects (e.g., Zhou et al. 2014; Haffert et al. 2019; Santamaría-Miranda et al. 2019; Eriksson et al. 2020). We caution that our accretion rate estimate is likely a lower limit because we have no information about the intrinsic H flux density from 2MASS J042414472506106 or there could be substantial reddening from the disk around FU Tau B (but see discussions of negligible dust extinction at H in Marleau et al. 2022).
| Date | ||
|---|---|---|
| 2459553.23612 | 7.11 | 0.07 |
| 2459554.19870 | 6.92 | 0.08 |
| 2459555.19387 | 6.99 | 0.07 |
| 2459556.21297 | 7.20 | 0.13 |
| 2459557.15304 | 6.85 | 0.06 |
| 2459558.13737 | 6.83 | 0.07 |
To understand whether the observed H from FU Tau B can be mostly chromospheric, we follow the empirical relationship for young brown dwarfs in Manara et al. (2013, 2017) to estimate the chromospheric contribution to the accretion luminosity as log . Substituting log and for FU Tau B, we find . Therefore, the observed H emission from FU Tau B likely originates from mass accretion. We also note that the observed H equivalent width of 70 Å (Luhman et al., 2009) is higher than that of accreting brown dwarfs in Natta et al. (2004) and also the M8.5 SSSPM J1102–3431 in Herczeg et al. (2009).
3.3.2 FU Tau A
Figure 3 shows that FU Tau A is on average 1.94 mag fainter than the reference star when excluding data of the sixth night. We hence derive an H flux density of erg s-1 cm-2 Å-1, about an order of magnitude higher than the -band photometry in Luhman et al. (2009), so we remove 10% of the value above to account for the contribution from the adjacent continuum and yield erg s-1 cm-2 Å-1. The H line luminosity is then . We then apply the – relationship in Rigliaco et al. (2012) to estimate .
To estimate the mass of FU Tau A, we adopt the revised bolometric luminosity of log in Bowler et al. (2023) and compare with the model grids in Baraffe et al. (2015). Our analysis favors a low system age of 1 Myr and a somewhat higher mass of than 0.05 in Luhman et al. (2009) and 0.08 in Stelzer et al. (2013). Together with a stellar radius of (Bowler et al., 2023), we estimate a mean accretion rate of yr-1. This value is similar to the previous measurements of yr-1 in Stelzer et al. (2010) and yr-1 in Stelzer et al. (2013), and is about 7 times higher than that of FU Tau B ( yr-1; Section 3.3.1).
4 Discussion
While magnetospheric accretion has been highly successful and observationally confirmed in the stellar regime (e.g., Gravity Collaboration et al. 2020), it remains unclear whether young planetary-mass objects (giant planets, free-floating planets, brown-dwarf companions, etc.) can have a strong magnetic field to truncate their disks and trigger magnetospheric accretion. Owen & Menou (2016) argued that if the field is weaker than 65 G, planetary accretion may follow the alternative boundary-layer accretion scheme (e.g., Szulágyi & Ercolano 2020; Takasao et al. 2021), where the circumsubstellar disk would directly touch the planetary surface and form a hot ring with a surface filling factor likely 10 times higher than that in magnetospheric accretion. Takasao et al. (2021) showed that in this case the line intensity could fluctuate due to the unstable accretion streams, but the line profile would be insensitive to planetary rotation. Therefore, detecting a periodically changing line profile could be a telltale sign of the magnetospheric models. For young stars and brown dwarfs, rotational modulation in the line profiles has been detected (e.g., Scholz & Jayawardhana 2006; Stelzer et al. 2007; Donati et al. 2008; Costigan et al. 2014; Alencar et al. 2018; Pouilly et al. 2020). Recently, Ringqvist et al. (2023) resolved the hydrogen lines for the 13 circumbinary companion Delorme 1 (AB)b, and they derived a filling factor of 1% for the line-emitting area, smaller than in boundary-layer accretion (see Takasao et al. 2021). Along with the asymmetric line profiles nicely fit with multiple velocity shifts and widths, these features are consistent with the magnetospheric accretion models. A 1% filling factor has also been inferred for the two 10–30 wide companions GQ Lup B and GSC 06214–00210 B (Demars et al., 2023).
Accretion onto brown dwarfs can be variable on different timescales (e.g., Natta et al. 2004; Scholz & Jayawardhana 2006; Stelzer et al. 2007), sometimes with amplitudes varying by orders of magnitude (e.g., Nguyen-Thanh et al. 2020). Existing H observations for companions near the planet-brown-dwarf boundary, though mostly sparsely sampled and with large uncertainties, seem to find low-level variations. For Delorme 1 (AB)b, Eriksson et al. (2020) found that the H line luminosities remained stable within 1–2 ( 30–40%) over 2.5 hr. For PDS 70 b, Zhou et al. (2021) showed that their six-epoch HST H photometry ( 20%) was consistent within 3 with previous adaptive optics measurements (Wagner et al., 2018; Haffert et al., 2019; Hashimoto et al., 2020). While our LOT monitoring of FU Tau B lacks a sufficient sensitivity to reveal any rotational modulation, we see no large-amplitude H variations for six nights of consecutive observations, implying that accretion onto FU Tau B may be relatively stable on timescales of hours to days.
Nonetheless, accretion variability has been found to increase on longer timescales for young stars (e.g., Nguyen et al. 2009; Mendigutía et al. 2011; Pogodin et al. 2012; Costigan et al. 2014; Zsidi et al. 2022), brown dwarfs (e.g., Stelzer et al. 2007), and even for substellar companions (Demars et al., 2023). Stelzer et al. (2007) found that accretion onto the 20–30 brown dwarf 2MASS J12073346–3932539 mildly varied between and yr-1 (a factor of two) for two consecutive nights, but changed by at least a factor of 10 on monthly to yearly timescales. Wolff et al. (2017) also found that the equivalent width of the 1.282 µm Pa emission from the 10–15 DH Tau B could vary by a factor of a few in weeks. Recently, Demars et al. (2023) show that the variability amplitude of the Pa line stays low (50%) on hourly timescales but becomes significant (100% and up to 1000%) on monthly to yearly timescales for GQ Lup B and GSC 06214–00210 B. To examine if FU Tau B exhibits the same feature, we follow Demars et al. (2023) to calculate the flux variation as (fluxfluxmin)/fluxmin for each individual pair of measurements in Table 3, where fluxmax and fluxmin are the higher and the lower values of each pair, respectively. Due to our large photometric uncertainties, however, we find a similar flux variations of 10%–20% (median) from hourly to daily timescales. Multiepoch H monitoring is essential to reveal if the variability amplitude would be larger on longer timescales for FU Tau B and more substellar companions. On the other hand, Claes et al. (2022) find that accretion variability estimated with UV continuum excess can be 1 dex higher than that with emission line luminosity. It would be illuminating to carry out extensive UV monitoring to ascertain the true variability. Finally, long-term monitoring over several Keplerian timescales of the inner circumsubstellar disk would constrain the frequency of bursts and dips, offering insights into the structures of the disk as well as the accretion funnels.
Acknowledgements
We thank the anonymous reviewer for the very constructive comments. Y.-L.W. acknowledges the support from the National Science and Technology Council (grant 111-2636-M-003-001) and the Ministry of Education. This publication has made use of data collected at Lulin Observatory, partly supported by NSTC grant 109-2112-M-008-001. B.P.B. acknowledges support from the National Science Foundation grant AST-1909209, NASA Exoplanet Research Program grant 20-XRP202-0119, and the Alfred P. Sloan Foundation. This research has made use of the NASA/IPAC Infrared Science Archive, which is funded by the National Aeronautics and Space Administration and operated by the California Institute of Technology. The corresponding DOI for the Zwicky Transient Facility Image Service is:https://doi.org/10.26131/irsa539 (catalog 10.26131/irsa539). Funding for the TESS mission is provided by NASA’s Science Mission directorate. This paper includes data collected by the TESS mission, which are publicly available from the Mikulski Archive for Space Telescopes (MAST)https://doi.org/10.17909/aq6f-df31 (catalog 10.17909/aq6f-df31). Finally, this research has made use of MATLAB R2020b.
References
- Alencar et al. (2018) Alencar, S. H. P., Bouvier, J., Donati, J.-F., et al. 2018, A&A, 620, A195
- Aoyama et al. (2021) Aoyama, Y., Marleau, G.-D., Ikoma, M., et al. 2021, ApJ, 917, L30
- Bailer-Jones et al. (2021) Bailer-Jones, C. A. L., Rybizki, J., Fouesneau, M., et al. 2021, AJ, 161, 147
- Baraffe et al. (2015) Baraffe, I., Homeier, D., Allard, F., et al. 2015, A&A, 577, A42
- Barnard et al. (1927) Barnard, E. E., Frost, E. B., & Calvert, M. R. 1927, [Washington] Carnegie institution of Washington, 1927.
- Batygin (2018) Batygin, K. 2018, AJ, 155, 178
- Bellm et al. (2019) Bellm, E. C., Kulkarni, S. R., Graham, M. J., et al. 2019, PASP, 131, 018002
- Benisty et al. (2021) Benisty, M., Bae, J., Facchini, S., et al. 2021, ApJ, 916, L2
- Biazzo et al. (2012) Biazzo, K., Alcalá, J. M., Covino, E., et al. 2012, A&A, 547, A104
- Bouvier et al. (1999) Bouvier, J., Chelli, A., Allain, S., et al. 1999, A&A, 349, 619
- Bowler et al. (2023) Bowler, B. P., Tran, Q. H., Zhang, Z., et al. 2023, AJ, 165, 164
- Claes et al. (2022) Claes, R. A. B., Manara, C. F., Garcia-Lopez, R., et al. 2022, A&A, 664, L7
- Cody & Hillenbrand (2018) Cody, A. M. & Hillenbrand, L. A. 2018, AJ, 156, 71
- Cody et al. (2022) Cody, A. M., Hillenbrand, L. A., & Rebull, L. M. 2022, AJ, 163, 212
- Cody et al. (2014) Cody, A. M., Stauffer, J., Baglin, A., et al. 2014, AJ, 147, 82
- Coelho (2014) Coelho, P. R. T. 2014, MNRAS, 440, 1027
- Costigan et al. (2014) Costigan, G., Vink, J. S., Scholz, A., et al. 2014, MNRAS, 440, 3444
- Demars et al. (2023) Demars, D., Bonnefoy, M., Dougados, C., et al. 2023, arXiv:2305.09460
- Donati et al. (2008) Donati, J.-F., Jardine, M. M., Gregory, S. G., et al. 2008, MNRAS, 386, 1234
- Eriksson et al. (2020) Eriksson, S. C., Asensio Torres, R., Janson, M., et al. 2020, A&A, 638, L6
- Gravity Collaboration et al. (2020) Gravity Collaboration, Garcia Lopez, R., Natta, A., et al. 2020, Nature, 584, 547
- Gullbring et al. (1998) Gullbring, E., Hartmann, L., Briceño, C., et al. 1998, ApJ, 492, 323
- Haffert et al. (2019) Haffert, S. Y., Bohn, A. J., de Boer, J., et al. 2019, NatAs, 3, 749
- Hashimoto et al. (2020) Hashimoto, J., Aoyama, Y., Konishi, M., et al. 2020, AJ, 159, 222
- Herczeg et al. (2009) Herczeg, G. J., Cruz, K. L., & Hillenbrand, L. A. 2009, ApJ, 696, 1589
- Königl (1991) Königl, A. 1991, ApJ, 370, L39
- Lomb (1976) Lomb, N. R. 1976, Ap&SS, 39, 447
- Luhman et al. (2009) Luhman, K. L., Mamajek, E. E., Allen, P. R., et al. 2009, ApJ, 691, 1265
- Manara et al. (2017) Manara, C. F., Frasca, A., Alcalá, J. M., et al. 2017, A&A, 605, A86
- Manara et al. (2013) Manara, C. F., Testi, L., Rigliaco, E., et al. 2013, A&A, 551, A107
- Marleau et al. (2022) Marleau, G.-D., Aoyama, Y., Kuiper, R., et al. 2022, A&A, 657, A38
- Masci et al. (2019) Masci, F. J., Laher, R. R., Rusholme, B., et al. 2019, PASP, 131, 018003
- Mendigutía et al. (2011) Mendigutía, I., Calvet, N., Montesinos, B., et al. 2011, A&A, 535, A99
- Natta et al. (2004) Natta, A., Testi, L., Muzerolle, J., et al. 2004, A&A, 424, 603
- Neupert (1968) Neupert, W. M. 1968, ApJ, 153, L59
- Nguyen et al. (2009) Nguyen, D. C., Scholz, A., van Kerkwijk, M. H., et al. 2009, ApJ, 694, L153
- Nguyen-Thanh et al. (2020) Nguyen-Thanh, D., Phan-Bao, N., Murphy, S. J., et al. 2020, A&A, 634, A128
- Owen & Menou (2016) Owen, J. E. & Menou, K. 2016, ApJ, 819, L14
- Pecaut & Mamajek (2013) Pecaut, M. J. & Mamajek, E. E. 2013, ApJS, 208, 9
- Pogodin et al. (2012) Pogodin, M. A., Hubrig, S., Yudin, R. V., et al. 2012, Astronomische Nachrichten, 333, 594
- Pouilly et al. (2020) Pouilly, K., Bouvier, J., Alecian, E., et al. 2020, A&A, 642, A99
- Quanz et al. (2010) Quanz, S. P., Goldman, B., Henning, T., et al. 2010, ApJ, 708, 770
- Radigan et al. (2012) Radigan, J., Jayawardhana, R., Lafrenière, D., et al. 2012, ApJ, 750, 105
- Rigliaco et al. (2012) Rigliaco, E., Natta, A., Testi, L., et al. 2012, A&A, 548, A56
- Ringqvist et al. (2023) Ringqvist, S. C., Viswanath, G., Aoyama, Y., et al. 2023, A&A, 669, L12
- Rodríguez et al. (2017) Rodríguez, L. F., Zapata, L. A., & Palau, A. 2017, AJ, 153, 209
- Santamaría-Miranda et al. (2018) Santamaría-Miranda, A., Cáceres, C., Schreiber, M. R., et al. 2018, MNRAS, 475, 2994
- Santamaría-Miranda et al. (2019) Santamaría-Miranda, A., Cáceres, C., Schreiber, M. R., et al. 2019, MNRAS, 488, 5852
- Scargle (1982) Scargle, J. D. 1982, ApJ, 263, 835
- Scholz & Jayawardhana (2006) Scholz, A. & Jayawardhana, R. 2006, ApJ, 638, 1056
- Scholz et al. (2012) Scholz, A., Stelzer, B., Costigan, G., et al. 2012, MNRAS, 419, 1271
- Sousa et al. (2021) Sousa, A. P., Bouvier, J., Alencar, S. H. P., et al. 2021, A&A, 649, A68
- Stamatellos & Herczeg (2015) Stamatellos, D. & Herczeg, G. J. 2015, MNRAS, 449, 3432
- Stelzer et al. (2013) Stelzer, B., Alcalá, J. M., Scholz, A., et al. 2013, A&A, 551, A106
- Stelzer et al. (2010) Stelzer, B., Scholz, A., Argiroffi, C., et al. 2010, MNRAS, 408, 1095
- Stelzer et al. (2007) Stelzer, B., Scholz, A., & Jayawardhana, R. 2007, ApJ, 671, 842
- Stolker et al. (2021) Stolker, T., Haffert, S. Y., Kesseli, A. Y., et al. 2021, AJ, 162, 286
- Szulágyi & Ercolano (2020) Szulágyi, J. & Ercolano, B. 2020, ApJ, 902, 126
- Takasao et al. (2021) Takasao, S., Aoyama, Y., & Ikoma, M. 2021, ApJ, 921, 10
- Thanathibodee et al. (2019) Thanathibodee, T., Calvet, N., Bae, J., et al. 2019, ApJ, 885, 94
- Todorov et al. (2014) Todorov, K. O., Luhman, K. L., Konopacky, Q. M., et al. 2014, ApJ, 788, 40
- Wagner et al. (2018) Wagner, K., Follete, K. B., Close, L. M., et al. 2018, ApJ, 863, L8
- Wolff et al. (2017) Wolff, S. G., Ménard, F., Caceres, C., et al. 2017, AJ, 154, 26
- Wu et al. (2020) Wu, Y.-L., Bowler, B. P., Sheehan, P. D., et al. 2020, AJ, 159, 229
- Wu et al. (2022) Wu, Y.-L., Bowler, B. P., Sheehan, P. D., et al. 2022, ApJ, 930, L3
- Zhou et al. (2021) Zhou, Y., Bowler, B. P., Wagner, K. R., et al. 2021, AJ, 161, 244
- Zhou et al. (2014) Zhou, Y., Herczeg, G. J., Kraus, A. L., et al. 2014, ApJ, 783, L17
- Zsidi et al. (2022) Zsidi, G., Manara, C. F., Kóspál, Á., et al. 2022, A&A, 660, A108