Sensitivity, Performance, Robustness:
Deconstructing the Effect of Sociodemographic Prompting
Abstract
Annotators’ sociodemographic backgrounds (i.e., the individual compositions of their gender, age, educational background, etc.) have a strong impact on their decisions when working on subjective NLP tasks, such as toxic language detection. Often, heterogeneous backgrounds result in high disagreements. To model this variation, recent work has explored sociodemographic prompting, a technique, which steers the output of prompt-based models towards answers that humans with specific sociodemographic profiles would give. However, the available NLP literature disagrees on the efficacy of this technique — it remains unclear for which tasks and scenarios it can help, and the role of the individual factors in sociodemographic prompting is still unexplored. We address this research gap by presenting the largest and most comprehensive study of sociodemographic prompting today. We analyze its influence on model sensitivity, performance and robustness across seven datasets and six instruction-tuned model families. We show that sociodemographic information affects model predictions and can be beneficial for improving zero-shot learning in subjective NLP tasks. However, its outcomes largely vary for different model types, sizes, and datasets, and are subject to large variance with regards to prompt formulations. Most importantly, our results show that sociodemographic prompting should be used with care for sensitive applications, such as toxicity annotation or when studying LLM alignment.111Code and data: https://github.com/UKPLab/arxiv2023-sociodemographic-prompting
1 Introduction
How messages are perceived, is often not only dependent on their factual content, but also on the receiver’s subjective interpretation: for instance, two dataset annotators might have different equally valid opinions about what the “correct” offensiveness label for a particular tweet should be (e.g., Waseem, 2016; Davani et al., 2023, inter alia). As previously shown, this variation is, at least to some extent, tied to sociodemographic characteristics of the receivers, like their gender identity, age, and educational background (e.g., Sap et al., 2022; Biester et al., 2022; Pei and Jurgens, 2023).
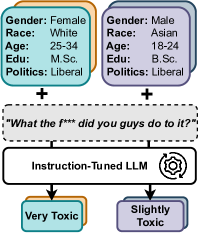
Thus, NLP models need to account for a comprehensive set of sociodemographic factors to make more socially-aware predictions. Accordingly, modeling the effect of those factors on subjective tasks has emerged as an important research direction for NLP. As such, researchers have proposed new data collection paradigms – cf. perspectivism (Rottger et al., 2022) – and trained models for reflecting the decisions of particular sociodemographic groups (Gupta et al., 2023; Fleisig et al., 2023). Most recently, researchers (Deshpande et al., 2023; Santurkar et al., 2023; Hwang et al., 2023; Cheng et al., 2023) have explored sociodemographic prompting of large language models (LLMs): the idea is to enrich a particular input prompt with additional sociodemographic information (cf. Figure 1). The models’ output should then be aligned with the population described. This technique has led to promising applications in dataset augmentation (Hartvigsen et al., 2022) and simulation of social computing platforms (Park et al., 2022). Still, our knowledge on the effect of including sociodemographic profiles is scarce and the existing literature disagrees on its usefulness: for instance, Argyle et al. (2023) showed that sociodemographic prompting can be used to simulate human populations – a promise for more efficient sociological surveys. Other work, in turn, points to the danger of stereotypical bias reflected when prompting models with sociodemographic profiles (Cheng et al., 2023; Deshpande et al., 2023).
Our work makes an important step towards a better understanding of the influence of sociodemographic prompting on models’ decisions. We use subjective NLP tasks for evaluation as they have been shown to induce disagreement among annotators related to sociodemographic factors. Our study analyzes the effects of sociodemographic prompting on model output (sensitivity), zero-shot performance, and robustness. Concretely, we make the following contributions:
-
•
We present the largest and most comprehensive study on sociodemographic prompting to-date. Concretely, we test the effect of instructing 17 LLMs (covering various model types, e.g., InstructGPT, Flan-T5, etc.) with sociodemographic profiles in a controlled setting which comprises seven datasets reflecting four different subjective NLP classification tasks (sentiment analysis, hatespeech detection, toxicity detection, and stance detection).
-
•
We demonstrate (§5) that sociodemographic prompting leads to surprisingly large amounts of prediction changes (up to 80%), with large variance across model types and sizes.
-
•
Our findings (§6) indicate that sociodemographic prompting helps both to classify annotator-specific decisions and in zero-shot learning with performance improvements up to +8pp in accuracy.
-
•
We show (§7) that sociodemographic prompting is not robust, with large variance due to prompt formulation and model choice.
Overall, our results provide important insights for future research on sociodemographic prompting, and, in particular, when applying sociodemographic prompting in sensitive scenarios, for instance, in the context of sensitive data annotation or when studying LLM alignment.
2 Related Work
The sociodemographic background of annotators has been identified as an influential factor in text annotation for subjective NLP tasks (Luo et al., 2020; Sap et al., 2022; Biester et al., 2022; Pei and Jurgens, 2023; Santy et al., 2023). Consequently, researchers started to integrate such information into NLP models to enable more socially aware predictions (Kumar et al., 2021; Gordon et al., 2022; Gupta et al., 2023; Fleisig et al., 2023; Wan et al., 2023).
With the increasing performance of LLMs, researchers investigated to what extent they are influenced when prompted with sociodemographic information. Lee et al. (2023) examine whether instruction-tuned LLMs accurately reflect or conform to human disagreements but limit their experiments to a single NLI dataset. They conclude that models deviate from human annotators in terms of accuracy and disagreement level. By analyzing disagreement for Q&A, Hwang et al. (2023) find that users’ opinions and their sociodemographic background are not mutual predictors. For predicting individual opinions, they show that combining sociodemographic information and relevant past opinions performs best. Several works (Durmus et al., 2023; Santurkar et al., 2023; Santy et al., 2023) analyze LLM’s alignment with specific sociodemographic groups and show that model responses are biased towards responses by participants from Western countries. Notably, Santurkar et al. (2023) observe that misalignment persists even after explicitly steering the LMs towards particular demographic groups. Argyle et al. (2023) suggest using GPT-3 as testbed before conducting large-scale population surveys. They propose algorithmic fidelity to evaluate alignment with different human subpopulations and present it as a cost-efficient proxy for specific human sub-populations in social science research. Finally, it has been shown (Cheng et al., 2023; Deshpande et al., 2023; Ungless et al., 2023; Attanasio et al., 2023) that prompting large models with sociodemographic information is prone to amplify existing stereotypical biases (cf. Blodgett et al., 2020; Barikeri et al., 2021).
In contrast to studying LLM alignment, our work extends previous work showing that integrating sociodemographic information in a supervised manner is helpful to improve annotator-specific predictions (Gupta et al., 2023; Fleisig et al., 2023). We use sociodemographic prompting because it allows to diversify model predictions without the need for privacy-concerning data collection of annotators’ sociodemographic information. Beyond our objective, our results offer important insights into influential factors for sociodemographic prompting in general.
3 Sociodemographic Prompting
Throughout this work, we prompt a language model with (or without) sociodemographic information for obtaining predictions for the classification tasks we study. In the following, we discuss the main concepts our methodology relies on.
| Attribute | Values (Percentage share) |
|---|---|
| Gender | male (52%), female (47%), nonbinary (<1%) |
| Race | White (77%), Black or African American (13%), Asian (6%), Hispanic (3%), Native Hawaiian or Pacific Islander (1%), American Indian or Alaska Native (<1%) |
| Age | Under 18 (<1%), 18 - 24 (11%), 25 - 34 (40%), 35 - 44 (25%), 45 - 54 (13%), 55 - 64 (8%), 65 or older (3%) |
| Education | Less than high school degree (1%), High school graduate (9%), Some college but no degree (19%), Associate degree in college (2-year) (11%), Bachelors degree in college (4-year) (42%), Masters degree (16%), Professional degree (JD, MD) (2%), Doctoral degree (1%) |
| Political Affiliation | Liberal (43%), Conservative (29%), Independent (28%) |
Prompting.
Prompting refers to the act of providing an initial input or cue to a language model, guiding its subsequent output generation. LLMs rely on these prompts to produce contextually relevant and coherent responses.
Sociodemographic Information.
Sociodemographic information encompasses data related to the social and demographic characteristics of individuals or groups. Providing sociodemographic cues via prompting has been shown to influence LLM’s responses (Durmus et al., 2023; Hwang et al., 2023) through leveraging the sociodemographic knowledge encoded in the models (Lauscher et al., 2022a). The promise is that the output will be tailored to a specific demographic or social group. The present analysis encompasses five distinct sociodemographic attributes, based on the datasets we employ: gender, race, age range, education level, and political affiliation, as detailed in Table 1. In Figure 2, we provide an example of a sociodemographic prompt.
Given a text, how would a person of gender ’Female’, race ’White’, age ’25 - 34’, education level ’Master’s degree’ and political affiliation ’Liberal’ rate the degree of toxicity in the text. Possible values are ’not toxic’, ’slightly toxic’, ’moderately toxic’, ’very toxic’ or ’extremely toxic’. Text: ’Well when you have a welfare state that propagates an underclass of unskilled parasites’ Toxicity:
Obtaining Predictions.
Our strategy for answer generation differs between closed-source LLMs and open-source alternatives. For open-source models, we follow existing work (Brown et al., 2020; Ye et al., 2023) and prompt the model independently for each possible label by appending the potential answer to the prompt. Then, we evaluate the likelihood associated with each option and select the one with the highest likelihood. In scenarios requiring binary classification, we assign semantically coherent descriptors to each label, e.g., “Yes” or “No” in lieu of 0 or 1 for binary hate speech detection. For closed-source models, we post-process the model output and map it to the predefined label space, to reduce the number of required API calls. In the few cases where this approach fails, we assign it manually.
4 Overall Experimental Setup
4.1 Tasks and Datasets
| Task | Dataset | Labels | IAA |
|---|---|---|---|
| Toxicity | DP | not toxic (52%), slightly toxic (19%), moderately toxic (14%), very toxic (9%), extremely toxic (6%) | 0.13 |
| Jigsaw | yes (67%), no (33%) | 0.46 | |
| Hatespeech | GHC | yes (87%), no (13%) | 0.25 |
| H-Twitter | neither (79%), sexism (17%), racism (3%), both(1%) | 0.59 | |
| Stance | SE2016 | against (55%), none (23%), favor (22%) | 0.58 |
| GWSD | agree (38%), neutral (44%), disagree (18%) | 0.33 | |
| Sentiment | Diaz | very positive (9%), somewhat positive (24%), neutral (41%), somewhat negative (21%), very negative (5%) | 0.11 |
We select seven datasets for four subjective tasks (toxicity detection, stance detection, hatespeech detection, and sentiment classification) to study sociodemographic prompting across a large and diverse benchmark (cf. Table 2, Appendix A.1). Human annotations for those tasks have been shown to be influenced by sociodemographic factors. Some datasets have been specifically proposed for tuning NLP systems, others have been published to analyze annotator disagreement, which explains the variability in IAA.
We have access to the original, un-aggregated annotations for each dataset. To analyze the effect of sociodemographic prompting we additionally require sociodemographic profiles. For two of the datasets (DP, Diaz) we have access to this information and adhere to the original sociodemographic details for prompting. For the remaining five datasets, we adopt the sociodemographic profiles of the annotators of the toxicity dataset DP as a replacement, as done by Wan et al. (2023). In particular, each example gets a set of five profiles, of which each is a composition of different sociodemographic attribute values.
For all datasets, we removed instances with incomplete or unknown information (details in Appendix A.1). Due to the large number of experiments and varying dataset sizes, we randomly sample 1,000 instances from each dataset. Our sampling strategy leads to a similar distribution across the different sociodemographic attributes, as we demonstrate in Appendix A.2. In the following, we describe the individual datasets.
Toxicity.
The task is to decide whether or to what degree (e.g., slightly toxic) a text is toxic. We utilize Diverse Perspectives (DP) by Kumar et al. (2021), and Jigsaw (Goyal et al., 2022).
DP comprises comments from various online forums (e.g., 4chan, Reddit). These comments underwent annotation via Amazon Mechanical Turk, receiving five annotations per instance. For each annotator, the sociodemographic data was gathered. The dataset did not come equipped with a definitive gold label. Thus, we use majority voting to determine the gold label.
Jigsaw encapsulates comments from news articles, originally collated by the Civil Comments platform and subsequently annotated for toxicity indicators. The binary gold label for this dataset was derived by classifying comments as toxic if a majority of annotators identified them as such.
Stance.
Stance detection, pertains to discerning an author’s viewpoint towards a specific topic (Küçük and Can, 2020; Beck et al., 2021; Lauscher et al., 2022b). As shown by Balahur et al. (2010) and Luo et al. (2020), annotators’ decisions are influenced by their sociodemographic background. We employ the SemEval 2016 Task 6 dataset (SE2016; Mohammad et al., 2016) and the Global Warming Stance Detection (GWSD) dataset (Luo et al., 2020).
SE2016 encompasses 3,591 annotated Twitter posts that address a range of contentious subjects. The gold labels were ascertained using majority voting. Instances exhibiting less than 60% consensus among annotators were excluded by the authors.
GWSD consists of 2,050 annotated U.S. news articles and was curated to analyze the framing of opinions within the discourse on global warming. To determine the gold label for each article, the authors employed a model tailored to the distribution of annotations, which also factored in potential biases of the annotators.
Hatespeech.
Hatespeech detection is a task designed to tackle the increasing amount of hateful online communication. We use the Gabe Hate Corpus (GHC) by Kennedy et al. (2022) and the Twitter Hatespeech Corpus (H-Twitter; Waseem, 2016).
GHC was sourced from the social network service gab.com and annotated in a multi-label fashion for Human Degradation, Calls For Violence and Vulgar/Offensive. The authors obtained gold labels using majority voting. As we are comparing multi-class tasks, we binarized the annotations into hatespeech indicators (i.e., Yes and No).
H-Twitter was annotated by CrowdFlower workers for sexism, racism, neither, or both. Expert annotators contributed the gold labels.
Sentiment.
The task is to decide upon the sentiment conveyed in the text. We use the dataset by Diaz et al. (2018), which we call Diaz, created for studying age-related bias in sentiment analysis.
4.2 Models
We seek to instruct models to mimic an annotator with a specific sociodemographic profile. Thus, we resort to the most natural choice, instruction-tuned models. We aim to cover a broad collection of models, both from industrial and academic research and fine-tuned using different instruction-tuning datasets. If possible, we chose model families with several model sizes published. Concretely, we use GPT-3 (Brown et al., 2020), T5 (Raffel et al., 2020), OPT (Zhang et al., 2022), and Pythia (Biderman et al., 2023) model variants. We present a comprehensive overview of all models in Appendix A.3.
GPT-3.
We use InstructGPT (Ouyang et al., 2022) which was fine-tuned using reinforcement learning from human feedback (RLHF).
T5.
We further use Flan-T5 (Chung et al., 2022), Flan-UL2 (Tay et al., 2023) and Tk-Instruct (Wang et al., 2022). Flan-T5 was trained over a collection of 1,836 finetuning tasks. Flan-UL2 uses the same instruction-tuning procedure but is built on top of a language model which was trained following the Unifying Language Learning Paradigm (UL2) pretraining framework. Flan-T5 (Tk-Instruct ) were trained using large benchmark of 1,836 (1,616) NLP tasks and their natural language instructions.
OPT.
We employ OPT-IML (Iyer et al., 2022) which was fine-tuned using an aggregation of eight instruction-tuning datasets comprising 1,991 tasks.
Pythia.
We use Dolly-V2 which is fine-tuned on a 15K instruction corpus222https://tinyurl.com/databricks-dolly covering seven task categories.
4.3 Evaluation
For subjective NLP tasks (Ovesdotter Alm, 2011), comparing aggregated annotations with model predictions provides only a limited view on the performance as label aggregation obscures any disagreement in the data (Prabhakaran et al., 2021; Basile et al., 2021). Thus, we follow Uma et al. (2021) and evaluate our results using both hard-label evaluation (accuracy, macro-averaged F1) and soft-label evaluation (cross-entropy, Jensen-Shannon divergence). In case of hard-label evaluation, we aggregate all predictions obtained via sociodemographic prompting using majority voting. To test for statistical significance of our results, we use generalized linear mixed models (GLMMs) to account for potential confounders and statistical dependencies in our data by jointly modeling numerous main effects (e.g., the impact of model family) and interaction effects (e.g., the joint impact of model family and prompting method). We report further details about our experiments (§A.4) and the statistical analysis using GLMMs (§A.9) in the Appendix.
5 Sensitivity
We investigate how sensitive the predictions are, i.e., to what extent LLMs’ predictions change when instructed to answer from viewpoints characterised by particular sociodemographic backgrounds.
5.1 Detailed Setup
We aggregate all predictions from prompting with different profiles using majority voting. Then, we compare how often the aggregated label differs from the one predicted without any sociodemographic information.
5.2 Results
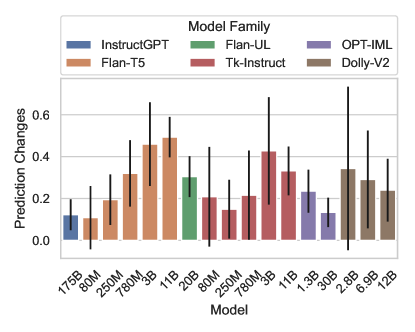
Prompting using sociodemographic profiles leads to prediction changes.
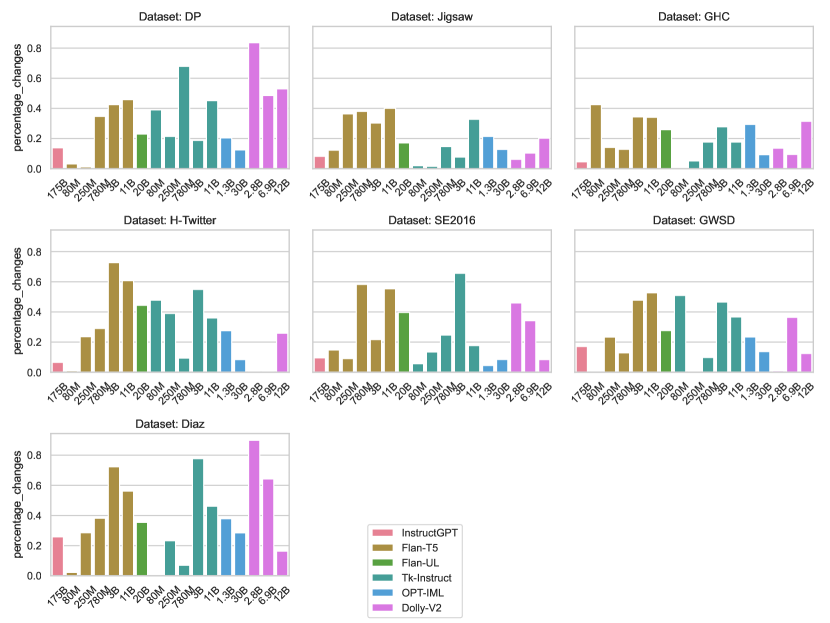
In Figure 3, we depict the amount of label prediction changes (in percent) when including sociodemographic information, averaged across all datasets. Several trends can be observed; the degree of prediction changes is both dependent on the model and dataset. Notably, instruction-tuned models based on T5 (Flan-T5, Tk-Instruct) or Pythia (Dolly-V2) are on average more affected by sociodemographic prompting than InstructGPT or variants of OPT-IML .
Interestingly, we find that prediction changes are statistically significantly affected by the length of the text instance, i.e. shorter texts are associated with an increased number of prediction changes.
Looking at individual datasets (Figure 6) we observe that models are more affected by data from DP and Diaz, with extreme cases where more than 80% of the predictions change when using Dolly-V2 (2.8B). In contrast, hatespeech datasets show less pronounced label shifts.
Model choice and text ambiguity are influential factors
To better understand the reasons for prediction changes, we aim at analyzing which textual properties lead to prediction changes when prompting with different sociodemographic profiles. We are interested in model-agnostic reasons for sensitivity of sociodemographic prompting. Thus, to draw valid conclusions, we filtered those instances which led to prediction changes across all models tested. Surprisingly, none of the changes are consistent across all models. This indicates that the model choice has a large influence on the prediction outcome, an observation which we inspect closer in §6.2.
We further suspect that ambiguity in the text (i.e. disagreement among annotators) might be a reason for prediction changes. We compute the correlation of the disagreement observed in the original annotations and among the results using different sociodemographic profiles. We use the variance to mean ratio as our proxy score for the level of disagreement per instance. We observe a weak Kendall’s Kendall (1938) correlation which is statistically significant (, ).
Combinations of sociodemographic attributes are more influential than individual attributes in isolation.
We investigate the differences between using several sociodemographic attributes and using only one attribute at a time. In general, the combination is most influential, i.e., in 63% of the experiments across models and datasets it leads to most prediction changes. However, there are some dataset-specific effects across different model families where individual attributes have a stronger impact, e.g. race for the GHC corpus (detailed results in Appendix A.5.2).
6 Performance
| Toxicity - DP | Sentiment - Diaz | |||
| Model | Acc | F1 | Acc | F1 |
| Random | .19 | .17 | .20 | .17 |
| Majority | .06 | .02 | .09 | .03 |
| InstructGPT(175B) | .43 | .26 | .34 | .26 |
| InstructGPT(175B)+SD | .44 | .26 | .37 | .31 |
| OPT-IML(30B) | .42 | .18 | .28 | .26 |
| OPT-IML(30B)+SD | .45 | .18 | .32 | .27 |
We analyze the impact of sociodemographic prompting on models’ zero-shot performances.
6.1 Detailed Setup
First, we evaluate to what extent sociodemographic prompting predicts an annotator-specific annotation with the same sociodemographic profile as provided in the prompt. We study this setup for the datasets where this information is provided (DP, Diaz). Second, we evaluate the performance of sociodemographic prompting by comparing it to the original set of annotations for each dataset. In the following, we present the results for the two overall best-performing models, InstructGPT and OPT-IML , and provide the complete results in Appendix A.6. Note, that statistical analyses were performed on experimental results from all models.
6.2 Results
Adding sociodemographic information helps reproducing individual annotator decisions.
| Toxicity | Hatespeech | Stance Detection | Sentiment | |||||||||||
| DP | Jigsaw | GHC | H-Twitter | SE2016 | GWSD | Diaz | ||||||||
| Model | Acc | F1 | Acc | F1 | Acc | F1 | Acc | F1 | Acc | F1 | Acc | F1 | Acc | F1 |
| InstructGPT(175B) | .48 | .27 | .76 | .59 | .89 | .75 | .87 | .57 | .53 | .51 | .72 | .69 | .36 | .33 |
| InstructGPT(175B) +SD | .51 | .28 | .79 | .60 | .89 | .74 | .86 | .53 | .52 | .52 | .69 | .68 | .39 | .33 |
| OPT-IML(30B) | .50 | .19 | .58 | .49 | .80 | .69 | .84 | .54 | .67 | .53 | .57 | .50 | .27 | .24 |
| OPT-IML(30B) SD | .55 | .20 | .64 | .53 | .85 | .74 | .86 | .57 | .65 | .51 | .52 | .39 | .35 | .29 |
| CE | JSD | CE | JSD | CE | JSD | CE | JSD | CE | JSD | CE | JSD | CE | JSD | |
| InstructGPT(175B) | 1.42 | .32 | .55 | .15 | .43 | .07 | .88 | .08 | .98 | .27 | .86 | .18 | 1.50 | .37 |
| InstructGPT(175B)+SD | 1.40 | .29 | .51 | .12 | .42 | .06 | .90 | .08 | .99 | .25 | .89 | .15 | 1.48 | .33 |
| OPT-IML(30B) | 1.43 | .33 | .71 | .26 | .52 | .13 | .90 | .10 | .90 | .22 | .95 | .23 | 1.57 | .42 |
| OPT-IML(30B)+SD | 1.40 | .29 | .66 | .20 | .48 | .09 | .89 | .07 | .91 | .21 | .99 | .23 | 1.52 | .32 |
Table 3 demonstrates a positive trend when providing the original sociodemographic profiles. This holds true for larger models (>11B). Most models from other families (Tk-Instruct or Dolly-V2 ) do not outperform random prediction, independent of the prompting method (cf. Table 9). Still, predicting annotator-specific decisions is challenging with more than half of the instances (Accuracy < .5) being incorrectly classified. This is partially due to the datasets’ label imbalance, as indicated by the relatively low F1 scores. These results confirm to some extent earlier work stating that sociodemographic information may not provide enough information to explain individual annotation behavior (Díaz et al., 2022; Orlikowski et al., 2023). Interestingly, our statistical analyses show that sociodemographic prompting has a significant interaction effect with input text, i.e. it is more effective for longer input texts.
Sociodemographic prompting can improve zero-shot performance.
Table 4 presents the hard-label and soft-label evaluation results. There is a statistically significant interaction effect of model family and prompting method, identifying InstructGPT as the model which benefits most from sociodemographic prompting and Flan-T5 least. Interestingly, for toxicity detection and sentiment classification, the models benefit from sociodemographic prompting, whereas for stance detection they perform better without such information. We observe a slight trend that datasets for which improvements are observed share low IAA across the original annotations (see Krippendorff’s in Table 2). Most notably, using the sociodemographic profiles from the DP dataset can also improve performance for other datasets such as Jigsaw, GHC and GWSD.
When comparing both evaluation setups, the positive effect of sociodemographic prompting is more pronounced for soft-label evaluation. This indicates that, overall, the predictions are more aligned to the original annotations. The results for the other model sizes are provided in Appendix A.6. We observe that multiple model configurations exhibit weak performance for both setups in general, often without any increasing trend for larger models from the same model family.
Increased model sensitivity does not translate to better performance.
We test whether the percentage of prediction changes leads to better performance but do not measure any significant correlation (-0.16 Spearman , p=0.08) when correlating performance improvement and percentage of prediction changes. We conclude that model sensitivity is not a decisive factor for improvement of zero-shot performance using sociodemographic information.
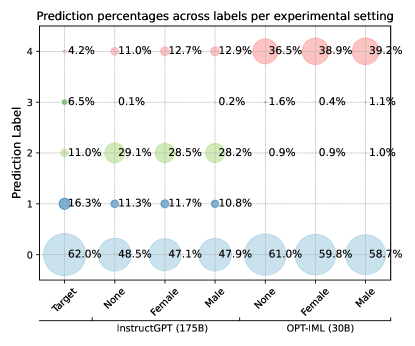
Model choice has large influence on label prediction.
We established the influence of sociodemographic prompting on model performance but also observe a statistical significant effect of the model family. On average, InstructGPT and OPT-IML variants perform best, while variants of Flan, Tk-Instruct and Dolly-V2 perform significantly worse, independent of model size (§A.6). To better understand these differences, we visualize the percentage distribution of label predictions for different experimental settings in Figure 4. Within the same model, we observe minor differences when changing the value of the sociodemographic attribute. However, the majority of predictions are determined by the choice of model family. Concretely, the predictions of InstructGPT are distributed differently across the label space than those of OPT-IML . A similar picture emerges when the results are compared with other models (cf. §A.7).
To explain this observation, we investigate if our datasets (or parts thereof) are contained in the relevant instruction-tuning datasets and conclude that most models333The exact composition of the training datasets of InstructGPT and Dolly-V2 are disclosed. have been exposed to the same tasks which are relevant for our datasets. However, we note that OPT-IML was exposed to the largest number and variety of tasks and datasets during instruction fine-tuning (cf. Table A.3).
7 Robustness
Previous work demonstrated that prompting for text classification is influenced by the prompt format (Min et al., 2022). Thus, we investigate whether sociodemographic prompting is robust as indicated by the extent to which predictions change when reformulating the instruction.
7.1 Detailed Setup
We compare the previous format used to two other formulations of the instruction; a paraphrase (1) and another where we do not provide any explicit instruction but merely present the sociodemographic profile and the input text (2). We provide the exact formulations in Appendix A.8. Importantly, the sociodemographic profile remains the same between different formats.
| InstructGPT (175B) | OPT-IML (30B) | |||
|---|---|---|---|---|
| Model | Diff (1,2) | F1 | Diff (1,2) | F1 |
| DP | (19%, 33%) | .27 .02 | (13%, 82%) | .15 .06 |
| DP+SD | (10%, 40%) | .27 .02 | (15%, 56%) | .20 .01 |
| Jigsaw | (5%, 16%) | .61 .01 | (11%, 30%) | .50 .02 |
| Jigsaw+SD | (4%, 13%) | .61 .01 | (14%, 23%) | .53 .00 |
| GHC | (2%, 10%) | .71 .04 | (6%, 22%) | .67 .05 |
| GHC+SD | (2%, 9%) | .73 .01 | (8%, 16%) | .72 .04 |
| H-Twitter | (3%, 12%) | .54 .06 | (11%, 91%) | .38 .22 |
| H-Twitter+SD | (4%, 8%) | .54 .03 | (12%, 95%) | .36 .25 |
| SE2016 | (10%, 41%) | .38 .19 | (13%, 28%) | .50 .08 |
| SE2016+SD | (8%, 17%) | .52 .01 | (12%, 20%) | .43 .12 |
| GWSD | (7%, 24%) | .66 .04 | (13%, 20%) | .41 .10 |
| GWSD+SD | (12%, 19%) | .67 .01 | (10%, 10%) | .34 .09 |
| Diaz | (16%, 45%) | .33 .03 | (24%, 45%) | .21 .04 |
| Diaz+SD | (14%, 36%) | .31 .04 | (35%, 42%) | .26 .02 |
7.2 Results
Predictions are sensitive to prompt formulation.
Table 5 presents the differences in prediction changes (in percent) between the different formats across datasets. Even for semantically equivalent formulations (0,1) prediction differences can rise up to 35% (OPT-IML on Diaz). Using a minimal format leads to the most drastic changes across all datasets, especially pronounced for DP and H-Twitter. Similar effects can be observed for prompting without sociodemographic information. Thus, prediction differences are only partially induced by the sociodemographic profile and confirm previous observations that prompt formulation largely influences prediction outcomes.
8 Discussion and Recommendations
While all LLMs are sensitive to sociodemographic prompting, we identified model scale and the number of instruction-tuning tasks as relevant factors for improving model performance. Toxicity detection and sentiment classification are the tasks which benefit the most from this technique. Further, the model family and prompt formulation have a strong influence on model predictions. Thus, we emphasize that sociodemographic prompting should be used with care, especially in human response simulation (Durmus et al., 2023) and data annotation (Hartvigsen et al., 2022).
From these findings, we can extract actionable suggestions. First, estimating the degree of sociodemographic “alignment” of any LLM should not be merely based on the outcome of prompting with varying sociodemographic profiles. Our work points out the need of a general evaluation framework for studying the sociodemographic alignment of LLMs. Second, if any sociodemographic prompting experiment is conducted, a robustness analysis should accompany the work to evaluate the validity of the findings.
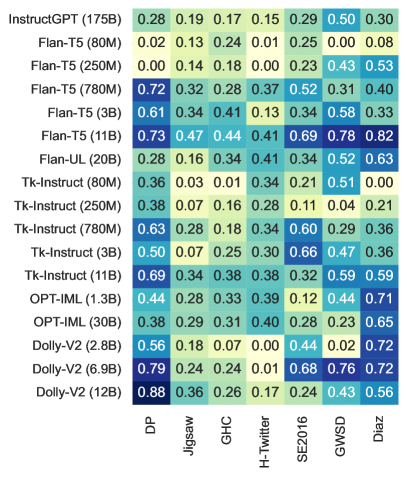
Sociodemographic prompting is effective at modeling disagreement.
We also acknowledge potential applications of sociodemographic prompting in the future. Wan et al. (2023) trained a model for disagreement prediction in subjective NLP tasks.Their approach relies on the existence of annotated data alongside the sociodemographic information of the annotators. Thus, we investigate whether we can use sociodemographic prompting as an efficient method to identify instances which will likely result in disagreement during annotation. We compare the original annotations with the result of sociodemographic prompting and calculate a binary F1 score. True positives are instances which received disagreement in both setups. Conversely, true negatives are instances which received no disagreeing votes in both setups.
We present the results in Figure 5. Surprisingly, the best-performing zero-shot models (§6) are not the best at modeling disagreement. With a mean performance of 0.62, Flan-T5 (11B) produces the best and most consistent results across all datasets. This is confirmed by our statistical analysis (§A.9 for details). For the two datasets (DP, Diaz) with original sociodemographic information and lowest IAA overall, we observe the best performances across different model sizes. As both datasets induce increased prediction changes (§5), we hypothesize that sociodemographic prompting is more sensitive if there is larger disagreement in the original annotation. We interpret this as a promising result for using zero-shot sociodemographic prompting to estimate whether a text is likely to induce disagreement among annotators. We leave the exploration of integrating additional training signals (e.g., few-shot) as future work.
9 Conclusion
We study sociodemographic prompting for subjective NLP tasks and employ a comprehensive study across seven datasets and seven instruction-tuned LLMs from different model families. Our results show that these models are sensitive to sociodemographic prompting and using this technique can improve zero-shot performance.
However, we also observe a strong influence of the prompt formulation and model family. Thus, we argue that sociodemographic prompting should be used with care in sensitive applications and requires comprehensive evaluation when used for data annotation or studying sociodemographic alignment of language models.
Limitations
In the following, we provide an examination of the inherent limitations associated with this research study. We further note that all our experiments have been approved by the local ethics review process of the Business School of the University of Hamburg. This process is compliant to obtaining approval from an Institutional Review Board.
Annotations go beyond sociodemographics.
While annotators’ sociodemographic backgrounds have been shown to be influential in their decision-making process (Al Kuwatly et al., 2020; Excell and Al Moubayed, 2021; Shen and Rose, 2021; Larimore et al., 2021; Sap et al., 2022, inter alia), it is not a definitive predictive factor as individual lived experiences (Waseem, 2016) or situated domain expertise (Patton et al., 2019) can influence annotation decisions, too. In short, collective group behavior may not always provide an explanation for individual behavior (Díaz et al., 2022; Orlikowski et al., 2023). While our general approach can be extended to a wider range of sociodemographic attributes or even descriptions of individuals, we refrained from testing more to contain the complexity of our study and due to the limited availability of such resources. We welcome efforts to increase the availability of such information alongside the datasets, e.g., Crowdworksheets by Díaz et al. (2022), and hope to see more work in future exploring prompting large language models with more dimensions of sociodemographic and personal information.
Sociodemographic profiles are not representative.
It is important to acknowledge certain limitations with regard to the representation of sociodemographic profiles. First, all the datasets employed in our research are exclusively in English language, mostly due to the lack of resources in other languages. This linguistic restriction inherently limits our ability to make comprehensive cross-linguistic assessments. Second, the sociodemographic information provided by the annotators of the datasets used in this study adheres to a classification system specific to the United States. Consequently, our findings cannot be generalized to sociodemographic data originating from other nations, linguistic communities, or cultural contexts. These limitations underscore the need for caution when extrapolating our results to broader sociodemographic contexts beyond the scope of our study.
We cannot model all factors influencing prompting outcomes.
We demonstrate that model predictions can effectively be changed when incorporating sociodemographic information within the prompt (§5). However, we acknowledge that this is one among many of the factors influencing model predictions in a zero-shot prompting setup. We account for the influence of prompt formulation by investigating its effect in §7 and are aware of the growing body of work investigating various other factors which influence prompting results, such as correct label assignment (Min et al., 2022), domain-specific vocabulary (Fei et al., 2023) or example order (Kumar and Talukdar, 2021; Zhao et al., 2021; Lu et al., 2022).
The majority of these works deals with in-context learning or few-shot learning in general which we do not investigate in this study. However, we see these phenomena as support for our overall argument (§7) that estimating the degree of alignment of any LLM should not be merely based on the outcome of prompting with varying sociodemographic profiles. This is due to their lack of robustness when changing the surface form of the prompt while keeping its semantic meaning similar.
Simulating annotations using prompting mechanisms is limited.
Employing humans for annotation projects in NLP is a multi-step process. It involves the formulation of annotation guidelines and their iterative refinement through discussions between the annotators and coordinators. In most cases, annotators are undergoing a qualification process or test to evaluate their eligibility for contributing to the annotations. These factors influence the decision-making process of the annotators and ultimately the annotation agreement. In our experimental setup, we do not provide any additional instructions to the model than the prompt instructions which we present in §3 and §A.8, thus possibly underspecifying the task instruction to the model. Our experimental setup is designed driven by the following observations; for most datasets, the original annotation guidelines are non-retrievable and could only be guessed from the description in the corresponding research publication. Further, LLMs are limited with regards to the context input size (see Table A.3 for details) and using longer prompts would have limited our experiments to a few models with appropriate input sizes.
Acknowledgements
We thank Max Glockner, Hovhannes Tamoyan and Anmoel Goel for their feedback on an early draft of this work and the authors of the datasets we used for providing them publicly. We gratefully acknowledge the support of Microsoft with a grant for access to OpenAI GPT models via the Azure cloud (Accelerate Foundation Model Academic Research). This work has been funded by the German Federal Ministry of Education and Research (BMBF) under the promotional reference 01UP2229B (KoPoCoV) and by the German Research Foundation (DFG) as part of the Research Training Group KRITIS No. GRK 2222. Anne Lauscher’s work is funded under the Excellence Strategy of the Federal Government and the Länder.
References
- Al Kuwatly et al. (2020) Hala Al Kuwatly, Maximilian Wich, and Georg Groh. 2020. Identifying and measuring annotator bias based on annotators’ demographic characteristics. In Proceedings of the Fourth Workshop on Online Abuse and Harms, pages 184–190, Online. Association for Computational Linguistics.
- Argyle et al. (2023) Lisa P. Argyle, Ethan C. Busby, Nancy Fulda, Joshua R. Gubler, Christopher Rytting, and David Wingate. 2023. Out of one, many: Using language models to simulate human samples. Political Analysis, 31(3):337–351.
- Attanasio et al. (2023) Giuseppe Attanasio, Flor Plaza del Arco, Debora Nozza, and Anne Lauscher. 2023. A tale of pronouns: Interpretability informs gender bias mitigation for fairer instruction-tuned machine translation. In Proceedings of the 2023 Conference on Empirical Methods in Natural Language Processing, pages 3996–4014, Singapore. Association for Computational Linguistics.
- Balahur et al. (2010) Alexandra Balahur, Ralf Steinberger, Mijail Kabadjov, Vanni Zavarella, Erik van der Goot, Matina Halkia, Bruno Pouliquen, and Jenya Belyaeva. 2010. Sentiment analysis in the news. In Proceedings of the Seventh International Conference on Language Resources and Evaluation (LREC’10), Valletta, Malta. European Language Resources Association (ELRA).
- Barikeri et al. (2021) Soumya Barikeri, Anne Lauscher, Ivan Vulić, and Goran Glavaš. 2021. RedditBias: A real-world resource for bias evaluation and debiasing of conversational language models. In Proceedings of the 59th Annual Meeting of the Association for Computational Linguistics and the 11th International Joint Conference on Natural Language Processing (Volume 1: Long Papers), pages 1941–1955, Online. Association for Computational Linguistics.
- Basile et al. (2021) Valerio Basile, Michael Fell, Tommaso Fornaciari, Dirk Hovy, Silviu Paun, Barbara Plank, Massimo Poesio, and Alexandra Uma. 2021. We need to consider disagreement in evaluation. In Proceedings of the 1st Workshop on Benchmarking: Past, Present and Future, pages 15–21, Online. Association for Computational Linguistics.
- Beck et al. (2021) Tilman Beck, Ji-Ung Lee, Christina Viehmann, Marcus Maurer, Oliver Quiring, and Iryna Gurevych. 2021. Investigating label suggestions for opinion mining in German covid-19 social media. In Proceedings of the 59th Annual Meeting of the Association for Computational Linguistics and the 11th International Joint Conference on Natural Language Processing (Volume 1: Long Papers), pages 1–13, Online. Association for Computational Linguistics.
- Biderman et al. (2023) Stella Biderman, Hailey Schoelkopf, Quentin Gregory Anthony, Herbie Bradley, Kyle O’Brien, Eric Hallahan, Mohammad Aflah Khan, Shivanshu Purohit, USVSN Sai Prashanth, Edward Raff, et al. 2023. Pythia: A suite for analyzing large language models across training and scaling. In International Conference on Machine Learning, pages 2397–2430. PMLR.
- Biester et al. (2022) Laura Biester, Vanita Sharma, Ashkan Kazemi, Naihao Deng, Steven Wilson, and Rada Mihalcea. 2022. Analyzing the effects of annotator gender across NLP tasks. In Proceedings of the 1st Workshop on Perspectivist Approaches to NLP @LREC2022, pages 10–19, Marseille, France. European Language Resources Association.
- Blodgett et al. (2020) Su Lin Blodgett, Solon Barocas, Hal Daumé III, and Hanna Wallach. 2020. Language (technology) is power: A critical survey of “bias” in NLP. In Proceedings of the 58th Annual Meeting of the Association for Computational Linguistics, pages 5454–5476, Online. Association for Computational Linguistics.
- Brown et al. (2020) Tom B. Brown, Benjamin Mann, Nick Ryder, Melanie Subbiah, Jared Kaplan, Prafulla Dhariwal, Arvind Neelakantan, Pranav Shyam, Girish Sastry, Amanda Askell, Sandhini Agarwal, Ariel Herbert-Voss, Gretchen Krueger, Tom Henighan, Rewon Child, Aditya Ramesh, Daniel M. Ziegler, Jeffrey Wu, Clemens Winter, Christopher Hesse, Mark Chen, Eric Sigler, Mateusz Litwin, Scott Gray, Benjamin Chess, Jack Clark, Christopher Berner, Sam McCandlish, Alec Radford, Ilya Sutskever, and Dario Amodei. 2020. Language models are few-shot learners. In Advances in Neural Information Processing Systems 33: Annual Conference on Neural Information Processing Systems 2020, NeurIPS 2020, December 6-12, 2020, virtual.
- Cheng et al. (2023) Myra Cheng, Esin Durmus, and Dan Jurafsky. 2023. Marked personas: Using natural language prompts to measure stereotypes in language models. In Proceedings of the 61st Annual Meeting of the Association for Computational Linguistics (Volume 1: Long Papers), pages 1504–1532, Toronto, Canada. Association for Computational Linguistics.
- Chung et al. (2022) Hyung Won Chung, Le Hou, Shayne Longpre, Barret Zoph, Yi Tay, William Fedus, Eric Li, Xuezhi Wang, Mostafa Dehghani, Siddhartha Brahma, Albert Webson, Shixiang Shane Gu, Zhuyun Dai, Mirac Suzgun, Xinyun Chen, Aakanksha Chowdhery, Sharan Narang, Gaurav Mishra, Adams Yu, Vincent Y. Zhao, Yanping Huang, Andrew M. Dai, Hongkun Yu, Slav Petrov, Ed H. Chi, Jeff Dean, Jacob Devlin, Adam Roberts, Denny Zhou, Quoc V. Le, and Jason Wei. 2022. Scaling instruction-finetuned language models. CoRR, abs/2210.11416.
- Davani et al. (2023) Aida Mostafazadeh Davani, Mohammad Atari, Brendan Kennedy, and Morteza Dehghani. 2023. Hate speech classifiers learn normative social stereotypes. Transactions of the Association for Computational Linguistics, 11:300–319.
- Deshpande et al. (2023) Ameet Deshpande, Vishvak Murahari, Tanmay Rajpurohit, Ashwin Kalyan, and Karthik Narasimhan. 2023. Toxicity in chatgpt: Analyzing persona-assigned language models. In Findings of the Association for Computational Linguistics: EMNLP 2023, pages 1236–1270, Singapore. Association for Computational Linguistics.
- Dettmers et al. (2022) Tim Dettmers, Mike Lewis, Sam Shleifer, and Luke Zettlemoyer. 2022. 8-bit optimizers via block-wise quantization. In The Tenth International Conference on Learning Representations, ICLR 2022, Virtual Event, April 25-29, 2022. OpenReview.net.
- Diaz et al. (2018) Mark Diaz, Isaac Johnson, Amanda Lazar, Anne Marie Piper, and Darren Gergle. 2018. Addressing age-related bias in sentiment analysis. In Proceedings of the 2018 CHI Conference on Human Factors in Computing Systems, CHI 2018, Montreal, QC, Canada, April 21-26, 2018, page 412. ACM.
- Díaz et al. (2022) Mark Díaz, Ian D. Kivlichan, Rachel Rosen, Dylan K. Baker, Razvan Amironesei, Vinodkumar Prabhakaran, and Emily Denton. 2022. Crowdworksheets: Accounting for individual and collective identities underlying crowdsourced dataset annotation. In FAccT ’22: 2022 ACM Conference on Fairness, Accountability, and Transparency, Seoul, Republic of Korea, June 21 - 24, 2022, pages 2342–2351. ACM.
- Durmus et al. (2023) Esin Durmus, Karina Nyugen, Thomas I. Liao, Nicholas Schiefer, Amanda Askell, Anton Bakhtin, Carol Chen, Zac Hatfield-Dodds, Danny Hernandez, Nicholas Joseph, Liane Lovitt, Sam McCandlish, Orowa Sikder, Alex Tamkin, Janel Thamkul, Jared Kaplan, Jack Clark, and Deep Ganguli. 2023. Towards measuring the representation of subjective global opinions in language models. CoRR, abs/2306.16388.
- Excell and Al Moubayed (2021) Elizabeth Excell and Noura Al Moubayed. 2021. Towards equal gender representation in the annotations of toxic language detection. In Proceedings of the 3rd Workshop on Gender Bias in Natural Language Processing, pages 55–65, Online. Association for Computational Linguistics.
- Fei et al. (2023) Yu Fei, Yifan Hou, Zeming Chen, and Antoine Bosselut. 2023. Mitigating label biases for in-context learning. In Proceedings of the 61st Annual Meeting of the Association for Computational Linguistics (Volume 1: Long Papers), pages 14014–14031, Toronto, Canada. Association for Computational Linguistics.
- Fleisig et al. (2023) Eve Fleisig, Rediet Abebe, and Dan Klein. 2023. When the majority is wrong: Modeling annotator disagreement for subjective tasks. In Proceedings of the 2023 Conference on Empirical Methods in Natural Language Processing, pages 6715–6726, Singapore. Association for Computational Linguistics.
- Gordon et al. (2022) Mitchell L. Gordon, Michelle S. Lam, Joon Sung Park, Kayur Patel, Jeff Hancock, Tatsunori Hashimoto, and Michael S. Bernstein. 2022. Jury learning: Integrating dissenting voices into machine learning models. In Proceedings of the 2022 CHI Conference on Human Factors in Computing Systems, CHI ’22, New York, NY, USA. Association for Computing Machinery.
- Goyal et al. (2022) Nitesh Goyal, Ian D. Kivlichan, Rachel Rosen, and Lucy Vasserman. 2022. Is your toxicity my toxicity? exploring the impact of rater identity on toxicity annotation. Proc. ACM Hum. Comput. Interact., 6(CSCW2):1–28.
- Gupta et al. (2023) Soumyajit Gupta, Sooyong Lee, Maria De-Arteaga, and Matthew Lease. 2023. Same same, but different: Conditional multi-task learning for demographic-specific toxicity detection. In Proceedings of the ACM Web Conference 2023, WWW ’23, page 3689–3700, New York, NY, USA. Association for Computing Machinery.
- Hartvigsen et al. (2022) Thomas Hartvigsen, Saadia Gabriel, Hamid Palangi, Maarten Sap, Dipankar Ray, and Ece Kamar. 2022. ToxiGen: A large-scale machine-generated dataset for adversarial and implicit hate speech detection. In Proceedings of the 60th Annual Meeting of the Association for Computational Linguistics (Volume 1: Long Papers), pages 3309–3326, Dublin, Ireland. Association for Computational Linguistics.
- Hwang et al. (2023) EunJeong Hwang, Bodhisattwa Majumder, and Niket Tandon. 2023. Aligning language models to user opinions. In Findings of the Association for Computational Linguistics: EMNLP 2023, pages 5906–5919, Singapore. Association for Computational Linguistics.
- Iyer et al. (2022) Srinivasan Iyer, Xi Victoria Lin, Ramakanth Pasunuru, Todor Mihaylov, Daniel Simig, Ping Yu, Kurt Shuster, Tianlu Wang, Qing Liu, Punit Singh Koura, Xian Li, Brian O’Horo, Gabriel Pereyra, Jeff Wang, Christopher Dewan, Asli Celikyilmaz, Luke Zettlemoyer, and Ves Stoyanov. 2022. OPT-IML: scaling language model instruction meta learning through the lens of generalization. CoRR, abs/2212.12017.
- Kendall (1938) Maurice G Kendall. 1938. A new measure of rank correlation. Biometrika, 30(1/2):81–93.
- Kennedy et al. (2022) Brendan Kennedy, Mohammad Atari, Aida Mostafazadeh Davani, Leigh Yeh, Ali Omrani, Yehsong Kim, Kris Coombs, Shreya Havaldar, Gwenyth Portillo-Wightman, Elaine Gonzalez, et al. 2022. Introducing the gab hate corpus: defining and applying hate-based rhetoric to social media posts at scale. Language Resources and Evaluation, pages 1–30.
- Küçük and Can (2020) Dilek Küçük and Fazli Can. 2020. Stance detection: A survey. ACM Comput. Surv., 53(1).
- Kumar et al. (2021) Deepak Kumar, Patrick Gage Kelley, Sunny Consolvo, Joshua Mason, Elie Bursztein, Zakir Durumeric, Kurt Thomas, and Michael Bailey. 2021. Designing toxic content classification for a diversity of perspectives. In Seventeenth Symposium on Usable Privacy and Security (SOUPS 2021), pages 299–318.
- Kumar and Talukdar (2021) Sawan Kumar and Partha Talukdar. 2021. Reordering examples helps during priming-based few-shot learning. In Findings of the Association for Computational Linguistics: ACL-IJCNLP 2021, pages 4507–4518, Online. Association for Computational Linguistics.
- Larimore et al. (2021) Savannah Larimore, Ian Kennedy, Breon Haskett, and Alina Arseniev-Koehler. 2021. Reconsidering annotator disagreement about racist language: Noise or signal? In Proceedings of the Ninth International Workshop on Natural Language Processing for Social Media, pages 81–90, Online. Association for Computational Linguistics.
- Lauscher et al. (2022a) Anne Lauscher, Federico Bianchi, Samuel R. Bowman, and Dirk Hovy. 2022a. SocioProbe: What, when, and where language models learn about sociodemographics. In Proceedings of the 2022 Conference on Empirical Methods in Natural Language Processing, pages 7901–7918, Abu Dhabi, United Arab Emirates. Association for Computational Linguistics.
- Lauscher et al. (2022b) Anne Lauscher, Henning Wachsmuth, Iryna Gurevych, and Goran Glavaš. 2022b. Scientia potentia Est—On the role of knowledge in computational argumentation. Transactions of the Association for Computational Linguistics, 10:1392–1422.
- Lee et al. (2023) Noah Lee, Na Min An, and James Thorne. 2023. Can large language models capture dissenting human voices? In Proceedings of the 2023 Conference on Empirical Methods in Natural Language Processing, pages 4569–4585, Singapore. Association for Computational Linguistics.
- Lu et al. (2022) Yao Lu, Max Bartolo, Alastair Moore, Sebastian Riedel, and Pontus Stenetorp. 2022. Fantastically ordered prompts and where to find them: Overcoming few-shot prompt order sensitivity. In Proceedings of the 60th Annual Meeting of the Association for Computational Linguistics (Volume 1: Long Papers), pages 8086–8098, Dublin, Ireland. Association for Computational Linguistics.
- Luo et al. (2020) Yiwei Luo, Dallas Card, and Dan Jurafsky. 2020. Detecting stance in media on global warming. In Findings of the Association for Computational Linguistics: EMNLP 2020, pages 3296–3315, Online. Association for Computational Linguistics.
- Min et al. (2022) Sewon Min, Xinxi Lyu, Ari Holtzman, Mikel Artetxe, Mike Lewis, Hannaneh Hajishirzi, and Luke Zettlemoyer. 2022. Rethinking the role of demonstrations: What makes in-context learning work? In Proceedings of the 2022 Conference on Empirical Methods in Natural Language Processing, pages 11048–11064, Abu Dhabi, United Arab Emirates. Association for Computational Linguistics.
- Mohammad et al. (2016) Saif Mohammad, Svetlana Kiritchenko, Parinaz Sobhani, Xiaodan Zhu, and Colin Cherry. 2016. SemEval-2016 task 6: Detecting stance in tweets. In Proceedings of the 10th International Workshop on Semantic Evaluation (SemEval-2016), pages 31–41, San Diego, California. Association for Computational Linguistics.
- Nickolls et al. (2008) John Nickolls, Ian Buck, Michael Garland, and Kevin Skadron. 2008. Scalable parallel programming with cuda: Is cuda the parallel programming model that application developers have been waiting for? Queue, 6(2):40–53.
- Orlikowski et al. (2023) Matthias Orlikowski, Paul Röttger, Philipp Cimiano, and Dirk Hovy. 2023. The ecological fallacy in annotation: Modeling human label variation goes beyond sociodemographics. In Proceedings of the 61st Annual Meeting of the Association for Computational Linguistics (Volume 2: Short Papers), pages 1017–1029, Toronto, Canada. Association for Computational Linguistics.
- Ouyang et al. (2022) Long Ouyang, Jeffrey Wu, Xu Jiang, Diogo Almeida, Carroll L. Wainwright, Pamela Mishkin, Chong Zhang, Sandhini Agarwal, Katarina Slama, Alex Ray, John Schulman, Jacob Hilton, Fraser Kelton, Luke Miller, Maddie Simens, Amanda Askell, Peter Welinder, Paul F. Christiano, Jan Leike, and Ryan Lowe. 2022. Training language models to follow instructions with human feedback. In NeurIPS.
- Ovesdotter Alm (2011) Cecilia Ovesdotter Alm. 2011. Subjective natural language problems: Motivations, applications, characterizations, and implications. In Proceedings of the 49th Annual Meeting of the Association for Computational Linguistics: Human Language Technologies, pages 107–112, Portland, Oregon, USA. Association for Computational Linguistics.
- Park et al. (2022) Joon Sung Park, Lindsay Popowski, Carrie J. Cai, Meredith Ringel Morris, Percy Liang, and Michael S. Bernstein. 2022. Social simulacra: Creating populated prototypes for social computing systems. In The 35th Annual ACM Symposium on User Interface Software and Technology, UIST 2022, Bend, OR, USA, 29 October 2022 - 2 November 2022, pages 74:1–74:18. ACM.
- Paszke et al. (2019) Adam Paszke, Sam Gross, Francisco Massa, Adam Lerer, James Bradbury, Gregory Chanan, Trevor Killeen, Zeming Lin, Natalia Gimelshein, Luca Antiga, Alban Desmaison, Andreas Köpf, Edward Z. Yang, Zachary DeVito, Martin Raison, Alykhan Tejani, Sasank Chilamkurthy, Benoit Steiner, Lu Fang, Junjie Bai, and Soumith Chintala. 2019. Pytorch: An imperative style, high-performance deep learning library. In Advances in Neural Information Processing Systems 32: Annual Conference on Neural Information Processing Systems 2019, NeurIPS 2019, December 8-14, 2019, Vancouver, BC, Canada, pages 8024–8035.
- Patton et al. (2019) Desmond Upton Patton, Philipp Blandfort, William R Frey, Michael B Gaskell, and Svebor Karaman. 2019. Annotating twitter data from vulnerable populations: Evaluating disagreement between domain experts and graduate student annotators.(2019). In Proceedings of the 52nd Hawaii International Conference on System Sciences, pages 2142–2151.
- Pei and Jurgens (2023) Jiaxin Pei and David Jurgens. 2023. When do annotator demographics matter? measuring the influence of annotator demographics with the POPQUORN dataset. In Proceedings of the 17th Linguistic Annotation Workshop (LAW-XVII), pages 252–265, Toronto, Canada. Association for Computational Linguistics.
- Prabhakaran et al. (2021) Vinodkumar Prabhakaran, Aida Mostafazadeh Davani, and Mark Diaz. 2021. On releasing annotator-level labels and information in datasets. In Proceedings of the Joint 15th Linguistic Annotation Workshop (LAW) and 3rd Designing Meaning Representations (DMR) Workshop, pages 133–138, Punta Cana, Dominican Republic. Association for Computational Linguistics.
- R Core Team (2023) R Core Team. 2023. R: A Language and Environment for Statistical Computing. R Foundation for Statistical Computing, Vienna, Austria.
- Raffel et al. (2020) Colin Raffel, Noam Shazeer, Adam Roberts, Katherine Lee, Sharan Narang, Michael Matena, Yanqi Zhou, Wei Li, and Peter J Liu. 2020. Exploring the limits of transfer learning with a unified text-to-text transformer. The Journal of Machine Learning Research, 21(1):5485–5551.
- Rottger et al. (2022) Paul Rottger, Bertie Vidgen, Dirk Hovy, and Janet Pierrehumbert. 2022. Two contrasting data annotation paradigms for subjective NLP tasks. In Proceedings of the 2022 Conference of the North American Chapter of the Association for Computational Linguistics: Human Language Technologies, pages 175–190, Seattle, United States. Association for Computational Linguistics.
- Santurkar et al. (2023) Shibani Santurkar, Esin Durmus, Faisal Ladhak, Cinoo Lee, Percy Liang, and Tatsunori Hashimoto. 2023. Whose opinions do language models reflect? In International Conference on Machine Learning, ICML 2023, 23-29 July 2023, Honolulu, Hawaii, USA, volume 202 of Proceedings of Machine Learning Research, pages 29971–30004. PMLR.
- Santy et al. (2023) Sebastin Santy, Jenny Liang, Ronan Le Bras, Katharina Reinecke, and Maarten Sap. 2023. NLPositionality: Characterizing design biases of datasets and models. In Proceedings of the 61st Annual Meeting of the Association for Computational Linguistics (Volume 1: Long Papers), pages 9080–9102, Toronto, Canada. Association for Computational Linguistics.
- Sap et al. (2022) Maarten Sap, Swabha Swayamdipta, Laura Vianna, Xuhui Zhou, Yejin Choi, and Noah A. Smith. 2022. Annotators with attitudes: How annotator beliefs and identities bias toxic language detection. In Proceedings of the 2022 Conference of the North American Chapter of the Association for Computational Linguistics: Human Language Technologies, pages 5884–5906, Seattle, United States. Association for Computational Linguistics.
- Shen and Rose (2021) Qinlan Shen and Carolyn Rose. 2021. What sounds “right” to me? experiential factors in the perception of political ideology. In Proceedings of the 16th Conference of the European Chapter of the Association for Computational Linguistics: Main Volume, pages 1762–1771, Online. Association for Computational Linguistics.
- Tay et al. (2023) Yi Tay, Mostafa Dehghani, Vinh Q. Tran, Xavier Garcia, Jason Wei, Xuezhi Wang, Hyung Won Chung, Dara Bahri, Tal Schuster, Huaixiu Steven Zheng, Denny Zhou, Neil Houlsby, and Donald Metzler. 2023. UL2: unifying language learning paradigms. In The Eleventh International Conference on Learning Representations, ICLR 2023, Kigali, Rwanda, May 1-5, 2023. OpenReview.net.
- Uma et al. (2021) Alexandra N Uma, Tommaso Fornaciari, Dirk Hovy, Silviu Paun, Barbara Plank, and Massimo Poesio. 2021. Learning from disagreement: A survey. Journal of Artificial Intelligence Research, 72:1385–1470.
- Ungless et al. (2023) Eddie Ungless, Bjorn Ross, and Anne Lauscher. 2023. Stereotypes and smut: The (mis)representation of non-cisgender identities by text-to-image models. In Findings of the Association for Computational Linguistics: ACL 2023, pages 7919–7942, Toronto, Canada. Association for Computational Linguistics.
- Wan et al. (2023) Ruyuan Wan, Jaehyung Kim, and Dongyeop Kang. 2023. Everyone’s voice matters: Quantifying annotation disagreement using demographic information. In Thirty-Seventh AAAI Conference on Artificial Intelligence, AAAI 2023, Thirty-Fifth Conference on Innovative Applications of Artificial Intelligence, IAAI 2023, Thirteenth Symposium on Educational Advances in Artificial Intelligence, EAAI 2023, Washington, DC, USA, February 7-14, 2023, pages 14523–14530. AAAI Press.
- Wang et al. (2022) Yizhong Wang, Swaroop Mishra, Pegah Alipoormolabashi, Yeganeh Kordi, Amirreza Mirzaei, Atharva Naik, Arjun Ashok, Arut Selvan Dhanasekaran, Anjana Arunkumar, David Stap, Eshaan Pathak, Giannis Karamanolakis, Haizhi Lai, Ishan Purohit, Ishani Mondal, Jacob Anderson, Kirby Kuznia, Krima Doshi, Kuntal Kumar Pal, Maitreya Patel, Mehrad Moradshahi, Mihir Parmar, Mirali Purohit, Neeraj Varshney, Phani Rohitha Kaza, Pulkit Verma, Ravsehaj Singh Puri, Rushang Karia, Savan Doshi, Shailaja Keyur Sampat, Siddhartha Mishra, Sujan Reddy A, Sumanta Patro, Tanay Dixit, and Xudong Shen. 2022. Super-NaturalInstructions: Generalization via declarative instructions on 1600+ NLP tasks. In Proceedings of the 2022 Conference on Empirical Methods in Natural Language Processing, pages 5085–5109, Abu Dhabi, United Arab Emirates. Association for Computational Linguistics.
- Waseem (2016) Zeerak Waseem. 2016. Are you a racist or am I seeing things? annotator influence on hate speech detection on Twitter. In Proceedings of the First Workshop on NLP and Computational Social Science, pages 138–142, Austin, Texas. Association for Computational Linguistics.
- Wolf et al. (2020) Thomas Wolf, Lysandre Debut, Victor Sanh, Julien Chaumond, Clement Delangue, Anthony Moi, Pierric Cistac, Tim Rault, Remi Louf, Morgan Funtowicz, Joe Davison, Sam Shleifer, Patrick von Platen, Clara Ma, Yacine Jernite, Julien Plu, Canwen Xu, Teven Le Scao, Sylvain Gugger, Mariama Drame, Quentin Lhoest, and Alexander Rush. 2020. Transformers: State-of-the-art natural language processing. In Proceedings of the 2020 Conference on Empirical Methods in Natural Language Processing: System Demonstrations, pages 38–45, Online. Association for Computational Linguistics.
- Wood (2003) S. N. Wood. 2003. Thin-plate regression splines. Journal of the Royal Statistical Society (B), 65(1):95–114.
- Wood (2004) S. N. Wood. 2004. Stable and efficient multiple smoothing parameter estimation for generalized additive models. Journal of the American Statistical Association, 99(467):673–686.
- Wood (2011) S. N. Wood. 2011. Fast stable restricted maximum likelihood and marginal likelihood estimation of semiparametric generalized linear models. Journal of the Royal Statistical Society (B), 73(1):3–36.
- Wood (2017) Simon N Wood. 2017. Generalized additive models: an introduction with R. CRC press.
- Wood et al. (2016) S.N. Wood, N., Pya, and B. Säfken. 2016. Smoothing parameter and model selection for general smooth models (with discussion). Journal of the American Statistical Association, 111:1548–1575.
- Ye et al. (2023) Jiacheng Ye, Zhiyong Wu, Jiangtao Feng, Tao Yu, and Lingpeng Kong. 2023. Compositional exemplars for in-context learning. In International Conference on Machine Learning, ICML 2023, 23-29 July 2023, Honolulu, Hawaii, USA, volume 202 of Proceedings of Machine Learning Research, pages 39818–39833. PMLR.
- Zhang et al. (2022) Susan Zhang, Stephen Roller, Naman Goyal, Mikel Artetxe, Moya Chen, Shuohui Chen, Christopher Dewan, Mona T. Diab, Xian Li, Xi Victoria Lin, Todor Mihaylov, Myle Ott, Sam Shleifer, Kurt Shuster, Daniel Simig, Punit Singh Koura, Anjali Sridhar, Tianlu Wang, and Luke Zettlemoyer. 2022. OPT: open pre-trained transformer language models. CoRR, abs/2205.01068.
- Zhao et al. (2021) Zihao Zhao, Eric Wallace, Shi Feng, Dan Klein, and Sameer Singh. 2021. Calibrate before use: Improving few-shot performance of language models. In Proceedings of the 38th International Conference on Machine Learning, volume 139 of Proceedings of Machine Learning Research, pages 12697–12706. PMLR.
Appendix A Appendix
A.1 Dataset details
Toxicity - DP.
The DP dataset comprises comments extracted from various online forums, including Twitter, 4chan, and Reddit, spanning from December 2019 to August 2020. These comments underwent annotation via Amazon Mechanical Turk, receiving five annotations per instance. Sociodemographic data of the annotators was gathered, contingent upon the approval of the pertinent Institutional Review Board (IRB). The dataset did not come equipped with a definitive gold label. Therefore, we instituted a majority voting mechanism, leveraging the raw annotations to ascertain the gold label. We exclude instances wherein selected sociodemographic attributes received responses such as "Prefer not to say", instances with multiple selections for the race attribute, and any attributes marked with generic designations like Other or Unknown. This reduced the initial dataset size from 107,620 to 55,364 instances.
Toxicity - Jigsaw.
We filtered all instances where unaggregated annotations were missing, which reduced the dataset size from 1,999,516 to 1,804,874 instances.
Hatespech - GHC.
We filtered all instances where no gold annotation was provided. Thus, the initial dataset size was reduced from 27,553 to 27,434.
Hatespeech - H-Twitter.
For H-Twitter, none of 6,909 instances were filtered.
Stance Detection - SE2016.
We only considered instances were both the aggregated and the complete set of unaggregated annotations were available. In addition, we removed the hashtag ’#SemST’ which was artificially added by the dataset authors. The dataset we used consists of 3,591 instances.
Stance - GWSD.
It is composed of a subset of 2,050 annotated articles, extracted from a larger pool of 56,000 articles on global warming. These articles were published between January 1, 2000, and April 12, 2020, by 63 distinct U.S. news outlets. After filtering instances where no annotations were provided and removing duplicates, 2,042 instances remained of the initial 2,050.
Sentiment - Diaz.
The Diaz dataset is the second dataset where sociodemographic data of the annotators was gathered. We only considered the sociodemographic attributes which were also used in the DP dataset. To remain comparability, we convert the original 5-point answer for political affiliations into a 3-scale by mapping ’Somewhat conservative’ and ’Very conservative’ to ’Conservative’ and ’Somewhat liberal’ and ’Very liberal’ to ’Liberal’. We filtered all instances where annotators replied with Other for the attribute race. The dataset which was used for sampling contains 14,071 instances.
A.2 Sampling Strategy
| Sociodemographic Attribute | Value | Original | Sample (n=1,000) |
| Gender | female | 52.18 | 52.56 |
| male | 47.35 | 46.88 | |
| nonbinary | 00.47 | 00.56 | |
| Race | White | 76.90 | 77.62 |
| Black/African American | 13.12 | 12.40) | |
| Asian | 6.15 | 6.34 | |
| Hispanic | 2.78 | 2.62 | |
| American Indian or Alaska Native | 00.80 | 0.90 | |
| Native Hawaiian or Pacific Islander | 00.24 | 00.12 | |
| Education | Bachelor’s degree in college (4-year) | 41.87 | 42.58 |
| Some college but no degree | 19.18 | 18.38 | |
| Master’s degree | 15.90 | 15.90 | |
| Associate degree in college (2-year) | 10.93 | 10.90 | |
| High school graduate (high school diploma or equivalent including GED) | 8.69 | 8.76 | |
| Professional degree (JD, MD) | 1.59 | 1.80 | |
| Doctoral degree | 1.32 | 1.14 | |
| Less than high school degree | 00.53 | 00.54 | |
| Age Range | 25 - 34 | 39.62 | 39.00 |
| 35 - 44 | 25.03 | 25.08 | |
| 45 - 54 | 13.49 | 13.66 | |
| 18 - 24 | 10.73 | 10.92 | |
| 55 - 64 | 7.70 | 8.08 | |
| 65 or older | 3.41 | 3.26 | |
| Under 18 | 00.02 | 00.00 | |
| Political Affiliation | Liberal | 43.04 | 43.70 |
| Conservative | 28.77 | 28.80 | |
| Independent | 28.18 | 27.50 |
Due to the large number of experiments and varying dataset sizes, we first randomly sample 1,000 instances from each dataset. Here, the label distribution of the samples remained comparable to the corresponding full dataset distribution. To conduct our sociodemographic prompting experiments, we used the original sociodemographic profiles for DP and Diaz datasets while transferring the sociodemographic profiles of the DP samples to the remaining datasets (where no sociodemographic info about the annotators is provided). Thus, the sociodemographic profiles (and their respective distribution) which we use for datasets DP, Jigsaw, GHC, H-Twitter, SE2016, and GWSD are identical (five per instance). We display their distribution (Table 6) and compare it to the distribution of the full DP dataset. As can be seen from the table, both remain comparable.
A.3 Model Details
| Model | Parameters | Context Size | Nr Tasks |
|---|---|---|---|
| InstructGPT | 175B | 4097 | - |
| Flan-T5 | 80M | 512 | 1,836 |
| 250M | 512 | ||
| 780M | 512 | ||
| 3B | 512 | ||
| 11B | 512 | ||
| Flan-UL2 | 20B | 512 | 1,836 |
| Tk-Instruct | 80M | 512 | 1,616 |
| 250M | 512 | ||
| 780M | 512 | ||
| 3B | 512 | ||
| 11B | 512 | ||
| OPT-IML | 1.3B | 2048 | 1,991 |
| 30B | 2048 | ||
| Dolly-V2 | 2.8B | 2560 | 7 |
| 6.9B | 4096 | ||
| 12B | 5120 |
We provide an overview of all models, their size in terms of number of parameters and their context window size in Table 7. For models with parameters less than 3B (i.e. Flan-T5 80M-3B, Tk-Instruct 80M-3B, OPT-IML 3B and Dolly-V2 2.8B) no inference optimization was applied. We used 8-bit optimization for all other models.
Licenses
Models from Flan-T5 , Flan-UL2 , and Tk-Instruct are published using an Apache License 2.0. OPT-IML -based models are published with the OPT-IML 175B LICENSE AGREEMENT which allows usage for non-commercial research purposes. Dolly-V2 is distributed under MIT license.
A.4 Experimental Details
All experiments were conducted using PyTorch (Paszke et al., 2019) 2.0.1, Huggingface Transformers (Wolf et al., 2020) 4.28.1 and CUDA (Nickolls et al., 2008) 11.8 on a computation cluster with a combination of A100 (40GB), A180 (80GB) and H100PCIE (80GB) GPU cards. Depending on the dataset and the GPU in use, we used batch sizes ranging from 4 to 32. We used 8-bit optimization (Dettmers et al., 2022) for models with parameter numbers larger than 3B. For prompting InstructGPT , we used both the OpenAI API and Microsoft Azure API.
A.5 Model Sensitivity
Here, we provide more details regarding the experiments to analyze the sensitivity of instruction-tuned language models when prompted with (or without) sociodemographic information.
A.5.1 Prediction changes per model and dataset
In Figure 6 we display the degree of prediction changes for the different models and datasets.
A.5.2 Prediction changes per sociodemographic attribute
For better overview of the attributes which lead to the most prediction changes, we aggregated the most influential attributes in Table 8. It can be seen that a combination of all sociodemographic attributes leads to the most substantial changes for most of the datasets (64%).
| Model (Params) | DP | Jigsaw | GHC | H-Twitter | SE2016 | GWSD | Diaz |
|---|---|---|---|---|---|---|---|
| InstructGPT (175B) | R (17.30%) | All (8.20%) | R (5.50%) | R (7.90%) | All (9.60%) | All (17.12%) | PA (36.60%) |
| Flan-T5 (80M) | All (3.20%) | All (12.30%) | All (42.50%) | PA (2.60%) | All (14.80%) | All (0.00%) | All (2.30%) |
| Flan-T5 (250M) | A (1.80%) | All (36.40%) | R (16.40%) | All (23.60%) | All (9.10%) | E (33.93%) | All (28.60%) |
| Flan-T5 (780M) | All (34.70%) | All (38.00%) | R (17.30%) | All (29.10%) | All (58.30%) | All (12.91%) | All (38.20%) |
| Flan-T5 (3B) | PA (46.80%) | R (51.90%) | E (38.10%) | All (72.70%) | All (21.70%) | All (47.85%) | All (72.30%) |
| Flan-T5 (11B) | PA (50.40%) | R (41.30%) | R (36.70%) | R (64.90%) | All (55.40%) | All (52.75%) | R (64.00%) |
| Flan-UL2 (20B) | E (25.60%) | G (25.20%) | R (32.80%) | R (56.60%) | All (39.70%) | All (27.63%) | All (35.50%) |
| Tk-Instruct (80M) | All (39.00%) | All (2.00%) | All (0.60%) | R (58.40%) | All (5.70%) | All (50.95%) | All (0.00%) |
| Tk-Instruct (250M) | All (21.40%) | All (1.60%) | All (5.20%) | All (39.00%) | All (13.50%) | R (0.80%) | All (23.30%) |
| Tk-Instruct (780M) | All (67.90%) | PA (14.80%) | All (17.70%) | All (9.40%) | All (24.70%) | E (12.61%) | All (7.00%) |
| Tk-Instruct (3B) | All (18.80%) | PA (7.90%) | All (27.80%) | All (55.00%) | All (65.70%) | All (46.55%) | All (77.70%) |
| Tk-Instruct (11B) | All (45.20%) | All (32.80%) | R (19.20%) | All (36.00%) | All (17.70%) | All (36.74%) | All (46.20%) |
| OPT-IML (1.3B) | PA (22.00%) | R (30.00%) | R (34.20%) | All (27.60%) | G (4.70%) | All (23.42%) | All (37.90%) |
| OPT-IML (30B) | All (12.50%) | R (12.90%) | All (9.30%) | R (9.90%) | E (8.80%) | R (14.61%) | All (28.50%) |
| Dolly-V2 (2.8B) | All (83.60%) | All (6.20%) | All (13.60%) | All (0.40%) | All (46.00%) | All (0.90%) | All (89.90%) |
| Dolly-V2 (6.9B) | All (48.60%) | All (10.40%) | All (9.50%) | All (0.30%) | G (39.10%) | PA (53.65%) | PA (64.90%) |
| Dolly-V2 (12B) | E (59.80%) | All (20.30%) | A (35.80%) | PA (29.80%) | G (16.20%) | A (14.61%) | PA (19.60%) |
A.6 Zero-Shot Prompting using sociodemographic information
A.6.1 Predicting annotator-specific annotations
As extension to the results provided in §6, in Table 9 we provide the results for all models when predicting an annotator-specific annotation with the same sociodemographic profile as provided in the prompt.
The largest models in our experiments (20B, 30B, 175B) all benefit from integrating the sociodemographic information provided with the original annotation. However, for smaller models there is no consistent trend of improvement observable. Interestingly, most models from instruction-tuned model families based on T5 (Flan-T5 , Tk-Instruct ) and Pythia (Dolly-V2 ) are not able to outperform random guessing. This is independent of the model size.
| Toxicity - DP | Sentiment - Diaz | |||
| Model | Acc | F1 | Acc | F1 |
| Random | .19 | .17 | .20 | .17 |
| Majority | .06 | .02 | .09 | .03 |
| InstructGPT (175B) | .43 | .26 | .34 | .26 |
| InstructGPT (175B)+SD | .44 | .26 | .37 | .31 |
| Flan-T5 (80M) | .50 | .15 | .09 | .04 |
| Flan-T5 (80M)+SD | .51 | .14 | .09 | .04 |
| Flan-T5 (250M) | .20 | .07 | .15 | .10 |
| Flan-T5 (250M)+SD | .19 | .07 | .17 | .11 |
| Flan-T5 (780M) | .20 | .09 | .20 | .10 |
| Flan-T5 (780M)+SD | .18 | .11 | .33 | .13 |
| Flan-T5 (3B) | .51 | .14 | .12 | .07 |
| Flan-T5 (3B)+SD | .30 | .15 | .36 | .13 |
| Flan-T5 (11B) | .25 | .15 | .29 | .17 |
| Flan-T5 (11B)+SD | .19 | .12 | .26 | .17 |
| Flan-UL2 (20B) | .36 | .16 | .08 | .06 |
| Flan-UL2 (20B)+SD | .40 | .14 | .15 | .11 |
| Tk-Instruct (80M) | .18 | .08 | .05 | .02 |
| Tk-Instruct (80M)+SD | .12 | .08 | .05 | .02 |
| Tk-Instruct (250M) | .18 | .11 | .05 | .02 |
| Tk-Instruct (250M)+SD | .22 | .11 | .04 | .03 |
| Tk-Instruct (780M) | .42 | .18 | .05 | .02 |
| Tk-Instruct (780M)+SD | .19 | .13 | .05 | .03 |
| Tk-Instruct (3B) | .49 | .16 | .15 | .12 |
| Tk-Instruct (3B)+SD | .40 | .16 | .38 | .15 |
| Tk-Instruct (11B) | .18 | .11 | .11 | .10 |
| Tk-Instruct (11B)+SD | .15 | .12 | .14 | .13 |
| OPT-IML (1.3B) | .44 | .18 | .28 | .24 |
| OPT-IML (1.3B)+SD | .48 | .18 | .27 | .22 |
| OPT-IML (30B) | .42 | .18 | .28 | .26 |
| OPT-IML (30B)+SD | .45 | .18 | .32 | .27 |
| Dolly-V2 (2.8B) | .29 | .16 | .07 | .07 |
| Dolly-V2 (2.8B)+SD | .12 | .09 | .15 | .13 |
| Dolly-V2 (6.9B) | .43 | .16 | .21 | .21 |
| Dolly-V2 (6.9B)+SD | .27 | .16 | .11 | .16 |
| Dolly-V2 (12B) | .09 | .08 | .26 | .13 |
| Dolly-V2 (12B)+SD | .12 | .12 | .26 | .15 |
A.6.2 Predicting aggregated annotations
The complete list of results for zero-shot prompting using sociodemographic profiles is provided in Table 10 (hard evaluation) and Table 11 (soft evaluation). The good performance of models from the Tk-Instruct family on the Jigsaw dataset is most likely due to the dataset being present in the dataset which was used for instruction-finetuning (Wang et al., 2022). The authors report toxic language detection with 40 datasets being one of the most prominent tasks among all. Some of the results for GWSD can be explained in a similar vein as stance detection has been part of the instruction-tuning tasks present in the dataset.
| Toxicity | Hatespeech | Stance Detection | Sentiment | ||||||||||||
| DP | Jigsaw | GHC | H-Twitter | SE2016 | GWSD | Diaz | |||||||||
| Model | Avg | Acc | F1 | Acc | F1 | Acc | F1 | Acc | F1 | Acc | F1 | Acc | F1 | Acc | F1 |
| InstructGPT(175B) | .66 | .48 | .27 | .76 | .59 | .89 | .75 | .87 | .57 | .53 | .51 | .72 | .69 | .36 | .33 |
| InstructGPT(175B)+SD | .66 | .51 | .28 | .79 | .60 | .89 | .74 | .86 | .53 | .52 | .52 | .69 | .68 | .39 | .33 |
| Flan-T5(80M) | .27 | .61 | .17 | .21 | .21 | .32 | .31 | .01 | .00 | .21 | .13 | .45 | .21 | .06 | .03 |
| Flan-T5(80M)+SD | .33 | .61 | .16 | .32 | .30 | .64 | .48 | .01 | .01 | .24 | .17 | .45 | .21 | .06 | .03 |
| Flan-T5(250M) | .34 | .17 | .06 | .40 | .33 | .19 | .19 | .63 | .20 | .56 | .27 | .27 | .21 | .13 | .08 |
| Flan-T5(250M)+SD | .33 | .16 | .06 | .12 | .12 | .22 | .22 | .84 | .23 | .54 | .28 | .25 | .21 | .15 | .09 |
| Flan-T5(780M) | .29 | .18 | .09 | .54 | .38 | .29 | .26 | .05 | .04 | .37 | .26 | .42 | .21 | .20 | .10 |
| Flan-T5(780M)+SD | .24 | .16 | .09 | .22 | .21 | .24 | .22 | .09 | .07 | .24 | .21 | .40 | .23 | .36 | .13 |
| Flan-T5(3B) | .34 | .61 | .16 | .67 | .54 | .37 | .35 | .09 | .06 | .26 | .22 | .30 | .25 | .10 | .06 |
| Flan-T5(3B)+SD | .32 | .35 | .15 | .55 | .45 | .21 | .19 | .02 | .01 | .23 | .20 | .46 | .37 | .42 | .13 |
| Flan-T5(11B) | .38 | .23 | .14 | .42 | .34 | .38 | .33 | .67 | .21 | .30 | .26 | .36 | .27 | .32 | .16 |
| Flan-T5(11B)+SD | .25 | .17 | .10 | .13 | .13 | .16 | .16 | .27 | .12 | .33 | .24 | .40 | .33 | .28 | .16 |
| Flan-UL(20B) | .29 | .43 | .17 | .63 | .39 | .39 | .30 | .01 | .01 | .15 | .15 | .34 | .20 | .07 | .05 |
| Flan-UL(20B)+SD | .29 | .50 | .14 | .64 | .39 | .21 | .18 | .03 | .03 | .16 | .11 | .34 | .19 | .16 | .10 |
| Tk-Instruct(80M) | .52 | .15 | .07 | .90 | .48 | .87 | .46 | .70 | .24 | .58 | .25 | .44 | .23 | .03 | .01 |
| Tk-Instruct(80M)+SD | .46 | .10 | .06 | .88 | .49 | .86 | .46 | .41 | .17 | .56 | .26 | .41 | .30 | .03 | .01 |
| Tk-Instruct(250M) | .46 | .17 | .11 | .90 | .49 | .85 | .47 | .66 | .21 | .25 | .18 | .35 | .17 | .03 | .02 |
| Tk-Instruct(250M)+SD | .43 | .23 | .11 | .91 | .51 | .82 | .49 | .45 | .16 | .21 | .13 | .36 | .18 | .03 | .02 |
| Tk-Instruct(780M) | .48 | .48 | .17 | .71 | .50 | .72 | .50 | .77 | .23 | .22 | .18 | .43 | .26 | .03 | .01 |
| Tk-Instruct(780M)+SD | .46 | .17 | .11 | .77 | .50 | .81 | .48 | .80 | .23 | .20 | .17 | .43 | .24 | .03 | .02 |
| Tk-Instruct(3B) | .44 | .59 | .17 | .83 | .46 | .38 | .33 | .22 | .11 | .48 | .38 | .47 | .37 | .14 | .11 |
| Tk-Instruct(3B)+SD | .46 | .50 | .15 | .89 | .47 | .52 | .37 | .15 | .08 | .31 | .32 | .44 | .30 | .43 | .14 |
| Tk-Instruct(11B) | .35 | .14 | .09 | .62 | .48 | .72 | .56 | .36 | .15 | .24 | .19 | .30 | .29 | .10 | .09 |
| Tk-Instruct(11B)+SD | .37 | .13 | .10 | .72 | .47 | .74 | .57 | .27 | .13 | .27 | .21 | .33 | .28 | .11 | .10 |
| OPT-IML(1.3B) | .53 | .53 | .19 | .38 | .35 | .57 | .50 | .78 | .43 | .60 | .31 | .54 | .45 | .28 | .24 |
| OPT-IML(1.3B)+SD | .54 | .61 | .21 | .40 | .37 | .69 | .59 | .69 | .38 | .60 | .28 | .47 | .38 | .29 | .24 |
| OPT-IML(30B) | .60 | .50 | .19 | .58 | .49 | .80 | .69 | .84 | .54 | .67 | .53 | .57 | .50 | .27 | .24 |
| OPT-IML(30B)+SD | .63 | .55 | .20 | .64 | .53 | .85 | .74 | .86 | .57 | .65 | .51 | .52 | .39 | .35 | .29 |
| Dolly-V2(2.8B) | .22 | .33 | .17 | .13 | .13 | .25 | .25 | .14 | .06 | .25 | .25 | .36 | .19 | .05 | .06 |
| Dolly-V2(2.8B)+SD | .19 | .09 | .06 | .14 | .14 | .25 | .25 | .14 | .06 | .21 | .20 | .35 | .18 | .12 | .11 |
| Dolly-V2(6.9B) | .26 | .50 | .17 | .14 | .14 | .20 | .20 | .14 | .06 | .30 | .23 | .31 | .27 | .20 | .20 |
| Dolly-V2(6.9B)+SD | .21 | .30 | .15 | .15 | .15 | .16 | .16 | .14 | .06 | .31 | .23 | .33 | .28 | .07 | .06 |
| Dolly-V2(12B) | .32 | .07 | .06 | .22 | .22 | .47 | .43 | .38 | .22 | .58 | .31 | .23 | .17 | .27 | .14 |
| Dolly-V2(12B)+SD | .28 | .08 | .08 | .27 | .26 | .43 | .41 | .16 | .07 | .59 | .26 | .21 | .15 | .25 | .12 |
| Toxicity | Hatespeech | Stance Detection | Sentiment | ||||||||||||
| DP | Jigsaw | GHC | H-Twitter | SE2016 | GWSD | Diaz | |||||||||
| Model | Avg | CE | JSD | CE | JSD | CE | JSD | CE | JSD | CE | JSD | CE | JSD | CE | JSD |
| InstructGPT(175B) | .21 | 1.42 | .32 | .55 | .15 | .43 | .07 | .88 | .08 | .98 | .27 | .86 | .18 | 1.50 | .37 |
| InstructGPT(175B)+SD | .18 | 1.40 | .29 | .51 | .12 | .42 | .06 | .90 | .08 | .99 | .25 | .89 | .15 | 1.48 | .33 |
| Flan-T5(80M) | .46 | 1.34 | .26 | 1.06 | .50 | .98 | .45 | 1.71 | .68 | 1.25 | .46 | 1.04 | .29 | 1.75 | .59 |
| Flan-T5(80M)+SD | .41 | 1.34 | .25 | .96 | .41 | .66 | .20 | 1.71 | .68 | 1.23 | .43 | 1.04 | .29 | 1.75 | .58 |
| Flan-T5(250M) | .42 | 1.65 | .48 | .88 | .37 | 1.10 | .53 | 1.14 | .26 | 1.00 | .29 | 1.22 | .44 | 1.70 | .54 |
| Flan-T5(250M)+SD | .40 | 1.65 | .48 | 1.14 | .55 | 1.06 | .49 | .94 | .12 | 1.01 | .28 | 1.23 | .42 | 1.67 | .49 |
| Flan-T5(780M) | .44 | 1.65 | .48 | .75 | .29 | .97 | .44 | 1.68 | .66 | 1.16 | .41 | 1.06 | .30 | 1.65 | .50 |
| Flan-T5(780M)+SD | .42 | 1.67 | .45 | 1.03 | .44 | 1.00 | .44 | 1.64 | .60 | 1.25 | .41 | 1.07 | .28 | 1.51 | .35 |
| Flan-T5(3B) | .42 | 1.34 | .26 | .64 | .22 | .94 | .42 | 1.63 | .61 | 1.25 | .48 | 1.18 | .42 | 1.72 | .56 |
| Flan-T5(3B)+SD | .40 | 1.54 | .37 | .75 | .25 | 1.05 | .47 | 1.70 | .67 | 1.28 | .47 | 1.06 | .26 | 1.49 | .34 |
| Flan-T5(11B) | .38 | 1.60 | .45 | .86 | .36 | .89 | .39 | 1.10 | .24 | 1.21 | .44 | 1.11 | .34 | 1.55 | .41 |
| Flan-T5(11B)+SD | .39 | 1.66 | .43 | 1.11 | .49 | 1.08 | .46 | 1.47 | .43 | 1.18 | .34 | 1.10 | .23 | 1.59 | .35 |
| Flan-UL(20B) | .45 | 1.49 | .37 | .67 | .24 | .87 | .38 | 1.71 | .67 | 1.32 | .51 | 1.13 | .36 | 1.77 | .61 |
| Flan-UL(20B)+SD | .41 | 1.44 | .31 | .67 | .21 | 1.03 | .46 | 1.69 | .64 | 1.30 | .48 | 1.12 | .31 | 1.69 | .49 |
| Tk-Instruct(80M) | .29 | 1.67 | .50 | .41 | .06 | .42 | .06 | 1.07 | .21 | .98 | .28 | 1.05 | .30 | 1.80 | .64 |
| Tk-Instruct(80M)+SD | .32 | 1.73 | .54 | .42 | .06 | .42 | .06 | 1.34 | .37 | 1.00 | .28 | 1.07 | .27 | 1.80 | .64 |
| Tk-Instruct(250M) | .33 | 1.67 | .52 | .40 | .05 | .43 | .07 | 1.11 | .24 | 1.23 | .44 | 1.11 | .35 | 1.80 | .64 |
| Tk-Instruct(250M)+SD | .34 | 1.63 | .45 | .41 | .05 | .47 | .09 | 1.31 | .35 | 1.25 | .45 | 1.11 | .35 | 1.80 | .64 |
| Tk-Instruct(780M) | .33 | 1.43 | .32 | .58 | .17 | .56 | .16 | 1.00 | .17 | 1.28 | .50 | 1.07 | .32 | 1.80 | .64 |
| Tk-Instruct(780M)+SD | .31 | 1.66 | .45 | .54 | .12 | .49 | .09 | 1.03 | .16 | 1.29 | .44 | 1.06 | .29 | 1.79 | .63 |
| Tk-Instruct(3B) | .35 | 1.36 | .27 | .48 | .10 | .90 | .40 | 1.50 | .53 | 1.07 | .35 | 1.02 | .28 | 1.69 | .54 |
| Tk-Instruct(3B)+SD | .29 | 1.44 | .29 | .43 | .06 | .77 | .26 | 1.56 | .52 | 1.19 | .35 | 1.05 | .25 | 1.47 | .32 |
| Tk-Instruct(11B) | .4 | 1.67 | .50 | .68 | .24 | .56 | .16 | 1.37 | .43 | 1.27 | .49 | 1.19 | .43 | 1.74 | .58 |
| Tk-Instruct(11B)+SD | .36 | 1.70 | .48 | .58 | .13 | .56 | .12 | 1.46 | .46 | 1.25 | .45 | 1.15 | .34 | 1.71 | .52 |
| OPT-IML(1.3B) | .29 | 1.40 | .31 | .90 | .39 | .72 | .27 | .96 | .13 | .97 | .27 | .98 | .26 | 1.57 | .43 |
| OPT-IML(1.3B)+SD | .25 | 1.36 | .24 | .88 | .32 | .63 | .16 | 1.07 | .15 | .97 | .26 | 1.03 | .25 | 1.57 | .36 |
| OPT-IML(30B) | .24 | 1.43 | .33 | .71 | .26 | .52 | .13 | .90 | .10 | .90 | .22 | .95 | .23 | 1.57 | .42 |
| OPT-IML(30B)+SD | .20 | 1.40 | .29 | .66 | .20 | .48 | .09 | .89 | .07 | .91 | .21 | .99 | .23 | 1.52 | .32 |
| Dolly-V2(2.8B) | .49 | 1.55 | .43 | 1.14 | .55 | 1.03 | .48 | 1.55 | .55 | 1.24 | .46 | 1.10 | .35 | 1.77 | .61 |
| Dolly-V2(2.8B)+SD | .48 | 1.73 | .54 | 1.11 | .52 | 1.03 | .47 | 1.55 | .55 | 1.25 | .43 | 1.11 | .35 | 1.69 | .49 |
| Dolly-V2(6.9B) | .47 | 1.42 | .32 | 1.13 | .55 | 1.09 | .52 | 1.55 | .54 | 1.22 | .45 | 1.19 | .42 | 1.63 | .48 |
| Dolly-V2(6.9B)+SD | .44 | 1.57 | .35 | 1.10 | .49 | 1.10 | .50 | 1.55 | .54 | 1.20 | .36 | 1.17 | .33 | 1.73 | .53 |
| Dolly-V2(12B) | .43 | 1.76 | .58 | 1.05 | .50 | .83 | .34 | 1.33 | .40 | .98 | .28 | 1.27 | .49 | 1.58 | .43 |
| Dolly-V2(12B)+SD | .40 | 1.73 | .48 | .97 | .38 | .86 | .31 | 1.51 | .50 | .98 | .26 | 1.27 | .45 | 1.59 | .39 |
A.7 Influence of model choice on prediction outcomes
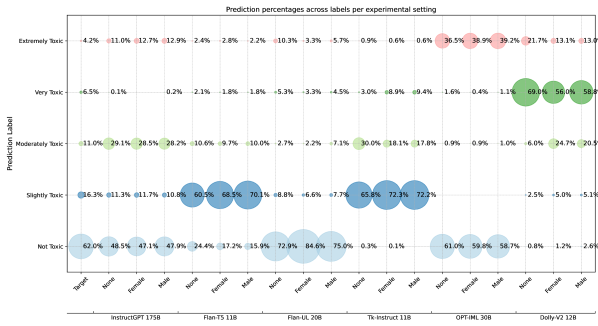

We provide more detailed model comparisons of prediction outcomes in Figure 7 for the DP dataset and in Figure 8 for the SE2016 dataset, respectively. For both datasets and the sociodemographic attributes tested (Gender for DP, Political Affiliation for SE2016), we observe that the model choice has a larger influence on the label prediction than the value of the sociodemographic attribute.
A.8 Robustness Analysis
| Identifier | Format |
|---|---|
| 1 |
Given a text, how would a person of gender {gender}, race ’{race}’, age ’{age}’, education level ’{education}’ and political affiliation ’{political_affiliation}’ rate the degree of toxicity in the text. Possible values are ’not toxic’, ’slightly toxic’, ’moderately toxic’, ’very toxic’ or ’extremely toxic’.
Text: ’{text}’ Toxicity: |
| 2 |
Imagine you are a person of gender {gender}, race ’{race}’, age ’{age}’, education level ’{education}’ and political affiliation ’{political_affiliation}’. Given a text, how would you rate the degree of toxicity in the text. Possible values are ’not toxic’, ’slightly toxic’, ’moderately toxic’, ’very toxic’ or ’extremely toxic’.
Text: ’{text}’ Toxicity: |
| 3 |
Person: {gender}, {race}, {age}, {education}, {political_affiliation}
Text: ’{text}’ Toxicity (’not toxic’|’slightly toxic’|’moderately toxic’|’very toxic’|’extremely toxic’): |
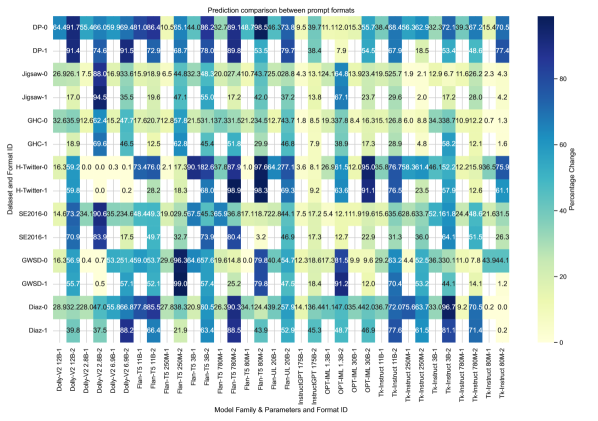
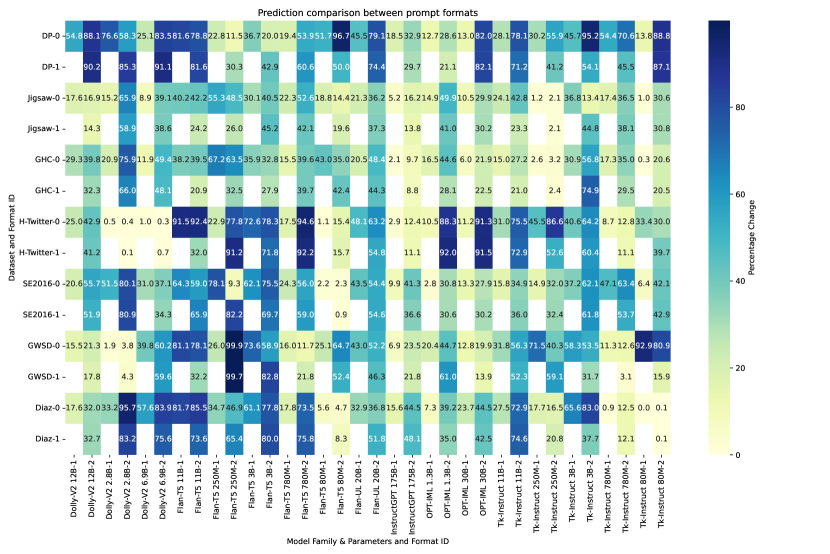
Several works demonstrated the brittleness of zero-shot and few-shot predictions of language models (Min et al., 2022) due to factors such as the prompt format or the order of the in-context examples (Zhao et al., 2021; Lu et al., 2022). Thus, we evaluate if our results are subject to such variations, by repeating our experiments using three different prompt formulations. The prompt formulations are displayed in Table 12. The complete results are shown in Figure 9 (with sociodemographic information) and Figure 10 (without sociodemographic information).
We observe that most differences are induced when comparing the prompt using a minimal formulation (format 2) with the more elaborate versions (format 0,1). Structurally, we see that prompting both with and without sociodemographic information is affected by the prompt formulation to a large extent.
A.9 GLMM Analyses
In addition to the reported percentages of label changes (Figure 3), classification performance measures (Tables 3 and 4), and disagreement prediction performance (Figure 5), we conduct statistical analyses using generalized linear mixed models (GLMMs). GLMMs allow us to statistically account for various fixed and random effects and, thereby, account for potential confounders and statistical dependencies in our data. We thus fit four GLMs/GLMMs for (i) the model sensitivity experiment (Section 5), (ii) the prediction of individual (original) annotations (Section 6), (iii) the prediction of aggregated annotations (Section 6), and (iv) the prediction of ambiguous instances (LABEL:app:sec:ambig_instances). We model the respective binary label changes, classification accuracies, and disagreement prediction accuracies on an instance level across datasets. We use R (R Core Team, 2023) and mgcv 1.8-42 (Wood, 2011; Wood et al., 2016; Wood, 2004, 2017, 2003) to fit all our models.
A.9.1 Model Specifications
We fit binomial models (logit link) and include the factors (a) model family (e.g., Flan-T5), (b) model size (logarithmic), (c) task (e.g., sentiment analysis), (d) text length in characters (i.e., length of the text to be classified), and (e) additional prompt length in characters (i.e., length of the entire prompt excluding the text to be classified) as fixed effects for all models. We additionally model the specific dataset as a random effect to account for structural dependencies stemming from the choice of dataset for all models except the (second) model that predicts individual annotations as, for this experiment, there only is one dataset per task. In the following, we specify the predictor variable and additional covariates for the four models.
Sensitivity Model.
We model the probability of a label change between standard and SD prompting.
Individual Annotations Model.
We model the probability of a model predicting the correct (individually-annotated) class label. We additionally include the prompting method used (standard or sociodemographic prompting) as a fixed effect. To gain further insights on the interaction of using sociodemographic prompting with model size, family, or text length, we additionally model all pairwise interactions between prompting method and the fixed effects listed above.
Aggregated Annotations Model.
In this model, we predict the probability of a model predicting the correct aggregated label. We include the same model terms as the previous model and additionally include a random effect of dataset.
Ambiguity Model.
We model the probability of successfully predicting annotator disagreement as the predictor variable. The included fixed and random effects are identical to the sensitivity model.
A.9.2 Results
| Term | df | p | |
|---|---|---|---|
| model size | 1 | 2769.41 | <0.001 |
| text length | 1 | 7.15 | 0.01 |
| additional prompt length | 1 | 2.35 | 0.13 |
| model family | 5 | 3937.76 | <0.001 |
| task | 3 | 2.72 | 0.44 |
| Term | df | p | |
|---|---|---|---|
| model size | 1 | 564.29 | <0.001 |
| text length | 1 | 28.88 | <0.001 |
| additional prompt length | 1 | 0.70 | 0.40 |
| model family | 5 | 579.84 | <0.001 |
| task | 3 | 5.92 | 0.12 |
Sensitivity Model.
Table 13 displays the test statistics regarding the parametric fixed terms of the sensitivity model. We observe a statistically significant positive effect of model size (=0.56, 95% CI [0.54, 0.58], <0.001), a significant negative effect of text length (=-1.69e-04, 95% CI [-2.93e-04, -4.51e-05], =0.007), and a statistically significant effect of model family (=3937.76, <0.001). A post hoc Wald comparison of the contrasts for model family revealed significant differences between all pairs of model families. The corresponding estimates are (in descending order) Flan-T5 (=0.58, 95% CI [0.53, 0.63]), Tk-Instruct (=0.33, 95% CI [0.28, 0.37]), Flan-UL (=-0.21, 95% CI [-0.27, -0.14]), OPT-IML (=-0.64, 95% CI [-0.70, -0.59]), and InstructGPT (=-1.90, 95% CI [-1.99, -1.82]). Note that the estimate for Dolly-V2 is fixed as the reference level.
Individual Annotations Model.
Table 15 displays the test statistics regarding the parametric fixed terms of the individual annotation prediction model. As, in contrast to the sensitivity model, that modelled the effect of SD prompting within the predictor variable, this model includes SD prompting as a covariate, we focus on effects involving the prompting method variable.444The interpretation of, e.g., the statistically significant effect of text length is that it has an overall impact on prediction accuracy for both, standard prompting as well as SD prompting. Instead of this main effect, we are interested in the interaction effect, i.e., the relevance of text length particularly when SD prompting is used. While we do not find a significant main effect of using SD prompting, we observe several interaction effects of SD prompting. Concretely, we observe a statistically significant negative interaction effect of model size and SD prompting (=-0.12, 95% CI [-0.15, -0.09], <0.001), a statistically significant positive interaction effect of text length and SD prompting (=6.95e-04, 95% CI [4.91e-04, 8.99e-04], <0.001), and a statistically significant negative interaction effect of model family and SD prompting (=561.33, <0.001). A post hoc Wald comparison of the contrasts for model family using SD prompting revealed significant differences between all pairs of model families. The corresponding estimates are (in descending order) InstructGPT (=-0.02, 95% CI [-0.13, 0.10]), OPT-IML (=-0.13, 95% CI [-0.23, -0.03]), Flan-T5 (=-0.63, 95% CI [-0.73, -0.53]), Tk-Instruct (=-0.73, 95% CI [-0.84, -0.63]) and Dolly-V2 (=-0.85, 95% CI [-0.95, -0.75]). Note that the estimate for Flan-UL2 is fixed as the reference level.
Aggregated Annotations Model.
Table 16 displays the test statistics regarding the parametric fixed terms of the aggregated annotation prediction model. As for the previous model, we focus our discussion on effects involving SD prompting. We observe a statistically significant negative interaction effect of model size and SD prompting (=-0.08, 95% CI [-0.10, -0.05], <0.001), a statistically significant negative interaction effect of additional prompt length and SD prompting (=-1.71e-03, 95% CI [-2.36e-03, -1.06e-03], <0.001), a statistically significant interaction effect of model family and SD prompting (=101.29, <0.001), and a statistically significant interaction effect of task and SD prompting (=309.46, <0.001). For model family, a post hoc Wald comparison of the contrasts for model family using SD prompting revealed significant differences between all pairs of model families except Flan-UL2 and Flan-T5 . The corresponding estimates are (in descending order) InstructGPT (=0.06, 95% CI [-0.05, 0.17]), OPT-IML (=0.01, 95% CI [-0.08, 0.10]), Tk-Instruct (=-0.20, 95% CI [-0.28, -0.11]). Dolly-V2 (=-0.22, 95% CI [-0.31, -0.13]), and Flan-T5 (=-0.26, 95% CI [-0.35, -0.17]), Note that the estimate for Flan-UL2 is fixed as the reference level. For task, a post hoc Wald comparison of the contrasts for task using SD prompting revealed significant differences between hatespeech and sentiment, sentiment and toxicity, and sentiment and stance. The corresponding estimates are (in descending order) sentiment (=0.58, 95% CI [0.50, 0.65]), stance (=0.17, 95% CI [0.11, 0.22]), toxicity (=-0.06, 95% CI [-0.10, -8.25e-03]), and Note that the estimate for hatespeech is fixed as the reference level.
Ambiguity Model.
Table 14 displays the test statistics regarding the parametric fixed terms of the disagreement prediction model. We observe a statistically significant positive effect of model size (=0.22, 95% CI [0.21, 0.24], <0.001), a significant negative effect of text length (=-2.72e-04, 95% CI [-3.71e-04, -1.73e-04], <0.001), and a statistically significant effect of model family (=579.84, <0.001). A post hoc Wald comparison of the contrasts for model family revealed significant differences between all pairs of model families except Flan-UL2 and InstructGPT . The corresponding estimates are (in descending order) Dolly-V2 (=0.58, 95% CI [0.52, 0.64]), Flan-T5 (=0.53, 95% CI [0.47, 0.58]), Tk-Instruct (=0.40, 95% CI [0.34, 0.45]), OPT-IML (=0.30, 95% CI [0.24, 0.36]), and InstructGPT (=0.03, 95% CI [-0.04, 0.10]), Note that the estimate for Flan-UL2 is fixed as the reference level.
| Term | df | p | |
|---|---|---|---|
| model size | 1 | 0.44 | 0.51 |
| text length | 1 | 10.98 | <0.001 |
| additional prompt length | 1.00 | 0.01 | 0.92 |
| model family | 5 | 990.68 | <0.001 |
| task | 1 | 1.31 | 0.25 |
| prompting method | 1 | 0.0 | 1.0 |
| model size : prompting method | 1 | 50.61 | <0.001 |
| text length : prompting method | 1 | 44.54 | <0.001 |
| additional prompt length : prompting method | 1 | 0.01 | 0.93 |
| model family : prompting method | 5 | 561.33 | <0.001 |
| task : prompting method | 1 | 0.00 | 0.99 |
| Term | df | p | |
|---|---|---|---|
| model size | 1 | 3.09 | 0.08 |
| text length | 1 | 6.42 | 0.01 |
| additional prompt length | 1 | 0.83 | 0.36 |
| model family | 5 | 6470.73 | <0.001 |
| task | 3 | 18.31 | <0.001 |
| prompting method | 1 | 45.40 | <0.001 |
| model size : prompting method | 1 | 30.04 | <0.001 |
| text length : prompting method | 1 | 2.79 | 0.09 |
| additional prompt length : prompting method | 1 | 26.84 | <0.001 |
| model family : prompting method | 5 | 101.29 | <0.001 |
| task : prompting method | 3 | 309.46 | <0.001 |