Original Article \paperfieldJournal Section \abbrevsESG, Environmental, social, and governance. TF-IDF, Term Frequency-Inverse Document Frequency. \corraddressAntai College of Economics and Management Shanghai Jiao Tong University Shanghai, shanghai, 200030, China \corremailzengsaixing at sjtu dot edu dot cn \presentadd[\authfn2]Antai College of Economics and Management Shanghai Jiao Tong University Shanghai, shanghai, 200030, China \fundinginfoFunder One, Funder One Department, Grant/Award Number: 123456, 123457 and 123458; Funder Two, Funder Two Department, Grant/Award Number: 123459
Dynamic Analysis of Corporate ESG Reports: A Model of Evolutionary Trends
Abstract
Environmental, social, and governance (ESG) reports are globally recognized as a keystone in sustainable enterprise development. This study aims to map the changing landscape of ESG topics within firms in the global market. A dynamic framework is developed to analyze ESG strategic management for individual classes, across multiple classes, and in alignment with a specific sustainability index. The output of these analytical processes forms the foundation of an ESG strategic model. Utilizing a rich collection of 21st-century ESG reports from technology companies, our experiment elucidates the changes in ESG perspectives by incorporating analytical keywords into the proposed framework. This work thus provides an empirical method that reveals the concurrent evolution of ESG topics over recent years.
keywords:
ESG, nature language processing, strategic model, technology company1 Introduction
ESG (environmental, social, and governance) reports are essential to corporate business strategies since they provide a comprehensive assessment of a company’s sustainable development, such as environmental management, social issue practice, and governance structure [1]. ESG reports provide necessary information to stakeholders about how corporate activities match ethical standards, assisting stakeholders’ understanding of equity value creation, risk management, and firm performance [2].
ESG reporting is crucial in the context of sustainable investment as it enables investors to make informed decisions by incorporating environmental, social, and governance factors into their investment processes [3]. It provides transparency, accountability, and comparability across companies, sectors, and regions, allowing investors to evaluate ESG performance, identify risks and opportunities, and benchmark companies [4, 5]. ESG reports are important for companies looking to attract investment capital from institutional investors, such as pension funds, which prioritize ESG considerations [6]. In other words, ESG reporting plays a vital role in promoting transparency, responsible investment practices, and driving companies towards sustainable outcomes [7].
The three elements of environmental, social, and governance play a critical role in determining the direction and performance of organizations in the area of corporate strategy [8]. The ecological effect of a corporation is covered by the environmental component, which includes resource allocation, carbon emissions, and waste management [9]. By strategically addressing environmental concerns, businesses not only contribute to sustainability but also access cost-saving opportunities through efficient resource utilization [10]. The social component examines how a corporation interacts with its stakeholders, covering topics such as employee well-being, community involvement, and ethical business practices [11]. This factor has a significant impact on brand reputation, staff satisfaction, and customer loyalty, supporting long-term sustainability and market competitiveness [12]. Finally, the governance dimension evaluates a business’s internal organization, leadership capabilities, and ethical oversight. Effective governance promotes investors’ confidence and risk reduction by encouraging openness, accessibility, and smart decision-making [13]. Businesses may improve their resilience, reputation, and stakeholder value while putting themselves at the forefront of ethical business practices in an environment that is becoming scrutinized to a greater extent, by aligning their strategic goals with these ESG characteristics [14].
ESG reporting holds crucial importance for technology firms due to its role in aligning business operations with evolving societal expectations, regulatory landscapes, and stakeholder demands [15]. Given the rapid pace of change in the technology industry, where new trends and challenges regularly emerge, ESG reports provide a framework for tech firms to navigate these dynamic shifts while demonstrating responsible conduct, managing risks, and maintaining resilience in a highly competitive and transformative environment [16]. Technology companies should prioritize ESG issues in order to proactively manage the possible demands of governmental legislation and public opinion, protecting their reputational capital, regulatory compliance, and sustainable growth within the intricate and closely watched environment of the technology industry [17]. To strategically capitalize on opportunities for increased publicity and the cultivation of a positive market image, including initiatives such as ESG investment and the integration of ESG principles into their business strategies, technology firms are required to monitor and engage with emerging ESG topics [18, 19]. By doing so, they build stakeholder trust and position themselves as responsible and forward-thinking corporate entities within the business environment.
The myriad of diverse reports available in the market poses a significant challenge for management researchers [20]. The demand for extensive human involvement in data collection, identification, measurement, knowledge transfer, and analysis necessitates substantial resources for management research [21]. Particularly in the 21st century, following the advent of the internet, we are witnessing an era of data explosion [22]. Consequently, there has been an increasing shift toward utilizing computational science technologies to create frameworks capable of automated data analysis [23]. Furthermore, advancements in natural language processing have expanded our capabilities in regard to text-based information extraction [24]. The current study has been designed and conducted in response to this rapid development and to further progress ESG research.
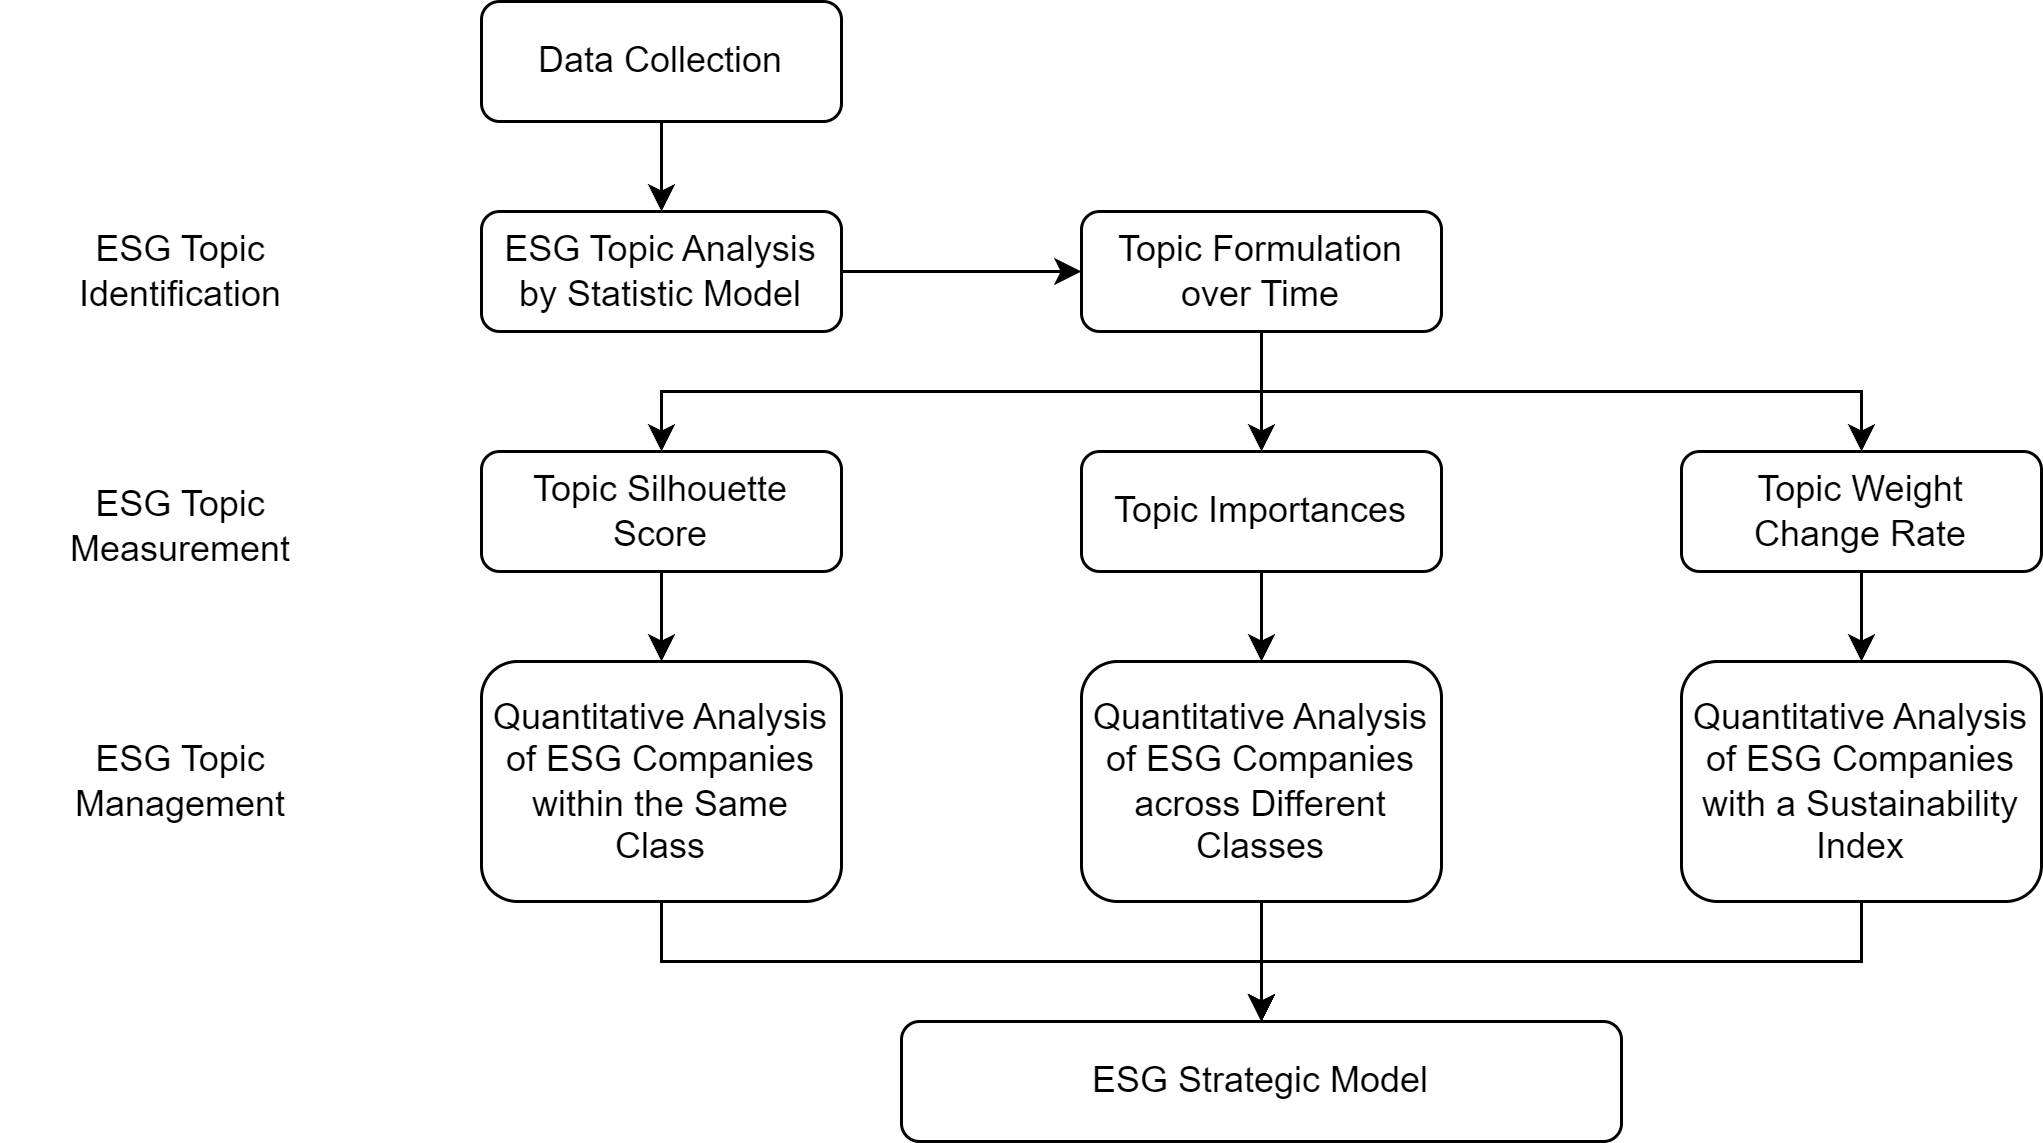
This study sets out with a primary objective to develop an effective approach to dissecting and understanding the evolution of topics found within technology firms’ ESG reports. The overarching goal is to unearth latent dynamic patterns, providing actionable insights that can guide informed managerial decisions. We initiate this process by designing a data preparation module, responsible for crawling ESG reports from open-source networks. These reports are then pre-processed using natural language processing technologies in order to construct our comprehensive ESG dataset. We further delve into the dataset through a multi-faceted analysis, aiming to garner a spatial understanding that translates into quantitative managerial guidance. The resultant quantitative findings subsequently inform the construction of a detailed ESG strategic model. This model acts as a vital tool for visualizing each company’s position in regard to ESG development and guiding the formulation of bespoke strategies. This research introduces a pioneering framework, as visualized in Figure. 1, devised to analyze ESG reports and develop appropriate strategies tailored to diverse business scenarios. We illuminate the evolving trends of topics by extracting crucial text content from ESG reports of technology sector companies.
Our study proficiently identifies and analyzes the evolving patterns inherent in ESG topics. This research enriches legitimacy theory, elucidating firms’ inclination towards the pursuit of conformity rather than differentiation, thus giving rise to a discernible trend of clustering within a shared quadrant. Within the realm of technology corporations, we unveil the phenomenon of ESG homogenization, wherein a significant portion of these entities’ reporting practices progressively align with established norms, a tendency that potentially compromises their capacity for innovation and distinctive engagement.
The structure of this paper unfolds as follows: Section 2 opens with an introduction to contemporary ESG management research, emphasizing the integration of machine learning and other computational technologies in the realm of business strategies. Subsequently, in Section 3, we elucidate our innovative framework and elaborate on the step-by-step procedure for the creation of the ESG strategic model. In Section 4, a comprehensive compilation of 21st-century ESG reports from technology firms is deployed to substantiate the effectiveness of the proposed framework. The concluding remarks are presented in Section 5, where potential avenues for future research building on this study are also discussed.
2 Literature Review
2.1 ESG Reports and ESG Management
ESG reports have evolved from environmental or sustainability reports since the turn of the century. In the first decade of this century, researchers and companies’ perceptions of sustainability have centered on the dimension of environmental protection [25]. However, with the continuous development of information technology and the emergence of new technologies and business models, our understanding of sustainability in both the industry and academia is also evolving [26].In recent years, ESG reports have become increasingly diverse in terms of topics and perspectives [27].
At present, investors and institutions are increasingly acknowledging the criticality of environmental, social, and governance dimensions in appraising prospective investments[28]. Literature indicates the positive correlation between ESG incorporation and a firm’s financial and stock market performance [29]. ESG management not only drives a company’s financial performance and mitigate risk, it is also a catalyst for the alignment of investments with sustainable development goals, resulting in positive environmental and social outcomes [17, 29].
In the sustainable management research landscape, ESG reports are perceived as instrumental tools that facilitate a comprehensive understanding of the complex interplay between business practices and ethical goals [30, 31]. ESG reports provide meticulous documentation of corporate sustainability across all dimensions, thus providing a more comprehensive framework for scholars to assess corporate sustainability performance. ESG reports thus provide researchers in management with a large database and diverse sources enabling exhaustive analysis [32]. With this capability, scholars can examine the impact of various ESG topics on corporate financial performance, green performance, and innovation capabilities [33]. However, the existing literature lacks a dynamic analysis of the evolution of overall ESG trends. Our study will fill this gap, thus providing a more intuitive and quantitative pattern of ESG evolution for management science.
2.2 Text Mining and Analysis
The dawn of the data era, characterized by a rapid accumulation of data resulting from continuous advancements in data storage technology and internet infrastructure, is predominantly witnessed among leading and listed companies [34]. These entities are generating a wealth of textual data, encapsulating their operational environment, strategic developments, and social responsibilities [35]. This unprecedented data explosion introduces new prospects in regard to investigating the sustainability of corporations and the industry in general [36].
Historically, research methodologies in business management engineering have played a critical role in understanding an array of corporate strategies and developments [37]. However, these traditional approaches are inadequate when substantial text content analysis is invovled. To bridge this gap, text mining, through the utilization of machine learning, natural language processing, and other digital technologies, offers promising capabilities [38, 39, 40]. By extracting patterns, laws, and trends from voluminous textual data, text mining facilitates a quantitative approach to management engineering research, signaling a significant paradigm shift in the field.
Within this realm, the Term Frequency-Inverse Document Frequency (TF-IDF) is a commonly applied weighting technique that is widely recognized in information retrieval and data mining practices [41]. The essence of the TF-IDF methodology lies in its ability to identify words or phrases that appear frequently within a single document but are scarce elsewhere, signaling a meaningful categorical difference and thereby serving as an effective classification tool.
In the existing body of literature, research by Lee et al. (2023) proposes an ESG information classifier to address the current limitations of ESG ratings, verifying the model’s effectiveness through several application experiments and suggesting future work on integrating non-financial performance into ESG ratings [42].
In addition to classification tasks, Zanatto et al. (2023) analyzes the influence of ESG news on the volatility of the Portuguese stock market, establishing a custom News Sentiment Index to capture positive and negative ESG news related to companies listed on the PSI-20. Their findings indicate that ESG news helps reduce volatility during non-crisis periods but fails to have a significant effect during economic downturns [43].
Simultaneously, Cheng et al. (2023) investigated the correlation between brand reputation, CSR performance as measured by ESG scores, and the issuance of green bonds. The study conclude that superior ESG scores and brand reputation jointly drive the successful issuance of green bonds [44].
Finally, Lu et al. (2023) examine the relationship between digital transformation and a firm’s ESG performance using Chinese-listed firms as a case study [45]. Their research suggest that digital transformation fosters a firm’s ESG performance by improving internal control and promoting green innovation, particularly for non-state-owned enterprises, manufacturing industry firms, high-tech companies, and companies with higher degrees of independent directors and analyst coverage. This research enriches our understanding of the underlying mechanisms linking digital transformation and ESG performance.
3 Proposed Framework
3.1 ESG Data Collection
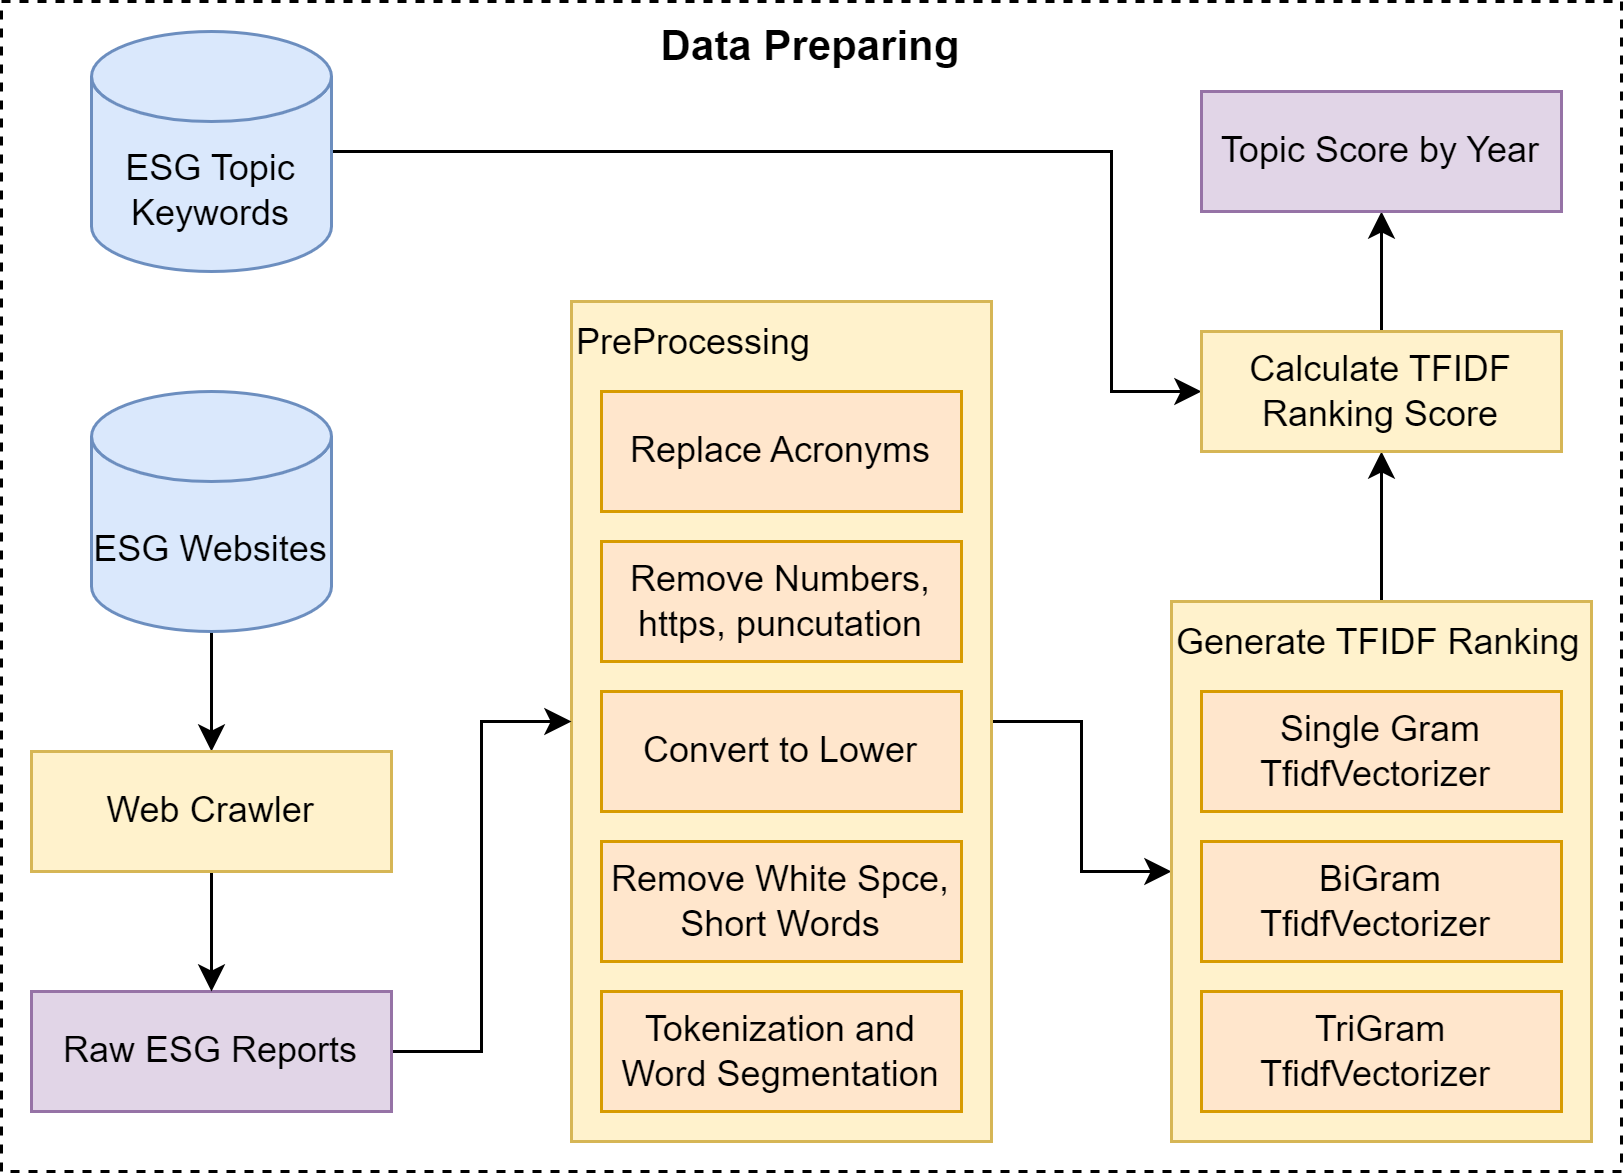
In our current comprehension of the ESG landscape, the lack of availability of an open-source ESG thematic database constitutes a formidable barrier for researchers. This limitation hinders comprehensive examinations of the industry and primary areas of concern pertaining to ESG sustainability development over time and at the corporate level. To bridge this gap, we propose an ESG thematic data processing framework, illustrated in Figure. 2, which draws upon ESG reports from a diverse range of companies.
Our groundbreaking framework enables the seamless processing and analysis of ESG reports sourced from numerous companies across various industries. It consequently generates quantified, actionable ESG thematic data. Researchers can harness this data to conduct quantitative analyses of sustainability development strategies prevalent across distinct industries, as discussed in greater detail in Section 4.1. This innovative proposition marks a substantial advancement, enhancing the depth and scope of ESG research, and providing researchers with an invaluable tool.
3.2 Identification of ESG Topics
In the process of amassing ESG reports from a multitude of companies spanning various years, we construct a detailed ESG topic data structure. This includes dimensions such as the year of the report, the company involved, and the specific topics addressed. To ascertain the relevance of each gathered ESG report, we leverage a TF-IDF algorithm, which facilitates the computation of ranking scores. Our framework embraces the ranking of individual, bi- and tri-gram topics, ensuring a comprehensive representation of all ESG topics as guided by the ESG digital topic keywords dictionary.
Our proposed framework integrates an array of text preprocessing techniques to elevate the caliber of the analysis. Initially, we substitute acronyms with their respective full names, as listed in the supplementary ESG acronyms dictionary, to ensure uniformity across ESG topics. Following this, elements such as numbers, URLs (https), punctuation marks, excess white spaces, and short words are removed, and all characters are converted to lowercase. Subsequent to these steps, we implement tokenization and word segmentation processes to certify the cleanliness and precision of all text content extracted from the ESG reports.
In essence, our proposed ESG topic data framework streamlines the process of obtaining ranked ESG scores, facilitating more effective measurement and analysis. Using the collected ESG data, we can track the progression of ESG topics over time and produce various plots, as illustrated in the Figures. 6 and 7. This improved methodology paves the way for a more precise understanding and comparison of ESG topics both within and between industries.
3.3 Measurement of ESG Topics
Our innovative framework articulates three distinct trajectories for quantifying ESG topics. Firstly, we delve into the analysis of ESG strategies within a specific industry. Secondly, we juxtapose strategies across diverse industries. Finally, we investigate strategies in connection with a designated sustainability index. Detailed procedural flows for each direction are described below.
3.3.1 Within the Same Class
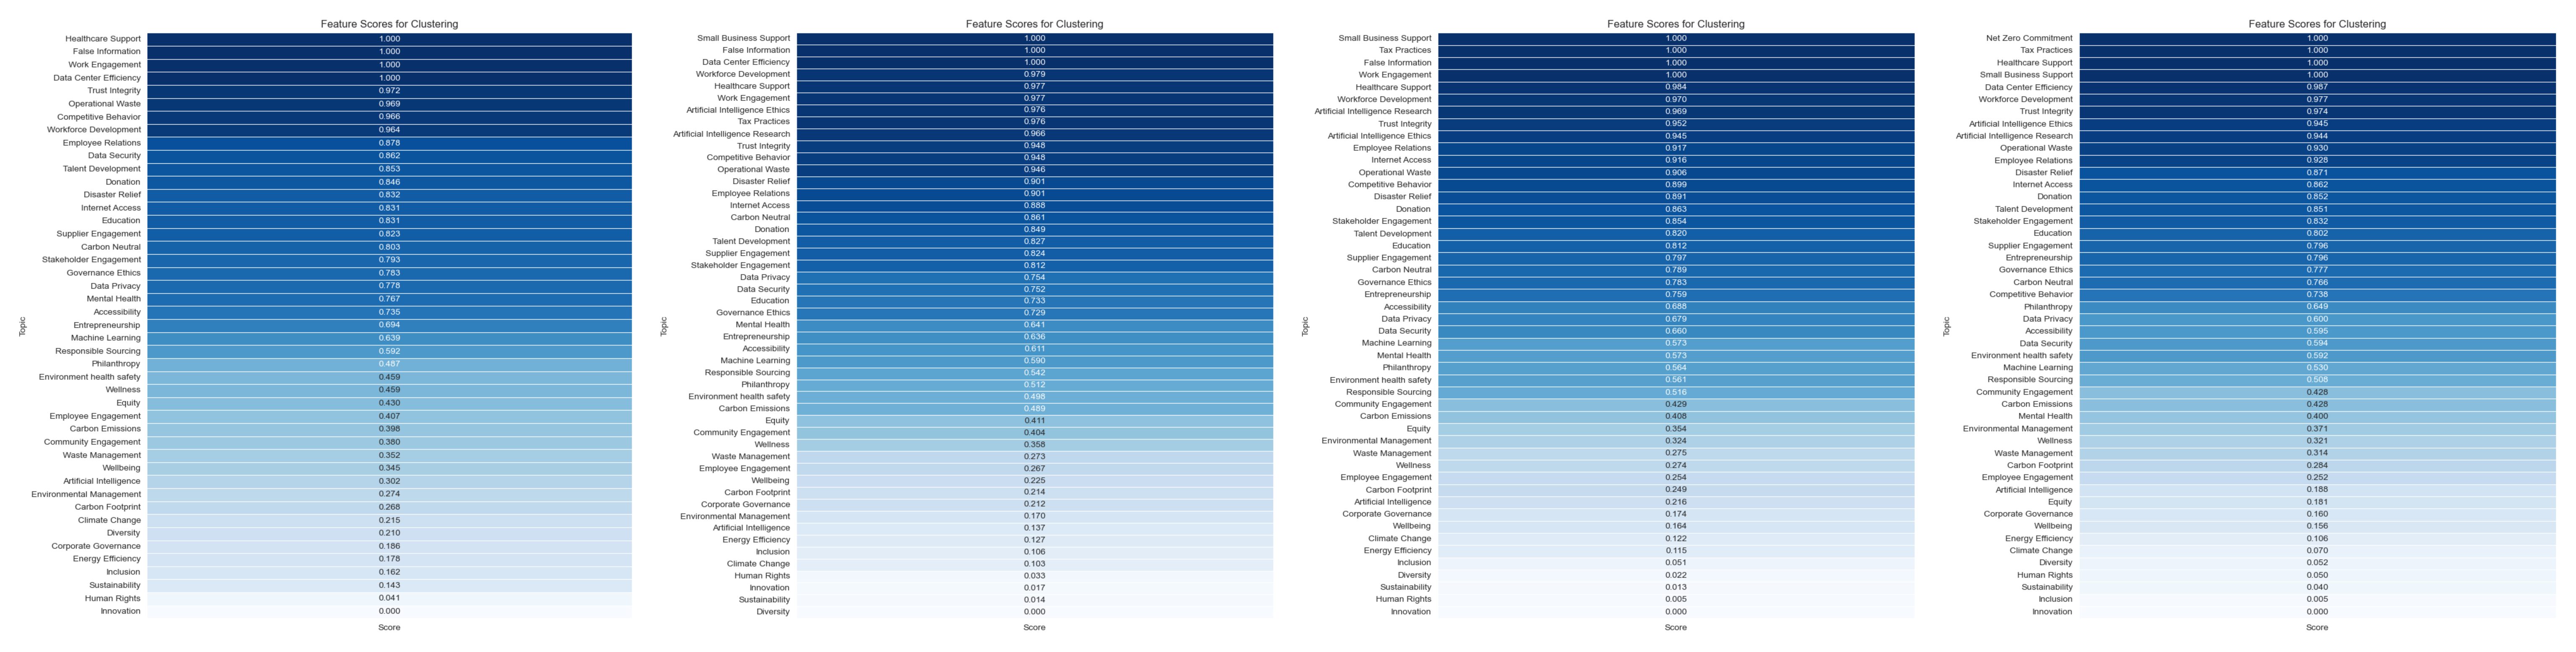
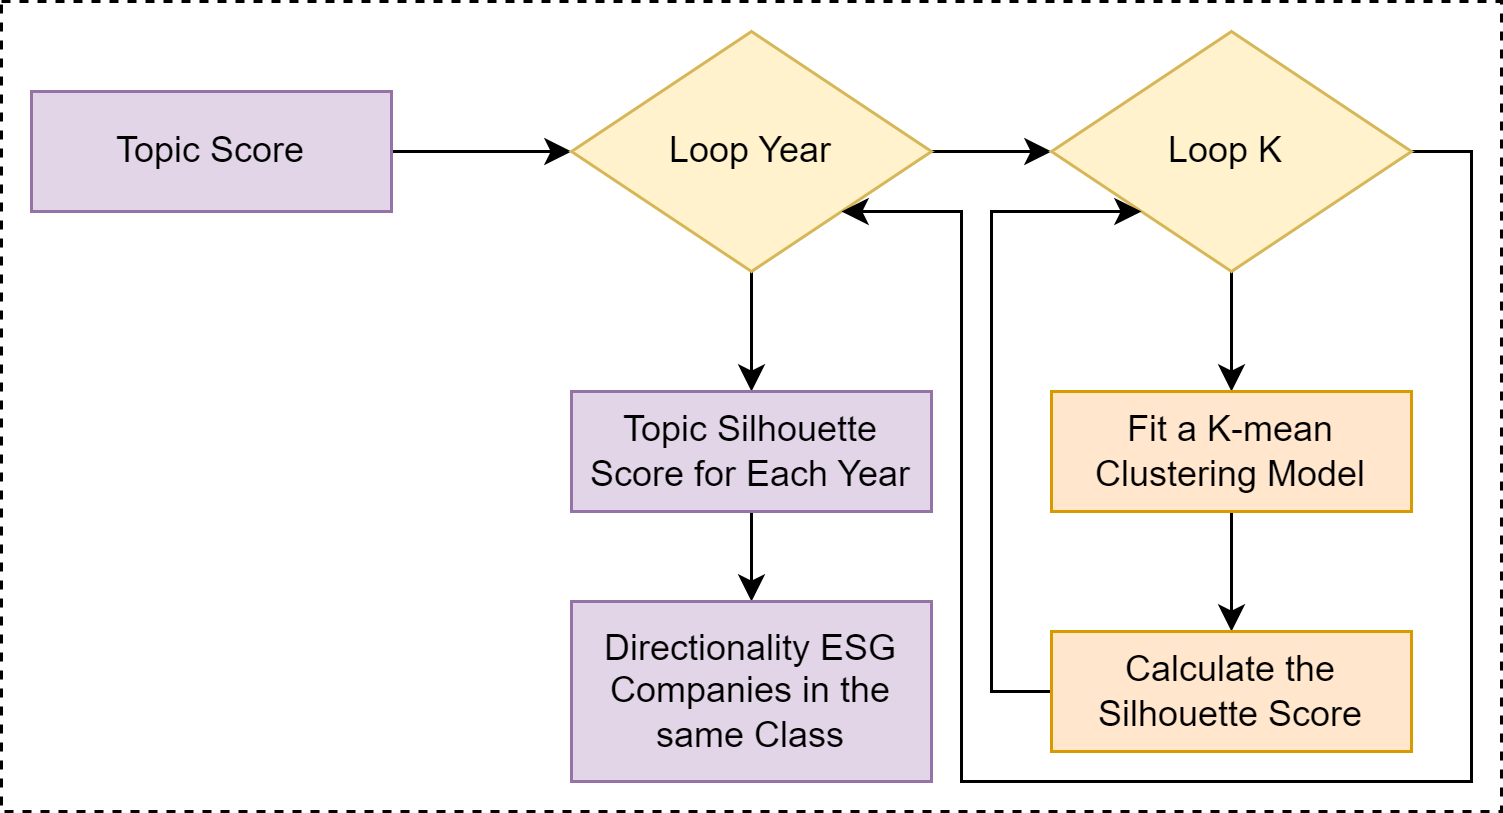
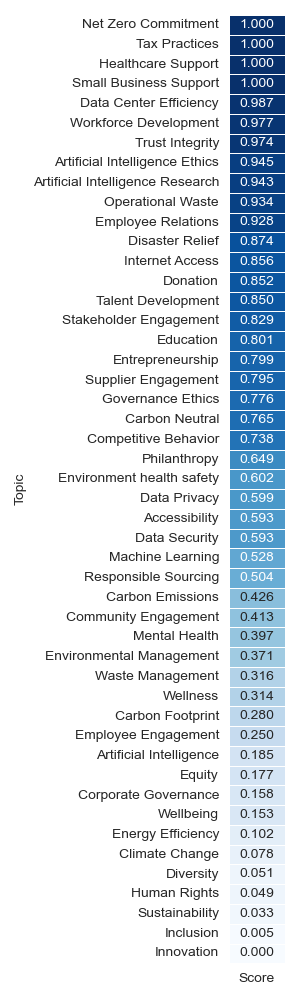
Our framework streamlines the process of assessing ESG topics for companies operating within an identical class by harnessing the previously discerned ESG topic scores. The pipeline involved s visualized in Figure. 3. Each year’s ESG topic data are parsed, followed by the employment of a K-means clustering model. In this model, individual companies act as samples, while each ESG topic constitutes a feature. Upon fitting the K-means clustering model, the silhouette score for each ESG topic is calculated. Given a pre-set list, the mean silhouette score across all specified values is utilized at the end of the cycle. This score provides a numerical representation of the ESG measurements within the same category. When integrating the gathered ESG dataset into our framework in order to evaluate topics within the technology company class, the results can be represented through a heatmap, as depicted in Figure 9(a).
3.3.2 Across Different Classes
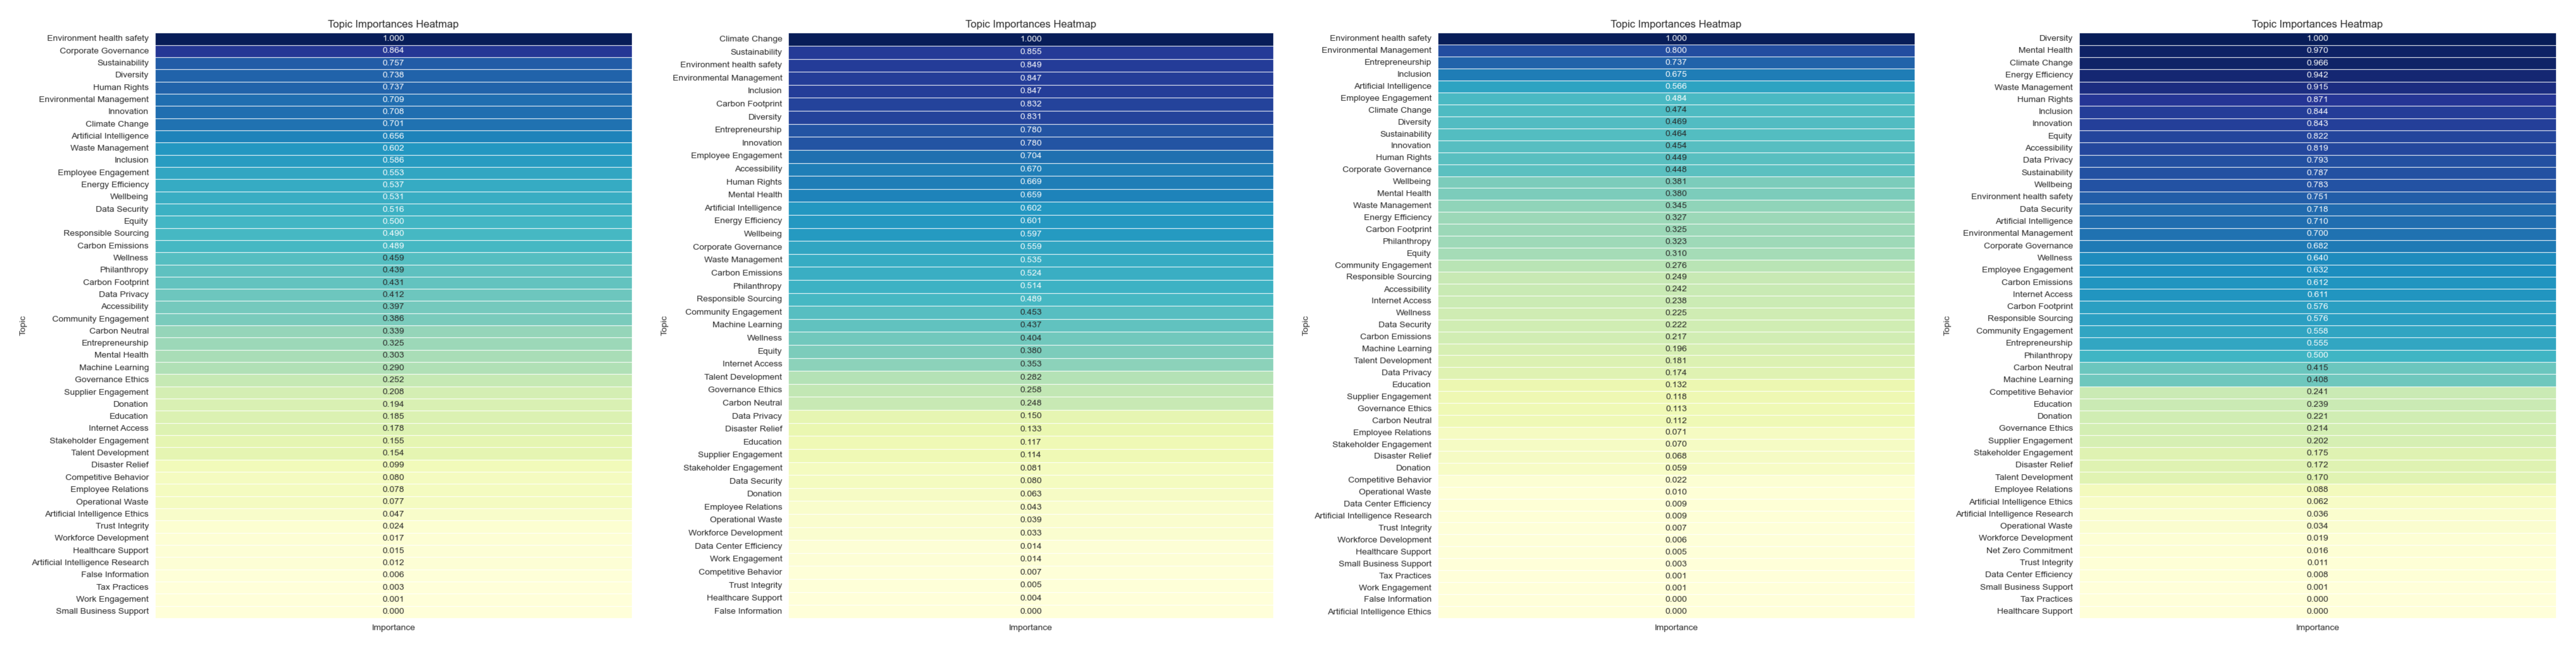
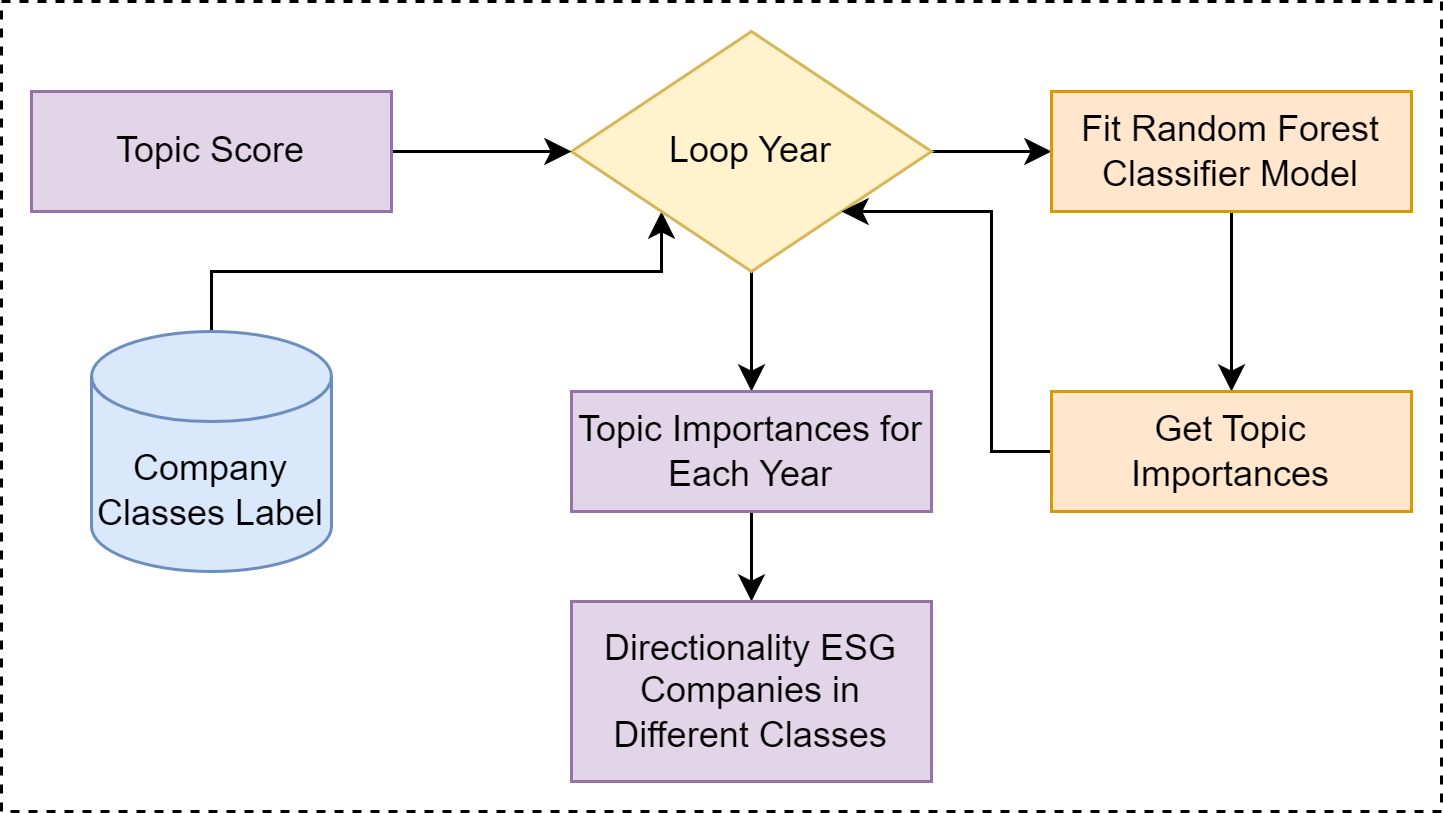
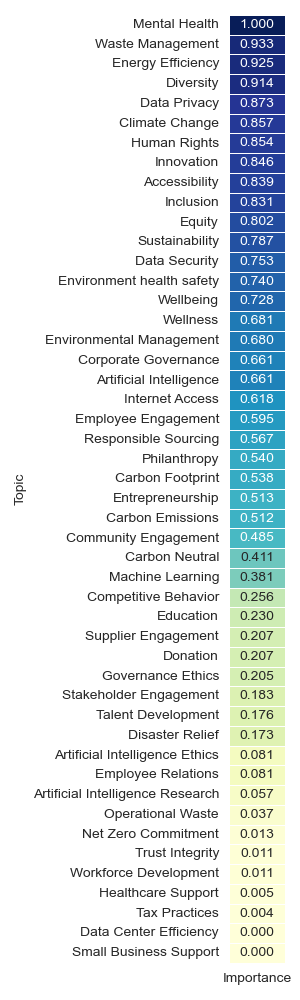
To evaluate ESG performance spanning different company classes, it is essential to embed company class labels within our framework. Our system embraces the inclusion of varied class labels, such as industry, service domain, and headquarters country, to enhance the analysis of ESG topic importance calculations. The iterative procedure is subsequently applied across each year to train a random forest classifier model, leveraging the provided labels and the precompiled ESG data structure. Consequently, ESG topic importance that resonates with the supplied labels is produced for each year, bolstering the measurement outcomes for ESG across different classes. This process is illustrated in Figure. 4. When integrating the collected ESG dataset into our framework to assess ESG topics across various technology company service area classes, the outcomes can be visualized in a heatmap, as shown in Figure 9(b).
3.3.3 In Alignment with a Sustainability Index
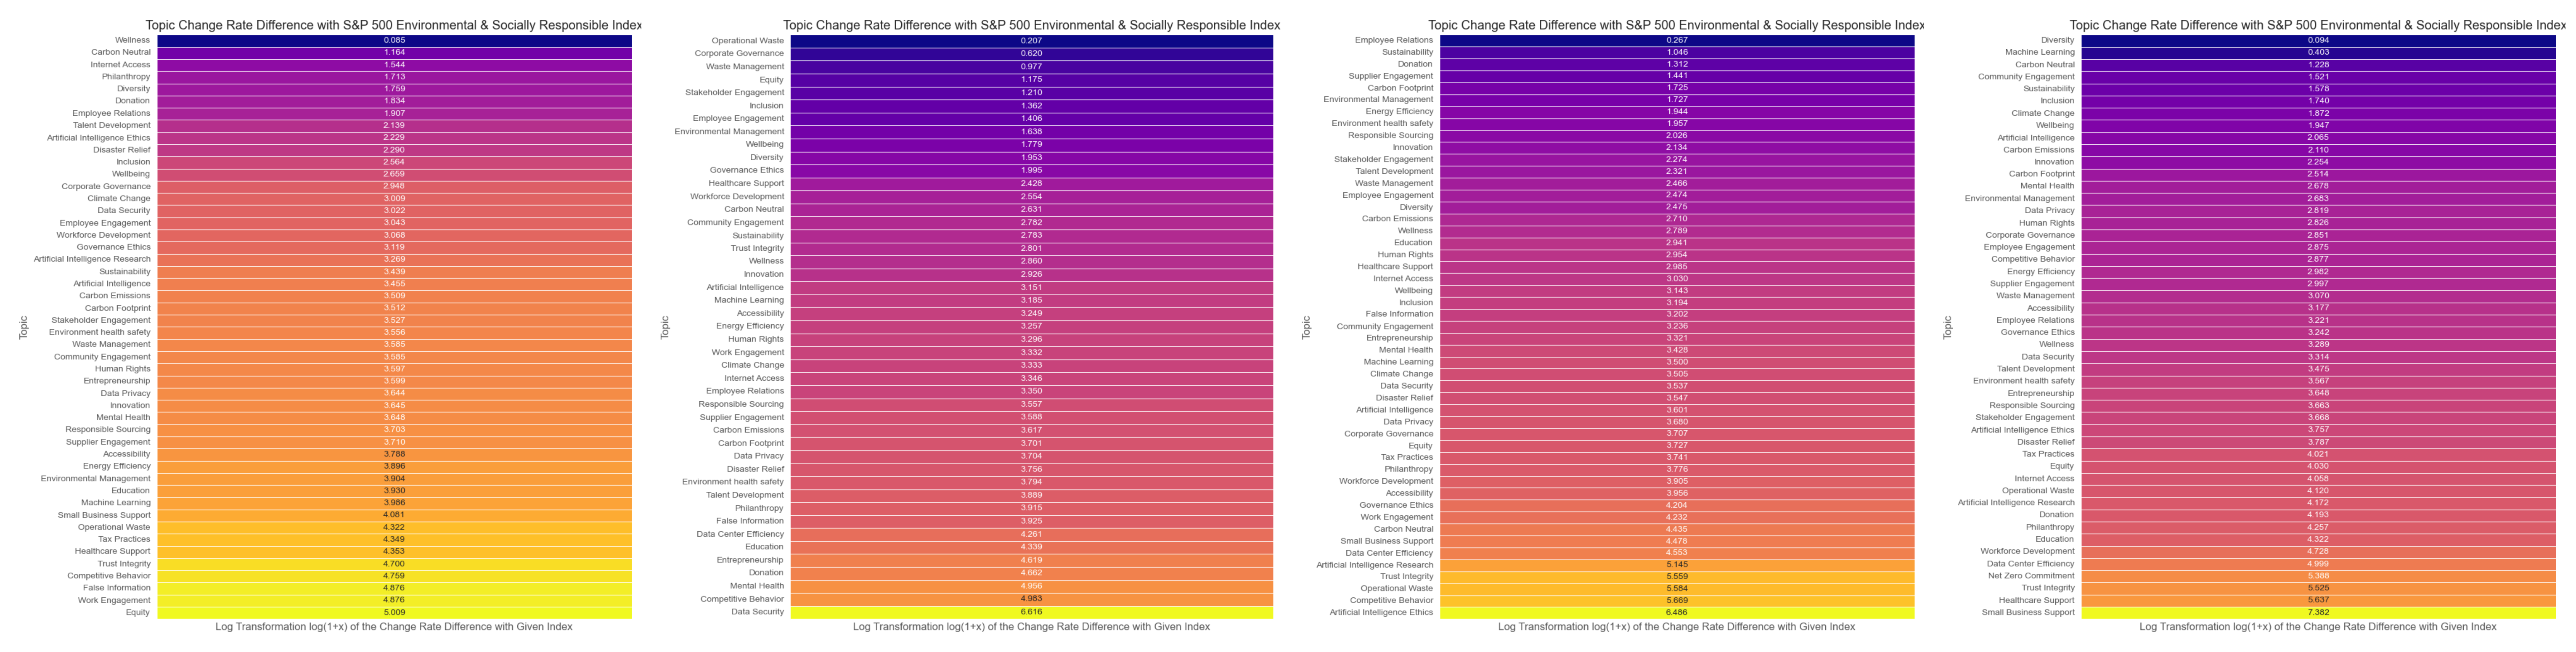
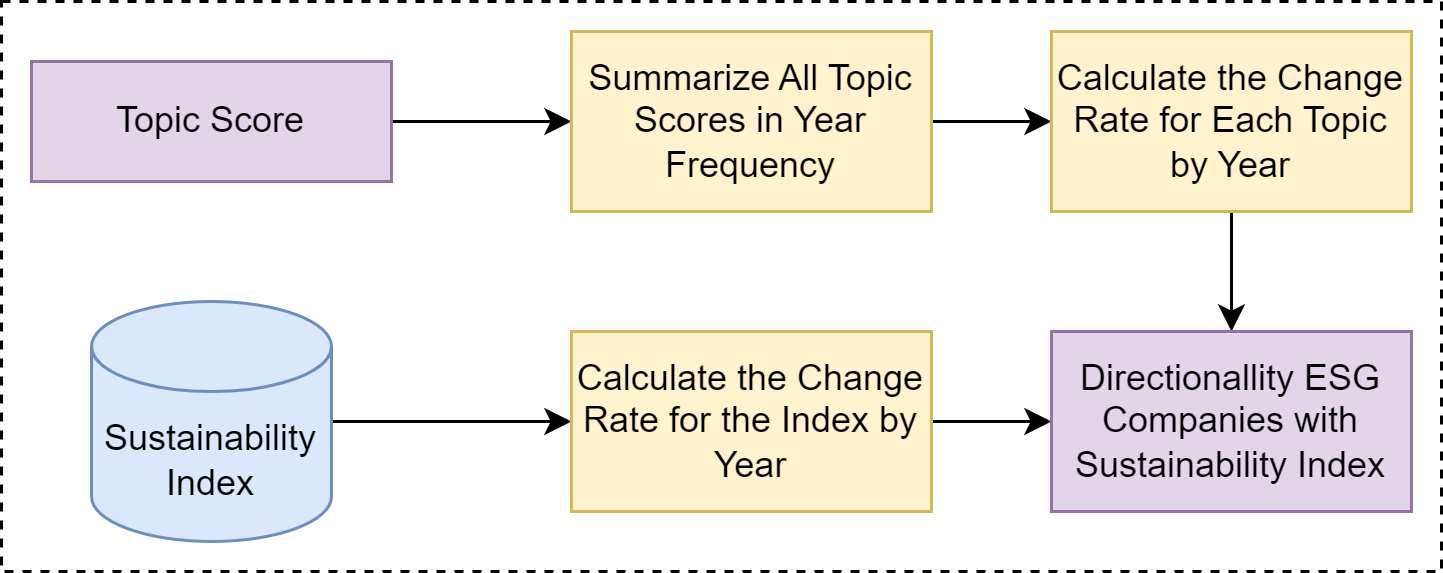
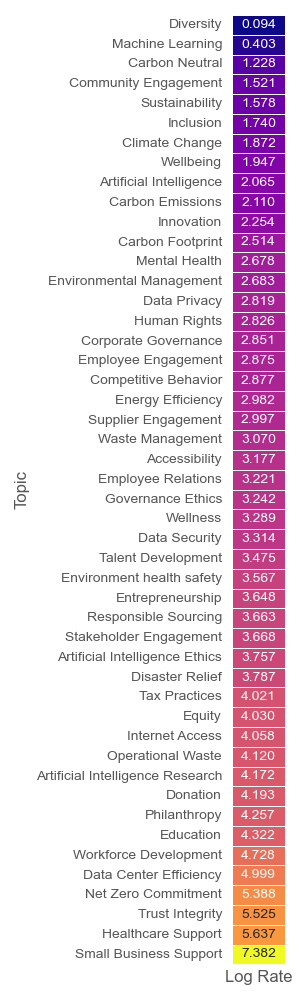
Apart from assessing ESG topics for companies based on their class, our proposed framework introduces a robust method to evaluate ESG topics in harmony with a chosen sustainability index. By amassing the identified scores of all ESG topics within a specific year, our pipeline—portrayed in Figure 5—computes the annual rate of change for each topic, forming the bedrock for index-oriented measurement results. Simultaneously, the pipeline generates rate of change measurements for the given index, thereby aiding in the creation of insightful management analyses, further discussed in the subsequent subsection. While using the collected ESG dataset into our framework to measure ESG topics align with S&P500 sustainability index, the outcomes can be visualized in a heatmap, as shown in Figure 9(c).
3.4 ESG Topic Management
Following the assessment of the defined ESG topic data structure within our novel framework, the framework also brings forth powerful management analysis capabilities. This aspect of the framework facilitates the generation of holistic management analyses that are grounded in the quantified ESG topics.
In relation to the measurement of ESG topics within an identical class, the management dimension of our research pinpoints the leading five companies with the highest scores for each of the top five ESG topics. These rankings are determined by the ESG topic silhouette score, a unique tool provided by our framework. The selected quintet of companies, thus, act as directional benchmarks, providing audiences with valuable insights into ESG topics within the class for the given year.
By extending the measurement of ESG topics to different categories using our proposed framework, we can identify the most distinctive companies in each class. These distinctive companies become the prime focus of researchers and analysts, empowering them to conduct further management research. This targeted methodology enables intensive investigations and strategic analyses of the pinpointed directional companies in the niche market, revealing their primary ESG practices which may different from other classes.
In addition to forming management strategies grounded in class information, our proposed framework demonstrates its versatility when integrated with different sustainability indices, as shown in Section 3.3.3. By juxtaposing ESG topic measurements with a specific sustainability index, the framework identifies the top five companies showcasing significant directionality aligned with the index. This distinctive feature enables analysts to carry out meticulous research by drawing links between these companies and the index in relation to their ESG performance. Utilizing this capability, our framework delivers an all-encompassing analysis, aiding the deciphering of how these companies synchronize with and bolster the overarching sustainability objectives represented by the selected index.
3.5 ESG Topic Strategic Guide
In implementing the ESG measurement framework within identical industry classes, it is possible to discern the most representative entities based on their ESG reports. This capability enables academics and investors alike to undertake comparative studies, juxtaposing a firm’s ESG performance against that of its industry counterparts. Such exercises can illuminate the spheres of exemplary performance, as well as those requiring enhancement. By acquiring a comprehensive grasp of the ESG themes of paramount relevance and significance within their industry, companies can judiciously distribute resources and focus on these particular areas. This strategy fosters improved sustainability practices and overall ESG performance. The framework further aids in pinpointing the industry’s most representative firms based on their ESG performance, serving as inspiration for fellow industry players. These flagship firms exemplify the implementation of effective best practice and highlight the potential business benefits accompanying robust ESG performance. Additionally, scrutinizing ESG topic scores and clustering outcomes equips firms to identify emerging ESG trends and adjust their strategic priorities accordingly, ensuring their responsiveness to evolving industry expectations and regulatory shifts.
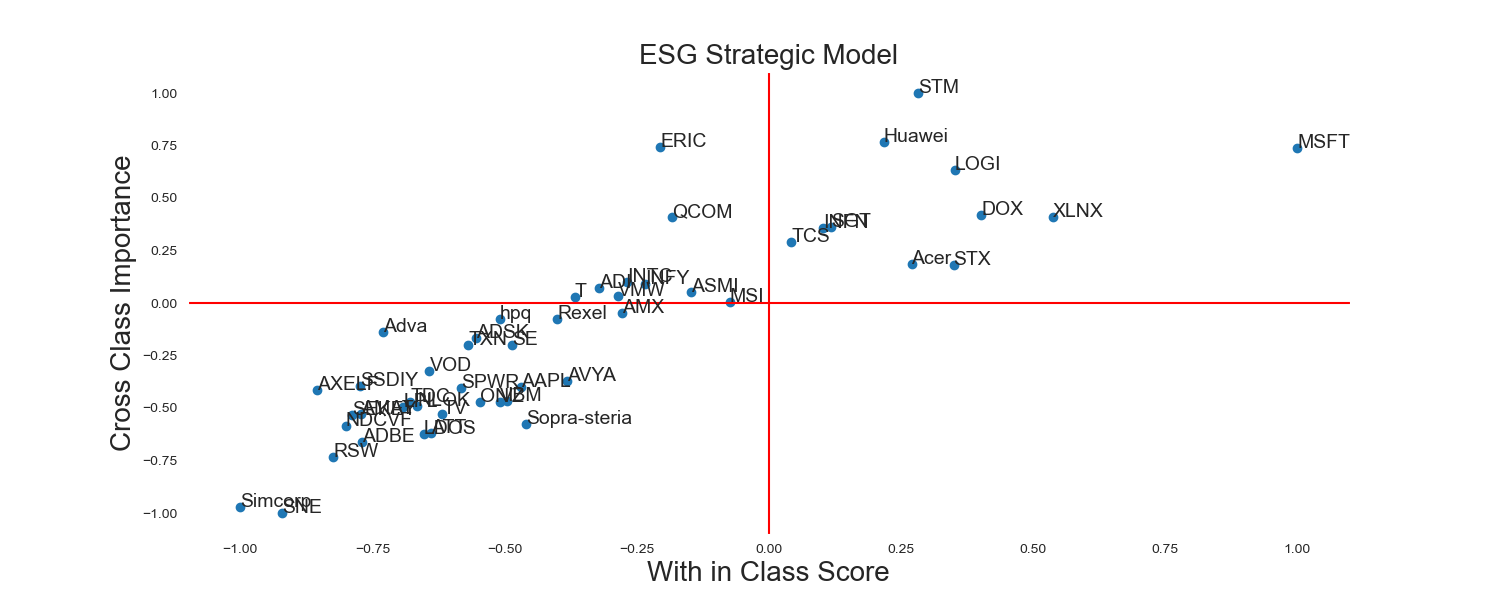
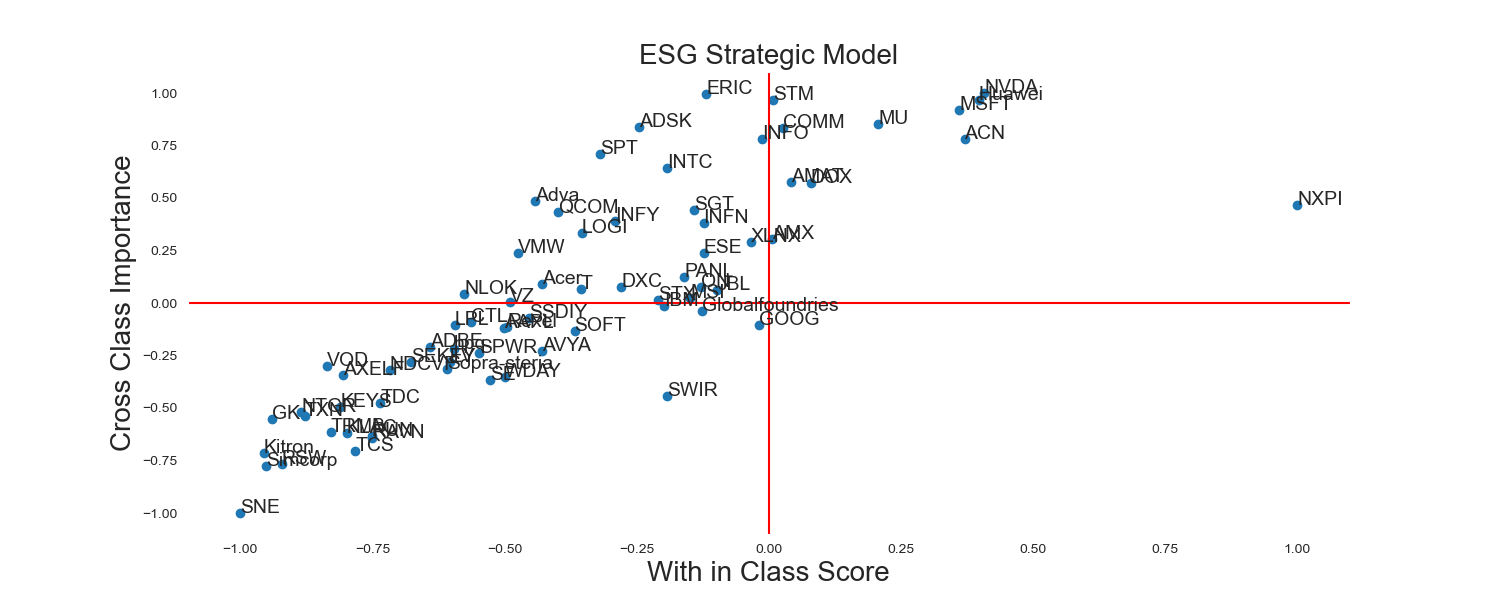
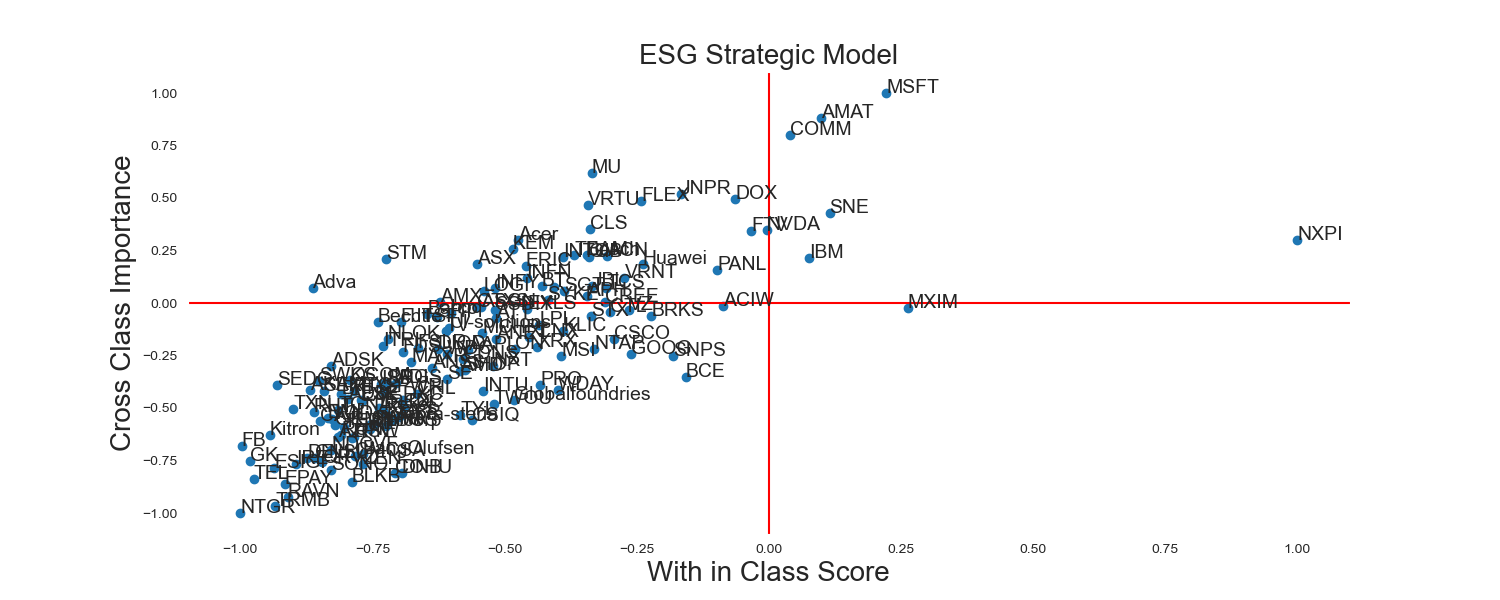
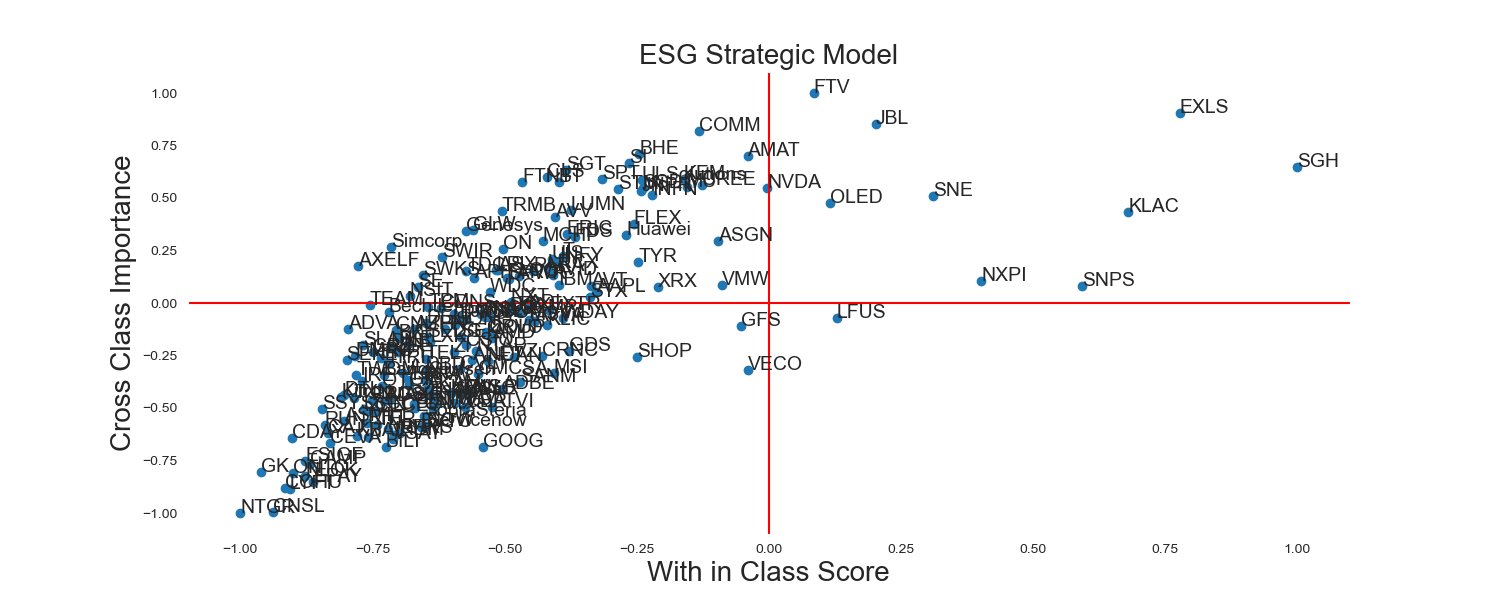
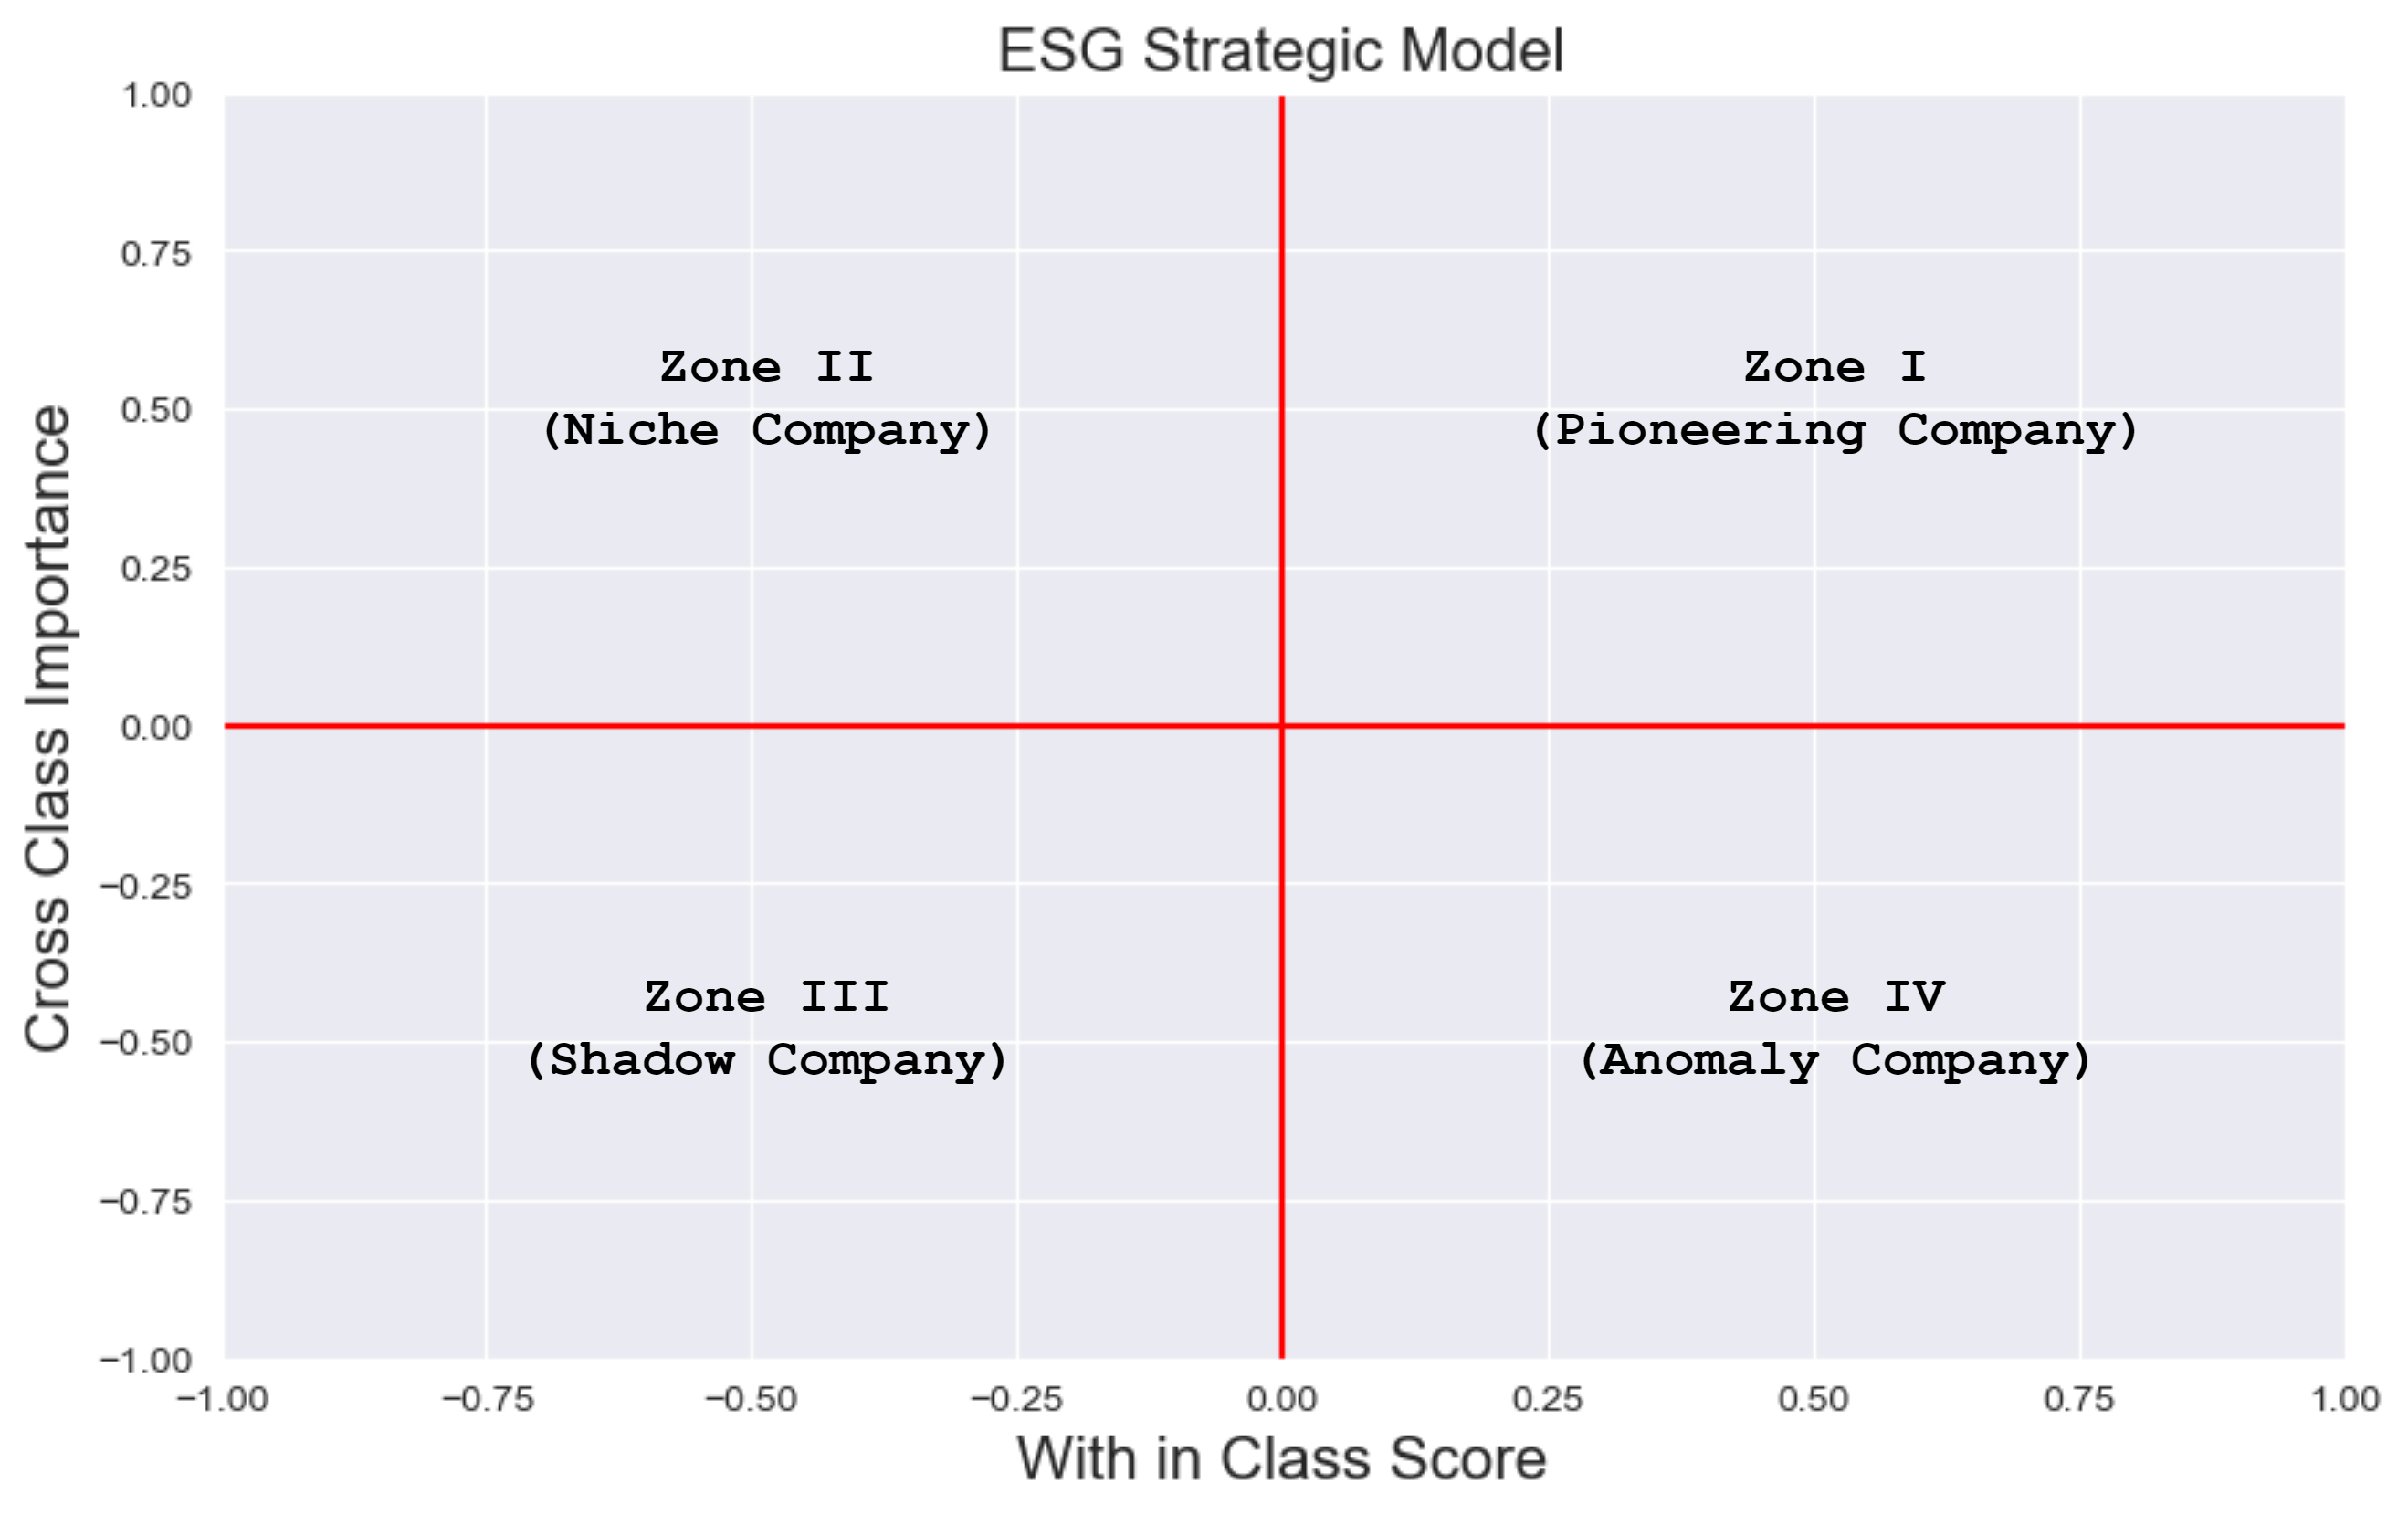
Employing this measurement framework to analyze firms’ ESG reports across various sectors or industries can uncover notable insights regarding the most outstanding companies within each domain. This mechanism encourages cross-comparative analysis and benchmarking, empowering industry participants to recognize factors contributing to success and understand the specific ESG topics of paramount importance within each domain. Utilizing this knowledge can inform strategic decision-making, enabling companies to prioritize efforts and effectively allocate resources in high-impact areas within their respective domains. This strategic guide underscores the need for ESG strategies and initiatives tailored to individual domains, acknowledging the distinct ESG challenges and opportunities encountered by companies across different sectors. By aligning ESG topic importance with the respective domain, organizations can formulate targeted sustainability strategies addressing the most relevant and impactful issues within their industry. This method enhances the likelihood of positive ESG outcomes while accommodating stakeholder expectations and demands. By integrating the within-class scores from the entire tech industry and the cross-class importance from hardware, software, and service categories, we depict the 2x2 ESG strategic model in Figure 8.
Simultaneously, the application of this method for evaluating ESG topics alongside a chosen sustainability index enables the identification of topics or companies demonstrating strong alignment with the index. This examination equips companies to identify the specific areas or topics where they closely adhere to the index’s criteria and standards. These insights can guide companies to prioritize efforts and channel resources toward these recognized topics, thereby ensuring conformity with the sustainability index’s prerequisites. This alignment enhances overall ESG performance and heightens the potential for acknowledgment and inclusion in the esteemed sustainability index. Further, our framework initiates a pipeline that computes the rate of change measurements for the selected sustainability index. This analysis yields valuable insights into the dynamic criteria and shifting expectations set by the index over time, aiding companies to evaluate progress, track performance relative to the index, and spotlight areas needing improvement to uphold or enhance alignment with the index. By aligning with the index, companies can bolster their credibility, augment their reputation, and amplify their appeal to investors prioritizing sustainability and ESG considerations. Moreover, alignment with the sustainability index can yield strategic advantages, providing access to an expanded network of similarly-minded companies, fostering potential partnerships, and revealing investment opportunities.
4 Experiment Results and Analysis
In order to showcase the efficacy of the proposed framework, a comprehensive dataset consisting of ESG reports from 244 technology companies was collected from 2001 to 2022, amounting to a total of 1126 reports sourced from verified official channels. Leveraging the proposed framework, the corresponding ESG topic structure dataset was generated. Notably, this structured ESG topic dataset is the first of its kind effectively organizing the development of ESG topics based on companies’ official ESG reports in the 21st century.
4.1 Identification Results
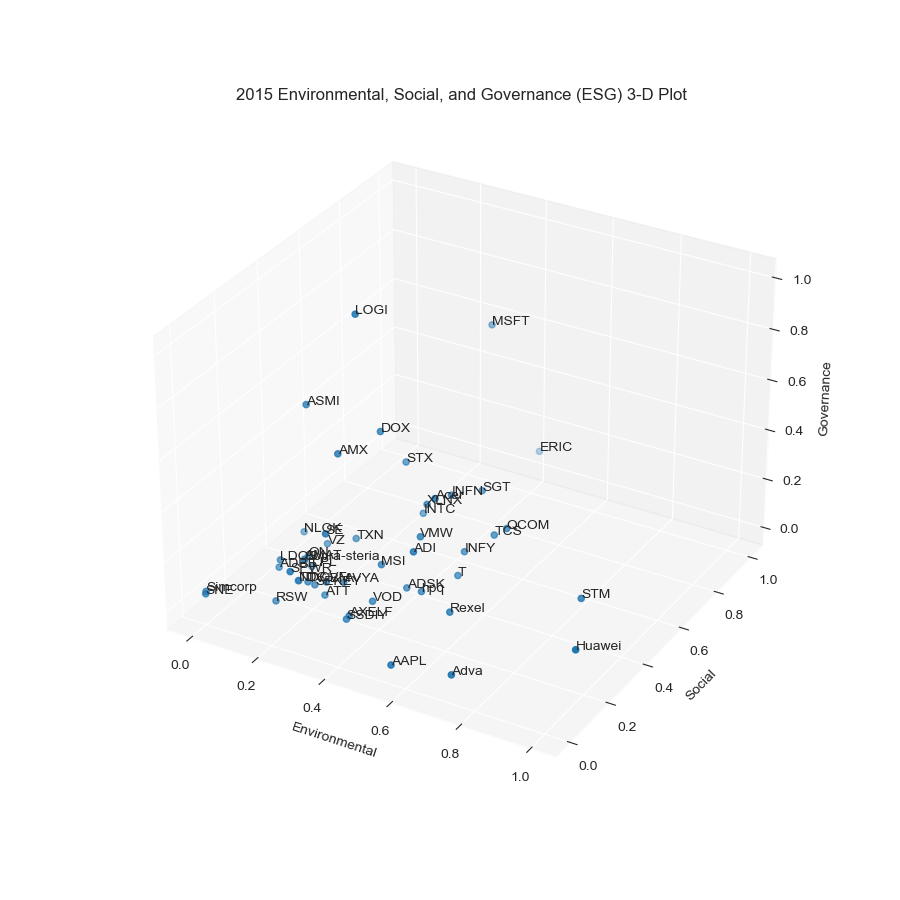
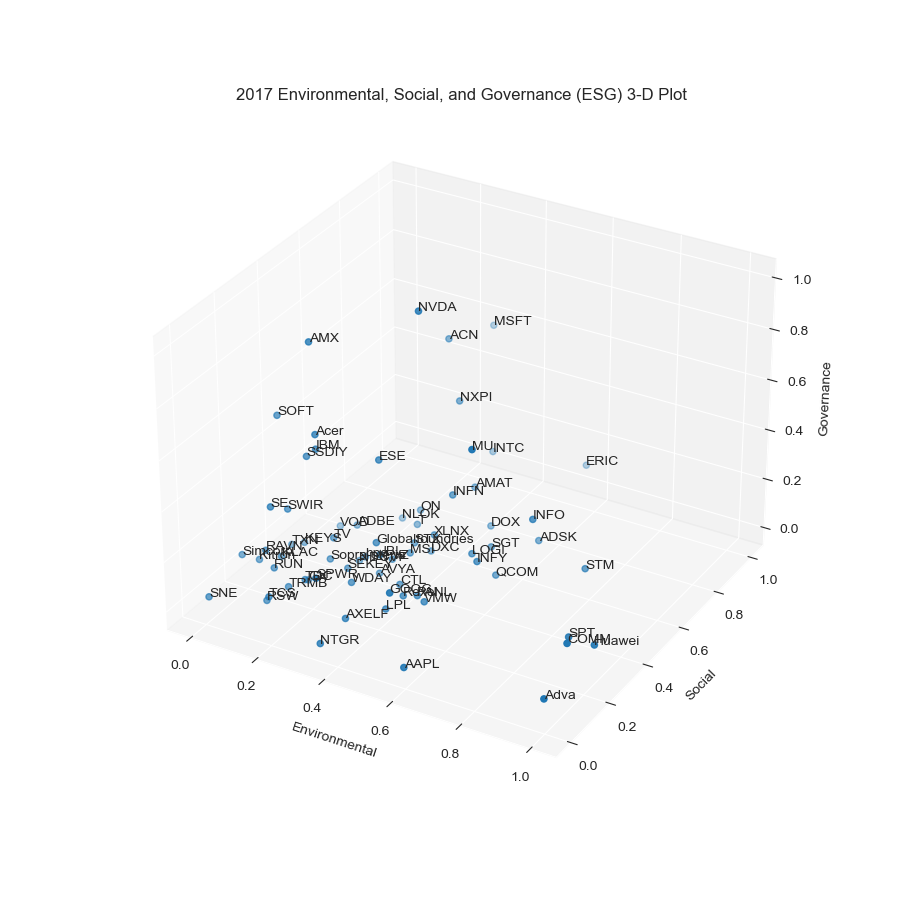
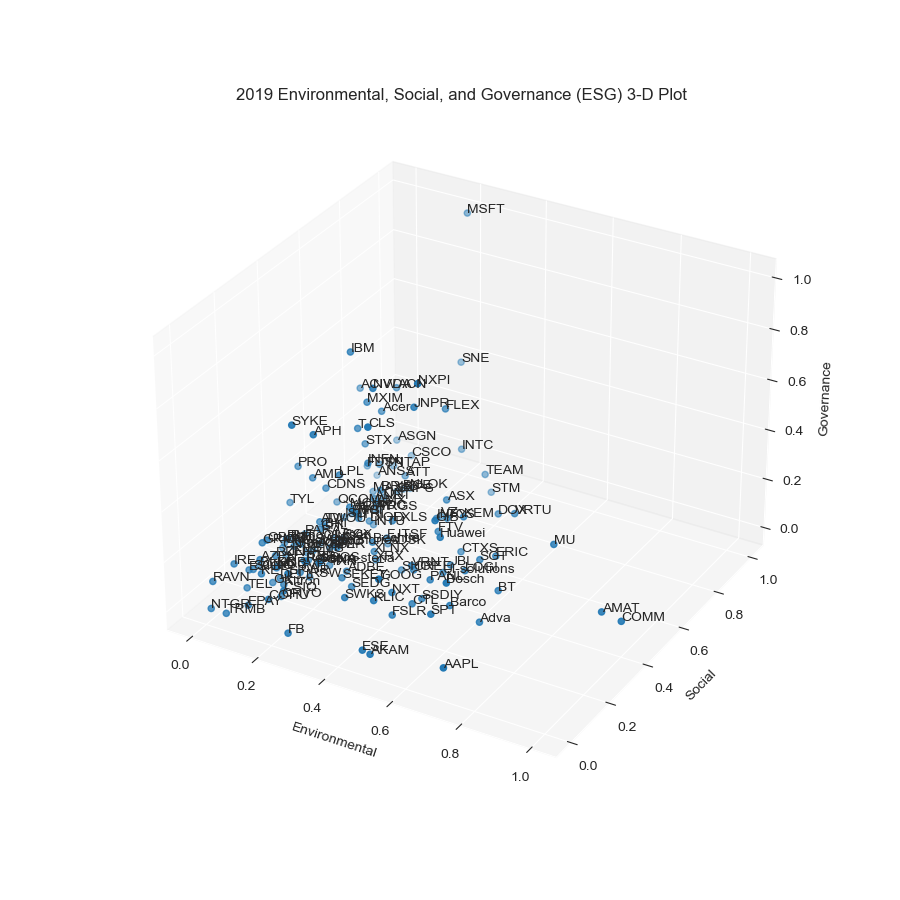
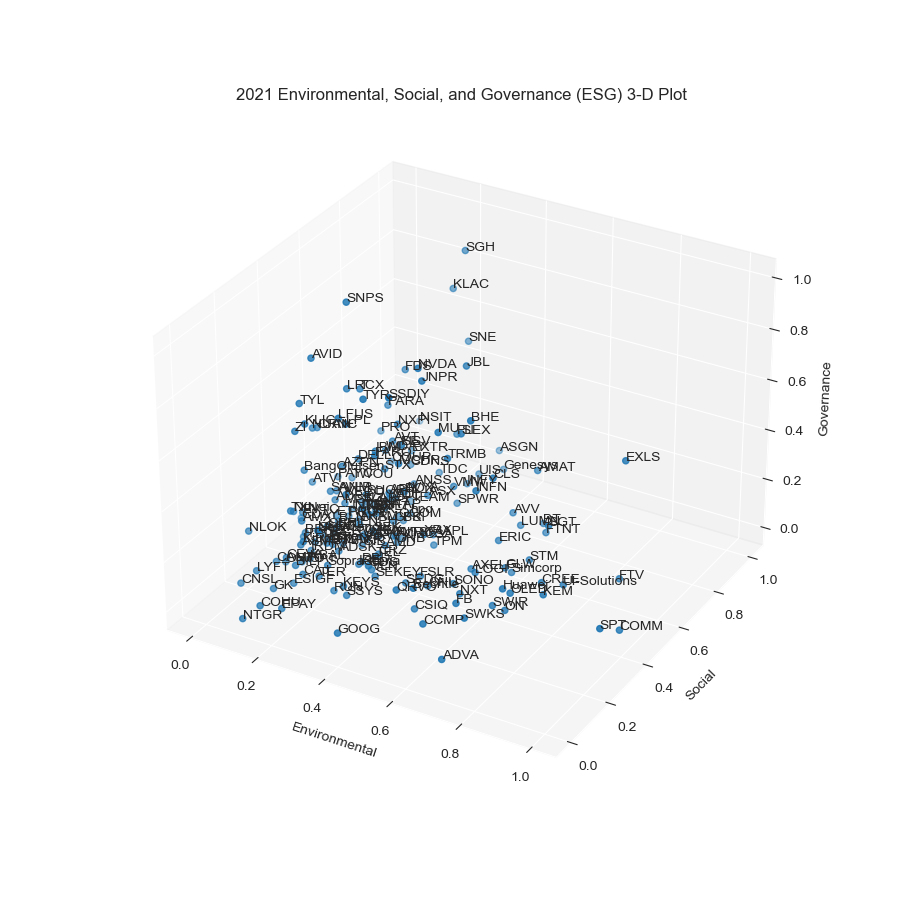
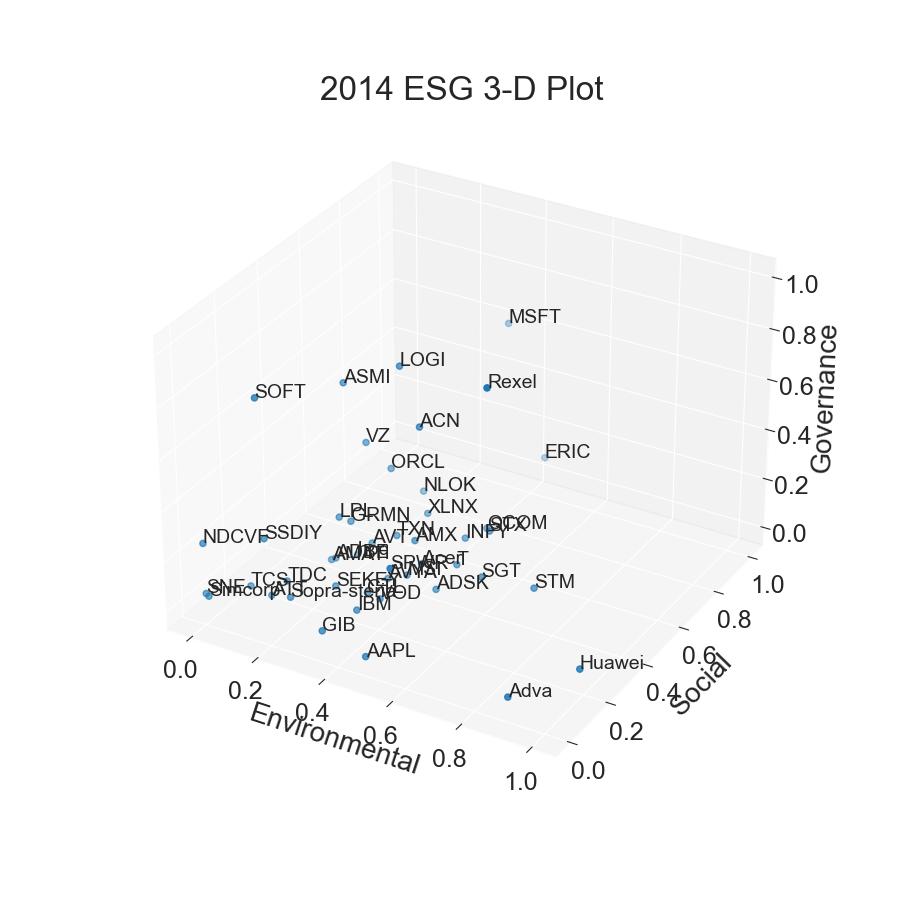
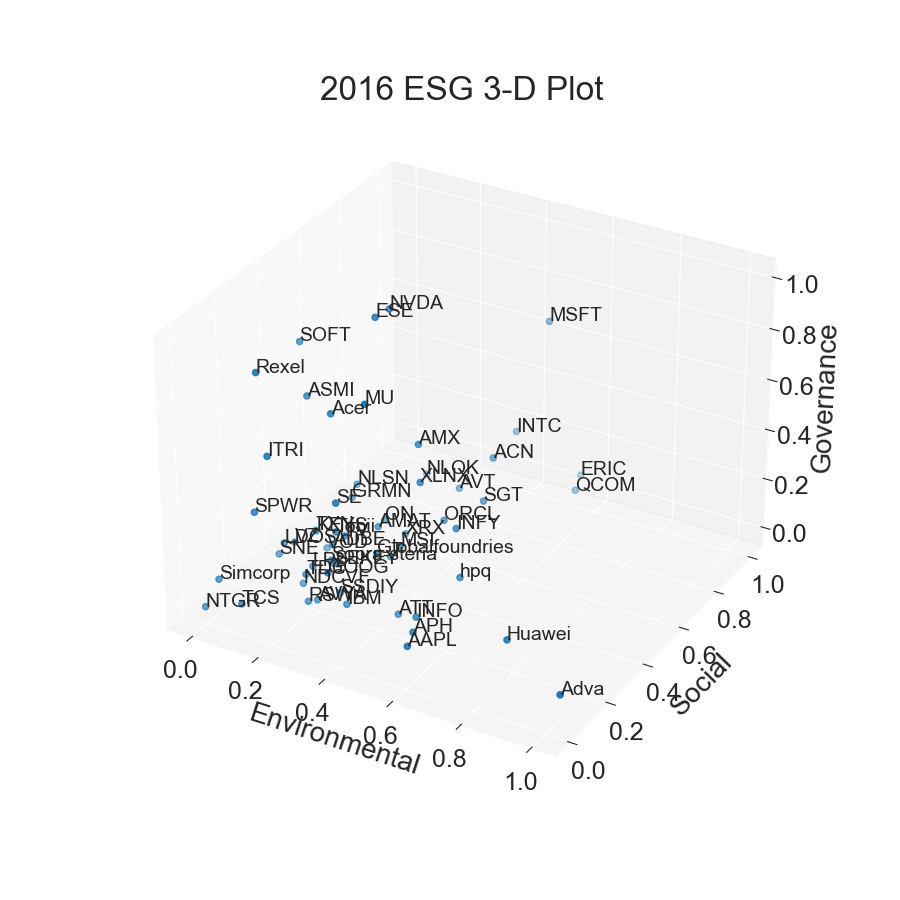
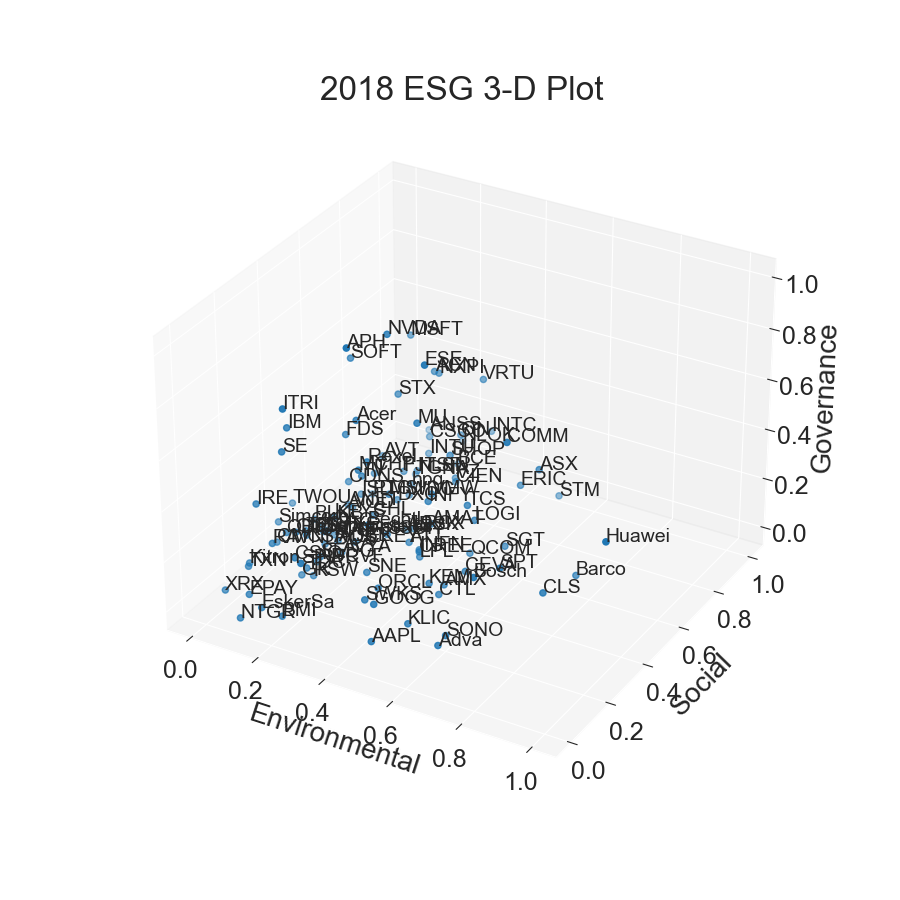
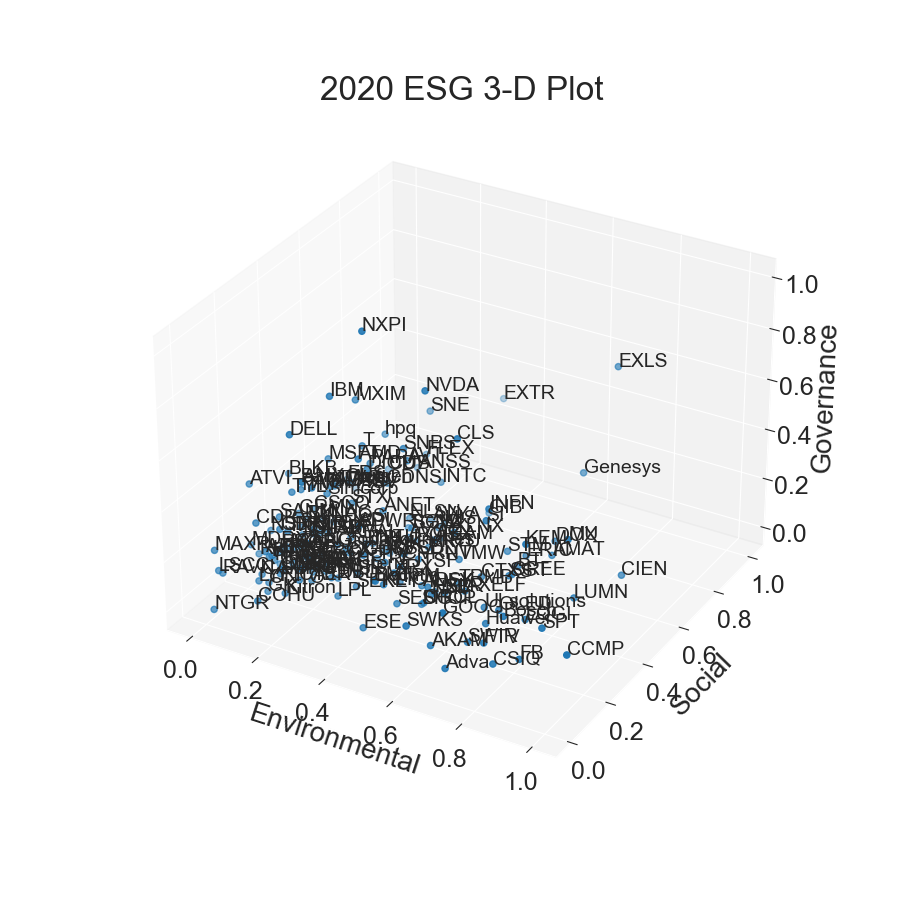
Once the structured ESG topic scores were obtained an ESG plot was employed to analyze the dynamics of ESG development across the environmental, social, and governance dimensions of companies, as depicted in Figure. 6. After normalizing the data, this visual representation provides insights into the evolving landscape of ESG practices and aids the identification of key trends and patterns over time. By analyzing the three-dimensional ESG evolutionary trends of technology sector firms in each country and region over the period from 2014 to 2021, there is an evolutionary process toward homogeneity in regard to the three dimensions of responsibility: low environmental, medium governance, and high social. The homogenization effect of companies is also visible in ESG reports.
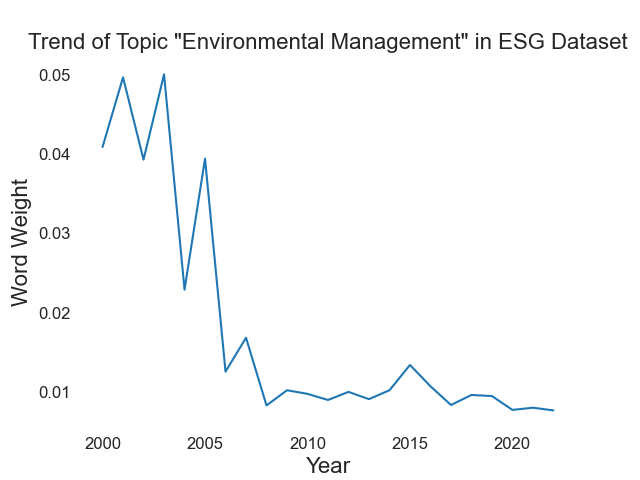
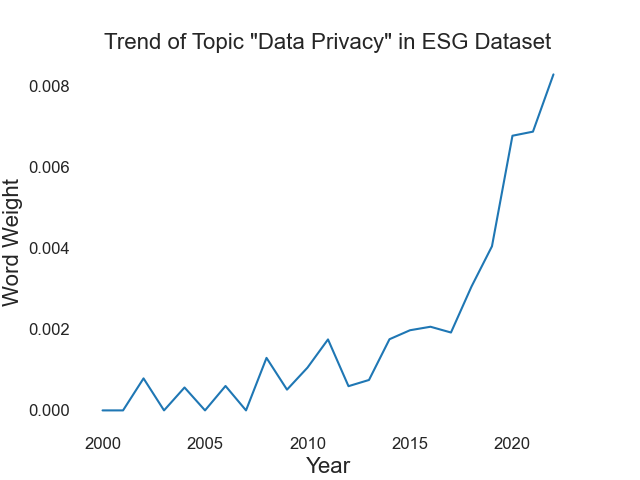
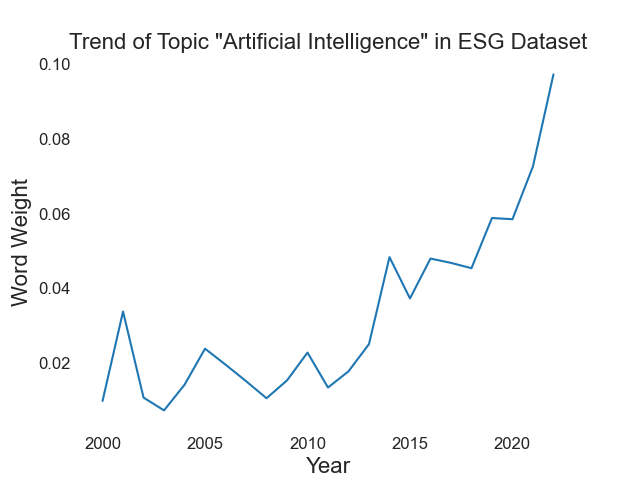
Another series of plots demonstrates ESG development in regard to topic, as shown in Figure. 7. Each ESG topic’s change rate is drawn to show their weight change during the whole period from 2001 to 2022. The trend of each topic fits the evolution of low environmental, medium governance, and high social dimensions over time. For instance, the level of importance of the topic of AI ethics and AI research shows exponential growth after 2015. Further, the level of importance of the topic of data privacy and data security shows a high rate of growth after 2015. The level of importance of the topic of responsible sourcing and supplier engagement shows rapid growth after 2010, but not much growth in recent years. Moreover, the level of importance of environmental management and waste management has continued to decline, reaching a relatively stable level after 2005.
4.2 Measurement Results
Upon the successful identification of ESG topic data, we apply our proposed measurement methodology to yield quantified outcomes. In the following section, we provide a comprehensive presentation of the three distinct measurement outcomes as discussed in Section 3.3.
It is important to note that all of the ESG reports we amassed are from technology companies. Therefore, our initial measurement involved generating quantile ESG topic scores specific to the technology company class. These scores were subsequently visualized in a heatmap format, and the resultant figures from 2017 to 2020 are exhibited in Figure 9(a).
Next, our proposed framework was supplied with the label information corresponding to the service areas of each technology company. We segregated the companies into three classes: hardware companies, software companies, and service companies. These classifications were ascertained based on the companies’ primary target areas and their self-identification. Armed with this class label information, we generated ESG topic measurements spanning the different service areas. These measurements are visually represented in Figure 9(b).
Regarding index-related ESG topic measurements, we utilized the S&P 500 Sustainability Index [46], a standard that assesses the performance of stocks within the S&P 500. This index specifically excludes companies involved in activities related to controversial weaponry, small arms, tobacco, and fossil fuels, based on predefined engagement thresholds. Accordingly, we generated ESG topic measurements that align with this index and visually depict these in Figure 9(c). This comprehensive measurement methodology illuminates different facets of ESG performance within the technology industry, paving the way for more nuanced and effective strategies towards sustainability.
4.3 Ranking Results
| Year | 2017 | 2018 | 2019 | 2020 |
|---|---|---|---|---|
| 1st Company | DXC | INTU | LPL | GIB |
| 2nd Company | SOFT | TGNA | INTC | Ul-solutions |
| 3rd Company | Globalfoundries | DXC | Huawei | ANSS |
| 4th Company | LOGI | SSDIY | SSDIY | CAJ |
| 5th Company | AMX | LPL | hpq | INTC |
| Year | 2017 | 2018 | 2019 | 2020 |
|---|---|---|---|---|
| Software Company | INFO | MSFT | MSFT | BB |
| Service Company | Huawei | Huawei | SNE | BCE |
| Hardware Company | COMM | COMM | AMAT | XLNX |
| Year | 2017 | 2018 | 2019 | 2020 |
|---|---|---|---|---|
| 1st Company | ACN | CLS | AMAT | EXLS |
| 2nd Company | ADBE | CEVA | FTV | LOGI |
| 3rd Company | MU | AMX | PANL | SWIR |
| 4th Company | NLOK | Barco | COMM | CIEN |
| 5th Company | TRMB | QCOM | DOX | AXELF |
Table 1 unveils distinct patterns within the technology industry. Business-to-business (B2B) entities such as DXC Technology, Intuit Inc., and CGI Inc. consistently appear at the forefront within the technology company class, underscoring the pivotal role of B2B companies in championing industry sustainability. Notably, Asian tech firms such as LG Display, Samsung SDI, and Huawei also feature in the top five list consistently from 2017 to 2020, accentuating the growing prominence of sustainable practices in Asia. These findings provide critical insights into the B2B sector’s role and the rising emphasis on sustainability within the Asian technology industry.
Table 2, illustrating the most directional companies across service areas (software, service, and hardware) from 2017 to 2020, shows intriguing patterns. Microsoft features twice in the software company list, Huawei appears twice in the service company list, and Commscope is listed twice within the hardware company segment. Through a lateral analysis of these companies’ ESG reports, we can discern the diverse ESG reporting styles employed by different sectors within the technology industry. Firms exhibit diverse ESG priorities and vary in their level of detail and disclosure in their reports. These differences likely stem from industry-specific challenges and the imperative to meet stakeholder expectations. A scholarly exploration of these discrepancies could further enrich our understanding of the idiosyncrasies of ESG reporting practices across distinct technology industry sectors.
An analysis of Table 3 indicates that Accenture, Celestica, Applied Materials, and EXL Service consistently demonstrated strong alignments with the S&P 500 Sustainability Index from 2017 to 2020. These companies’ presence on the list is testament to their effective incorporation of environmental, social, and governance (ESG) considerations into their organizational strategies and operations. It is, therefore, critical to delve deeper into their unique ESG integration approaches, covering the implementation of sustainable practices, stakeholder engagement, and the establishment of solid governance structures. This scholarly exploration could shed light on the specific strategies and initiatives enabling these companies to harmoniously align their practices with respected sustainability indices.
4.4 Strategic Analysis
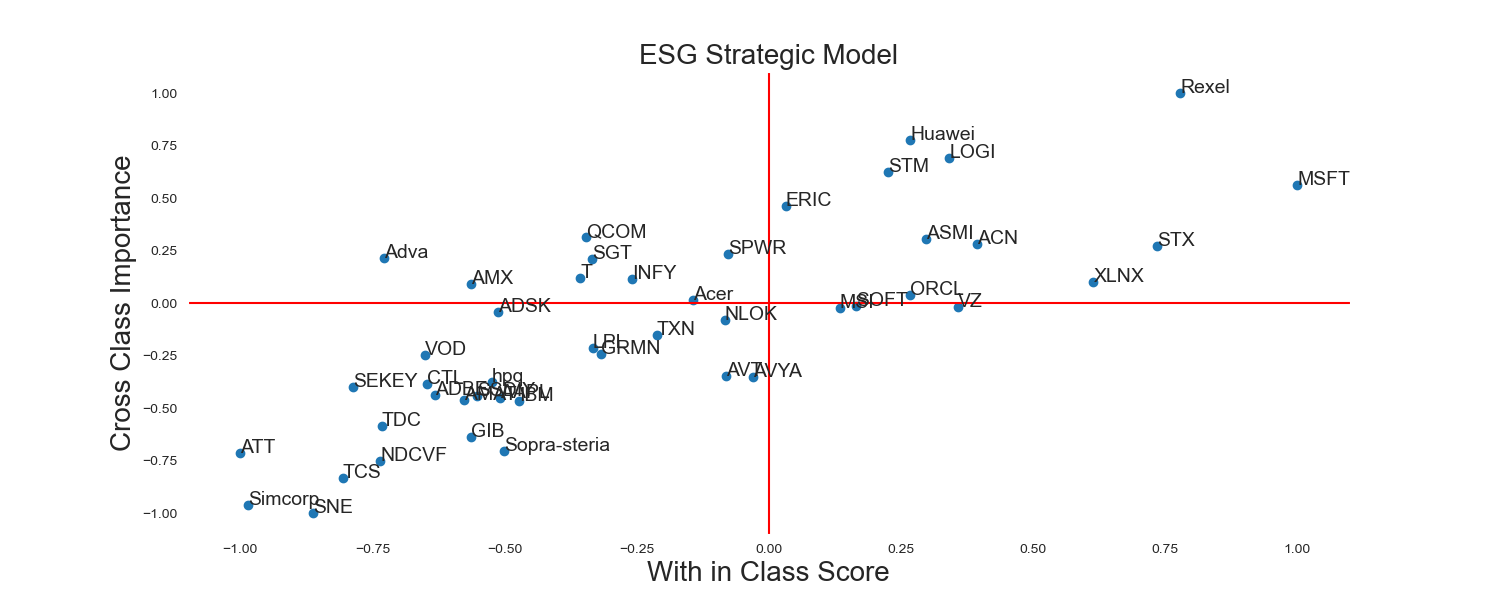
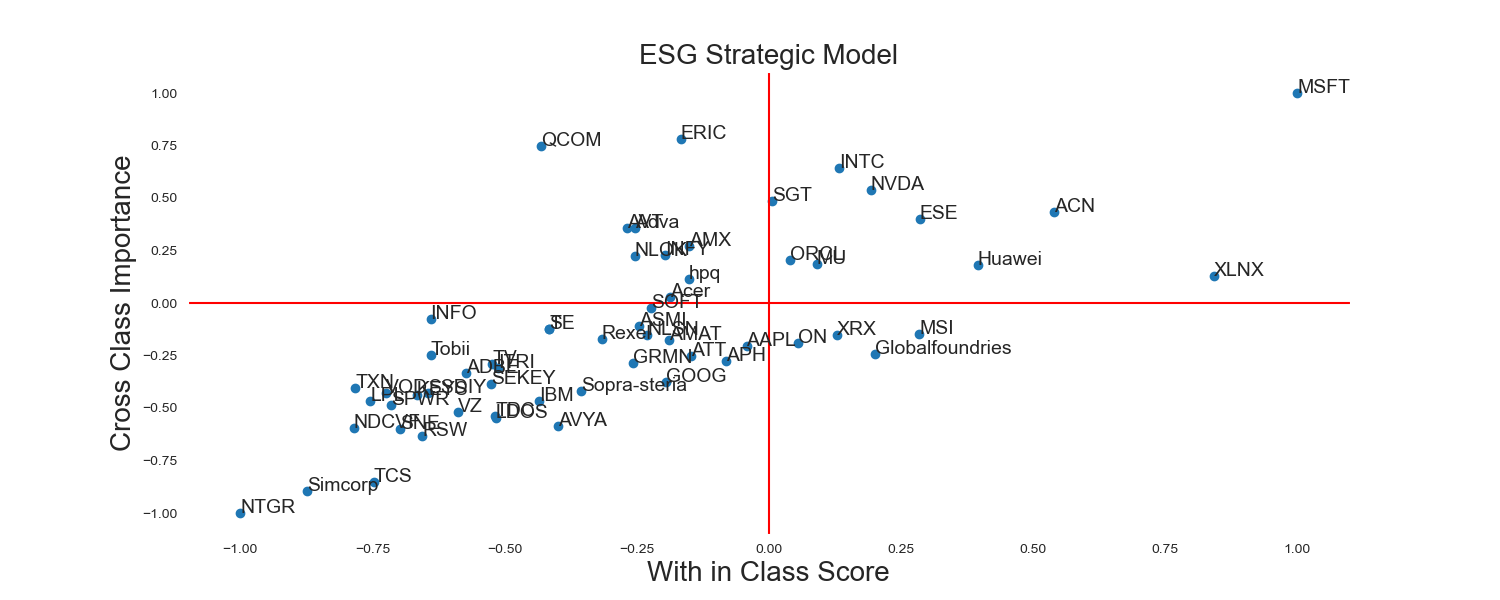
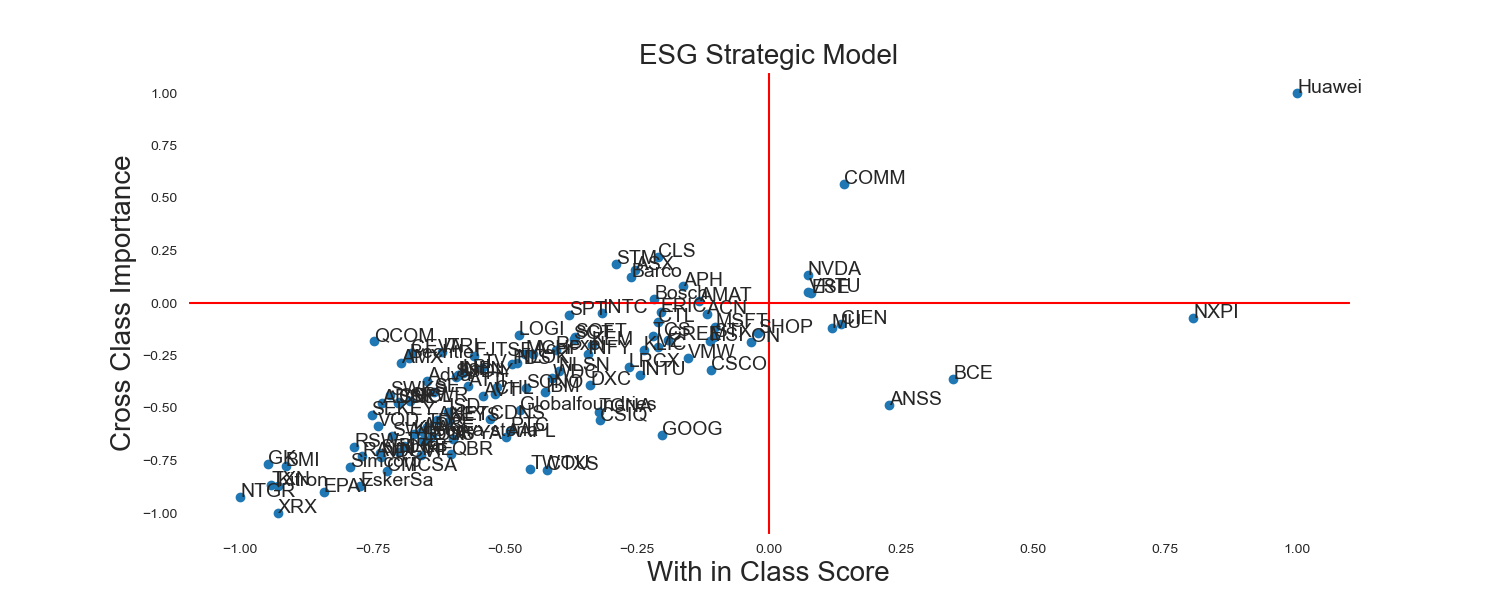
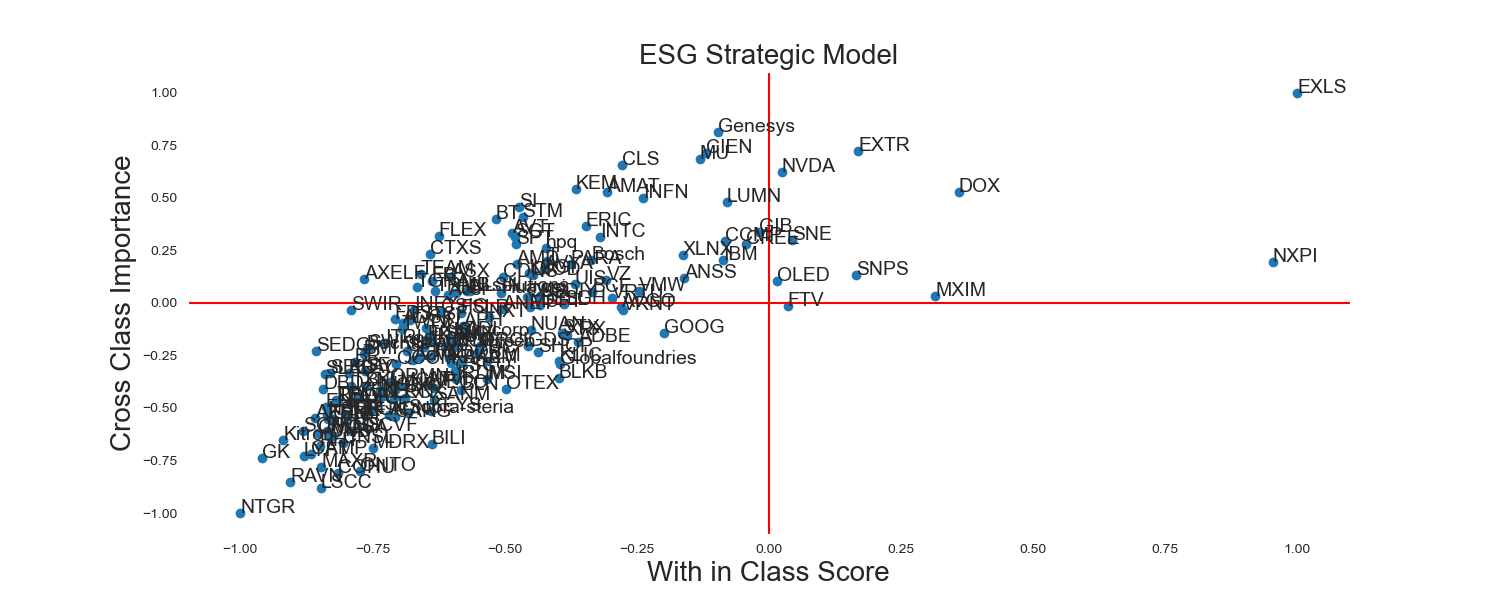
An examination of Figure 10, which delineates the ESG Management Plots from 2014 to 2021, uncovers several notable findings regarding ESG reporting trends within the technology sector.
First, a substantial proportion of firms’ ESG reports are found in Zone III, indicative of a ’shadow strategy.’ Entities within this zone are characterized by their low within-class scores and low cross-class importance. This positioning suggests that these firms neither command a high level of representativeness within the technology industry nor demonstrate potent directionality across different service areas. This pattern suggests that the majority of technology firms strategically align themselves with the dominant trend in ESG reporting. A shadow strategy, it appears, allows companies to sidestep potential pitfalls of misrepresentation, which could lead to adverse implications for ESG investment.
Second, a rise in the number of reports falling within Xone II, signifying ’niche companies,’ warrants attention. The increasing migration into this zone between 2014 and 2021 signals a growing trend of companies focusing on specific ESG topics within their service areas. Niche companies seemingly concentrate on ESG topics with pronounced directionality, aiming to bolster their sustainability performance within their specialized domains.
Third, a select group of firms’ ESG reports consistently occupy Xone I over the years, marking them as ’pioneering companies’ within the technology industry. Firms in this zone demonstrate both high within-class scores and robust cross-class importance, indicating a strong level of representativeness within the industry and potent directionality across diverse service areas. These firms set the bar for ESG reporting, establishing standards, and modeling exemplary practices within the technology sector.
However, an intriguing shift is observed over time, as companies increasingly opt to forgo the role of pioneering companies. Remarkably, a growing number of firms exhibit a tendency to aggregate within Zone III, thus contributing to the homogenization of their ESG reports in critical areas. This phenomenon aligns with the tenets of legitimacy theory, which postulates that corporate engagement in socially responsible endeavors, including ESG reporting, is motivated not exclusively by ethical considerations, but also by the imperative to uphold legitimacy and cultivate a favorable reputation within the purview of stakeholders and the broader societal context. The emerging homogeneity effect identified among these shadow companies within our findings substantiates the theoretical premises of legitimacy theory.
All in all, our analysis illuminates the varied strategies employed by technology firms in their approach to ESG reporting. The predominance of the shadow strategy underlines a prudent approach adopted by numerous companies to avert potential drawbacks linked to inappropriate ESG representation. The increasing prevalence of niche companies in Zone II signals a heightened recognition of the importance of addressing ESG topics that are specific to service area. The persistent presence of pioneering firms in Zone I attests to their unwavering commitment to robust ESG performance; they thereby serve as industry torchbearers in sustainable development.
5 Conclusion And Future Work
In this research, we present a novel strategic framework designed to extract key insights from corporate environmental, social, and governance (ESG) reports. Our main ambition at the outset of this study was to create a sturdy tool tailored to strategic management guidance and adaptable to specific classes or sustainability indices. The utility and performance of this framework were put to the test using datasets from technology companies, affirming its robust analytical prowess and potential applicability in managerial contexts.
Our findings in regard to the homogenization effect observed among shadow companies significantly contributes to legitimacy theory within the context of business strategy and ESG reporting. The empirical evidence extracted from our study underscores the pragmatic inclination of firms to prioritize conformity over differentiation in their pursuit of legitimacy and a positive reputation. This phenomenon is pronounced in the technology industry, where companies choose to cluster within Zone III, aligning their ESG reports with established norms and practices. These strategic responses in regard to ESG reporting underscore the strategic importance of perceived alignment with prevailing standards, a choice that potentially comes at the cost of innovation and distinctiveness. Our research not only provides empirical validation of the theoretical premises of legitimacy theory but also advances our understanding of the nuanced interplay between topic trends and strategic considerations undertaken by firms as they navigate the complexities of ESG reporting within a rapidly evolving business landscape.
The application of our model in both academic and industrial environments could greatly enrich our understanding of ESG trends within and across various categories. Moreover, our model paves the way for an intensive exploration of the correlation between ESG development and market dynamics. Through our framework, managers or investors can conduct longitudinal studies, monitoring changes and enhancements in companies’ ESG performance over time. This capability would empower decision-makers to track the efficiency of sustainability initiatives and pinpoint areas necessitating ongoing improvement.
Our strategy fuses traditional language processing technology, specifically TF-IDF, culminating in a lightweight, user-friendly model. In light of the fast-paced advancement of large language models based on transformer architecture, future work should explore their integration into our framework. Such a merger could potentially amplify the model’s language processing proficiency and reliability, thus boosting our capability to scrutinize ESG development in a way that is not just limited to ESG reports, but extends to all ESG-related online information.
Potential future research could also examine the impact of ESG performance on business outcomes, such as financial performance, market valuation, and stakeholder perception. Establishing a causal relationship between ESG development and company performance would substantiate the case for sustainable business practices. Further, our strategic framework could be deployed in sectors beyond technology, evaluating its cross-sectoral applicability and efficacy. Such a holistic approach would foster a deeper understanding of ESG trends and performance across a plethora of industries.
References
- Lokuwaduge and Heenetigala [2017] Lokuwaduge CSDS, Heenetigala K. Integrating environmental, social and governance (ESG) disclosure for a sustainable development: An Australian study. Business Strategy and the Environment 2017;26(4):438–450.
- Giese et al. [2019] Giese G, Lee LE, Melas D, Nagy Z, Nishikawa L. Foundations of ESG investing: How ESG affects equity valuation, risk, and performance. The Journal of Portfolio Management 2019;45(5):69–83.
- Bouslah et al. [2023] Bouslah K, Hmaittane A, Kryzanowski L, M’Zali B. CSR structures: Evidence, drivers, and firm value implications. Journal of Business Ethics 2023;185(1):115–145.
- Tamimi and Sebastianelli [2017] Tamimi N, Sebastianelli R. Transparency among S&P 500 companies: An analysis of ESG disclosure scores. Management Decision 2017;55(8):1660–1680.
- Giamporcaro et al. [2020] Giamporcaro S, Gond JP, O’Sullivan N. Orchestrating governmental corporate social responsibility interventions through financial markets: The case of French socially responsible investment. Business Ethics Quarterly 2020;30(3):288–334.
- Wang et al. [2023] Wang D, Wei J, Noorderhaven N, Liu Y. Signaling effects of CSR performance on cross-border alliance formation. Journal of Business Ethics 2023;p. 1–20.
- Beccarini et al. [2023] Beccarini I, Beunza D, Ferraro F, Hoepner AG. The contingent role of conflict: Deliberative interaction and disagreement in shareholder engagement. Business Ethics Quarterly 2023;33(1):26–66.
- Gull et al. [2023] Gull AA, Hussain N, Khan SA, Khan Z, Saeed A. Governing corporate social responsibility decoupling: The effect of the governance committee on corporate social responsibility decoupling. Journal of Business Ethics 2023;185(2):349–374.
- Guoyou et al. [2013] Guoyou Q, Saixing Z, Chiming T, Haitao Y, Hailiang Z. Stakeholders’ influences on corporate green innovation strategy: A case study of manufacturing firms in China. Corporate social responsibility and environmental management 2013;20(1):1–14.
- Alsayegh et al. [2020] Alsayegh MF, Abdul Rahman R, Homayoun S. Corporate economic, environmental, and social sustainability performance transformation through ESG disclosure. Sustainability 2020;12(9):3910.
- Kim et al. [2023] Kim C, Zang Y, Wang H, Niu K. When do corporate good deeds become a burden? The role of corporate social responsibility following negative events. Journal of Business Ethics 2023;p. 1–22.
- Liu et al. [2023] Liu AZ, Liu AX, Moon S, Siegel D. Does corporate social responsibility always result in more ethical decision-making? Evidence from product recall remediation. Journal of Business Ethics 2023;p. 1–21.
- Ma et al. [2017] Ma H, Zeng S, Lin H, Chen H, Shi JJ. The societal governance of megaproject social responsibility. International Journal of Project Management 2017;35(7):1365–1377. https://www.sciencedirect.com/science/article/pii/S026378631730073X, social Responsibilities for the Management of Megaprojects.
- Ferrell [2021] Ferrell O. Addressing socio-ecological issues in marketing: environmental, social and governance (ESG). AMS review 2021;11(1-2):140–144.
- Atkins et al. [2023] Atkins J, Doni F, Gasperini A, Artuso S, La Torre I, Sorrentino L. Exploring the effectiveness of sustainability measurement: which ESG metrics will survive COVID-19? Journal of Business Ethics 2023;185(3):629–646.
- Alkaraan et al. [2022] Alkaraan F, Albitar K, Hussainey K, Venkatesh V. Corporate transformation toward Industry 4.0 and financial performance: The influence of environmental, social, and governance (ESG). Technological Forecasting and Social Change 2022;175:121423.
- Egorova et al. [2022] Egorova AA, Grishunin SV, Karminsky AM. The impact of ESG factors on the performance of information technology companies. Procedia Computer Science 2022;199:339–345.
- Goodman and Arenas [2015] Goodman J, Arenas D. Engaging ethically: A discourse ethics perspective on social shareholder engagement. Business Ethics Quarterly 2015;25(2):163–189.
- Freiberg et al. [2020] Freiberg D, Rogers J, Serafeim G. How ESG issues become financially material to corporations and their investors. Harvard Business School Accounting & Management Unit Working Paper 2020;(20-056).
- Sundararajan et al. [2013] Sundararajan A, Provost F, Oestreicher-Singer G, Aral S. Research commentary—information in digital, economic, and social networks. Information Systems Research 2013;24(4):883–905.
- Xie et al. [2016] Xie X, Fang L, Zeng S. Collaborative innovation network and knowledge transfer performance: A fsQCA approach. Journal of Business Research 2016;69(11):5210–5215. https://www.sciencedirect.com/science/article/pii/S0148296316302946.
- Chen et al. [2012] Chen H, Chiang RH, Storey VC. Business intelligence and analytics: From big data to big impact. MIS quarterly 2012;p. 1165–1188.
- Shaw et al. [2001] Shaw MJ, Subramaniam C, Tan GW, Welge ME. Knowledge management and data mining for marketing. Decision support systems 2001;31(1):127–137.
- Xia et al. [2021] Xia Z, Chen J, Anchen S. Mining the relationship between COVID-19 sentiment and market performance. arXiv preprint arXiv:210102587 2021;.
- Arvidsson and Dumay [2022] Arvidsson S, Dumay J. Corporate ESG reporting quantity, quality and performance: Where to now for environmental policy and practice? Business Strategy and the Environment 2022;31(3):1091–1110.
- Mervelskemper and Streit [2017] Mervelskemper L, Streit D. Enhancing market valuation of ESG performance: is integrated reporting keeping its promise? Business Strategy and the Environment 2017;26(4):536–549.
- Fatemi et al. [2018] Fatemi A, Glaum M, Kaiser S. ESG performance and firm value: The moderating role of disclosure. Global finance journal 2018;38:45–64.
- Baker et al. [2021] Baker ED, Boulton TJ, Braga-Alves MV, Morey MR. ESG government risk and international IPO underpricing. Journal of Corporate Finance 2021;67:101913. https://www.sciencedirect.com/science/article/pii/S0929119921000341.
- Doni and Fiameni [????] Doni F, Fiameni M. Can innovation affect the relationship between Environmental, Social, and Governance issues and financial performance? Empirical evidence from the STOXX200 index. Business Strategy and the Environment;n/a(n/a). https://onlinelibrary.wiley.com/doi/abs/10.1002/bse.3500.
- Terjesen and Sealy [2016] Terjesen S, Sealy R. Board gender quotas: Exploring ethical tensions from a multi-theoretical perspective. Business Ethics Quarterly 2016;26(1):23–65.
- Tan [2021] Tan ZS. Ethics events and conditions of possibility: How sell-side financial analysts became involved in corporate governance. Business Ethics Quarterly 2021;31(1):106–137.
- English [2023] English W. Can welfare economics justify corporate philanthropy? Proposing the philanthropy multiplier as a metric for evaluating corporate philanthropic expenditures. Business Ethics Quarterly 2023;p. 1–31.
- Zyglidopoulos et al. [2016] Zyglidopoulos S, Williamson P, Symeou P. The corporate social performance of developing country multinationals. Business Ethics Quarterly 2016;26(3):379–406.
- Goh et al. [2013] Goh KY, Heng CS, Lin Z. Social media brand community and consumer behavior: Quantifying the relative impact of user-and marketer-generated content. Information systems research 2013;24(1):88–107.
- Melville [2010] Melville NP. Information systems innovation for environmental sustainability. MIS quarterly 2010;p. 1–21.
- Watson et al. [2010] Watson RT, Boudreau MC, Chen AJ. Information systems and environmentally sustainable development: energy informatics and new directions for the IS community. MIS quarterly 2010;p. 23–38.
- Mithas et al. [2011] Mithas S, Ramasubbu N, Sambamurthy V. How information management capability influences firm performance. MIS quarterly 2011;p. 237–256.
- Greenwald et al. [2010] Greenwald A, Kannan K, Krishnan R. On evaluating information revelation policies in procurement auctions: A Markov decision process approach. Information Systems Research 2010;21(1):15–36.
- Meyer et al. [2014] Meyer G, Adomavicius G, Johnson PE, Elidrisi M, Rush WA, Sperl-Hillen JM, et al. A machine learning approach to improving dynamic decision making. Information Systems Research 2014;25(2):239–263.
- Wang et al. [2020] Wang Z, Jiang C, Zhao H, Ding Y. Mining semantic soft factors for credit risk evaluation in peer-to-peer lending. Journal of Management Information Systems 2020;37(1):282–308.
- Ramos et al. [2003] Ramos J, et al. Using tf-idf to determine word relevance in document queries. In: Proceedings of the first instructional conference on machine learning, vol. 242 Citeseer; 2003. p. 29–48.
- Lee and Kim [2023] Lee J, Kim M. ESG information extraction with cross-sectoral and multi-source adaptation based on domain-tuned language models. Expert Systems with Applications 2023;221:119726.
- Zanatto et al. [2023] Zanatto C, Catalão-Lopes M, Pina JP, Carrilho-Nunes I. The impact of ESG news on the volatility of the Portuguese stock market—Does it change during recessions? Business Strategy and the Environment 2023;.
- Cheng et al. [2023] Cheng LT, Sharma P, Broadstock DC. Interactive effects of brand reputation and ESG on green bond issues: A sustainable development perspective. Business strategy and the environment 2023;32(1):570–586.
- Lu et al. [2023] Lu Y, Xu C, Zhu B, Sun Y. Digitalization transformation and ESG performance: Evidence from China. Business Strategy and the Environment 2023;.
- SP5 [????] S&P 500 Sustainability Screened Index | S&P Dow Jones Indices;. (Accessed on 07/03/2023). https://www.spglobal.com/spdji/en/indices/esg/sp-500-sustainability-screened-index/#overview.
Supporting Information