These authors contributed equally to this work. [1,4]\fnmAlessandro \surLaio \equalcontThese authors contributed equally to this work.
These authors contributed equally to this work.
[3]\fnmValerio \surLucarini \equalcontThese authors contributed equally to this work.
[1] \orgdivPhysics Department, \orgnameInternational School for Advanced Studies (SISSA), \orgaddress\streetVia Bonomea 265, \cityTrieste, \postcode34136, \countryItaly
2] \orgdiv Institute for Environmental Studies, \orgnameVrije Universiteit Amsterdam, \orgaddress\streetDe Boelelaan 1105, \cityAmsterdam, \postcode081 HV, \countrythe Netherlands
3] \orgdivDepartment of Mathematics and Statistics & Centre for the Mathematics of Planet Earth, \orgnameUniversity of Reading, \orgaddress\streetWhiteknights Campus, \cityReading, \postcodeRG66AX, \countryUK
4]\orgnameInternational Center of Theoretical Physics (ICTP), \orgaddress\streetViale Miramare 11, \cityTrieste, \postcode34151, \countryItaly
Agnostic detection of large-scale weather patterns in the northern hemisphere: from blockings to teleconnections
Abstract
Detecting recurrent weather patterns and understanding the transitions between such regimes are key to advancing our knowledge on the low-frequency variability of the atmosphere and have important implications in terms of weather and climate-related risks. We adapt an analysis pipeline inspired by Markov State Modelling and detect in an unsupervised manner the dominant winter mid-latitude Northern Hemisphere weather patterns in the Atlantic and Pacific sectors, defined by the slowest decaying modes of a suitable projection on a discrete basis of the weather dynamics. When focusing on a longitudinal window of 60∘, we recognise, first and foremost, a longitude-dependent estimate of the slowest relaxation times, which are often related with transitions between blocked regimes and zonal flow. We analyze in detail the Atlantic and Pacific sectors, finding, additionally, clear evidence of the strong connection between blockings in the two regions. When the analysis is performed in a broader geographical region of the Atlantic sector, we detect teleconnection patterns like the North Atlantic Oscillation and a large-scale mode of variability alternating between Scandinavian and Greenland blocking. The approach proposed here has great potential for intercomparing climate models and for assessing the impact of climate change on the low-frequency variability of the atmosphere.
1 Introduction
Low-frequency variability in meteorology refers to a broad spectrum of atmospheric processes occurring over time scales ranging from approximately one week to about a month. Despite extensive research efforts, a comprehensive understanding of its underlying nature remains an ongoing challenge [1]. From a practical perspective, achieving efficient extended-range forecasts beyond the typical 7-10 day window in mid-latitudes poses significant difficulties, and the climatic impacts of low-frequency phenomena is substantial [2], also in terms of modulating changing climatic conditions [3]. Long time scales are typically entangled with large spatial scales [4, 1, 5]. Large scale weather patterns in the mid-latitudes hold significant importance due to their impact on weather conditions over vast regions. Understanding low frequency variability, in space and time, is vital as it has implications for weather forecasting, climate studies, and disaster preparedness.
One of the critical aspects of mid-latitude low-frequency variability is the transitions between two distinct flow regimes: blockings and zonal flow [6, 7, 8, 9]. Blocking patterns are synoptic features that are characterized by persistent high-pressure systems in the mid-latitudes, leading to a disruption of the typical west-to-east flow of the jet stream [10, 11, 12]. Blockings typically manifest in either the Atlantic or Pacific sectors and, more rarely, in both concurrently [13]. The lifespans of blocking events can span several days to a few weeks, resulting in the emergence of extreme and protracted weather anomalies with significant regional implications [14]. Depending on geographic location, season, and pre-existing conditions, blockings can induce diverse weather phenomena such as heat waves, cold spells, extensive droughts leading to wildfires, and floods [15, 16, 17, 18, 19, 20, 21]. Predicting the onset and the decay of blocking events is rather difficult even for modern weather prediction systems [22], and a correct representation of their statistics is elusive even for modern climate models [23, 24, 25]. Indeed, large uncertainties exist regarding the response of the statistics of blocking events to climate change [26], even if recent studies indicate the possibility of an overall increase in their size [27] and intensity [28]. These difficulties reflect the fact that the blockings are associated with anomalously stable conditions of the atmosphere [29, 30], leading to serious fundamental implications in terms of overall model accuracy in describing their dynamics and statistical properties [31].
Accurate identification of blockings is usually achieved through various objectively-derived indices based on the geopotential height [32] or potential vorticity (PV) fields [33]. More recently, identification of blockings has been perfromed using statistical indicators relying on Empirical Orthogonal Functions (EOFs) [34] as well as multidimensional methodologies [35]; see [36] for a recent survey on the topic.
The low-frequency variability of the northern hemisphere mid-latitudes features weather patterns having spatial and temporal scales larger than those of the blockings’. These are the so-called teleconnection patterns, which are responsible for driving the dynamics of the atmosphere at planetary scale and for facilitating the coupling between atmospheric and oceanic processes. Particularly relevant are the so-called Pacific-North American teleconnection pattern (PNA) [37] and the North Atlantic Oscillation (NAO) [38]. The PNA pattern covers a substantial portion of the North Pacific and North America and exerts influence on synoptic activity and the subtropical jet stream over the north Pacific, leading to climate impacts over extensive regions of the North American Continent. The NAO is a dipolar pattern of mean sea level pressure over the north Atlantic, extending from the subtropical (Azores high) to sub-Arctic latitudes (Icelandic low). It significantly affects the variability of westerly winds over eastern north Atlantic and Western Europe, making it a crucial factor in shaping Europe’s winter climate. Whereas PNA and NAO are considered to be large-scale but still regional teleconnections patterns, hemispheric teleconnections have been detected as well, such as the Northern Annular Mode (NAM, named also Arctic Oscillation [39]) and the circumglobal teleconnection pattern [40]. These have nontrivial connections with both NAO and PNA [13, 41]. See [42, 43, 44, 45] for a detailed discussion of the dynamics and detection methods of teleconnection patterns and off their nontrivial link with blockings.
Besides the above mentioned teleconnection patterns or main modes of variability, other recurring circulation patterns have been found relevant to describe in a coarse grained sense the weather evolution over Europe and North America. These go under the umbrella of the so-called weather regimes (see for example [46, 47, 48]). They are more persistent and larger than synoptic scale weather systems, and associated often with surface extremes over vast regions [49, 50, 51, 52]. Often, the dominant feature of North-Atlantic weather regimes is a persistent ridge or blocking (over the North-Atlantic, Greenland, central Europe or Scandinavia), but some of them are predominantly cyclonic regimes [48, 53].
A rather popular way to describe in a coarse-grained sense the evolution of the weather in the mid-latitudes amounts to constructing via data-driven methods finite state Markov models, where each state is associated with a weather patterns, and then investigate the properties of the resulting Markov chain [54, 55, 56, 57]. Recently, more advanced machine learning-based methods have been used to detect recurrent mid-latitude atmospheric regimes in a simple model of the atmosphere [58]. In this work we wish to advance this perspective and propose a procedure to detect in an unsupervised manner anomalously persistent and recurrent weather patterns. The procedure is routed in Markov State modelling, an approach originally introduced for studying metastability in molecular systems [59] [60]. The key idea in this approach is first classifying all the data (for example the molecular configurations, or, in the context of this work, the pressure patterns) in a finite set of microstates, in which data are similar. One then empirically estimates the transition probability, at a fixed time lag, between the microstates. The eigenvalues of this transition matrix allow estimating the relaxation times of the system. If a gap in the spectrum exists, say after the n-th eigenvalue, one can represent the dynamics as a Markov process between n states, which can be considered metastable on the time scale defined by the (n+1)th eigenvalue. Such states are identified by the sign pattern of the eigenvectors associated to the ”slow” eigenvalues.
This procedure, if applied out-of-the-box to the analysis of weather data, provides poor results for two reasons. First, the pressure patterns on the northern hemisphere are extremely variable. Since the number of available observations in our dataset is of the order of a few thousands, the set of pressure patterns cannot be divided in microstates which are at the same time sufficiently populated, and which contain sufficiently similar patterns. In order to address the first problem we here propose to perform MSM restricted to a longitude window. If one considers the pressure patterns in a longitudinal window of, say, 60 degrees, it will be more likely finding coherent patterns which are similar in the window, even if they can differ outside it. We will nonetheless show below that, in the spirit of the teleconnections mentioned above, coherence between the patterns is found outside the window used for clustering purposes. In this manner, we are able to classify the pressure patterns in microstates which, at the same time, include a sufficient number of observations, and include pressure patterns which are qualitatively similar. Such microstates will be used as a basis to represent the dynamics, as in standard MSM. One can use this scheme to perform an analysis by using a window of fixed width, which moves on the longitudinal axe, covering in this manner the whole globe.
A second problem is that a genuine dimensional reduction using MSM can be performed only if one observes a significant gap between consecutive relaxation times, this being able to define a cutoff. Such a gap, as we see below, is typically not present. This, strictly speaking, implies that weather dynamics cannot be robustly described by a Markov chain between few states associated to different weather patterns. However, even in these conditions, one can still inspect the pressure patterns which are associated to the slowest relaxation times. More in detail, a given relaxation time will be associated to an eigenvector in the space of the microstates. Even if these pressure patterns cannot be considered genuine metastable states in the language of MSM, they still represent pressure configurations which tend to be persistent. In this work we analyze these patterns in specific geographic locations, and show that the patterns are akin to persistent atmospheric states reported in the literature, such as blocking, zonal flow, and so-called weather regimes. Therefore, our results suggest that our approach provides a pipeline to detect such patterns in as unsupervised manner.
2 Methods and Data
Our study focuses on the winter low-frequency variability in the mid-latitudes of the Northern Hemisphere. Hence, following [5], we examined the 1950-2022 December-January-February (DJF) daily average geopotential height patterns at 500hPa (GPH) extracted from the resolution NCEP renalysis 1 [61] for the latitudinal band . We have detrended and deseasonalized the data by subtracting respectivelly the DJF average for each year separately and the average seasonal signal.
On these preprocessed data, we performed Markov state modelling (MSM). In short, MSM involves first dividing the data into a large set of discrete states called microstates. The data belonging to a microstate are assumed to be similar (see below for a detailed discussion on this point). One then estimates the transition probability, in a given time, between the microstates. The dynamics of the system is then described in the basis of the eigenvectors of the transition probability matrix, with the eigenvalues providing information on the relaxation times.
More specifically, let’s denote the data points by , where labels the different data. In the case of this work, is the GPH pattern, recorded on geographical region defined below on a latitude/longitude grid, and labels the day in which a specific pattern has been recorded. The data are then divided in microstates using a K-means clustering algorithm [62]. Specifically, one chooses a number K of microstates, and, by K-means, one finds, for pressure pattern an integer cluster label .
To decide the value of one should consider two different factors: (i) the minimum number of elements in each microstate should be large enough for a realiable estimation of the transition probability matrix and (ii) the GPH patterns assigned to a microstate should be (qualitatively) similar. The first condition is pretty simple to satisfy: since the transition probability in MSM is typically sparse, it is sufficient to choose K in such a way that each cluster is visited a sufficient number of times. Since the number of available days is approximately 6400, we opted for 180 microstates, which implies that each microstate will contain, on average, 35 days. The viability of this choice is demonstrated by dedicated experiments on artificial data generated by the MPI-ESM-LR model [63]. In Supp. Inf. we show that the results are qualitatively unchanged if one performs the analysis on 1000 winters, instead of 72, and if one chooses a larger number of microstates. Satisfying the second condition turned out to be much more difficult. If one applies K-means clustering with K of order 100 on the GPH patterns across all longitudes, one finds that patterns which are qualitatively different are assigned to the same cluster . As an example, it is possible to observe a specific and recognizable pressure pattern in the Atlantic sector (say an omega-block) and, simultaneously, a variety of different pressure patterns in the Pacific sector (see Supp. Inf. for some examples). This observation prompted us to develop a variant of MSM, specifically designed to keep into account the fact that pressure patterns can be strongly correlated for spatial scales corresponding to zonal wavenumbers up to but - in general - only weakly correlated on a truly global scale [5]. In particular, to weight appropriately local correlations we multiply the pressure patterns by a Gaussian kernel, centered on a specific longitude value , with standard deviation of order of some tenths of degrees (see below). Therefore, the distance between pressure pattern and pressure pattern is given by
| (1) |
where is the area of the grid patch of latitude and longitude , and the sum over runs between and .
Choosing the kernel width is a crucial decision as it determines the scale of climatic events we focus on.
We present the results for two kernel width, and , qualitatively corresponding to windows spanning a longitude of , to focus respectively on synoptic scale and larger scale climate events.
After dividing the data into microstates, we proceed as in standard MSM: we estimate the transition probability matrix of the process from the data. Each row element of the matrix represents the index of the ”departure” microstate, while each column element represents the index of the ”arrival” microstate. The element is the estimated probability of moving from the ith microstate to the jth microstate after the time lag , namely . By construction, all the matrix elements are non-negative and the rows of the transition probability matrix sum to 1, namely is a stochastic matrix [64]. In our specific case, we choose day. In Supp. Inf. we show that the slowest relaxation times remain very similar if one chooses days. is estimated using only consecutive days, separately on each winter, and averaged over all the available winters in our dataset.
Also following the standard MSM pipeline, we then perform an eigen-decomposition of the transition probability matrix , finding its eigenvectors and eigenvalues . Since the is a stochastic matrix, its first eigenvalue equals one, while the other eigenvalues are complex numbers with norms smaller than one. The components of the eigenvector related to the first eigenvalue are proportional to the long-term probability of each microstate. The eigenvectors of linked to the eigenvalues with higher norms correspond to the slow modes of the system. If the eigenvalue is complex, in the spectrum it is always present also its conjugate. In particular, a perturbation to the stationary state described by the eigenvector decays to zero with an exponentially damped sinusoid. The time constant of the exponential and the frequency of the oscillation are respectively given by
| (2) |
When the eigenvalues of this dataset have a complex component, they correspond to oscillation times that are very long, say of the order of a month, and therefore practically negligible, as the time scale of the decay is around a week.
To visualize the eigenvectors associated with a given relaxation time we find its two most distant components, in the complex plane. These two components correspond to two microstates. We then visualise the corresponding pressure pattern by plotting the mean over their elements. To check if the relaxation dynamics has influence on variables which are not explicitly controlled in MSM, we also visualise the average, 2-meter air temperature field (t2m) and the precipitation rate field (precip). To have a clearer picture and show large-scale patterns, we always visualise these fields over the whole northern hemisphere, highlighting the region used for deriving the MSM by a green frame. In algorithm 1, we provide a concise overview of the whole analysis pipeline.
3 RESULTS
We analyzed by Markov State Modeling the pressure patterns observed in the last 72 winters in the northern hemisphere, in order to detect persistent weather patterns. Importantly, we do not perform this analysis globally, on the whole hemisphere. We instead focus the analysis to a longitudinal window. This is achieved by computing the distance between the pressure patterns observed in different days according to eq. 1, in which the contribution of each longitude is weighted by a Gaussian kernel centered on a given longitude . This, as discussed above, allows finding microstates including pressure patterns which are qualitatively similar, a prerequisite for deriving a meaningful MSM. As a consequence, our analysis does not provide a single MSM but a longitude-dependent MSM, in which the similarity between the patterns is explicitly controlled only in a specific region, while outside this region it only emerges if global-scale correlations are present.
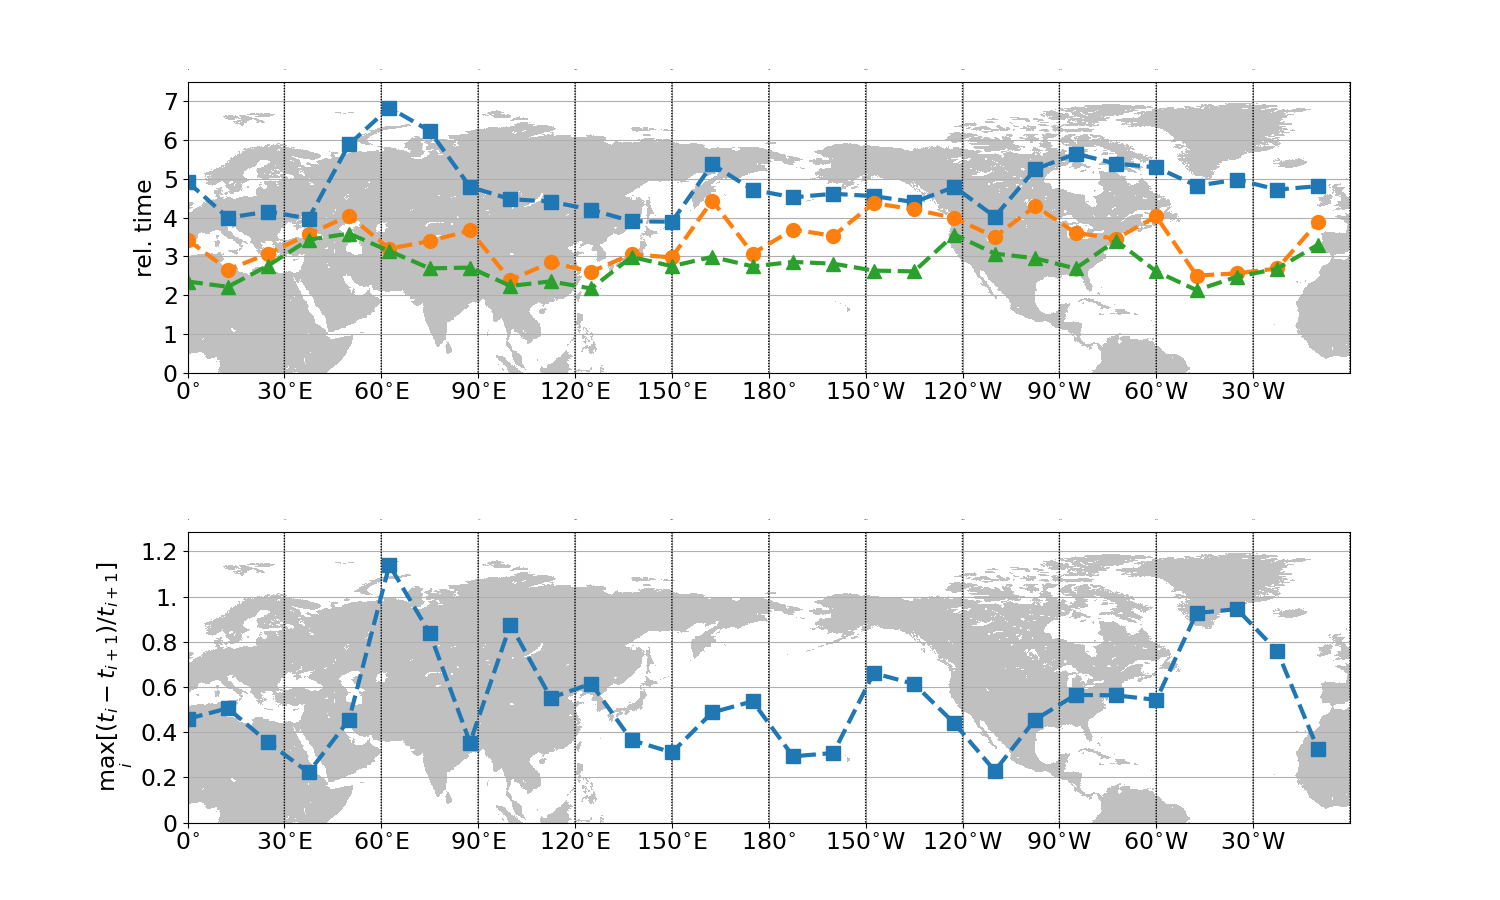
In Figure fig. 1, top panel, we show the first three slowest relaxation times of the MSM as a function of the longitude , for a kernel width of . The slowest relaxation time fluctuates longitudinally between approximately 4 and 7 days, with higher values near the centre of the Eurasian and American continental masses. Instead, lower values are found over the oceans, near the Pacific west coast, and over central Europe. Such a geographical pattern follows to a good degree of approximation, the patterns of synoptic variability [65], with lower relaxation times being associated with more intense synoptic disturbances. This fits with the concept of baroclinic instability as being the catalyzer of transitions between competing states of the low-frequency variability of the atmosphere [6, 8].
In Figure 1, bottom panel, we show the maximum relative gap between two successive relaxation times at the different longitudes. The gap is at most of order one, which implies that the i-th relaxation time, is at most twice larger than the (i+1)-th for all the first ten relaxation times (see figure caption). The fact that we do not observe any significant gap in the relaxation times implies that atmospheric dynamics cannot be meaningfully described as a Markov process between a small number of metastable states. Hence, there is always a certain degree of subjectivity in performing a cutoff in order to define a discrete, reduced order model. In other words, the relaxation to the steady state involves a mixture of processes at different time scales which are all interlaced. This observation is nor surprising: indeed it confirms the lack of temporal (and spatial) scale separation that is very apparent from spectral analyses of the mid-latitude atmospheric variability [4, 1, 5].
In the following we describe in detail the eigenvectors associated to the two slowest relaxation times for windows centered around two longitudes: , in the Atlantic region, and , in the Pacific region. The eigenvectors are visualized by plotting the average pressure, precipitation and temperature patterns of the two microstates with the most significant differences in components (see Methods). While these eigenvectors cannot be thought of as sufficient to describe weather dynamics, they provide, by definition, the best possible description of the transition matrix in a span of dimension 3 (the span includes also the eigenvector which is associated to , namely to the stationary state). This implies that while the patterns associated to these eigenvectors cannot be considered genuine metastable states that can be singled out with respect to the rest of the variability, they do reflect dominant modes of variability associated with persistent configurations. Indeed, as we will see, they bear similarities to persistent atmospheric states previously described in the literature, such as blocking, zonal flow, and weather regimes.
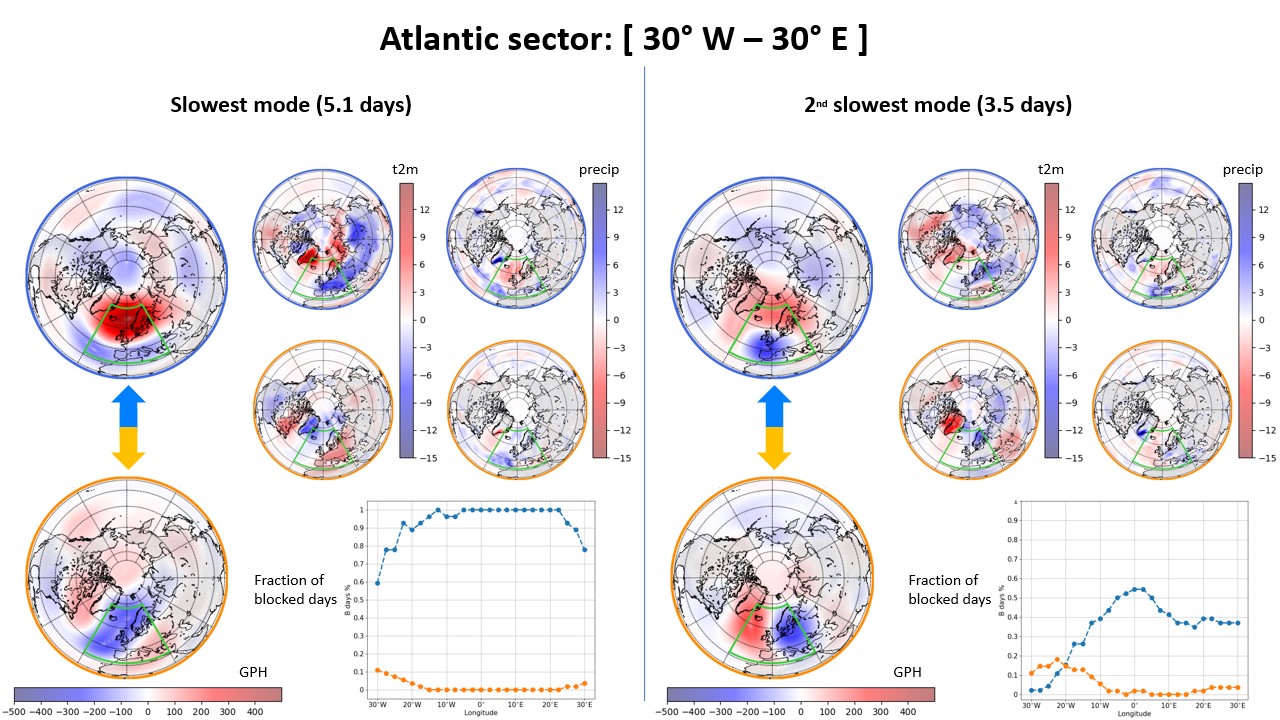
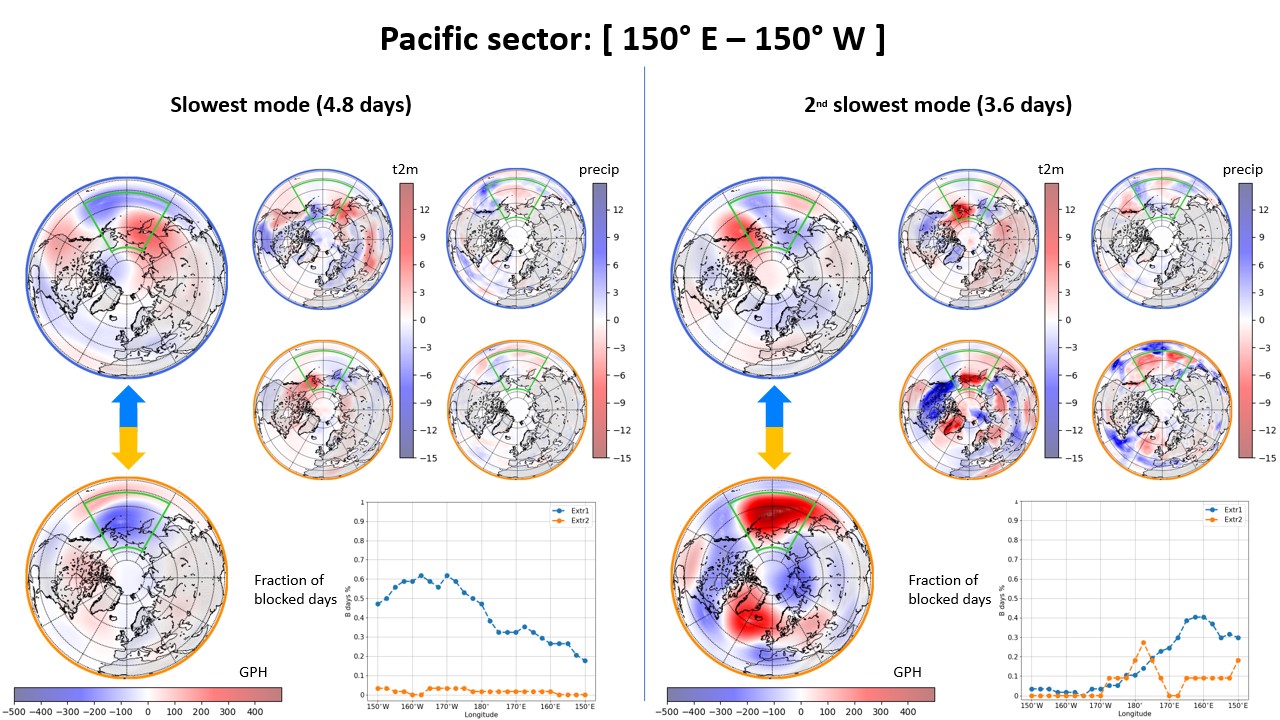
Results for the Atlantic and Pacific sectors are presented in fig. 2 and fig. 3, respectively. In this analysis, the kernel width is . The results for a larger kernel width will be described later. Both charts have dedicated sections on the left for the first eigenvector and on the right for the second. In each section, a graph is presented in the bottom right corner, displaying the percentage of blocking days as a function of longitudes for the two opposing microstates obtained through the pipeline procedure. We use the blue colour to plot and emphasize the results for the microstate with more blocked days based on the TM index, while the orange represents the other one.
To obtain a clearer picture of atmospheric circulation anomalies, we analyse composite maps of GPH anomaly fields associated with the two most extreme microstates, for the first and second eigenvectors. The graphs concerning the first eigenvector show a very clear transition between blocked and non-blocked atmospheric states for both the Atlantic (fig. 2) and the Pacific sectors (fig. 3). While the agreement is striking for Atlantic sector, over the Pacific, the percentage of blocking days is somewhat lower, and the blockings are located mainly in the western part of the selected region. The e-folding time of the first eigenvectors for the Atlantic and Pacific sectors matches well the time scales of mid-latitude synoptic variability associated with baroclinic disturbances, which are responsible for the transitions between blocked and zonal states [6, 8].
Note that the core of the Pacific blockings are geographically shifted towards Siberia, in agreement with [66, 67]. We also notice that the (predominatly) zonal flow pattern over the Atlantic features the well-know meridionally tilted shape associated with the North-Atlantic jet stream.
Looking at the temperature and precipitation anomalies in the Atlantic sector composites (fig. 2), we find confirmation of the impact of blocking events on such meteorological fields, leading to surface extremes. In agreement with the original observations by Rex [68], blockings here are associated with a dipole of warm anomalies in northern vs cold anomalies in central and southern regions, whereas dry anomalies prevail almost everywhere, except in the southermost regions. Note also the wet anomaly in South Greenland. On the other hand, zonal flow is characterized by moist air masses moving towards Europe, resulting in stronger precipitation. The enhanced eastward advection also leads to warmer conditions in the central and southern regions.
Changes in the advection due to the occurrence of blockings are particularly important in the Pacific sector, see fig. 3. Zonal conditions are associated with strong cold anomalies in the western sector, as a result of enhanced advection from the cold continental mass, whereas the eastern sector features warm anomalies; compare with [69, 70]. The occurrence of blockings leads almost everywhere within the region of interest to reduced precipitation, as a result of prevailing anticyclonic conditions. Notably, one finds increased precipitation near the western North American coast [71].
The GPH maps related to the second eigenvector contain features associated with westward propagating blocking structures. Interestingly, the central and western North Pacific blocks shown in fig. 3 (right section, highlighted in orange) seem to occur sometimes simultaneously with North-Atlantic blocks, thus indicating the occurrence of a global blocking pattern, which has the clear signature of the so-called Northern Anular Mode. The fact that our method individuates global blockings suggests that such simultaneous occurrences are not just random events but reflect a physical link between Pacific and Atlantic phenomena [13, 31]. The simultaneous occurrence of blockings in the North Pacific and North Atlantic is interpreted as related to the NAM [13].
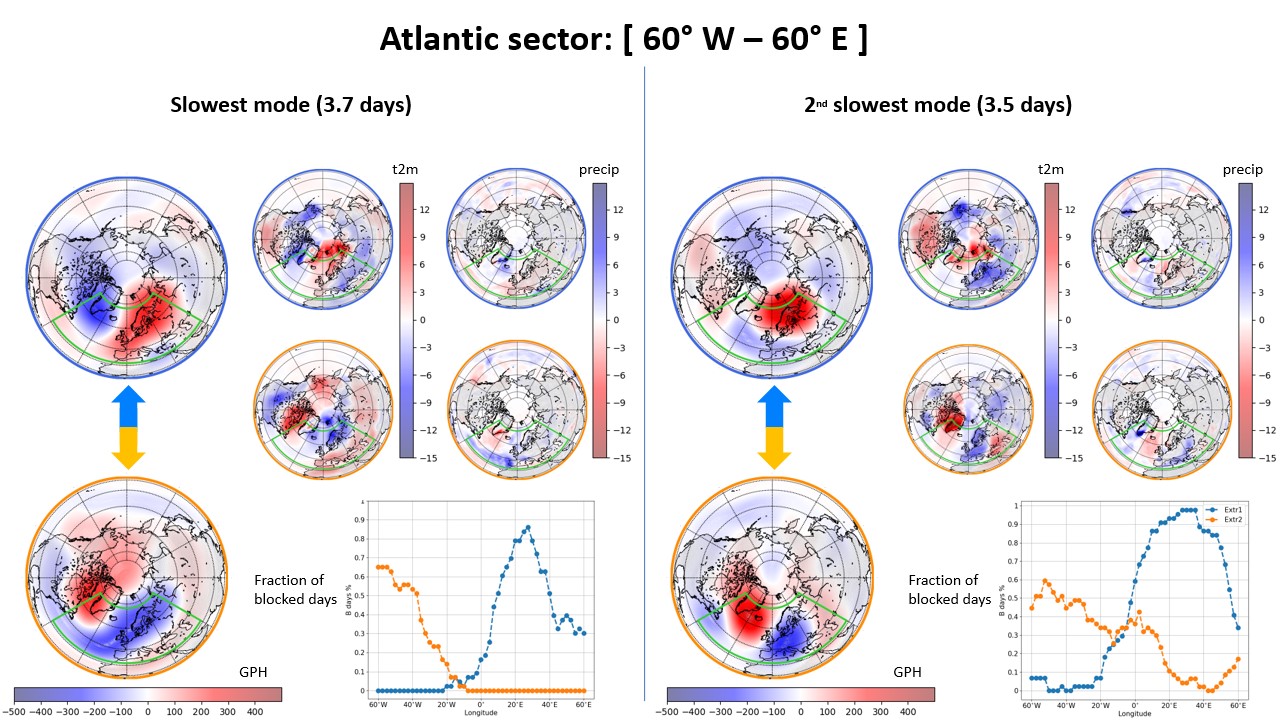
The window captures very well the slowest transitions related to blocked and zonal flow, however points also to the relevance of westward propagating blocking structures and of global teleconnections. To be able to explore better these latter aspects, we increase the window size to in longitude.
In order to focus our analysis, we restrict ourselves to the extended Atlantic region defined by . Our main findings are portrayed in fig. 4, which is structured along the same lines as figs. 2 and 3.
In the following, we discuss composite maps of GPH, temperature and precipitation anomaly fields associated with the two most extreme microstates for the first and second eigenvectors. The GPH anomaly fields related to the first eigenvector, show very large structures with anomalies covering the whole hemisphere (fig. 4, left section), pointing to the transition between positive and negative NAO phases (NAO+ and NAO-, corresponding to the upper and lower panels in fig. 4, respectively). This is supported by the temperature and precipitation anomaly composites. NAO+ is related to a strongly tilted jet and, consequently, a strong ridge over Europe leading to warm and dry anomalies over the western and northern part of the continent. Instead, NAO- is related to an anomalously zonal and southern jet, which brings abundant precipitation over the Mediterranean region, while cold arctic air masses can reach northern and central Europe. Note also that the decay time associated with the first eigenvector is in good agreement with the e-folding time of the NAO index time series [72, 73].
The GPH anomaly fields related to the second eigenvector show similar structures, but with a smaller spatial extension, consistently with the shorter relaxation time. They illustrate the transition between Scandinavian blocking and Greenland blocking (or North-Atlantic ridge), corresponding to the upper and lower panels in fig. 4, respectively. Both circulation anomalies lead to anomalously cold air over most of the European continent, however the origin of the cold air differs. The Scandinavian blocking favours cold air advection from Siberia, whereas the deep trough next to the Greenland blocking, allows Arctic airmasses to reach all the way south to the Mediterranean. This transition between circulation patterns connected to anomalously cold conditions brings prolonged periods of cold winter weather over large parts of the continent. Both circulation structures are related to mainly wet anomalies over the Mediterranean, suggesting an anomalously southern location of the jet stream.
4 Discussion and Conclusions
We analyse the low-frequency variability of the atmosphere based on unsupervised clustering and Markov state modelling. Compared to similar studies in the literature, we do not choose the number of relevant clusters a-priori. Instead, we order the transitions among microstates based on their relaxation time, and analyse the slowest ones. Another important difference with respect to previous studies is that in constructing the MSM we focus on a specific longitude, which is then varied, producing in practice a longitude-dependent MSM. We describe in detail the results for two longitudinal window spans of and .
Our results show that in case of the -degrees window, the slowest modes are associated with transitions between blocking states and zonal flow, both in the Atlantic and Pacific sectors, with the associated surface temperature and pressure anomalies. Additionally, we find strong evidence of a mode of variability strongly associated with the simultaneous occurrence of blockings in both sectors.
Considering a longitudinal window for the Atlantic sector leads as well to the detection of blockings and zonal flows as important features. Nonetheless, the slowest transitions are in this case related to the dynamics of substantially larger scales than synoptic ones, associated with the westward propagation of blocking structures. This is consistent with slow transitions between specific weather regimes. We find the the slowest and second slowest relaxation modes are associated with the transition between NAO+ and NAO- states, and the Scandinavian blocking and Greenland blocking, respectively. It is quite encouraging that a totally agnostic method is able to identify well-know and widely discussed meteorological features.
Furthermore, we observe that the patterns are often related to each other. For example, it is not straightforward at all to differentiate between Greenland blocking and NAO-. In [74] it is shown that NAO is strongly related to variations in occurrence of high latitude blocking, and can be interpreted from a blocking perspective. Another interesting connection we observe is between North Pacific and North Atlantic blockings, which are sometimes synchronised with each other in form of an NAM-like hemispheric teleconnection (fig. 3). However, the pattern we find is not completely annular because it contains several high and low pressure centres all over the hemisphere, resembling the wavenumber-5 pattern of the circumglobal teleconnection found by [40].
An important outcome of our analysis – and certainly related to the similarity of different weather patterns discussed above – is that we do not find a significant gap between relaxation times of the various decaying modes. Hence, we cannot claim that a handful of weather patterns robustly describe the relevant large-scale atmospheric dynamics. This underlines the irreducible complexity of atmospheric dynamics of the mid-latitudes, pointing out that there is always a certain degree of arbitrariness when selecting dominant modes and excluding the rest. The lack of such a gap, which is apparent when performing a spectral analysis of the mid-latitude atmospheric variability [4, 1, 5], can also be seen as the reason behind the well-studied presence of deviations from exponential behaviour of the autocorrelation of the NAO index for long time lags [72, 73].
Finally, this all shows that our interpretation of modes of variability, weather regimes, and teleconnections should not be too rigid. It is clear that, on large scales, the atmosphere contains a few preferred regions where the low-frequency variability is higher than elsewhere and a few preferred patterns, through which it can realise such variability. However, the details and locations of such patterns vary significantly as a result of the high chaoticity of the atmospheric dynamics and of the presence of many factors determining non-autonomous behaviour. The regional modes of variability can be excited by several forcings (tropical, stratospheric, extra-tropical sea surface temperatures) and can be connected with each other through the jet stream and Rossby waves. As a result of teleconnections, far-reaching and circumglobal patterns emerge, with important implications in terms of climate variability and predictability, at different spatial and temporal scales.
Even if we discuss in detail only the results in two specific, much studied regions of the Northern Hemisphere, the methodology discussed in this contribution can be adapted seamlessly for studying dominant weather patterns in other areas of the planet that have been much less extensively studied according to this angle, as in the case of the tropics [75, 76], as well as of the mid-latitudes [77, 78, 79, 80] and polar regions [81] of the Southern Hemisphere. Our method has the potential of revealing new, solid, and previously unknown weather patterns that are relevant in such regions, thus potentially advancing our knowledge of regional climate and facilitating the evaluation of the impacts of climate variability on human and environmental welfare.
Additionally, our approach has a great potential for comparing climate models, for testing their realism, and for investigating the impact of climate change on the large scale variability of the atmosphere. At this regard, we plan to take advantage of the available data of the climate models intercomparison project [82]. The availability of much longer time series, as a result of large ensemble climate model simulation strategy [83] might allow for extending this analysis in such a way that global atmospheric patterns can be directly studied, without the need to resort to longitudinal windows as done here. This might provide a key advancement for understanding the link between synoptic scale variability and global teleconnections and be particularly useful when trying to address the dynamical reasons behind the occurrence of persistent extremes like heatwaves and cold spells [84, 85, 86, 87, 21]
acknowledgments VL acknowledges the support received from the Horizon 2020 Project TiPES (Grant No. No. 820970), from the Marie Curie ITN and CriticalEarth (Grant Agreement No. 956170), and from the University of Reading’s RETF project CROPS.
The authors acknowledge scientific exchanges with D. Faranda, M. Ghil, A. Gritsun, and G. Messori.
References
- \bibcommenthead
- Speranza [1983] Speranza, A.: Deterministic and statistical properties of the westerlies. Paleogeophysics 121, 511–562 (1983)
- Ghil and Robertson [2002] Ghil, M., Robertson, A.W.: “waves” vs. “particles” in the atmosphere’s phase space: A pathway to long-range forecasting? Proceedings of the National Academy of Sciences 99(suppl 1), 2493–2500 (2002) https://doi.org/10.1073/pnas.012580899 https://www.pnas.org/content/99/suppl_1/2493.full.pdf
- Masato et al. [2013] Masato, G., Hoskins, B.J., Woollings, T.: Winter and summer northern hemisphere blocking in cmip5 models. Journal of Climate 26(18), 7044–7059 (2013) https://doi.org/%****␣aa_main.tex␣Line␣450␣****10.1175/JCLI-D-12-00466.1
- Fraedrich and Böttger [1978] Fraedrich, K., Böttger, H.: A wavenumber-frequency analysis of the 500 mb geopotential at 50∘ n. Journal of Atmospheric Sciences 35(4), 745–750 (1978) https://doi.org/10.1175/1520-0469(1978)035<0745:AWFAOT>2.0.CO;2
- Dell’Aquila et al. [2005] Dell’Aquila, A., Lucarini, V., Ruti, P.M., Calmanti, S.: Hayashi spectra of the northern hemisphere mid-latitude atmospheric variability in the ncep–ncar and ecmwf reanalyses. Climate Dynamics 25(6), 639–652 (2005) https://doi.org/10.1007/s00382-005-0048-x
- Benzi et al. [1986] Benzi, R., Malguzzi, P., Speranza, A., Sutera, A.: The statistical properties of general atmospheric circulation: observational evidence and a minimal theory of bimodality. Q. J. R. Meteorol. Soc. 112(473), 661–674 (1986) https://doi.org/10.1256/smsqj.47305
- Mo and Ghil [1987] Mo, K.C., Ghil, M.: Statistics and dynamics of persistent anomalies. J. Atmos. Sci. 44(5), 877–902 (1987) https://doi.org/10.1175/1520-0469(1987)044<0877:sadopa>2.0.co;2
- Ruti et al. [2006] Ruti, P.M., Lucarini, V., Dell’Aquila, A., Calmanti, S., Speranza, A.: Does the subtropical jet catalyze the midlatitude atmospheric regimes? Geophysical Research Letters 33(6) (2006) https://doi.org/10.1029/2005GL024620 https://agupubs.onlinelibrary.wiley.com/doi/pdf/10.1029/2005GL024620
- Woollings et al. [2010] Woollings, T., Hannachi, A., Hoskins, B.: Variability of the north atlantic eddy-driven jet stream. Quarterly Journal of the Royal Meteorological Society 136(649), 856–868 (2010) https://doi.org/10.1002/qj.625 https://rmets.onlinelibrary.wiley.com/doi/pdf/10.1002/qj.625
- Rex [1950] Rex, D.F.: Blocking action in the middle troposphere and its effect upon regional climate. Tellus 2(3), 196–211 (1950) https://doi.org/10.3402/tellusa.v2i3.8546 https://doi.org/10.3402/tellusa.v2i3.8546
- Rossby [1951] Rossby, C.-G.: On the dynamics of certain types of blocking waves. Journal of the Chinese Geophysical Society 2, 1–13 (1951)
- Hoskins [1987] Hoskins, B.J.: Theories of blocking. In: Seminar on the Nature and Prediction of Extra Tropical Weather Systems. 7-11 September 1987, vol. II, pp. 1–10. ECMWF, Shinfield Park, Reading (1987)
- Woollings and Hoskins [2008] Woollings, T., Hoskins, B.: Simultaneous atlantic–pacific blocking and the northern annular mode. Quarterly Journal of the Royal Meteorological Society 134(636), 1635–1646 (2008) https://doi.org/10.1002/qj.310 https://rmets.onlinelibrary.wiley.com/doi/pdf/10.1002/qj.310
- Tibaldi and Molteni [2018] Tibaldi, S., Molteni, F.: Atmospheric Blocking in Observation and Models. Oxford University Press (2018). https://doi.org/10.1093/acrefore/9780190228620.013.611 . https://oxfordre.com/climatescience/view/10.1093/acrefore/9780190228620.001.0001/acrefore-9780190228620-e-611
- Dole et al. [2011] Dole, R., Hoerling, M., Perlwitz, J., Eischeid, J., Pegion, P., Zhang, T., Quan, X.-W., Xu, T., Murray, D.: Was there a basis for anticipating the 2010 russian heat wave? Geophysical Research Letters 38(6) (2011) https://doi.org/10.1029/2010GL046582 https://agupubs.onlinelibrary.wiley.com/doi/pdf/10.1029/2010GL046582
- Xoplaki et al. [2012] Xoplaki, E., Trigo, R.M., Garcí-Herrera, R., Barriopedro, D., D’Andrea, F., Fischer, E.M., Gimeno, L., Gouveia, C., Hernández, E., Kuglitsch, F.G., Mariotti, A., Nieto, R., Pinto, J.G., Pozo-Vázquez, D., Saaroni, H., Toreti, A., Trigo, I.F., Vicente-Serrano, S.M., Yiou, P., Ziv, B.: 6 - large-scale atmospheric circulation driving extreme climate events in the mediterranean and its related impacts. In: Lionello, P. (ed.) The Climate of the Mediterranean Region, pp. 347–417. Elsevier, Oxford (2012). https://doi.org/10.1016/B978-0-12-416042-2.00006-9 . https://www.sciencedirect.com/science/article/pii/B9780124160422000069
- Lau and Kim [2012] Lau, W.K.M., Kim, K.-M.: The 2010 Pakistan Flood and Russian Heat Wave: Teleconnection of Hydrometeorological Extremes. Journal of Hydrometeorology 13(1), 392–403 (2012) https://doi.org/10.1175/JHM-D-11-016.1 https://journals.ametsoc.org/jhm/article-pdf/13/1/392/4110762/jhm-d-11-016_1.pdf
- Buehler et al. [2011] Buehler, T., Raible, C.C., Stocker, T.F.: The relationship of winter season north atlantic blocking frequencies to extreme cold or dry spells in the era-40. Tellus A 63(2), 212–222 (2011) https://doi.org/10.1111/j.1600-0870.2010.00492.x https://onlinelibrary.wiley.com/doi/pdf/10.1111/j.1600-0870.2010.00492.x
- Gálfi et al. [2019] Gálfi, V.M., Lucarini, V., Wouters, J.: A large deviation theory-based analysis of heat waves and cold spells in a simplified model of the general circulation of the atmosphere. Journal of Statistical Mechanics: Theory and Experiment 2019(3), 033404 (2019)
- Kautz et al. [2022] Kautz, L.-A., Martius, O., Pfahl, S., Pinto, J.G., Ramos, A.M., Sousa, P.M., Woollings, T.: Atmospheric blocking and weather extremes over the euro-atlantic sector – a review. Weather and Climate Dynamics 3(1), 305–336 (2022) https://doi.org/10.5194/wcd-3-305-2022
- Lucarini et al. [2023] Lucarini, V., Galfi, V.M., Riboldi, J., Messori, G.: Typicality of the 2021 western north america summer heatwave. Environmental Research Letters 18(1), 015004 (2023) https://doi.org/10.1088/1748-9326/acab77
- Ferranti et al. [2015] Ferranti, L., Corti, S., Janousek, M.: Flow-dependent verification of the ecmwf ensemble over the euro-atlantic sector. Quarterly Journal of the Royal Meteorological Society 141(688), 916–924 (2015) https://doi.org/10.1002/qj.2411 https://rmets.onlinelibrary.wiley.com/doi/pdf/10.1002/qj.2411
- Lucarini et al. [2007] Lucarini, V., Calmanti, S., Dell’Aquila, A., Ruti, P.M., Speranza, A.: Intercomparison of the northern hemisphere winter mid-latitude atmospheric variability of the ipcc models. Climate Dynamics 28(7), 829–848 (2007) https://doi.org/10.1007/s00382-006-0213-x
- Di Biagio et al. [2014] Di Biagio, V., Calmanti, S., Dell’Aquila, A., Ruti, P.M.: Northern hemisphere winter midlatitude atmospheric variability in cmip5 models. Geophysical Research Letters 41(4), 1277–1282 (2014) https://doi.org/10.1002/2013GL058928 https://agupubs.onlinelibrary.wiley.com/doi/pdf/10.1002/2013GL058928
- Davini and D’Andrea [2016] Davini, P., D’Andrea, F.: Northern hemisphere atmospheric blocking representation in global climate models: Twenty years of improvements? Journal of Climate 29(24), 8823–8840 (2016) https://doi.org/10.1175/JCLI-D-16-0242.1
- Woollings et al. [2018] Woollings, T., Barriopedro, D., Methven, J., Son, S.-W., Martius, O., Harvey, B., Sillmann, J., Lupo, A.R., Seneviratne, S.: Blocking and its response to climate change. Current Climate Change Reports 4(3), 287–300 (2018) https://doi.org/10.1007/s40641-018-0108-z
- Nabizadeh et al. [2019] Nabizadeh, E., Hassanzadeh, P., Yang, D., Barnes, E.A.: Size of the atmospheric blocking events: Scaling law and response to climate change. Geophysical Research Letters 46(22), 13488–13499 (2019) https://doi.org/10.1029/2019GL084863 https://agupubs.onlinelibrary.wiley.com/doi/pdf/10.1029/2019GL084863
- Steinfeld et al. [2022] Steinfeld, D., Sprenger, M., Beyerle, U., Pfahl, S.: Response of moist and dry processes in atmospheric blocking to climate change. Environmental Research Letters 17(8), 084020 (2022) https://doi.org/10.1088/1748-9326/ac81af
- Schubert and Lucarini [2016] Schubert, S., Lucarini, V.: Dynamical analysis of blocking events: spatial and temporal fluctuations of covariant lyapunov vectors. Quarterly Journal of the Royal Meteorological Society 142(698), 2143–2158 (2016) https://doi.org/10.1002/qj.2808 https://rmets.onlinelibrary.wiley.com/doi/pdf/10.1002/qj.2808
- Faranda et al. [2017] Faranda, D., Messori, G., Yiou, P.: Dynamical proxies of north atlantic predictability and extremes. Scientific Reports 7(1), 41278 (2017) https://doi.org/10.1038/srep41278
- Lucarini and Gritsun [2020] Lucarini, V., Gritsun, A.: A new mathematical framework for atmospheric blocking events. Climate Dynamics 52 (2020) https://doi.org/10.1007/s00382-019-05018-2
- Tibaldi and Molteni [1990] Tibaldi, S., Molteni, F.: On the operational predictability of blocking. Tellus A 42(3), 343–365 (1990) https://doi.org/10.1034/j.1600-0870.1990.t01-2-00003.x https://onlinelibrary.wiley.com/doi/pdf/10.1034/j.1600-0870.1990.t01-2-00003.x
- Pelly and Hoskins [2003] Pelly, J.L., Hoskins, B.J.: A new perspective on blocking. Journal of the Atmospheric Sciences 60(5), 743–755 (2003) https://doi.org/10.1175/1520-0469(2003)060<0743:ANPOB>2.0.CO;2
- Barriopedro et al. [2006] Barriopedro, D., García-Herrera, R., Lupo, A.R., Hernández, E.: A climatology of northern hemisphere blocking. Journal of Climate 19(6), 1042–1063 (2006) https://doi.org/10.1175/JCLI3678.1
- Davini et al. [2012] Davini, P., Cagnazzo, C., Gualdi, S., Navarra, A.: Bidimensional diagnostics, variability, and trends of northern hemisphere blocking. Journal of Climate 25(19), 6496–6509 (2012) https://doi.org/10.1175/JCLI-D-12-00032.1
- Pinheiro et al. [2019] Pinheiro, M.C., Ullrich, P.A., Grotjahn, R.: Atmospheric blocking and intercomparison of objective detection methods: flow field characteristics. Climate Dynamics 53(7), 4189–4216 (2019) https://doi.org/10.1007/s00382-019-04782-5
- Wallace and Gutzler [1981] Wallace, J.M., Gutzler, D.S.: Teleconnections in the geopotential height field during the northern hemisphere winter. Monthly Weather Review 109(4), 784–812 (1981) https://doi.org/10.1175/1520-0493(1981)109<0784:TITGHF>2.0.CO;2
- Hurrell [1995] Hurrell, J.W.: Decadal trends in the north atlantic oscillation: Regional temperatures and precipitation. Science 269(5224), 676–679 (1995). Accessed 2023-07-24
- Thompson and Wallace [1998] Thompson, D.W.J., Wallace, J.M.: The arctic oscillation signature in the wintertime geopotential height and temperature fields. Geophysical Research Letters 25(9), 1297–1300 (1998) https://doi.org/10.1029/98GL00950 https://agupubs.onlinelibrary.wiley.com/doi/pdf/10.1029/98GL00950
- Branstator [2002] Branstator, G.: Circumglobal teleconnections, the jet stream waveguide, and the north atlantic oscillation. Journal of Climate 15, 1893–1910 (2002) https://doi.org/10.1175/1520-0442(2002)015<1893:CTTJSW>2.0.CO;2
- Harnik et al. [2016] Harnik, N., Messori, G., Caballero, R., Feldstein, S.B.: The circumglobal north american wave pattern and its relation to cold events in eastern north america. Geophysical Research Letters 43, 11015–11023 (2016) https://doi.org/10.1002/2016GL070760
- Croci-Maspoli et al. [2007] Croci-Maspoli, M., Schwierz, C., Davies, H.C.: Atmospheric blocking: space-time links to the nao and pna. Climate Dynamics 29(7), 713–725 (2007) https://doi.org/10.1007/s00382-007-0259-4
- Athanasiadis et al. [2010] Athanasiadis, P.J., Wallace, J.M., Wettstein, J.J.: Patterns of wintertime jet stream variability and their relation to the storm tracks. Journal of the Atmospheric Sciences 67(5), 1361–1381 (2010) https://doi.org/10.1175/2009JAS3270.1
- Feldstein and Franzke [2017] Feldstein, S.B., Franzke, C.L.E.: In: Franzke, C.L.E., O’Kane, T.J.E. (eds.) Atmospheric Teleconnection Patterns, pp. 54–104. Cambridge University Press, ??? (2017). https://doi.org/10.1017/9781316339251.004
- Hannachi et al. [2017] Hannachi, A., Straus, D.M., Franzke, C.L.E., Corti, S., Woollings, T.: Low-frequency nonlinearity and regime behavior in the northern hemisphere extratropical atmosphere. Reviews of Geophysics 55(1), 199–234 (2017) https://doi.org/10.1002/2015RG000509 https://agupubs.onlinelibrary.wiley.com/doi/pdf/10.1002/2015RG000509
- Baur et al. [1944] Baur, F., Hess, P., Nagel, H.: Kalender der großwetterlagen europas 1881–1939. Technical report, DWD: Bad Homburg (1944)
- Vautard [1990] Vautard, R.: Multiple weather regimes over the north atlantic: Analysis of precursors and successors. Monthly Weather Review 118(10), 2056–2081 (1990) https://doi.org/10.1175/1520-0493(1990)118<2056:MWROTN>2.0.CO;2
- Madonna et al. [2017] Madonna, E., Li, C., Grams, C.M., Woollings, T.: The link between eddy-driven jet variability and weather regimes in the north atlantic-european sector. Quarterly Journal of the Royal Meteorological Society 143, 2960–2972 (2017) https://doi.org/10.1002/qj.3155
- Franzke [2013] Franzke, C.L.E.: Persistent regimes and extreme events of the north atlantic atmospheric circulation. Philosophical Transactions of the Royal Society A: Mathematical, Physical and Engineering Sciences 371 (2013) https://doi.org/10.1098/rsta.2011.0471
- De Luca et al. [2019] De Luca, P., Harpham, C., Wilby, R.L., Hillier, J.K., Franzke, C.L.E., Leckebusch, G.C.: Past and projected weather pattern persistence with associated multi-hazards in the british isles. Atmosphere 10(10) (2019) https://doi.org/10.3390/atmos10100577
- Madonna et al. [2021] Madonna, E., Battisti, D.S., Li, C., White, R.H.: Reconstructing winter climate anomalies in the euro-atlantic sector using circulation patterns. Weather and Climate Dynamics 2, 777–794 (2021) https://doi.org/10.5194/wcd-2-777-2021
- Galfi and Messori [2023] Galfi, V.M., Messori, G.: Persistent anomalies of the north atlantic jet stream and associated surface extremes over europe. Environmental Research Letters 18 (2023) https://doi.org/10.1088/1748-9326/acaedf
- Fabiano et al. [2020] Fabiano, F., Christensen, H.M., Strommen, K., Athanasiadis, P., Baker, A., Schiemann, R., Corti, S.: Euro-atlantic weather regimes in the primavera coupled climate simulations: impact of resolution and mean state biases on model performance. Climate Dynamics 54(11), 5031–5048 (2020) https://doi.org/10.1007/s00382-020-05271-w
- Franzke et al. [2008] Franzke, C., Crommelin, D., Fischer, A., Majda, A.J.: A hidden markov model perspective on regimes and metastability in atmospheric flows. Journal of Climate 21(8), 1740–1757 (2008) https://doi.org/10.1175/2007JCLI1751.1
- Kwasniok [2014] Kwasniok, F.: Enhanced regime predictability in atmospheric low-order models due to stochastic forcing. Philosophical Transactions of the Royal Society A: Mathematical, Physical and Engineering Sciences 372(2018), 20130286 (2014) https://doi.org/10.1098/rsta.2013.0286 https://royalsocietypublishing.org/doi/pdf/10.1098/rsta.2013.0286
- Tantet et al. [2015] Tantet, A., Burgt, F.R., Dijkstra, H.A.: An early warning indicator for atmospheric blocking events using transfer operators. Chaos: An Interdisciplinary Journal of Nonlinear Science 25(3), 036406 (2015) https://doi.org/10.1063/1.4908174 https://pubs.aip.org/aip/cha/article-pdf/doi/10.1063/1.4908174/14610546/036406_1_online.pdf
- Detring et al. [2021] Detring, C., Müller, A., Schielicke, L., Névir, P., Rust, H.W.: Occurrence and transition probabilities of omega and high-over-low blocking in the euro-atlantic region. Weather and Climate Dynamics 2(4), 927–952 (2021) https://doi.org/10.5194/wcd-2-927-2021
- Mukhin et al. [2022] Mukhin, D., Hannachi, A., Braun, T., Marwan, N.: Revealing recurrent regimes of mid-latitude atmospheric variability using novel machine learning method. Chaos: An Interdisciplinary Journal of Nonlinear Science 32(11), 113105 (2022) https://doi.org/10.1063/5.0109889 https://pubs.aip.org/aip/cha/article-pdf/doi/10.1063/5.0109889/16497678/113105_1_online.pdf
- Prinz et al. [2011] Prinz, J.-H., Wu, H., Sarich, M., Keller, B., Senne, M., Held, M., Chodera, J.D., Schütte, C., Noé, F.: Markov models of molecular kinetics: Generation and validation. The Journal of Chemical Physics 134(17), 174105 (2011) https://doi.org/10.1063/1.3565032 https://pubs.aip.org/aip/jcp/article-pdf/doi/10.1063/1.3565032/15437339/174105_1_online.pdf
- Husic and Pande [2018] Husic, B.E., Pande, V.S.: Markov state models: From an art to a science. Journal of the American Chemical Society 140(7), 2386–2396 (2018) https://doi.org/10.1021/jacs.7b12191 https://doi.org/10.1021/jacs.7b12191. PMID: 29323881
- NOAA Physical Sciences Laboratory [2023] NOAA Physical Sciences Laboratory: NCEP-NCAR Reanalysis 1 (2023). https://psl.noaa.gov/data/gridded/data.ncep.reanalysis.html Accessed 2023-04-17
- Lloyd [1982] Lloyd, S.: Least squares quantization in pcm. IEEE Transactions on Information Theory 28(2), 129–137 (1982) https://doi.org/10.1109/TIT.1982.1056489
- Giorgetta et al. [2013] Giorgetta, M.A., Jungclaus, J., Reick, C.H., Legutke, S., Bader, J., Böttinger, M., Brovkin, V., Crueger, T., Esch, M., Fieg, K., Glushak, K., Gayler, V., Haak, H., Hollweg, H.-D., Ilyina, T., Kinne, S., Kornblueh, L., Matei, D., Mauritsen, T., Mikolajewicz, U., Mueller, W., Notz, D., Pithan, F., Raddatz, T., Rast, S., Redler, R., Roeckner, E., Schmidt, H., Schnur, R., Segschneider, J., Six, K.D., Stockhause, M., Timmreck, C., Wegner, J., Widmann, H., Wieners, K.-H., Claussen, M., Marotzke, J., Stevens, B.: Climate and carbon cycle changes from 1850 to 2100 in mpi-esm simulations for the coupled model intercomparison project phase 5. Journal of Advances in Modeling Earth Systems 5(3), 572–597 (2013) https://doi.org/%****␣aa_main.tex␣Line␣1475␣****10.1002/jame.20038 https://agupubs.onlinelibrary.wiley.com/doi/pdf/10.1002/jame.20038
- Andrilli and Hecker [2016] Andrilli, S., Hecker, D.: Chapter 8 - additional applications. In: Andrilli, S., Hecker, D. (eds.) Elementary Linear Algebra (Fifth Edition), Fifth edition edn., pp. 513–605. Academic Press, Boston (2016). https://doi.org/10.1016/B978-0-12-800853-9.00008-6 . https://www.sciencedirect.com/science/article/pii/B9780128008539000086
- Hoskins and Hodges [2019] Hoskins, B.J., Hodges, K.I.: The annual cycle of northern hemisphere storm tracks. part i: Seasons. Journal of Climate 32(6), 1743–1760 (2019) https://doi.org/10.1175/JCLI-D-17-0870.1
- Gao et al. [2022] Gao, M., Yang, S., Li, T.: Assessments on simulation of pacific blocking frequency during boreal winter in cmip6 climate models. Dynamics of Atmospheres and Oceans 100, 101333 (2022) https://doi.org/10.1016/j.dynatmoce.2022.101333
- Gao et al. [2020] Gao, M., Yang, S., Li, T.: The spatio-temporal variation of pacific blocking frequency within winter months and its relationship with surface air temperature. Atmosphere 11(9) (2020) https://doi.org/10.3390/atmos11090960
- Rex [1951] Rex, D.F.: The effect of atlantic blocking action upon european climate. Tellus 3(2), 100–112 (1951) https://doi.org/10.3402/tellusa.v3i2.8617 https://doi.org/10.3402/tellusa.v3i2.8617
- Breeden et al. [2020] Breeden, M.L., Hoover, B.T., Newman, M., Vimont, D.J.: Optimal north pacific blocking precursors and their deterministic subseasonal evolution during boreal winter. Monthly Weather Review 148(2), 739–761 (2020) https://doi.org/10.1175/MWR-D-19-0273.1
- Nabizadeh et al. [2021] Nabizadeh, E., Lubis, S.W., Hassanzadeh, P.: The 3d structure of northern hemisphere blocking events: Climatology, role of moisture, and response to climate change. Journal of Climate 34(24), 9837–9860 (2021) https://doi.org/10.1175/JCLI-D-21-0141.1
- Carrera et al. [2004] Carrera, M.L., Higgins, R.W., Kousky, V.E.: Downstream weather impacts associated with atmospheric blocking over the northeast pacific. Journal of Climate 17(24), 4823–4839 (2004) https://doi.org/10.1175/JCLI-3237.1
- Feldstein [2000] Feldstein, S.B.: The timescale, power spectra, and climate noise properties of teleconnection patterns. Journal of Climate 13(24), 4430–4440 (2000) https://doi.org/10.1175/1520-0442(2000)013<4430:TTPSAC>2.0.CO;2
- Önskog et al. [2018] Önskog, T., Franzke, C.L.E., Hannachi, A.: Predictability and non-gaussian characteristics of the north atlantic oscillation. Journal of Climate 31(2), 537–554 (2018) https://doi.org/10.1175/JCLI-D-17-0101.1
- Woollings et al. [2008] Woollings, T.J., Hoskins, B., Blackburn, M., Berrisford, P.: A new rossby wave-breaking interpretation of the north atlantic oscillation. Journal of the Atmospheric Sciences 65, 609–626 (2008) https://doi.org/10.1175/2007JAS2347.1
- Pope et al. [2009] Pope, M., Jakob, C., Reeder, M.J.: Regimes of the north australian wet season. Journal of Climate 22(24), 6699–6715 (2009) https://doi.org/10.1175/2009JCLI3057.1
- Hassim and Timbal [2019] Hassim, M.E.E., Timbal, B.: Observed rainfall trends over singapore and the maritime continent from the perspective of regional-scale weather regimes. Journal of Applied Meteorology and Climatology 58(2), 365–384 (2019) https://doi.org/10.1175/JAMC-D-18-0136.1
- Solman and Menéndez [2003] Solman, S.A., Menéndez, C.G.: Weather regimes in the south american sector and neighbouring oceans during winter. Climate Dynamics 21(1), 91–104 (2003) https://doi.org/10.1007/s00382-003-0320-x
- Wilson et al. [2013] Wilson, L., Manton, M.J., Siems, S.T.: Relationship between rainfall and weather regimes in south-eastern queensland, australia. International Journal of Climatology 33(4), 979–991 (2013) https://doi.org/10.1002/joc.3484 https://rmets.onlinelibrary.wiley.com/doi/pdf/10.1002/joc.3484
- Arizmendi et al. [2022] Arizmendi, F., Trinchin, R., Barreiro, M.: Weather regimes in subtropical south america and their impacts over uruguay. International Journal of Climatology 42(16), 9253–9270 (2022) https://doi.org/10.1002/joc.7816 https://rmets.onlinelibrary.wiley.com/doi/pdf/10.1002/joc.7816
- Loikith et al. [2019] Loikith, P.C., Pampuch, L.A., Slinskey, E., Detzer, J., Mechoso, C.R., Barkhordarian, A.: A climatology of daily synoptic circulation patterns and associated surface meteorology over southern south america. Climate Dynamics 53(7), 4019–4035 (2019) https://doi.org/10.1007/s00382-019-04768-3
- Pohl et al. [2021] Pohl, B., Favier, V., Wille, J., Udy, D.G., Vance, T.R., Pergaud, J., Dutrievoz, N., Blanchet, J., Kittel, C., Amory, C., Krinner, G., Codron, F.: Relationship between weather regimes and atmospheric rivers in east antarctica. Journal of Geophysical Research: Atmospheres 126(24), 2021–035294 (2021) https://doi.org/10.1029/2021JD035294 https://agupubs.onlinelibrary.wiley.com/doi/pdf/10.1029/2021JD035294. e2021JD035294 2021JD035294
- Eyring et al. [2016] Eyring, V., Bony, S., Meehl, G.A., Senior, C.A., Stevens, B., Stouffer, R.J., Taylor, K.E.: Overview of the Coupled Model Intercomparison Project Phase 6 (CMIP6) experimental design and organization. Geoscientific Model Development 9, 10539–10583 (2016)
- Maher et al. [2021] Maher, N., Milinski, S., Ludwig, R.: Large ensemble climate model simulations: introduction, overview, and future prospects for utilising multiple types of large ensemble. Earth System Dynamics 12(2), 401–418 (2021) https://doi.org/10.5194/esd-12-401-2021
- Kornhuber et al. [2019] Kornhuber, K., Osprey, S., Coumou, D., Petri, S., Petoukhov, V., Rahmstorf, S., Gray, L.: Extreme weather events in early summer 2018 connected by a recurrent hemispheric wave-7 pattern. Environmental Research Letters 14(5), 054002 (2019) https://doi.org/10.1088/1748-9326/ab13bf
- Kornhuber and Tamarin-Brodsky [2021] Kornhuber, K., Tamarin-Brodsky, T.: Future changes in northern hemisphere summer weather persistence linked to projected arctic warming. Geophysical Research Letters 48(4), 2020–091603 (2021) https://doi.org/10.1029/2020GL091603 https://agupubs.onlinelibrary.wiley.com/doi/pdf/10.1029/2020GL091603
- Galfi and Lucarini [2021] Galfi, V.M., Lucarini, V.: Fingerprinting heatwaves and cold spells and assessing their response to climate change using large deviation theory. Phys. Rev. Lett. 127, 058701 (2021) https://doi.org/10.1103/PhysRevLett.127.058701
- Ragone and Bouchet [2021] Ragone, F., Bouchet, F.: Rare event algorithm study of extreme warm summers and heatwaves over europe. Geophysical Research Letters 48(12), 2020–091197 (2021) https://doi.org/10.1029/2020GL091197 https://agupubs.onlinelibrary.wiley.com/doi/pdf/10.1029/2020GL091197. e2020GL091197 2020GL091197