Unveiling the X-ray polarimetric properties of LMC X3 with IXPE, NICER, and Swift/XRT
Abstract
The incoming Imaging X-ray Polarimetry Explorer (IXPE) observations of X-ray binaries provide a new tool to investigate the underlying accretion geometry. Here we report the first measurements of X-ray polarization of the extra-galactic black-hole X-ray binary LMC X3. We find a polarization fraction of at a polarization angle of in the keV energy band with statistical significance at the 7 level. This polarization measurement significantly exceeds the minimum detectable polarization threshold of 1.2% for the source, ascertained at a 99% confidence level within the keV energy band. The simultaneous spectro-polarimetric fitting of NICER, Swift/XRT, and IXPE revealed the presence of a disc with a temperature of 1 keV and a Comptonized component with a power-law index of 2.4, confirming the soft nature of the source. The polarization degree increases with energy from 3% in the keV band to 8% in the keV band, while the polarization angle is energy independent. The observed energy dependence and the sudden jump of polarization fraction at 5 keV supports the idea of a static slab coronal geometry for the comptonizing medium of LMC X3. We further observed no change in the polarization properties with time over the period of the IXPE observations.
keywords:
accretion: accretion discs; polarization; X-rays: binaries; X-rays: individual: LMC X3; Astrophysics - High Energy Astrophysical Phenomena1 Introduction
Black hole X-ray binaries (BXB) are an exquisite class of astronomical systems in which a black hole accretes matter from a companion star and forms a planar structure known as an accretion disc. Such an accretion disc is a powerful source of electromagnetic radiation, emitting profusely in X-ray, optical and radio wavelengths. During its outburst, the BXB transitions from a low-hard state (LHS, low flux of high energy photons) to a high soft state (HSS, high flux of low energy photons) via hard/soft intermediates states and sometimes, steep-power law (SPL) state (see Remillard & McClintock, 2006; Motta et al., 2012). These states are characterised by varying proportions of count rate and flux hardness (Belloni et al., 2005, 2011, and references within). In the HSS, the spectrum is primarily characterized by an optically thick thermal component, often modelled as a multi-temperature blackbody of temperature 1 keV (Shakura & Sunyaev, 1973). Occasionally, a power law component with a power law index 2 is also observed alongside the thermal component (Méndez & van der Klis, 1997; Done et al., 2007). In contrast, during the LHS, the X-ray spectrum exhibits a distinct feature attributed to Comptonization from an electron plasma with temperatures between keV (Gilfanov, 2010).
Over more than five decades, the X-ray spectro-timing analysis has proven to be an important tool to map the accretion region indirectly. Besides establishing the presence of a cold accretion disc for the soft component, different models such as the slab-corona model, patchy corona model, magnetized accretion ejection model, and more exist to justify the hard component in the spectra (Haardt & Maraschi, 1993; Done et al., 2007, and references within). However, it is important to note that the inherent ambiguity regarding the nature of the Comptonizing medium cannot be fully resolved through X-ray spectro-timing analysis alone. Therefore, a comprehensive polarimetric study is necessary to untangle the geometry of the accretion and Comptonizing medium within these systems.
The recent IXPE (Imaging X-ray Polarimetry Explorer) observations of the BXB 4U 163047 have provided intriguing results. A polarization fraction of in the HSS (Rawat et al., 2023b; Kushwaha et al., 2023; Ratheesh et al., 2023) and in the SPL state (Rawat et al., 2023a; Rodriguez Cavero et al., 2023) was observed. This observed high polarization fraction in the HSS has captured the attention of X-ray astrophysicists, as it defies explanations within the framework of contemporary models (Schnittman & Krolik, 2010; Taverna et al., 2020; Krawczynski & Beheshtipour, 2022). Similarly, using IXPE, Krawczynski et al. (2022) has reported a polarization fraction of in the hard state of Cygnus X1, which is unusual for a low inclination source assuming polarization is due to electron scattering.
Motivated by the recently reported high polarization fraction for BXB in the high soft state, we explore the polarimetric properties of LMC X3 in this paper. LMC X3 is a black hole X-ray binary source discovered in the Large Magellanic Cloud with Uhuru (Leong et al., 1971). The binary system has an inclination angle of (Orosz
et al., 2014), and it is known for its unusually soft X-ray spectrum (White &
Marshall, 1984). Fender &
Hendry (2000) conducted a radio survey on persistent BXB sources and reported no radio counterpart of LMC X3, which could be attributed to either the distant location of the source (48, kpc Orosz
et al. 2014) or its unusually soft spectrum. Steiner et al. (2014) reported that the dimensionless spin parameter of the black hole in this source is .
For highly inclined sources, if the polarization is due to electron scattering, then a high polarization fraction is expected with the polarization angle aligned parallel to the disk plane (Chandrasekhar & Breen, 1947; Chandrasekhar, 1960; Sobolev, 1963). The high inclination angle and the fact that LMC X3 spends most of its time in the soft state make it an excellent candidate for a polarimetric study. The subsequent sections of this paper are organized as follows: Section 2 covers the observations and data reduction methods, Section 3 presents polarimetric and spectro-polarimetric findings, and in Section 4 we conclude with interpretations and implications of our results for LMC X-3.
2 Observation and Data Reduction
In this work we have used NICER, Swift/XRT and IXPE observations of the source LMC X3 taken during July 2023. The observation details with each instrument are given in Table 1, and the data reduction techniques are briefly discussed in the next subsections.
2.1 NICER
We have analyzed observations of LMC X3 with the Neutron Star Interior Composition Explorer (NICER Gendreau et al., 2012) on 2023-07-03. NICER’s XTI (X-ray Timing Instrument Gendreau et al., 2016) covers the keV band and has an effective area of 2000 cm2 at 1.5 keV. The energy and time resolutions are 85 eV at 1 keV and 4 s, respectively. We have applied the standard calibration process and screening using the nicerl2111https://heasarc.gsfc.nasa.gov/docs/nicer/analysis_threads/nicerl2/ task. Further, the grouped spectrum is extracted using nicerl3222https://heasarc.gsfc.nasa.gov/docs/nicer/analysis_threads/nicerl3-spect/, which also applies systematic errors and quality flags to the spectrum. In addition, nicerl3 also creates ancillary (ARF), response (RMF), and background files (for the 3C50 model) using CALDB version 20221001333https://heasarc.gsfc.nasa.gov/docs/heasarc/caldb/nicer/.
2.2 Swift/XRT
Swift/XRT has observed the LMC X3 in the window mode for three epochs between 2023-07-09 and 2023-07-20. Swift/XRT (Burrows et al., 2005) is an X-ray Imaging Telescope that operates in a narrow energy band of 0.2–10 keV with an effective area of 125 cm2 at 1.5 keV. We have used xrtpipeline to extract the clean event files which are then used to extract the lightcurve using the xselect (V2.5b) package of heasoft version 6.32.1444https://heasarc.gsfc.nasa.gov/lheasoft/download.html. We have used Build Swift-XRT products555https://www.swift.ac.uk/user_objects/ to generate the spectra, ancillary response (arf) and response (rmf; see Evans et al. 2009) files. We have considered grade events for the source spectra as the WT mode data should not be affected by pile-up for source count below 100 c/s (Romano et al., 2006).
| Instrument | ObsID | Tstart | Tstop | exposure |
|---|---|---|---|---|
| (M.J.D) | (M.J.D) | (secs) | ||
| NICER | 6101010115 | 60128.67 | 60128.81 | 630 |
| Swift/XRT | 00089714001 | 60134.81 | 60134.83 | 1244 |
| 00089714002 | 60139.12 | 60139.70 | 1772 | |
| 00089714003 | 60145.06 | 60145.20 | 1928 | |
| IXPE | 02006599 | 60132.78 | 60145.60 | 561925 |

2.3 IXPE
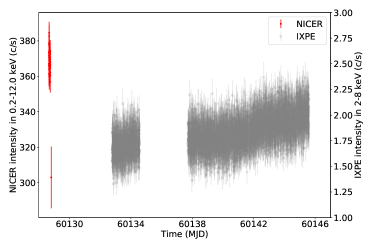
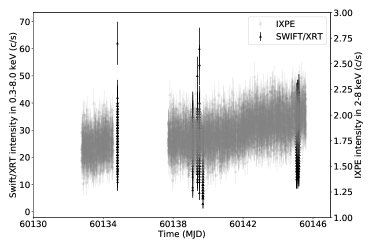
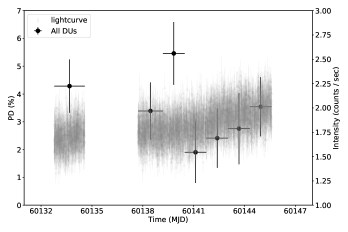
IXPE is a recently launched X-ray polarimetry observatory developed by NASA in collaboration with the Italian Space Agency (ASI). It can measure the polarization properties of multiple X-ray sources in the energy band of keV. Besides polarization, IXPE also captures the spatial, temporal and spectral aspects of X-ray photons (Manfreda, 2020; Baldini et al., 2021; Di Marco et al., 2022; Weisskopf et al., 2022). IXPE has observed the source LMC X3 from 2023-07-07 to 2023-07-20 for a total exposure of 562 ksec. Figure-1 shows the NICER (top panel) and Swift/XRT (bottom panel) lightcurves in the keV and keV bands, respectively along with the simultaneous keV IXPE lightcurve. We note here that the NICER observation is not simultaneous with IXPE but we still consider it for spectro-polarimetric analysis owing to minimal changes in source flux and spectral shape during the observation period.
We used the IXPE level-2 event files for all the detector units (DU) obtained directly from the HEASARC archive. We begin by extracting and plotting the image of event files using xselect and ds9, respectively, to choose the appropriate source and background regions. Further, we employ these regions (a circle of radius 1.5 arcmin for source and an annulus of inner and outer radii of 2.5 arcmins and 4 arcmins, respectively, for the background) in the xpselect tool of ixpeobssim 30.2.2666https://ixpeobssim.readthedocs.io/en/latest/overview.html (Baldini et al., 2022) to produce the cleaned source and background event files for all DUs. Then we bin the event files using different algorithms of xpbin (Kislat et al., 2015) to extract the polarization properties of the source. The emission model-independent polarization angle (PA) and polarization degree (PD) are estimated using the pcube method whereas xspec readable count I and Stokes Q and U spectra are created utilizing the algorithms pha1, phaq and phau, respectively, for all units in the keV energy range. We have used the unweighted method and response matrices v012 of ixpeobssim to produce all the polarization products.
We have rebinned I, Q, and U using ftgrouppha where the I spectrum is grouped using an optimal binning algorithm employing the response file. Subsequently, Stokes spectra are grouped using the I spectrum as a template file. We simultaneously fit the count spectra from NICER (in the keV) and Swift/XRT (in the keV) and Stokes spectra (Q, U) from IXPE (in the keV) using the X-ray spectral fitting package xspec version 12.13.1.
| DU1 | DU2 | DU3 | All DUs | |
|---|---|---|---|---|
| PD (%) | ||||
| PA (deg) |
3 Results
We carry out the standard model-independent (pcube) and spectro-polarimetric (xspec) approach to study the polarization properties of LMC X-3. In the pcube method, the Stokes parameters (I, Q, and U) are calculated by summing over the observed photoelectric emission angle for each IXPE event from which one can recover the polarization angle (PA) and polarization degree (PD) using usual formulae. In the xspec method, polarization models like polconst, polpow or pollin are used along with basic radiative models to fit the count and Stokes spectra to determine the values of PA and PD.
3.1 Polarization properties using PCUBE
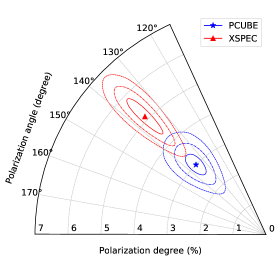
In the full IXPE energy range of keV, we estimate a polarization degree of at a polarization angle of for the source. We have combined the measurements of all the detectors to improve the confidence interval over PA and PD of the observation. The polarization is well above the minimum detectable polarization of 1.2% for the source at a 99% confidence interval. Figure 2 shows the 1, 2, and 3 confidence contour plots for PA and PD in the keV band. The values of the polarization parameters are listed in Table 2. Unless stated, the reported error on each parameter is at the 1 confidence level.
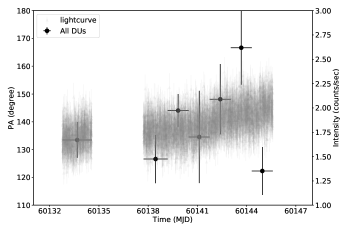
Further, we extract the polarization properties in six energy bands using the pcube algorithm and summed the values for each detector for accuracy. It is apparent from Figure 3 that the PD is energy-dependent. Upto 5 keV the PD remains constant around but increases significantly to 10 % in the keV band. The PA, on the other hand, is and energy-independent. We also check the time evolution of PA and PD by dividing the data into seven almost equal time bins and running the algorithm for each. We find that the properties do not show any significant variations and are consistent with being constant with time, as shown in Figure 4.
3.2 Spectro-polarimetric fitting using XSPEC
We start by exploring the radiative properties of LMC X-3 by modelling only the NICER ( keV) and Swift/XTI ( keV) spectra simultaneously. We first fit the spectra with the model combination constant*tbfeo*(diskbb+powerlaw) with abundances from Wilms et al. (2000) and cross-sections from Verner et al. (1996). The multiplicative factor constant accounts for the cross-calibration factor between NICER and Swift/XTI spectra. The tbfeo model describes the interstellar absorption and is similar to tbabs but allows to vary the oxygen and iron abundances of the interstellar absorber. The diskbb and powerlaw components describe the thermal disc and non-thermal Compton emissions from the source. The fitting gives a of 312 for 276 d.o.f. For NICER, we use the systematics as obtained from nicerl3-spect, whereas, for Swift/XRT, we have taken a systematic error of 3%. Letting the O abundance free, it could be constrained well to a value of 0.55 times the solar abundance. To check if a physical model like nthcomp can be used to characterize the high energy emission, we fit the data with another model combination, constant*tbfeo*(diskbb+nthcomp). This yields a of 403 for 277 d.o.f, poorer than the previous case, and thereby we refrain from using this model for further spectro-polarimetric fitting.
Next, we fit the I spectra from NICER and Swift/XRT and the Q, and U spectra from IXPE simultaneously. We first try the model combination of constant*polconst*tbfeo*(diskbb+powerlaw) where polconst is a multiplicative constant, energy-independent polarization model. This gives a of 479 for 362 d.o.f. We have not taken any systematic error for IXPE spectra, and all the parameters were free during the fitting. The PA and PD values are inconsistent with the pcube results. This is expected, as we saw in the last section that the polarization degree is energy dependent.
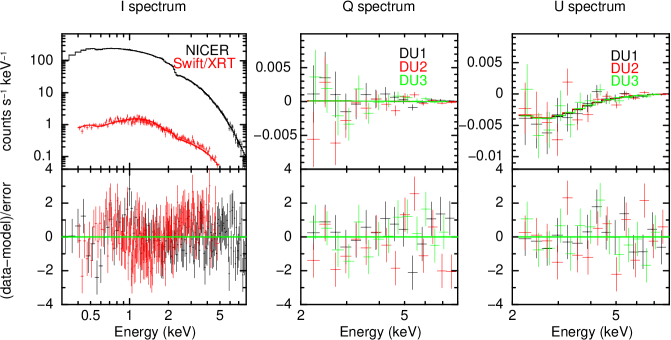
Afterwards, we try the model constant*polpow*tbfeo*(diskbb+powerlaw) where polpow is a multiplicative, power-law energy-dependent polarization model. During fitting we have frozen to zero because of the energy independence of the polarization angle. The for the best-fit comes out to be 412 for 361 d.o.f, better than the previous model. All the best-fit parameters are given in Table 3, and the simultaneously fitted I, Q, and U spectra for all detectors along with residuals are shown in Figure 5. The estimated value of PA is deg, and of PD777We estimate the PD by integrating the polpow model in the keV band. is 8883 error bar, which are consistent with pcube results within the error bars as shown in Figure 2.
| Component | Parameter | Value |
|---|---|---|
| polpow | () | |
| polpow | ||
| polpow | (degrees) | |
| TBfeo | ( cm-2) | |
| TBfeo | ||
| powerlaw | ||
| powerlaw | () | |
| powerlaw | Flux† ( erg cm-2 s-1) | |
| diskbb | (keV) | |
| diskbb | norm | |
| Total Flux† | ( erg cm-2 s-1) | |
| /dof | 412 / 361 | |
| † Total unabsorbed flux in the keV range. | ||
4 Discussion and Summary
We report the first measurement of X-ray polarization in the soft state of the extragalactic Black hole X-ray binary (BXB) source LMC X3 using IXPE in the keV energy band. The polarization degree (PD) is 3 % at a polarization angle (PA) of 135 ∘. The lightcurves from IXPE, NICER and Swift/XRT show no significant variation of the count rate of LMC X3 across the keV, keV and keV bands, respectively (see Figure 1). Simultaneous NICER and Swift/XRT spectra of LMC X3 exhibit multi-temperature black body emission peaking at around 1 keV. The spectra also display a significant contribution from a thermal comptonization component with a power law index of approximately 2.4. The PD increases from 2 % at 2 keV to 10 % at 8 keV while the PA shows no dependence on energy (see Figure 3). The energy dependence of the PD is similar to what has been reported for the BXB sources 4U 163047 (Rawat et al., 2023b, a; Kushwaha et al., 2023; Ratheesh et al., 2023; Rodriguez Cavero et al., 2023) and Cygnus X1 (Krawczynski et al., 2022). We found no significant variation in the PA and PD over time, as depicted in Figure 4.
Employing radiative transfer simulations, Poutanen et al. (2023) computed the dependence of the PD with the inclination angle of the source for both a slab coronal model and a hot inner flow model, accounting for relativistic plasma effects. In the static slab corona model, where the corona covers the cold accretion disk and seed photons originate from it, they found that the PD reaches approximately 4% for high-inclination sources (i.e., ) at 4 keV (see top panel of Figure 1 in Poutanen et al. 2023). Our observed polarization fraction for LMC X3, at around 4% (within a 3-sigma range, as shown in Figure 2) is consistent with this result. Furthermore, we have detected a significant increase in the PD above 5 keV, as illustrated in Figure 3. As highlighted by Poutanen &
Svensson (1996), the reversal of the PD sign is a distinctive characteristic associated with the slab corona geometry. Using the radiative transfer code of Poutanen et al. (2023) and considering a slab coronal geometry, Podgorny
et al. (2023) found that the PD changes sign from positive to negative at 5 keV (see Figure 10 of Podgorny
et al. 2023) for another extra-galactic source LMC X1. Our findings support the static slab coronal geometry in the case of LMC X3.
In the context of BXBs, assuming a static hot inner flow geometry, the anticipated polarization level is approximately 7-8% at 4 keV, as demonstrated in the middle and bottom panels of Figure 1 in Poutanen et al. (2023). Furthermore, the polarization fraction can be enhanced when accounting for relativistic plasma. Poutanen et al. (2023) has shown that for Cygnus X1, the polarimetric results cannot be explained through static coronal models, and thus an out-flowing plasma with a mildly relativistic velocity is required. Dexter & Begelman (2023) has also proposed bulk Comptonization of coronal emission in a mildly relativistic wind or jet for Cygnus X1 to explain the observed polarization fraction. Unlike Cygnus X1, the static slab corona geometry provides a successful explanation for the polarimetry findings in the case of LMC X3. It is worth noting that the possibility of an enhancement of the PD due to disk winds, as reported by Kosenkov et al. (2020) for the black-hole binary MAXI J1820+070, or PD suppression due to disk winds, as suggested by Tomaru et al. (2023) for 4U 163047, cannot be ruled out. However, in the spectra of LMC X3, we have not detected any signature of disk winds.
If disk self-irradiation produces polarization, the PA should align with the jet axis, i.e. perpendicular to the disk plane in BXBs (Schnittman & Krolik, 2009). Studies on Cygnus X1 conducted by Chauvin et al. (2018) and Krawczynski et al. (2022) utilizing PoGO+ and IXPE observations, respectively, have confirmed the alignment of the polarization angle with the radio jet. Similarly, optical polarimetry conducted by Kosenkov et al. (2020) has indicated that the polarization angle aligns with the jet axis for MAXI J1820+070 in the rising hard state. Unfortunately, for LMC X3, the jet angle is unknown as no radio counterpart has been reported (Fender & Hendry, 2000), so we cannot make any comparison.
Acknowledgements
This work used data from the UK Swift Science Data Centre at the University of Leicester. This research has used data from the High Energy Astrophysics Science Archive Research Center Online Service, provided by the NASA/Goddard Space Flight Center. MM acknowledges support from the research program Athena with project number 184.034.002, which is (partly) financed by the Dutch Research Council (NWO).
Data Availability
The NICER/XTI, Swift/XRT, and IXPE observations used in this work are available at the HEASARC website.
References
- Baldini et al. (2021) Baldini L., et al., 2021, Astroparticle Physics, 133, 102628
- Baldini et al. (2022) Baldini L., et al., 2022, SoftwareX, 19, 101194
- Belloni et al. (2005) Belloni T., Homan J., Casella P., van der Klis M., Nespoli E., Lewin W. H. G., Miller J. M., Méndez M., 2005, A&A, 440, 207
- Belloni et al. (2011) Belloni T. M., Motta S. E., Muñoz-Darias T., 2011, Bulletin of the Astronomical Society of India, 39, 409
- Burrows et al. (2005) Burrows D. N., et al., 2005, Space Sci. Rev., 120, 165
- Chandrasekhar (1960) Chandrasekhar S., 1960, Radiative transfer. Dover Publications, New York
- Chandrasekhar & Breen (1947) Chandrasekhar S., Breen F. H., 1947, ApJ, 105, 435
- Chauvin et al. (2018) Chauvin M., et al., 2018, Nature Astronomy, 2, 652
- Dexter & Begelman (2023) Dexter J., Begelman M. C., 2023, arXiv e-prints, p. arXiv:2308.01963
- Di Marco et al. (2022) Di Marco A., et al., 2022, AJ, 164, 103
- Done et al. (2007) Done C., Gierliński M., Kubota A., 2007, A&ARv, 15, 1
- Evans et al. (2009) Evans P. A., et al., 2009, MNRAS, 397, 1177
- Fender & Hendry (2000) Fender R. P., Hendry M. A., 2000, MNRAS, 317, 1
- Gendreau et al. (2012) Gendreau K. C., Arzoumanian Z., Okajima T., 2012, in Takahashi T., Murray S. S., den Herder J.-W. A., eds, Society of Photo-Optical Instrumentation Engineers (SPIE) Conference Series Vol. 8443, Space Telescopes and Instrumentation 2012: Ultraviolet to Gamma Ray. p. 844313, doi:10.1117/12.926396
- Gendreau et al. (2016) Gendreau K. C., et al., 2016, in den Herder J.-W. A., Takahashi T., Bautz M., eds, Society of Photo-Optical Instrumentation Engineers (SPIE) Conference Series Vol. 9905, Space Telescopes and Instrumentation 2016: Ultraviolet to Gamma Ray. p. 99051H, doi:10.1117/12.2231304
- Gilfanov (2010) Gilfanov M., 2010, in Belloni T., ed., , Vol. 794, Lecture Notes in Physics, Berlin Springer Verlag. Springer Berlin Heidelberg, p. 17, doi:10.1007/978-3-540-76937-8_2
- Haardt & Maraschi (1993) Haardt F., Maraschi L., 1993, ApJ, 413, 507
- Kislat et al. (2015) Kislat F., Clark B., Beilicke M., Krawczynski H., 2015, Astroparticle Physics, 68, 45
- Kosenkov et al. (2020) Kosenkov I. A., et al., 2020, MNRAS, 496, L96
- Krawczynski & Beheshtipour (2022) Krawczynski H., Beheshtipour B., 2022, ApJ, 934, 4
- Krawczynski et al. (2022) Krawczynski H., et al., 2022, Science, 378, 650
- Kushwaha et al. (2023) Kushwaha A., Jayasurya K. M., Agrawal V. K., Nandi A., 2023, MNRAS, 524, L15
- Leong et al. (1971) Leong C., Kellogg E., Gursky H., Tananbaum H., Giacconi R., 1971, ApJ, 170, L67
- Manfreda (2020) Manfreda A., 2020, Journal of Instrumentation, 15, C04049
- Méndez & van der Klis (1997) Méndez M., van der Klis M., 1997, ApJ, 479, 926
- Motta et al. (2012) Motta S., Homan J., Muñoz Darias T., Casella P., Belloni T. M., Hiemstra B., Méndez M., 2012, MNRAS, 427, 595
- Orosz et al. (2014) Orosz J. A., Steiner J. F., McClintock J. E., Buxton M. M., Bailyn C. D., Steeghs D., Guberman A., Torres M. A. P., 2014, ApJ, 794, 154
- Podgorny et al. (2023) Podgorny J., et al., 2023, arXiv e-prints, p. arXiv:2303.12034
- Poutanen & Svensson (1996) Poutanen J., Svensson R., 1996, ApJ, 470, 249
- Poutanen et al. (2023) Poutanen J., Veledina A., Beloborodov A. M., 2023, ApJ, 949, L10
- Ratheesh et al. (2023) Ratheesh A., et al., 2023, arXiv e-prints, p. arXiv:2304.12752
- Rawat et al. (2023a) Rawat D., Garg A., Méndez M., 2023a, MNRAS, 525, 661
- Rawat et al. (2023b) Rawat D., Garg A., Méndez M., 2023b, ApJ, 949, L43
- Remillard & McClintock (2006) Remillard R. A., McClintock J. E., 2006, ARA&A, 44, 49
- Rodriguez Cavero et al. (2023) Rodriguez Cavero N., et al., 2023, arXiv e-prints, p. arXiv:2305.10630
- Romano et al. (2006) Romano P., et al., 2006, A&A, 456, 917
- Schnittman & Krolik (2009) Schnittman J. D., Krolik J. H., 2009, ApJ, 701, 1175
- Schnittman & Krolik (2010) Schnittman J. D., Krolik J. H., 2010, ApJ, 712, 908
- Shakura & Sunyaev (1973) Shakura N. I., Sunyaev R. A., 1973, A&A, 24, 337
- Sobolev (1963) Sobolev V. V., 1963, A treatise on radiative transfer.. Van Nostrand
- Steiner et al. (2014) Steiner J. F., McClintock J. E., Orosz J. A., Remillard R. A., Bailyn C. D., Kolehmainen M., Straub O., 2014, ApJ, 793, L29
- Taverna et al. (2020) Taverna R., Zhang W., Dovčiak M., Bianchi S., Bursa M., Karas V., Matt G., 2020, MNRAS, 493, 4960
- Tomaru et al. (2023) Tomaru R., Done C., Odaka H., 2023, arXiv e-prints, p. arXiv:2308.07237
- Verner et al. (1996) Verner D. A., Ferland G. J., Korista K. T., Yakovlev D. G., 1996, ApJ, 465, 487
- Weisskopf et al. (2022) Weisskopf M. C., et al., 2022, Journal of Astronomical Telescopes, Instruments, and Systems, 8, 026002
- White & Marshall (1984) White N. E., Marshall F. E., 1984, ApJ, 281, 354
- Wilms et al. (2000) Wilms J., Allen A., McCray R., 2000, ApJ, 542, 914