The Web Epoch of Reionization Lyman- Survey (WERLS) I. MOSFIRE Spectroscopy of Lyman- Emitters111The data presented herein were obtained at the W. M. Keck Observatory, which is operated as a scientific partnership among the California Institute of Technology, the University of California and the National Aeronautics and Space Administration. The Observatory was made possible by the generous financial support of the W. M. Keck Foundation.
Abstract
We present the first results from the Web Epoch of Reionization Lyman- Survey (WERLS), a spectroscopic survey of Lyman- emission using Keck I/MOSFIRE and LRIS. WERLS targets bright () galaxy candidates with photometric redshifts of selected from pre-JWST imaging embedded in the Epoch of Reionization (EoR) within three JWST deep fields: CEERS, PRIMER, and COSMOS-Web. Here, we report 11 Lyman- emitters (LAEs; 3 secure and 8 tentative candidates) detected in the first five nights of WERLS MOSFIRE data. We estimate our observed LAE yield is %, broadly consistent with expectations assuming some loss from redshift uncertainty, contamination from sky OH lines, and that the Universe is approximately half-ionized at this epoch, whereby observable Lyman- emission is unlikely for galaxies embedded in a neutral intergalactic medium. Our targets are selected to be UV-bright, and span a range of absolute UV magnitudes with . With two LAEs detected at , we also consider the possibility of an ionized bubble at this redshift. Future synergistic Keck+JWST efforts will provide a powerful tool for pinpointing beacons of reionization and mapping the large scale distribution of mass relative to the ionization state of the Universe.
1 Introduction
The first billion years of the Universe hosts its most pivotal transition — from a neutral to ionized medium — for which we have yet to determine primary drivers or a precise timeline. From the earliest work on this phase change (e.g. Arons & McCray, 1970) to today, considerable progress has been made to constrain the processes and timing of this transition — the Epoch of Reionization (EoR) — through both theoretical and observational efforts. Observations of some of the first light sources as they ionized a then neutral intergalactic medium (IGM) have revealed that the reionization process most likely finished around (Zheng et al., 2011; Kakiichi et al., 2016; Castellano et al., 2016) and was halfway completed by (Robertson et al., 2013; Faisst et al., 2014; Finkelstein, 2016). Around this halfway point, a high neutral fraction of the IGM has been fairly constrained from somewhat sparse measurements of Lyman- emitters (LAEs), where the conversion to a neutral fraction has a high systematic uncertainty (Treu et al., 2013; Mason et al., 2019; Hoag et al., 2019; Bolan et al., 2021).
While observations have provided some constraints on the timeline of the EoR, the duration and patchiness of reionization, as well as its main driving sources, remain unclear. In the case where all galaxies have relatively high escape fractions of ionizing photons () — therefore massive, UV-bright galaxies dominate reionization (Naidu et al., 2020) — a late reionization is favored. However, some observations show that galaxies with high are rare (Izotov et al., 2016), with small samples of local detections of cosmologically relevant escape fractions (e.g. Flury et al., 2022), and few observations with very high escape fractions (e.g. Izotov et al., 2018; Saha et al., 2020; Marques-Chaves et al., 2021). Simulations predict that depends on halo mass, with higher from fainter galaxies in lower-mass halos (Paardekooper et al., 2015; Faisst, 2016; Bremer & Dayal, 2023). This suggests the case where more numerous UV-faint galaxies dominate reionization, and favors an earlier start to reionization, that evolves smoothly in time (Mason et al., 2015; Finkelstein et al., 2019). Around the instantaneous redshift of reionization (; Planck Collaboration et al., 2020) — which serves as a mean reionization redshift by assuming the process was instantaneous — the former scenario predicts the IGM is ionized, while the latter scenario (wherein faint galaxies dominate) predicts of the IGM is ionized (Finkelstein et al., 2019). Taking a census of massive galaxies at can help answer both questions regarding the duration and sources of reionization; in particular, did intrinsically bright galaxies or faint galaxies drive reionization?
In constraining this problem, we are faced with a relative shortage of intrinsically UV-bright galaxies currently known and spectroscopically confirmed (see Ouchi et al., 2020, for a summary of the 15 spectroscopic confirmations pre-JWST). The pre-JWST sample of EoR galaxies has been gathered and confirmed via direct detection of candidate Lyman- Break Galaxies (LBGs) in relatively small, pencil-beam fields with Hubble Space Telescope (e.g. Bunker et al., 2010; McLure et al., 2010; Finkelstein et al., 2010, 2012; Oesch et al., 2012; Yan et al., 2012), from sources with “IRAC excess” attributed to intense [Oiii]+H line emission at polluting the IRAC 4.5 band (e.g. Smit et al., 2015; Roberts-Borsani et al., 2022), and from spectroscopic follow-up mainly targeting Lyman- (e.g. Ono et al., 2012; Shibuya et al., 2012; Finkelstein et al., 2013; Zitrin et al., 2015; Oesch et al., 2015; Inoue et al., 2016; Song et al., 2016; Stark et al., 2017; Hoag et al., 2017; Jung et al., 2019; Hu et al., 2019; Jung et al., 2020; Larson et al., 2022) or [Cii] emission lines (e.g. Smit et al., 2018; Bouwens et al., 2022; Schouws et al., 2022). Now with JWST, perhaps the most impressive early results illustrate its ease of spectroscopic detection for galaxies that were previously undetectable, as spectra have been gathered for relatively large samples of EoR galaxies from both NIRSpec (e.g. Bunker et al., 2023; Cameron et al., 2023; Curtis-Lake et al., 2023; Arrabal Haro et al., 2023; Fujimoto et al., 2023) and the NIRCam Grism (e.g. Oesch et al., 2023).
Several of these spectroscopically confirmed early EoR galaxies (both from JWST and pre-JWST) exhibit Lyman- in emission (e.g. Oesch et al., 2015; Zitrin et al., 2015; Hoag et al., 2018; Hashimoto et al., 2018; Pentericci et al., 2018), with detections of Lyman- as high as (GN-z11; Bunker et al., 2023). However, detecting Lyman- from galaxies embedded in the EoR — especially at when the Universe is thought to have been predominantly neutral — involves both technical and physical challenges. From a technical standpoint, while redshift identification via rest-frame optical nebular emission lines is very efficient with NIRSpec, Lyman- can still be elusive, even to JWST. For example, while Lyman- was detected in GN-z11 at (anchored by multi-line confirmation in Bunker et al., 2023), it was only seen in higher resolution spectra, and was undetected in PRISM observations. Additionally, Lyman- detections with NIRSpec can be difficult due to slit losses, particularly important for Lyman- emission which can extend beyond the small 03 NIRSpec slitlets. Detecting Lyman- is also challenging from a physical perspective, as Lyman- photons from EoR galaxies should resonantly scatter by the mostly neutral IGM at a relatively low threshold for HI column density ( Dijkstra et al., 2014; Stark, 2016). This concern is partially alleviated by assuming an inhomogeneous reionization process.
Indeed, cosmological simulations indicate that reionization was likely a patchy process (Furlanetto et al., 2017; D’Aloisio et al., 2018), producing ionized bubbles in the surrounding IGM growing from 5 – 20 cMpc at to 30 – 100 cMpc at (10 – 40 arcmin). Constraints from spectra of quasars near the end of reionization support this picture of patchiness (e.g. Becker et al., 2015). Observational clues of this patchy reionization have also been noted in the distribution of LAEs within the EoR and the large-scale bubbles of ionization they may live in. Recent studies report two or more spectroscopically confirmed sources at the same redshift (e.g. Jung et al., 2019; Tilvi et al., 2020), from which a bubble size is inferred based on estimated ionizing radiation encompassing galaxies within that overdensity. For example, Larson et al. (2022) find a candidate LAE at with Keck/MOSFIRE near a known source at a similar redshift (Zitrin et al., 2015) in the Extended Groth Strip (EGS), and report the tentative, serendipitous result of an ionized bubble. Further analysis of fainter galaxies within the overdensity in EGS suggest this ionized bubble could be fairly large (Whitler et al., 2023, Larson et al., in prep.). Other studies report apparent overdensities in the EoR — potentially pointing to large ionized bubbles — but are limited to uncertain photo-’s to approximate an encompassed comoving volume (e.g. Endsley et al., 2021). These sparse observations loosely match theoretical expectations, with the tentative bubble (Endsley et al., 2021) at an estimated radius of cMpc, and the potential overdensity up to cMpc (Larson et al., 2022; Whitler et al., 2023). Recent simulations show that for a fixed ionization fraction, bubble size distributions vary with the dominant source of ionizing output, wherein dominance of low mass haloes produces lots of smaller bubbles and dominance of high mass haloes produces fewer, larger bubbles (Kannan et al., 2022). The ionization history is also encoded in the patchiness of reionization; at , ionized bubbles should be rare in the late-reionization scenario and more common in the early-reionization scenario (e.g. Finkelstein et al., 2019).
The Web Epoch of Reionization Lyman- Survey (WERLS)222This survey was originally named Webb Epoch of Reionization Lyman- Survey, in reference to the telescope name, but later renamed to emphasize the scientific goal of mapping the cosmic web on large scales as well as to be inclusive and supportive to members of the LGBTQIA+ community. is designed to conduct this census of Lyman- emission in a sample of photometrically-selected UV-bright () EoR galaxies in areas covered by JWST imaging, on scales large enough to capture bubbles. WERLS is designed to expand the sample of spectroscopically confirmed EoR LAEs at as well as map ionized bubbles in the IGM on large scales. In this paper, we present the first semester of Keck I/MOSFIRE data from WERLS, including spectra for a subset of UV-bright EoR LAEs from . We describe the sample and observations in §2, and in §3 we present analysis of the spectroscopic data. In §4 we detail photometric and spectroscopic characterization of the individual sources, in §5 we discuss the implications of our measurements, and we present a summary in §6. The full target list including spectroscopic results and redshift measurements for filler targets are presented in the Appendix. All magnitudes are quoted in the AB system (Oke & Gunn, 1983), we assume a Chabrier initial mass function (IMF) (Chabrier, 2003), and we assume a Planck cosmology throughout this paper, adopting and (Planck Collaboration et al., 2016).
2 Observations & Sample
WERLS is a 29-night NASA key strategic mission support program (PIs: Casey & Kartaltepe) using two multi-object spectrometers on Keck I, the MultiObject Spectrometer for Infra-Red Exploration (MOSFIRE; McLean et al., 2012) and the Low Resolution Imaging Spectrometer (LRIS; Oke et al., 1995; Rockosi et al., 2010). The primary objective of WERLS is to target galaxy candidates embedded within the latter half of the EoR in order to conduct a census of Lyman- and correlate the Lyman--inferred location of ionized structures in the IGM to galaxy density maps measured with JWST/NIRCam.
By combining these Lyman- detections with JWST imaging (currently being obtained), we can then map the underlying galaxy density distribution in the same areas where we have mapped the inferred ionization state of the IGM. The WERLS program uses two instruments, LRIS, optimal for detecting Lyman- at , and MOSFIRE in -band, optimal for detecting Lyman- at .
In this paper, we focus only on candidate LAEs detected using MOSFIRE data collected over the first 5 nights of WERLS in the 2022A semester. Initial results from LRIS observations in 2022A will be presented in a companion paper (Urbano Stawinski et al. in prep).
2.1 Sample Selection
Our spectroscopic targets have been selected specifically across three extragalactic fields that have approved deep near-infrared imaging from JWST/NIRCam during its first year of observations: the COSMOS-Web Cycle 1 program (0.54 deg2, GO#1727, PIs: Casey & Kartaltepe, Casey et al., 2022), the Cosmic Evolution Early Release Science Survey (CEERS, 0.03 deg2, ERS#1345, PI: S. Finkelstein, Finkelstein et al., 2022)333Available for download at ceers.github.io/releases.html and on MAST as High Level Science Products via doi:10.17909/z7p0-8481, and the Public Release IMaging for Extragalactic Research Cycle 1 program (PRIMER, 0.07 deg2, GO#1837, PI: J. Dunlop) in the Cosmic Assembly Near-infrared Deep Extragalactic Legacy Survey (CANDELS) regions of the COSMOS and Ultra Deep Survey (UDS) fields. These fields together encompass 0.7 deg2 and constitute the largest (by area) extragalactic surveys planned in the first year of JWST observations. Here we describe the target selection used for the MOSFIRE observations in each of the three fields.
Within the COSMOS-Web footprint, we first select WERLS targets via deep ground-based imaging from the COSMOS2020 catalog (Weaver et al., 2022). These COSMOS targets include EoR candidates selected via well-constrained photometric redshifts from analysis of all Spitzer data (Euclid Collaboration et al., 2022) in addition to deep near-infrared and optical imaging from UltraVISTA DR4 (McCracken et al., 2012) and Subaru/Hyper Suprime-Cam, which increases depth by mag relative to previous observations in the same field (Laigle et al., 2016). We perform photometric selection using the Farmer photometry (Weaver et al., 2019) and use photometric redshifts fit using LePHARE (Arnouts & Ilbert, 2011; Ilbert et al., 2006; Arnouts et al., 1999). The total WERLS sample (selected for both LRIS and MOSFIRE) has been selected within the COSMOS-Web footprint as continuum sources with with % of their redshift probability density distribution (PDF) above , a conservative lower redshift bound to the end of reionization (Becker et al., 2015). WERLS targets are selected to be UV-bright; 90% of the sample have if confirmed at their photometric redshifts; this is roughly equal to the characteristic magnitude of the luminosity function at these redshifts (Finkelstein et al., 2019).
Additional targets within COSMOS as well as target selection in the Extended Groth Strip (EGS) and Ultra Deep Survey (UDS) fields have been selected from deep Hubble Space Telescope (HST) and Spitzer imaging from the CANDELS fields (Grogin et al., 2011; Koekemoer et al., 2011; Ashby et al., 2015) with and with the same redshift criteria of with 95% of their redshift PDF above . This photometric selection for CANDELS sources utilizes SourceExtractor photometry (Bertin & Arnouts, 1996) and EAzY redshift PDFs (Brammer et al., 2008). Given the increased depth of CANDELS near-infrared observations compared to ground-based observations, we also include slightly fainter EoR candidates () but include them as fillers rather than primary targets. In these CANDELS regions we used the photometric catalogs and photometric redshift results from Finkelstein et al. (2022). We selected galaxies using a modified version of the Finkelstein et al. (2022) selection criteria (which had been optimized for ), requiring , and 95% of the redshift PDF above .
Lower-redshift filler targets were included in the sample to increase the efficiency of observations, selected by magnitude and photometric redshift from the COSMOS2020 and CANDELS photometric catalogs. We select three categories of filler targets based on different redshift ranges optimized for other prominent emission lines: H -emitters at , [Oii]-emitters at , and Ciii]-emitters at . Spectroscopic information for the 166 filler targets (an average of fillers per slitmask, just over half of the targets per mask) are presented in the appendix, along with any new spectroscopic redshift measurements. Stars (used for alignment and for flux calibration) were also placed on each mask; these are taken from Gaia DR3 (Gaia Collaboration et al., 2023) and registered to the same reference astrometry as our source catalogs.
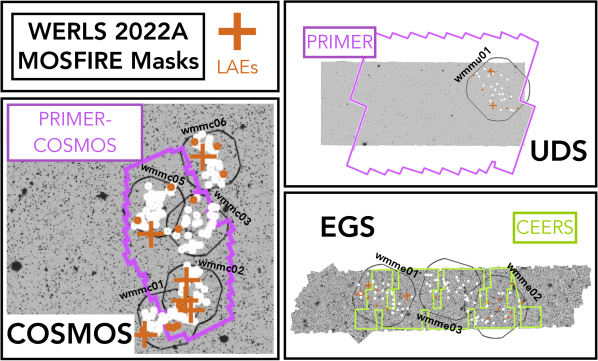
From this COSMOS2020 and CANDELS-based target list, we then designed optimized slitmask configurations in the MOSFIRE Automatic GUI-based Mask Application (MAGMA444https://www2.keck.hawaii.edu/inst/mosfire/magma.html) for our Keck/MOSFIRE observations. The fields and targets observed relative to the JWST deep fields in which they lie are shown in Figure 1. Mask pointings were selected to maximize the number of EoR targets on slits, and in general, targets were prioritized by brightness ( as measured in UltraVISTA -band or HST WFC3/F125W, drawn from the survey from which a given source was selected) and photometric redshift corresponding to emission lines falling within the MOSFIRE -band wavelength coverage. Each mask also had at least one star placed on a slit to monitor seeing conditions and potential pointing drift throughout observations.
The broader WERLS Primary target sample (Lyman- targets selected photometrically at ) is optimized for observability with both LRIS and MOSFIRE; targets are then sorted into subsamples based on their redshift PDFs:
-
1.
Primary MOSFIRE targets: % of their photometric redshift PDF within , corresponding to the MOSFIRE -band wavelength coverage for Lyman- emission
-
2.
Primary LRIS targets: % of their photometric redshift PDF at , corresponding to the LRIS wavelength coverage for Lyman- emission
-
3.
Primary targets for both MOSFIRE+LRIS: broader redshift PDFs split roughly evenly between the wavelength ranges of both instruments, with 25% of their photometric redshift PDFs within
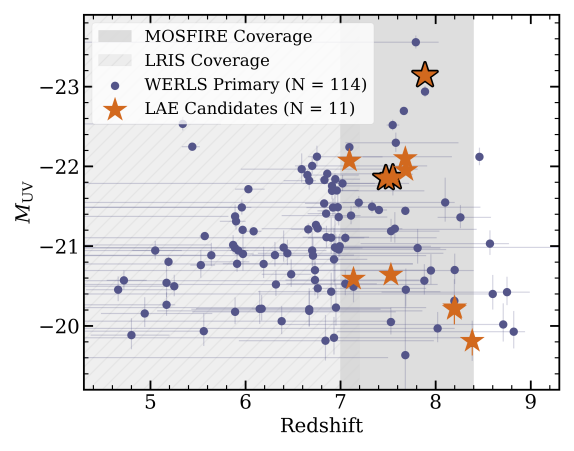
Selection for these three categories resulted in 114 WERLS Primary Lyman- targets across our nine 2022A MOSFIRE pointings. From these 114 WERLS Primary targets, 33 were MOSFIRE Primary targets, 54 were both MOSFIRE+LRIS Primary targets, and 27 were LRIS Primary targets. Given the breadth of the photometric redshift PDFs, we expect some LRIS Primary targets might be detected in Lyman- emission within the MOSFIRE wavelength range, and vice versa; so, lower-redshift EoR candidates are still added to MOSFIRE masks as high priority fillers, though they do not drive the choice of pointing, which was based on the higher- MOSFIRE Primary subsample. Further, depending on specific LRIS and MOSFIRE mask design, a subset of the WERLS Primary targets were observed with both instruments in order to capture a wider wavelength range for possible Lyman- detection.
Primary target source density was highest within the CANDELS fields due to their depth, and as a result, COSMOS pointings for 2022A were clustered in the PRIMER-COSMOS area. The effective area covered by the nine slitmasks is deg2 across the three fields, with the majority of the covered area in COSMOS. In total for the nine MOSFIRE masks observed in 2022A, 276 galaxy candidates (114 WERLS Primary and 162 fillers) and 15 stars were placed on slits.
2.2 Keck/MOSFIRE Observations
| Mask Name | RA | Dec | Date(s) Observedaafootnotemark: | bbfootnotemark: | ccfootnotemark: | Slit Width | Seeingddfootnotemark: | Airmass | Deptheefootnotemark: | |
|---|---|---|---|---|---|---|---|---|---|---|
| (UTC) | (# ABBA) | (arcsec) | (arcsec) | (mag) | ||||||
| wmmu01 | 02:17:04.68 | –05:10:30.00 | Feb 12, 13, 14 | 5 (23) | 9 | 14 | 0.7–1.0 | 0.7–1.2 | 1.4 | 20.4 |
| wmmc06 | 10:00:16.13 | +02:29:18.60 | Apr 17 | 2 (6) | 19 | 15 | 1.0 | 0.9–1.3 | 1.0 | 20.0 |
| wmmc03 | 10:00:22.34 | +02:21:57.60 | Feb 13, 14 & Mar 14 | 9 (13) | 10 | 33 | 0.7–1.0 | 0.9–1.3 | 1.7 | 20.7 |
| wmmc02 | 10:00:24.60 | +02:14:19.68 | Feb 12, 13 | 6 (13) | 13 | 20 | 0.7–1.0 | 0.7–1.3 | 1.6 | 20.5 |
| wmmc01 | 10:00:35.47 | +02:11:31.92 | Feb 12 | 4 (14) | 13 | 20 | 0.7 | 0.6–0.9 | 1.6 | 21.4 |
| wmmc05 | 10:00:41.57 | +02:24:03.96 | Feb 14 & Mar 14 | 3 (8) | 18 | 32 | 0.7–1.0 | 0.7–1.3 | 1.1 | 21.3 |
| wmme02 | 14:19:24.05 | +52:48:20.88 | Apr 17 | 1 (20) | 11 | 17.5 | 1.0 | 0.8–1.3 | 1.2 | 19.9 |
| wmme03 | 14:19:35.83 | +52:53:24.36 | Mar 14 | 1 (8) | 25 | 8 | 0.7 | 0.6–0.9 | 1.2 | 20.0 |
| wmme01 | 14:20:10.44 | +52:58:28.92 | Feb 12, 13, 14 & Mar 14 | 3 (12) | 21 | 20 | 0.7–1.0 | 0.7–1.2 | 1.2 | 20.3 |
bNumber of MOSFIRE Primary targets on mask (excludes filler targets); in parentheses we give the total number of WERLS EoR targets (some of which are fainter than the primary sample).
cNumber of filler targets on mask.
d Seeing measured from the full-width half maximum (FWHM) estimated from continuum object (bright star) placed on each science mask.
e Limiting magnitude measured via -band magnitude and MOSFIRE SNR of bright star placed on each science mask.
Observations were taken with MOSFIRE (McLean et al., 2012) on the Keck I telescope using the -band spectroscopic filter to optimize for detection of Lyman- redshifted to . Observations were obtained over 5 nights in 2022A: 2022-Feb-12, 2022-Feb-13, 2022-Feb-14, 2022-Mar-14, and 2022-Apr-17 UTC. Individual science frames were taken with 180 sec exposures, with a goal of hr of total exposure time per mask. We use a standard ABBA dither pattern with nod distance of (unless contaminants landed on high priority slits at this distance, then nods were taken). Exposures in -band were 180 sec and taken in MCDS sampling mode with 16 reads; for each mask we aim for 20 ABBA sequences to achieve a nominal 4 hours total exposure time, but there are cases where we took more sequences if weather conditions were not ideal.
Four of the nine slitmasks were not observed for the full 20 sequences mostly due to limited observability due to weather; observational details for each MOSFIRE slitmask are listed in Table 1. We adopted slit widths of 07 (affording a spectral resolution of R 3500) or 10 depending on the seeing during observations. The seeing varies through the nights from 06 to 13, as measured directly from our spectroscopic data using the monitoring star. Weather conditions varied across the 5 nights: 2022-Feb-12 was clear with good seeing throughout the night, 2022-Feb-13 was clear with variable seeing throughout the night, 2022-Feb-14 had wind, fog, and snow, leading to the dome closing twice and poor seeing, 2022-Mar-14 was clear with good seeing, and 2022-Apr-17 began with high humidity and delays in the dome opening followed by some cloud cover the rest of the night, leading to moderate seeing.
2.3 MOSFIRE Spectroscopic Data Reduction
The data were reduced using two reduction pipelines independently to ensure robust noise characterization in order to build confidence in our candidate faint line detections for these high redshift targets.
First, we use the PypeIt data reduction package (Prochaska et al., 2020), which is designed to be a general use spectroscopic pipeline and can be used for a range of instruments and facilities. We iteratively worked with the PypeIt team to determine the optimal data reduction configuration for Keck I/MOSFIRE parameters in PypeIt and reduce the data in ABBA sequence blocks, using the spectral trace of a bright star in one of the slits on each mask as a position reference. The output from PypeIt is reduced and co-added 2D spectra, from which we optimally extract 1D spectra at the centroid of the emission line using the technique of Horne (1986), with a 7 pixel (126) spatial aperture, matched to the typical seeing FWHM level from our observations. In a few cases, candidate emission line detections were slightly offset by 1-2 pixels from the target position, however in all cases the candidate line was away from the source centroid, well within expectations given positional accuracy and possible Lyman- emission offsets from the broadband imaging centroid. We also extract 1D spectra using a boxcar for comparison, but typically achieve a higher SNR using optimal extraction; we ultimately adopt the optimally extracted 1D spectra for our measurements.
Second, we use the public MOSFIRE data reduction pipeline (MosfireDRP555https://keck-datareductionpipelines.github.io/MosfireDRP/) to reduce the raw data. The MosfireDRP pipeline provides a sky-subtracted, flat-fielded, and rectified 2D slit spectrum per slit object. The reduced spectra are wavelength-calibrated using telluric sky emission that is built specifically for the instrument. We extract 1D spectra from the combined 2D spectra via both optimal and boxcar extraction schemes as above, ultimately adopting the optimally extracted 1D spectra.
While some teams have reported that there is non-negligible slit drift in the spatial direction (up to pixel hr-1) in their MOSFIRE observations that necessitated correction (e.g., Kriek et al., 2015; Song et al., 2016; Jung et al., 2019; Hutchison et al., 2020; Larson et al., 2022), we checked slit alignments carefully during the course of our observations using our reference star and found no significant slit drift. Note that all of our masks were only observed for a maximum of four hours where many datasets that see significant drift coadd data taken over a longer duration. While drift is automatically accounted for in our PypeIt reductions, it is not accounted for in our MosfireDRP reductions, except when co-adding data from different nights where it was critical to account for a global offset in the final reduced product.
3 Spectroscopic Analysis
In this first WERLS paper, we focus only on the goal of taking a census of LAEs in the EoR, limited to the WERLS MOSFIRE 2022A dataset in-hand. Here, we present the MOSFIRE spectroscopic constraints for this initial sample.
3.1 Lyman- Emission Line Vetting
Our candidate Lyman- emission lines were all first identified via visual inspection of the 2D spectra initially from either the MosfireDRP or PypeIt reduction. Inclusion in this paper as a tentative or secure detection requires the candidate emission line to be present at in both independent reductions, which reinforces our confidence in the robustness of the detection. We check for a bright positive signal with spatial width well-matched to seeing and spectral width at least as broad as one spectral resolution element. Such a positive signal then has an integrated SNR greater than the average noise (with a threshold of , consistent with other Lyman- spectroscopic works, e.g. Jung et al., 2022), with OH forest sky emission features masked out. We verify that candidate emission line detections also have negative signals; real astronomical signal should be accompanied by symmetric negative signals with SNR lower than the positive signal, spatially offset above and below the positive signal at the expected separation based on the mask’s adopted nod amplitude. Using these criteria, we inspect both data reduction products to ensure the feature is not an obvious artifact. All LAEs reported in this paper satisfied our criteria in both reductions; in some cases the SNR of the line varied slightly within the noise between reductions.
To ensure the nature of the emission line candidates as (spectrally isolated) Lyman-, we search for multiple emission lines in the -band spectra, which implies the original line is not Lyman- and the source is at a lower redshift. A likely contaminant in this case is a source with [Oii] emission; galaxies with [Oii] emission in -band may be misidentified as EoR galaxies if the Balmer break is mistaken for the Lyman- break in a photometric redshift solution. However, in this case, given the spectral resolution of our MOSFIRE data, this doublet should be resolvable (at at the expected [Oii]-emitter redshift of ) and therefore distinguishable from Lyman- for uncontaminated (with respect to sky lines) spectral regions broader than the doublet width. For all candidate lines, we also verify alignment on the slit mask by optimally extracting the 1D spectrum at the spatial position of the detection, and verify the spatial positions of the negatives match expectations given the nod amplitude for those observations.
To further assess credibility of the Lyman- identification, we consider the available photometric constraints. Any excess emission in Spitzer/IRAC Channel 2 (4.5) over Spitzer/IRAC Channel 1 (3.6) provides increased credibility for our Lyman- emission line candidates, as the presence of strong [Oiii]+H emission would cause an “IRAC excess” from , encompassing our entire target redshift range. Additionally, by examining HST/UltraVISTA cutouts of the target showing the slit overlay, we check for potential low- contaminants by ruling out any large, bright targets at or near the target position on the slit that could be serendipitous sources of emission lines.
3.2 LAEs
From this first round of emission line searching and vetting, we find 35 candidate EoR LAEs out of 114 primary targets, for which we compiled all available spectroscopic and photometric information. This compiled information was visually inspected and vetted by 22 of this paper’s co-authors independently. Each of the 22 co-authors commented on the source and ranked its quality as “Bogus”, “Very Tentative”, “Tentative”, or “Secure”, which were then assigned numerical values 1-4. From this inspection, we settled on 11 total LAEs to present in this paper based on our aggregate confidence in their reliability. This sample of 11 was divided into two categories: secure () and tentative (). We ultimately categorize sources using all available data with a holistic assessment, described as follows. Secure sources were strongly detected in both MosfireDRP and PypeIt reductions, have a clear Lyman- break in their photometry, and have spectroscopic redshift solutions well-matched to the photometric redshift PDF(s). All secure sources also had average scores above 3.0/4.0 from the co-author vetting survey, wherein a maximum score of 4.0 reflects the scenario wherein all 22 co-authors voted the source as “Secure”. Tentative sources were so classified because their Lyman- lines were lower SNR, their photometric redshift may not align well with the identified line, or some other reason that casts the security of the identification in doubt. Justification of placement in the secure or tentative subsample is described on a per-source basis below.
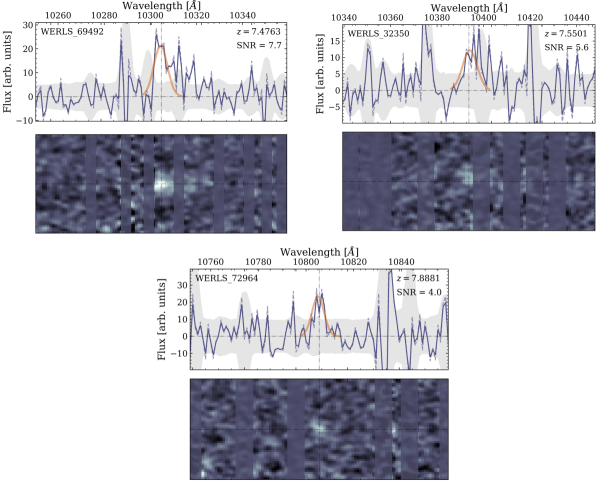
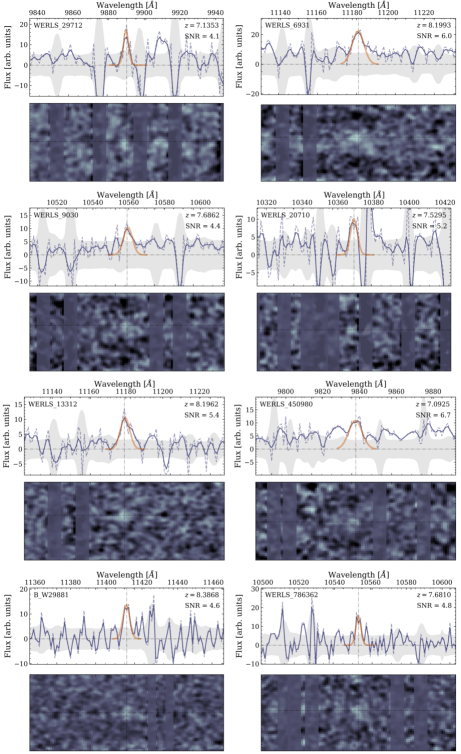
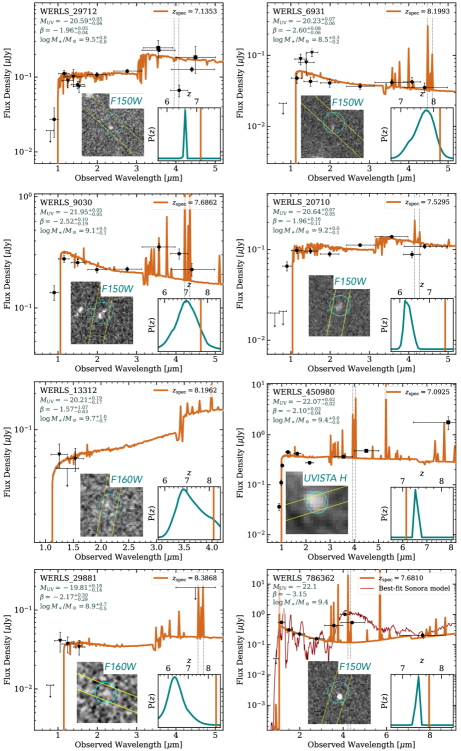
The -band spectra of the secure sample is shown in Figure 2, and the spectra of the tentative sample is shown in Figure 3. Redshift solutions for our 11 LAEs are found by Gaussian fit (rather than an asymmetric Gaussian as our signals are faint) to the centroid of the emission line, with no velocity offset applied. Target information and redshifts are listed in Table 2, and characteristics for each source are detailed further in §4.
| ID | RA | Dec | SFR | Mask | SNR | Other refs. | |||||
|---|---|---|---|---|---|---|---|---|---|---|---|
| J2000 | J2000 | ABmag | M⊙ yr-1 | log M⊙ | |||||||
| (1) | (2) | (3) | (4) | (5) | (6) | (7) | (8) | (9) | (10) | (11) | (12) |
| WERLS_72964 | 10:00:19.40 | +02:29:36.64 | — * | — * | — * | wmmc06 | 7.8881 | 4.0 | |||
| WERLS_69492 | 14:20:12.08 | +53:00:26.82 | wmme01 | 7.4763 | 7.7 | RB16, S17, J22, J23 | |||||
| WERLS_32350 | 14:19:59.77 | +52:56:31.09 | wmme01 | 7.5501 | 5.6 | J22, J23 | |||||
| WERLS_29712 | 02:17:06.97 | –05:12:15.77 | wmmu01 | 7.1353 | 4.1 | ||||||
| WERLS_6931 | 02:17:07.82 | –05:08:35.09 | wmmu01 | 8.1993 | 6.0 | ||||||
| WERLS_9030 | 10:00:24.79 | +02:12:28.66 | wmmc02 | 7.6862 | 4.4 | ||||||
| WERLS_20710 | 10:00:26.71 | +02:15:47.20 | wmmc02 | 7.5295 | 5.2 | ||||||
| WERLS_13312 | 10:00:27.42 | +02:13:35.54 | wmmc02 | 8.1962 | 5.4 | ||||||
| WERLS_786362 | 10:00:42.72 | +02:20:58.85 | ** | ** | —** | ** | wmmc05 | 7.6810 | 4.8 | ||
| WERLS_450980 | 10:00:45.58 | +02:09:43.34 | wmmc01 | 7.0925 | 6.7 | ||||||
| WERLS_29881 | 14:20:20.28 | +53:00:31.28 | wmme01 | 8.3868 | 4.6 |
Note. — Columns: (1) WERLS object ID, (2) Right ascension, (3) Declination, (4) peak EAzY photometric redshift and inner 68% uncertainty, (5) UV magnitude measured from Bagpipes with inner 68% uncertainty, (6) UV slope () measured from Bagpipes with inner 68% uncertainty, (7) star formation rate (SFR) measured from Bagpipes with inner 68% uncertainty, (8) stellar mass () measured from Bagpipes with inner 68% uncertainty, (9) WERLS MOSFIRE mask for object, (10) spectroscopic redshift measured from Lyman- emission line, (11) Lyman- emission line detection signal-to-noise ratio (SNR), and (12) other literature works that report Lyman- emission for the source (RB16 = Roberts-Borsani et al. (2016), S17 = Stark et al. (2017), J22 = Jung et al. (2022), J23 = Jung et al. (2023)).
*WERLS_72964 has blended IRAC photometry, therefore we do not report physical properties for the source given its contaminated infrared photometry.
**Estimated properties apply if WERLS_786362 is indeed an EoR galaxy and not a brown dwarf; we are unable to constrain a physically plausible SFR and do not report uncertainties as properties are taken directly from a generated galaxy model rather than estimated from a best-fit model to the data (see §4.2.4. for more details).
Sources with secure multi-line systemic redshifts from CEERS JWST/NIRSpec data.
4 Characterization of LAEs
4.1 Photometric Characterization
Photometric measurements are drawn from the deepest available catalog, which for the majority of our sample, were the CANDELS catalogs (Grogin et al., 2011; Koekemoer et al., 2011; Ashby et al., 2015). For one source in COSMOS that is not in the CANDELS catalog (WERLS_450980), we use COSMOS2020 photometry (Weaver et al., 2022). Only one source was in both the CANDELS and COSMOS2020 catalogs (WERLS_786362), however, this source also had JWST imaging available.
We search publicly available imaging from JWST (Rigby et al., 2023; Menzel et al., 2023; McElwain et al., 2023); at the time of writing, JWST/NIRCam imaging data (Rieke et al., 2023) existed for five sources: WERLS_9030, WERLS_20710, & WERLS_786362 in PRIMER-COSMOS, and WERLS_29712 & WERLS_6931 in PRIMER-UDS. Reduction of the PRIMER data was carried out as in Franco et al. (in prep). The raw NIRCam imaging in PRIMER-COSMOS was reduced with JWST Calibration Pipeline version Pipeline 1.10.0 (Bushouse et al., 2022), with the Calibration Reference Data System (CRDS)666jwst-crds.stsci.edu pmap-1075, which corresponds to NIRCam instrument mapping imap-0252. For the imaging in PRIMER-UDS, we use the publicly available grizli reduction (Brammer, 2023). From the reduced NIRCam imaging, we measure aperture photometry using photutils (Bradley et al., 2023) from images PSF homogenized to F444W (using pypher; Boucaud et al., 2016).
We recompute photometric redshift PDFs uniformly for our entire sample of LAEs in order to incorporate the new JWST data. We fit each galaxy spectral energy distribution (SED) with EAzY (Brammer et al., 2008), which computes linear combinations of pre-defined templates to derive photometric redshift probability distribution functions (PDFs) based on the of the templates. Given that our sources are LAEs, we adopt the template set detailed in Larson et al. (2022), with the standard tweak_fsps_QSF_12_v3 set of 12 FSPS (Conroy et al., 2010) and additional bluer LAE models, designed for high redshift star-forming galaxies like those we target here. Specifically, we use Set 3: Reduced Lyman- from Larson et al. (2022), which include models with emission lines added but with Lyman- reduced to 1/10 of that produced by CLOUDY (Ferland et al., 2017) to emulate a 10% Lyman- escape fraction, meant to represent typical galaxies. We allow the redshift to vary from with a step size of , and assume no redshift prior in order to derive the photometric redshift PDF. The results of these fits compared to the Lyman--derived spectroscopic redshifts are shown as subpanels in Figure 4 (for the secure sample) and in Figure 5 (for the tentative sample).
While sources were originally selected via photometric constraints derived from SED fitting, with new redshift constraints in hand from spectroscopy, we improve upon these SED characterizations using the Bayesian SED fitting code, Bagpipes (Carnall et al., 2018). For each source, we fix the redshift to the Lyman--derived spectroscopic redshift. As we are able to fix the redshifts, we adopt a non-parametric star formation history (SFH) via the Leja et al. (2019) continuity SFH model. We adopt 7 age bins, the most recent bin capturing the SFR in the last 10 Myr and a maximum epoch of star-formation at . We adopt the bursty continuity prior from Tacchella et al. (2022). We allow the metallicity to vary from with a log-uniform prior. We adopt a Calzetti (2001) dust attenuation law, and we allow the attenuation to vary from with a log-uniform prior. We also include a nebular component; Bagpipes uses the CLOUDY photoionization models (Ferland et al., 2017) to generate Hii regions, and follows Byler et al. (2017) wherein total nebular emission is the sum of emission from Hii regions of different ages. We allow the ionization parameter to vary from -4 to -1, with a Gaussian prior with .
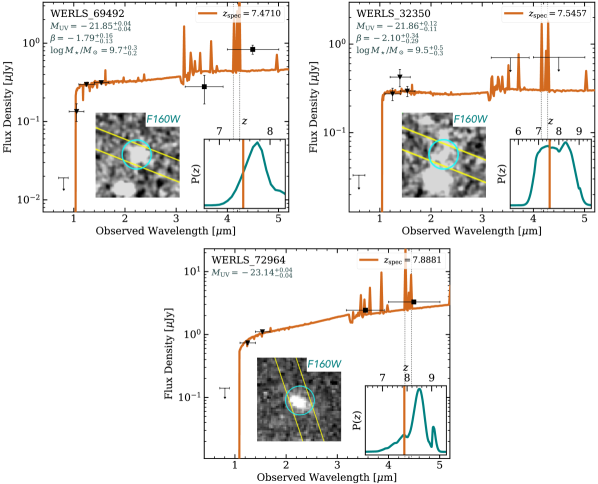
From the best-fit Bagpipes model, we calculate the absolute UV magnitude () of each source (listed in Table 2). The distribution of versus best available redshift for the sample is shown in Figure 6. Our targets are UV-bright by selection, but span a wide range of UV magnitude, with our spectroscopic sample spanning .
We derive physical properties from the best-fit Bagpipes model for each source (note that the following excludes values listed for WERLS_786362, which are not derived from the best-fit model to the photometry, but instead are taken directly from the generated Bagpipes model). As expected for LAEs, our galaxies are generally star-forming but show a broad range, with star formation rates (SFRs) ranging 0.1-90 M⊙ yr-1 and a median SFR of 10 M⊙ yr-1. We estimate a median stellar mass of M⊙ and ranging log (/ M⊙) , suggesting our sample represents massive EoR galaxies but not necessarily the most extreme at this epoch. Given their Lyman- detections and implied ionized photon escape, we expect these galaxies to be fairly blue; this is supported by their measured rest-frame UV slopes (), ranging with a median of . The measured properties for the sample are listed in Table 2.
4.2 Individual Sources
In the following subsections, we detail the spectroscopic and photometric analysis and properties for each source, and use this to justify their placement in the secure or tentative subsample.
4.2.1 WERLS_72964
WERLS_72964 is on mask wmmc06 with a SNR = 4.0 Lyman- emission line corresponding to = 7.8881, and is in our secure sample. It lies within the COSMOS CANDELS coverage, is not in the COSMOS2020 catalog, and lies outside of PRIMER-COSMOS. We fit the target’s CANDELS photometry (ID: 72964) and find a photometric redshift consistent with the spectroscopic solution within uncertainty, with . Further, the source is detected significantly in IRAC Channel 1 (3.6) and Channel 2 (4.5), with some photometric excess (0.33 mag) in Channel 2 where there should be contamination from [Oiii]+H nebular emission at both the spectroscopic and photometric redshift solutions. Co-author vetting resulted in a score of 3.4/4 (a maximum score of 4 reflects the scenario wherein all 22 co-authors voted the source as secure).
4.2.2 WERLS_69492 a.k.a EGS-zs8-2
WERLS_69492 is a known LAE, first reported as EGS-zs8-2 in Roberts-Borsani et al. (2016), who detect Lyman- at 4.7 with MOSFIRE and measure a redshift of = 7.4777; this observation is later supported by Stark et al. (2017), who report a 7.4 Lyman- detection for the target. It is in our secure sample and is our highest SNR Lyman- detection, with SNR = 7.7. The target is on mask wmme01 in the EGS field and is covered by CANDELS (ID: 69492) but does not fall in the CEERS JWST/NIRCam coverage. We fit the CANDELS photometry and find a photometric redshift of = , consistent within uncertainty with our Lyman--derived = 7.4763. The Bagpipes SED fit suggests excess from nebular emission, which is supported by the strong photometric excess in IRAC Channel 2 (4.5) of 1.19 mag (corroborated by Roberts-Borsani et al., 2016). Co-author vetting resulted in a score of 3.8/4.
The target was also observed by CEERS with JWST/NIRSpec (MSA ID: 698) with medium resolution in the G140M, G235M, and G395M filters. The CEERS reduction confirms the redshift of the source via multiple strong, rest-frame optical emission lines (including [Oiii]+H ), with = 7.4710 (Jung et al., 2023). We attribute the small between spectroscopic redshift solutions to the expected velocity offset between Lyman- and the systemic redshift. Here, Lyman- emission is redshifted from the rest-frame optical emission with a velocity offset of km s-1, consistent within uncertainty with the measured velocity offset in Jung et al. (2023) of km s.
4.2.3 WERLS_32350
WERLS_32350 is on mask wmme01 with a SNR = 5.6 Lyman- emission line corresponding to =7.5501 and is in our secure sample. It is selected from EGS CANDELS (ID: 32350) and is not within the CEERS JWST/NIRCam coverage. We fit the CANDELS photometry and find a photometric redshift of = , consistent within uncertainty with our Lyman--derived = 7.5501. The Bagpipes SED fit suggests excess from [Oiii]+H nebular emission, which is supported by the strong photometric excess in IRAC Channel 2 (4.5) of 0.91 mag. Co-author vetting resulted in a score of 3.0/4.
The target has multiple MOSFIRE -band observations, through this program and in Jung et al. (2022), who report a Lyman- detection at (ID: z8_32350), inconsistent with our Lyman- detection, which was likely not discovered in the Jung et al. (2022) automated line search as it partially overlaps with a sky line, and was excluded in their automated search. The target was observed by CEERS with JWST/NIRSpec (MSA ID: 689) with medium resolution in the G140M, G235M, and G395M filters. The CEERS reduction confirms the redshift of the source via multiple strong, rest-frame optical emission lines (including [Oiii]+H ), with (Jung et al., 2023). This is consistent with the WERLS Lyman--derived redshift, with a small between this spectroscopic redshift solutions to the expected offset between systemic and Lyman--derived redshifts. The measured velocity offset of Lyman- is km s-1, with Lyman- emission redshifted from rest-frame optical emission, consistent within uncertainty with the measured velocity offset in Jung et al. (2023) of km s.
4.2.4 WERLS_786362
WERLS_786362 is on mask wmmc05 and has a SNR = 4.8 Lyman- emission line corresponding to =7.6810. It lies within the COSMOS CANDELS coverage and within PRIMER-COSMOS. This source was imaged by both NIRCam and MIRI with PRIMER, and has a faint detection in MIRI/F770W. We fit the target’s JWST+HST photometry (CANDELS ID: 786362) and find a best-fit SED with =, consistent with the spectroscopic solution. Co-author vetting resulted in a score of 3.6/4.
The photometry for WERLS_786362 demonstrates a particularly blue slope at short wavelengths in addition to a red slope at long wavelengths (specifically, it is very blue in F115WF200W and red in F277WF444W), which could be indicative of a brown dwarf (e.g. Hainline et al., 2023; Burgasser et al., 2023; Langeroodi et al., 2023). Its compact morphology, akin to the “little red dots” discovered recently in JWST images, is consistent with both a high redshift galaxy or a brown dwarf. We fit the photometry to a generated Bagpipes galaxy model with a very blue component with boosted Lyman- and a red dusty component with boosted H , as well as a brown dwarf with T=1000 K and log from the Sonora models (Marley et al., 2021), and find that both models plausibly match the data. Given that our Bagpipes galaxy model is physically extreme, the photometric evidence suggests the brown dwarf case is more likely. However, the brown dwarf solution does not account for the strong emission line we detect with MOSFIRE, which supports the the high redshift galaxy case assuming the line is Lyman-. As we lack multi-line confirmation of the source and therefore are unable to distinguish between the brown dwarf and high redshift LAE cases, we place this source in our tentative sample.
4.2.5 WERLS_29712
WERLS_29712 has a candidate Lyman- line at SNR = 4.1 with = 7.1353. It is on mask wmmu01 in the UDS field. We fit the target’s UDS CANDELS (ID: 29712) and PRIMER-UDS photometry and find = , with a small peak in the photometric redshift PDF at , and 9% of the total PDF at . Co-author vetting resulted in a score of 2.9/4. This lower redshift solution is inconsistent with the spectroscopic solution; given this discrepancy along with the faint signal in the 2D spectrum, we place it in the tentative sample.
4.2.6 WERLS_6931
WERLS_6931 has a candidate Lyman- line with SNR = 6.0, corresponding to = 8.1993. It is on mask wmmu01 in the UDS field. We fit the target’s CANDELS (ID: 6931) and PRIMER-UDS photometry and find = , with a peak in the photometric redshift PDF at , and 24% of the total PDF at . Co-author vetting resulted in a score of 2.7/4. While the solution falls within the broader high redshift peak of the photometric redshift PDF, given that only 35% of the redshift PDF is at , we place it in the tentative sample.
4.2.7 WERLS_9030
WERLS_9030 is on mask wmmc02 and has a moderate Lyman- emission line candidate detection at SNR = 4.4 corresponding to = 7.6862. It lies within the COSMOS CANDELS and PRIMER-COSMOS coverage, and is not in the COSMOS2020 catalog. This source was imaged by both NIRCam and MIRI with PRIMER, and has a faint detection in MIRI/F770W. We fit the target’s CANDELS (ID: 9030) and PRIMER photometry and find a photometric redshift solution of = , consistent with the spectroscopic solution within errors, with a smaller peak in the photometric redshift PDF at , and 22% of the total PDF at . This lower redshift solution is inconsistent with the spectroscopic solution; fixing the SED to the returns a solution wherein the F814W flux is partially contaminated by Lyman- emission, which is consistent with its MOSFIRE spectrum. Co-author vetting resulted in a score of 2.8/4. As the Lyman- line is fairly faint in the 2D spectrum, we place it in the tentative sample.
4.2.8 WERLS_20710
WERLS_20710 is on mask wmmc02 and has a moderately detected (SNR = 5.2) Lyman- emission line candidate corresponding to = 7.5295. It lies within the COSMOS CANDELS coverage and within PRIMER-COSMOS. Co-author vetting resulted in a score of 2.7/4. We fit the target’s JWST+HST photometry (CANDELS ID: 20710) and find a photometric redshift of = , somewhat inconsistent with the spectroscopic solution; given this we place this source in our tentative sample.
4.2.9 WERLS_13312
WERLS_13312 is on mask wmmc02 and has a moderately detected (SNR = 5.4) Lyman- emission line candidate corresponding to = 8.1962. It lies within the COSMOS CANDELS coverage but not in PRIMER-COSMOS or COSMOS-Web, and is not in the COSMOS2020 catalog. We fit the target’s CANDELS photometry (ID: 13312) and find a best-fit SED with = , consistent with the spectroscopic solution. However, the SED appears poorly constrained as the target is undetected in -band and bluer, and is not detected in IRAC. Co-author vetting resulted in a score of 3.2/4. Though the line was highly ranked by co-authors, given its dearth of secure multi-band photometry and the absence of clear negative signal in the 2D spectrum, we place this source in our tentative sample.
4.2.10 WERLS_450980
WERLS_450980 is selected from the COSMOS2020 catalog, is on mask wmmc01, and is in our tentative sample. It has candidate Lyman- emission detected at SNR = 6.7, giving = 7.0925. There is a much fainter positive signal with SNR = 3.9 just blueward of the candidate emission line; this could indicate the signal is the [Oii] doublet rather than Lyman-. Assuming the brighter emission line candidate is [Oii] with rest frame wavelength , that would place the source at , and we would expect to find the rest-frame emission line blueward. Here, the fainter signal is nearly twice that separation, at from our candidate emission line. Therefore, we find the Lyman- line identification to be more likely. Using the COSMOS2020 photometry (ID: 450980), we find the photometric redshift to be well-matched to the spectroscopic solution, with = . Co-author vetting resulted in a score of 2.7/4. While the line appears real and the SED results are consistent with our Lyman--derived spectroscopic solution, we include the source in the tentative sample due to the uncertainty in our line identification.
4.2.11 WERLS_29881
WERLS_29881 is in our tentative sample and is our highest redshift LAE, detected at SNR = 4.6 with = 8.3868. It is on mask wmme01 in the EGS field, but lies outside of the CEERS coverage. We fit the target’s CANDELS photometry (ID: 29881) and find a best-fit SED with = , with a smaller peak in the photometric redshift PDF at , and 10% of the total PDF at . This is inconsistent with the spectroscopic solution; fixing the SED to the returns a solution wherein the HST/F814W flux is partially contaminated by Lyman- emission, which is consistent with its MOSFIRE spectrum. Further, while the source is undetected in IRAC Channel 1 (3.6), it is detected in IRAC Channel 2 (4.5), where there should be contamination from [Oiii]+H nebular emission at the spectroscopic redshift. Co-author vetting resulted in a score of 3.3/4. While co-authors ranked this detection highly, given the line detection is at the edge of the MOSFIRE wavelength coverage, it is statistically more likely to be noise, and we place it in the tentative sample.
4.3 JWST/NIRSpec Observations
Five of our primary targets in the EGS/CEERS field were observed with JWST/NIRSpec (Böker et al., 2023) as part of the CEERS program: WERLS_69492, WERLS_32350, WERLS_35089, WERLS_45153, and WERLS_40898. For two of these five sources (WERLS_69492 and WERLS_32350), the NIRSpec data secures the WERLS Lyman--derived redshift, anchored by strong nebular emission lines in the near-infrared, namely [Oiii] and H (see §4.2.2. and §4.2.3. for more details). For the other three sources, we did not identify Lyman- emission in the WERLS MOSFIRE data, explained for each source in more detail below.
MOSFIRE Primary target WERLS_40898 is on mask wmme03 in the EGS field and had no Lyman- detection in the WERLS MOSFIRE data. It was observed by CEERS with JWST/NIRSpec (MSA ID: 1027) with both PRISM mode and with medium resolution in the G140M, G235M, and G395M filters. As reported in Arrabal Haro et al. (2023), the CEERS reduction secures the redshift of the source via multiple strong, rest-frame optical emission lines (including [Oiii]+H ), with = 7.820 (see also Heintz et al., 2022; Sanders et al., 2023). The medium resolution spectrum also shows strong Lyman- emission at , and Tang et al. (2023) find a fairly large Lyman- velocity offset from the systemic redshift of km s-1. Based on the strength of the NIRSpec detection, we expect Lyman- to be detectable by WERLS for this source. However, the spectrum is contaminated by a sky line at the observed Lyman- wavelength. Additionally, mask wmme03 was less than half complete, with only 8 ABBA sequences taken (out of our goal of 20+ sequences or about 4 hours of total exposure time).
WERLS_35089 is a MOSFIRE Primary target on mask wmme01 in the EGS field and had no Lyman- detection in the WERLS MOSFIRE data, corroborated by the MOSFIRE -band non-detection in Jung et al. (2022). It was observed by CEERS with JWST/NIRSpec (MSA ID: 716) with PRISM mode only. The CEERS reduction shows a single bright emission line, which given photometric redshift priors can be identified securely as H , with = 6.959 (Arrabal Haro et al. in prep); the redshift is also consistent with [Oiii] falling in the detector gap for these observations. While there is no detectable Lyman- emission line in the spectrum, the Lyman- break is detected, which anchors the spectroscopic redshift solution.
WERLS Primary target WERLS_45143 is on mask wmme01 in the EGS field and had no Lyman- detection in the WERLS MOSFIRE data. It was observed by CEERS with JWST/NIRSpec (MSA ID: 717) with both PRISM mode and with medium resolution in the G140M, G235M, and G395M filters. The CEERS reduction secures the redshift of the source via multiple strong emission lines (including [Oiii]+H as well as H ), with = 6.934 (Arrabal Haro et al. in prep). The NIRSpec spectrum shows no Lyman- emission, but the Lyman- break is detected.
5 Discussion
The primary aims of the WERLS experiment in its entirety are to 1) conduct a census of Lyman- emission in known, luminous EoR galaxy candidates to map ionization bubbles in the IGM on scales larger than their expected size, 2) directly compare the Lyman--inferred location of ionized bubbles to underlying galaxy density maps to be measured via deep JWST/NIRCam imaging to directly constrain the environments of LAEs, related to the drivers of reionization, and 3) increase the number of spectroscopically-confirmed bright EoR sources to inform photometric redshift calibration of fainter EoR galaxies exclusively detected by JWST. This paper (in part) addresses the first and third aims, by reporting new Lyman- detections for bright galaxies at . Here, we discuss the efficacy of this census of Lyman-, and look ahead to future efforts to address the latter goals of the WERLS experiment.
5.1 Observed LAE Yield
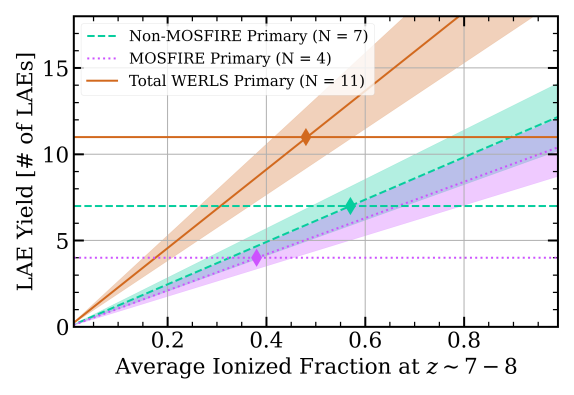
To estimate the expected LAE yield for our observations, we consider the photometric redshift PDFs for the entire subsample of WERLS Primary targets (), the portion of the spectra that are blocked by OH sky lines, and the expected neutral fraction at that would further reduce the number of observable LAEs. To compare these estimates to our observed sample of LAEs (), we separate out the MOSFIRE Primary targets (), which have photometric redshift solutions that peak strongly at where Lyman- is detectable in our data, and the other WERLS Primary (LRIS and MOSFIRE+LRIS) targets ( and , respectively), which have broader photometric redshift solutions within the EoR and/or are LRIS Primary targets at . For each subset and the total Primary target sample, we find the total photometric redshift cumulative distributions, and use this to quantify the number of targets that would fall in the Lyman- redshift range detectable for our observations. This quantity is then multiplied by the typical fraction of the spectrum that is contaminated by sky lines, , assuming an uncertainty of to account for variation both in the exact wavelength coverage of each spectrum and in the seeing (and therefore, width of the sky lines). Finally, we multiply this number by the fraction of the IGM that is ionized at our target epoch; given that our observations do not directly constrain the ionized fraction, we allow it to vary. Importantly, the Lyman- fraction as we consider here is not equal to the IGM neutral fraction, as the neutral fraction also depends on Lyman- velocity offsets and ionized bubble sizes. We do not attempt to constrain the neutral fraction here, and apply a varying average neutral fraction (which should broadly contain the variations due to velocity offsets and ionized bubbles) to serve as an upper limit for our LAE yield estimation.
Our expected LAE yield as a function of the average cosmic ionized fraction is shown in Figure 7. We detect Non-MOSFIRE Primary targets and MOSFIRE Primary targets, for a total of 11 LAEs. None of our 11 LAEs were LRIS Primary targets, but the subsample did contain MOSFIRE Primary and both MOSFIRE+LRIS Primary targets. Given this, we can estimate the yield simply by taking the number of detected LAEs () over the number of targeted candidates from the two primary categories (MOSFIRE, and MOSFIRE+LRIS, ), for a % yield of Lyman- emission observed from our EoR targets. This is broadly consistent with expectations for a Universe that is half-ionized at (see Figure 7), and demonstrates the relative success of WERLS at detecting Lyman- in UV-bright EoR galaxies.
5.2 Possible Ionized Bubble at
Observing Lyman- emission at is fairly unlikely as the IGM maintains a fairly high neutral fraction at these redshifts. EoR LAEs are thought to be more readily observable if they sit within ionized bubbles, wherein the emitted Lyman- is protected by an ionized region large enough for the Lyman- photons to scatter out of resonance with the neutral IGM and remain observable. Similar works reporting EoR Lyman- detections note potential overdensities near their targets (e.g. Jung et al., 2020; Endsley et al., 2021; Larson et al., 2022), and suggest these overdensities can support larger (and therefore, more easily detectable) ionized bubbles. The threshold radius for Lyman- observability has been approximated at physical Mpc (Dijkstra et al., 2014) before resonant scattering is sufficiently diminished as photons are cosmologically redshifted. The exact scale of this size depends on the Lyman- velocity offset from the systemic redshift, which would reduce this threshold to a smaller radius.
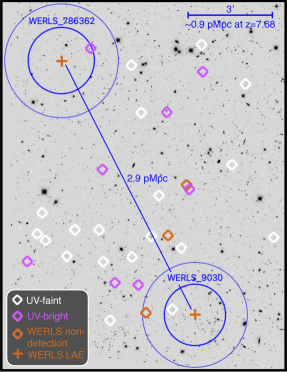
We identify one potential overdensity in the WERLS MOSFIRE sample, with two targets at in the COSMOS field: WERLS_786362 at and WERLS_9030 at . Given their proximity in redshift of , the pair has a very small line-of-sight separation of 0.2 pMpc, less than half the line-of-sight separations of the galaxy group in EGS77 (0.7 pMpc; Tilvi et al., 2020). However, the two galaxies are more distant in projection at a separation of 9.6 arcmin, corresponding to a transverse separation of 2.9 pMpc.
Following the methods in Endsley et al. (2021) and Larson et al. (2022), we estimate the expected ionized bubble radius that would be produced by each galaxy, assuming no Lyman- velocity offset as we lack systemic redshifts for these targets (effectively, this serves as an upper limit). From Cen & Haiman (2000) and Endsley et al. (2021), we calculate the ionized bubble radius produced by each galaxy as
| (1) |
Considering first the denominator, the proper volume density of neutral hydrogen () can be derived from cosmological parameters (see Equations 2 & 3 in Larson et al., 2022). We adopt Planck measurements of the helium mass fraction, Hubble constant, and baryon density (Planck Collaboration et al., 2016, 2020).
Each variable in the numerator represents the ionizing production, output, and transmission from the individual galaxy. The ionizing production is represented by , the duration of the current star formation episode; for our targets this is unconstrained, so we follow Larson et al. (2022) and take Myr, noting that a longer episode would increase the bubble radius. The transmission of ionizing photons is represented by the escape fraction (), which is unconstrained for our targets; we allow this parameter to vary from [0-1], and calculate bubble radius as a function of . Lastly, the ionizing photon output from the galaxy is represented by the intrinsic ionizing emissivity, .
We calculate from the product of the ionizing photons production efficiency () and the specific nonionizing UV luminosity (). Here, we assume , to be consistent with measurements of for both local analogs of EoR galaxies (Tang et al., 2021) and bright EoR sources (Stark, 2016), as well as model predictions from Finkelstein et al. (2019). Finally, can be estimated from the observed brightness of the galaxy (here, its apparent -band magnitude) and its redshift.
By applying Equation 1 individually to WERLS_786362 and WERLS_9030, we calculate an ionized bubble radius dependent on the escape fraction (see Figure 8). Taking as an example, we find pMpc for WERLS_786362 and pMpc for the slighlty fainter WERLS_9030. As a physically implausible upper bound, allowing all ionizing photons to escape () would produce a pMpc bubble for WERLS_786362 and pMpc for WERLS_9030. In the case, estimated bubble sizes are about smaller than the spherical region defined by the observed separation between the galaxies ( pMpc); even in the case, the sum of the individual bubble radii ( pMpc) is less than the galaxies’ separation. Therefore, we determine that the physical scenario wherein their individual ionized bubbles alone can easily overlap and create a common, larger ionized bubble is unlikely. Note that in the case where the intrinsic Lyman- emission is much stronger than the observed Lyman- line, emission would be observable through a smaller bubble with some significant Lyman- loss.
The galaxies’ separation is consistent with the expected sizes of ionized regions at (Furlanetto et al., 2017; D’Aloisio et al., 2018) as well as observations of large ionized regions (Endsley et al., 2021; Endsley & Stark, 2022), and the presence of a large ionized bubble could facilitate the escape of Lyman- photons. We consider the possibility that the two LAEs are both embedded in a larger ionized structure of pMpc. This scenario is possible if a local overdensity exists in the region, wherein the local ionizing photon budget is supported by emission from UV-bright galaxies (that may fall outside the WERLS MOSFIRE coverage), and/or fainter EoR galaxies (below the WERLS target criteria). In order to produce a larger ionized bubble encompassing both LAEs in our sample, taking a nominal escape fraction of , approximately four additional systems of similar ionizing power at similar redshifts would need to be located within a arcmin2 area. We search the COSMOS CANDELS catalog for galaxies at within a arcmin radius circle bounded by the two WERLS LAEs, and find 10 (30) candidates with (). Three of the 10 UV-bright sources were targeted with WERLS, and were not detected in Lyman-. Figure 8 shows the spatial distribution of the LAEs and potential nearby systems. Targeting the remaining candidates — including sources fainter than the WERLS criteria — to search for other nearby LAEs at offers an explicit hypothesis that can be tested with future MOSFIRE observations to determine if the LAEs reported here occupy a single, larger ionized bubble.
5.3 WERLS Synergy with JWST
While the aim of the WERLS Keck spectroscopy is to detect Lyman- from UV-bright EoR galaxies that likely trace high density peaks, the ultimate goal of the WERLS experiment is to use this census of Lyman- emission to then map the ionization state of the Universe and better constrain both the sources and process of reionization. This broader goal relies on planned and upcoming JWST/NIRCam deep imaging. COSMOS-Web, CEERS, and PRIMER will be able to construct detailed maps of the underlying mass in large scale structure on (5 Mpc)3 scales by detecting thousands of EoR galaxies at luminosities fainter than our UV-bright WERLS targets. By design, the majority of our targets sit within COSMOS-Web, as the survey is large enough to mitigate cosmic variance and to capture reionization on scales larger than its expected patchiness. The smaller but deeper CEERS and PRIMER surveys cover areas comparable to a single ionized bubble in the EoR, but include fainter sources and provide a finer sampling of ionized bubbles; the cosmological context of bubbles found in these deeper programs can then be informed by the larger statistical samples in COSMOS-Web.
This WERLS synergy between JWST imaging and Keck spectroscopy to pinpoint beacons of reionization via Lyman- detection and then map the underlying galaxy density can tell us which galaxies are primarily responsible for reionizing the Universe. Upon completion of both the NIRCam surveys and the full Keck WERLS program, we plan to make this measurement through careful cross-correlation of the two maps (in particular using a two-point correlation function). From these maps, we will test the hypothesis that either massive, intrinsically bright galaxies drove reionization in highly clustered regions or that more common low-mass galaxies drive a more homogeneous reionization process.
WERLS synergy with JWST is also powerful from an entirely spectroscopic context. By design, WERLS is a Lyman- detection experiment; indeed, given the neutral fraction of the IGM halfway through the EoR, we do not expect to detect Lyman- in most of our EoR targets. Given the lack of other emission lines near the target Lyman- emission line, there exists some uncertainty in spectroscopic confirmation, for both detections and non-detections. NIRSpec observations can provide, both for LAEs and non-LAEs, unambiguous spectroscopic confirmation via multiple rest-frame optical emission lines.
The five NIRSpec-derived redshifts for both LAEs and non-LAEs in WERLS allows broader exploration of the Lyman--detection experiment goal of WERLS. With MOSFIRE, we obtain deep, high resolution spectra () of Lyman- from our sources, which serves as a crucial step in the detection experiment. For example, while we detect Lyman- in our MOSFIRE observation of WERLS_32350, Jung et al. (2023) did not detect Lyman- from WERLS_32350 (referred to in their work as z8_32350) with their medium resolution NIRSpec G140M grating data, which they attribute to the faintness of its Lyman- emission, below the detection limit. The case of WERLS_40898 — a NIRSpec-confirmed LAE that was undetected in WERLS because of the presence of an atmospheric line at the expected wavelength of the line — demonstrates one challenge of ground-based near-infrared observing and serves as a reminder that care should be taken when interpreting results related to completeness and yield for this survey and others like it; we account for sky line contamination in our LAE yield estimation in §5.1. Additionally, we are able to securely confirm two WERLS targets (WERLS_35089 and WERLS_45153) as non-LAEs via their NIRSpec spectra. These cases demonstrate the synergy between the WERLS/Keck observations targeting Lyman- with deep, high resolution near-infrared spectra from the ground, and relatively inexpensive multi-line spectroscopic confirmation from JWST/NIRSpec; with these two instruments the WERLS Lyman- detection experiment can be robustly and efficiently conducted.
6 Summary
In this paper, we present the first results from the WERLS program, specifically Keck I/MOSFIRE -band spectroscopic observations for 114 known, UV-bright EoR candidates in COSMOS, EGS, and UDS. We summarize our results as follows.
-
1.
We spectroscopically identify 11 LAEs from , with 3 secure and 8 tentative LAEs spanning Lyman--derived spectroscopic redshifts of and absolute UV magnitudes of .
-
2.
We find an observed LAE yield of %, which is broadly consistent with expectations for a Universe that is half-ionized at , illustrating the success of WERLS at detecting Lyman- in UV-bright EoR galaxies.
-
3.
We identify one potential overdensity in the WERLS MOSFIRE sample, with two targets at in the COSMOS field that are separated by pMpc (9.6 arcmin). Based on their estimated individual ionized bubble radii, the two galaxies could occupy a common ionized bubble if nearby galaxies within a pMpc volume ( UV-bright galaxies for a nominal ) contribute to the local ionizing photon budget.
The first year of WERLS has demonstrated its efficacy at detecting LAEs near the midpoint of the EoR. Combined with large-scale mass density maps of the field derived from deep JWST/NIRCam imaging, future synergistic Keck+JWST efforts provide a powerful tool for pinpointing beacons of reionization and mapping the ionization state of the Universe, enabling robust tests regarding the primary drivers and the timeline of reionization.
Acknowledgements
The authors wish to recognize and acknowledge the very significant cultural role and reverence that the summit of Maunakea has always had within the indigenous Hawaiian community. We are most fortunate to have the opportunity to conduct observations from this mountain.
O.R.C, C.M.C., and others at UT Austin acknowledge that they work at an institution that sits on indigenous land. The Tonkawa lived in central Texas, and the Comanche and Apache moved through this area. We pay our respects to all the American Indian and Indigenous Peoples and communities who have been or have become a part of these lands and territories in Texas. We are grateful to be able to live, work, collaborate, and learn on this piece of Turtle Island.
We would like to thank the PypeIt team for help in the reduction and customization work for PypeIt/MOSFIRE, in particular Debora Pelliccia.
This work was supported by PID40/2022A_N078 (PIs C. Casey & J. Kartaltepe). Data presented herein were obtained at the W. M. Keck Observatory from telescope time allocated to the National Aeronautics and Space Administration through the agency’s scientific partnership with the California Institute of Technology and the University of California. The Observatory was made possible by the generous financial support of the W. M. Keck Foundation.
This material is based on work supported by the National Science Foundation Graduate Research Fellowship under grant number DGE 2137420.
This work is partly based on observations made with the NASA/ESA/CSA JWST. The data were obtained from the Mikulski Archive for Space Telescopes at the Space Telescope Science Institute, which is operated by the Association of Universities for Research in Astronomy, Inc., under NASA contract NAS 5-03127 for JWST. These observations are associated with programs JWST-ERS-01345 and JWST-GO-01837.
C.M.C. thanks the National Science Foundation for support through grants AST-1814034 and AST-2009577 as well as the University of Texas at Austin College of Natural Sciences for support; C.M.C. also acknowledges support from the Research Corporation for Science Advancement from a 2019 Cottrell Scholar Award sponsored by IF/THEN, an initiative of Lyda Hill Philanthropies.
J.S.K. thanks the National Science Foundation for support through grant AST-2009572. J.S.K. and B.N.V. thank NASA/ California Institute of Technology-JPL for support through grant 1668074. A.B. thanks the Emerson Summer Undergraduate Research Fellowship through the College of Science at the Rochester Institute of Technology.
The authors would like to thank our Keck Observatory Support Astronomers, Jim Lyke and Chien-Hsiu Lee, for their assistance during our observing runs. Special thanks to all of our Observing Assistants for their work driving the telescope during our observations: Matthew (Matt) Wahl, Marita (Rita) Morris, Tony Ridenour, Carolyn Jordan, and John Pelletier.
Keck:I (MOSFIRE)
Data Availability
References
- Arnouts et al. (1999) Arnouts, S., Cristiani, S., Moscardini, L., et al. 1999, Monthly Notices of the Royal Astronomical Society, 310, 540, doi: 10.1046/j.1365-8711.1999.02978.x
- Arnouts & Ilbert (2011) Arnouts, S., & Ilbert, O. 2011, Astrophysics Source Code Library, ascl:1108.009
- Arons & McCray (1970) Arons, J., & McCray, R. 1970, Astrophysical Letters, 5, 123
- Arrabal Haro et al. (2023) Arrabal Haro, P., Dickinson, M., Finkelstein, S. L., et al. 2023, The Astrophysical Journal, 951, L22, doi: 10.3847/2041-8213/acdd54
- Ashby et al. (2015) Ashby, M. L. N., Willner, S. P., Fazio, G. G., et al. 2015, The Astrophysical Journal Supplement Series, 218, 33, doi: 10.1088/0067-0049/218/2/33
- Astropy Collaboration et al. (2013) Astropy Collaboration, Robitaille, T. P., Tollerud, E. J., et al. 2013, Astronomy and Astrophysics, 558, A33, doi: 10.1051/0004-6361/201322068
- Astropy Collaboration et al. (2018) Astropy Collaboration, Price-Whelan, A. M., Sipőcz, B. M., et al. 2018, The Astronomical Journal, 156, 123, doi: 10.3847/1538-3881/aabc4f
- Astropy Collaboration et al. (2022) Astropy Collaboration, Price-Whelan, A. M., Lim, P. L., et al. 2022, The Astrophysical Journal, 935, 167, doi: 10.3847/1538-4357/ac7c74
- Becker et al. (2015) Becker, G. D., Bolton, J. S., Madau, P., et al. 2015, Monthly Notices of the Royal Astronomical Society, 447, 3402, doi: 10.1093/mnras/stu2646
- Bertin & Arnouts (1996) Bertin, E., & Arnouts, S. 1996, Astronomy and Astrophysics Supplement, v.117, p.393-404, 117, 393, doi: 10.1051/aas:1996164
- Böker et al. (2023) Böker, T., Beck, T. L., Birkmann, S. M., et al. 2023, Publications of the Astronomical Society of the Pacific, 135, 038001, doi: 10.1088/1538-3873/acb846
- Bolan et al. (2021) Bolan, P., Lemaux, B. C., Mason, C., et al. 2021, Inferring the IGM Neutral Fraction at z ~ 6-8 with Low-Luminosity Lyman Break Galaxies
- Boucaud et al. (2016) Boucaud, A., Bocchio, M., Abergel, A., et al. 2016, Astronomy & Astrophysics, 596, A63, doi: 10.1051/0004-6361/201629080
- Bouwens et al. (2022) Bouwens, R. J., Smit, R., Schouws, S., et al. 2022, The Astrophysical Journal, 931, 160, doi: 10.3847/1538-4357/ac5a4a
- Bradley et al. (2023) Bradley, L., Sipőcz, B., Robitaille, T., et al. 2023, Astropy/Photutils: 1.9.0, Zenodo, doi: 10.5281/zenodo.8248020
- Brammer (2023) Brammer, G. 2023, grizli, 1.8.2, Zenodo, Zenodo, doi: 10.5281/zenodo.7712834
- Brammer et al. (2008) Brammer, G. B., van Dokkum, P. G., & Coppi, P. 2008, The Astrophysical Journal, 686, 1503, doi: 10.1086/591786
- Bremer & Dayal (2023) Bremer, J., & Dayal, P. 2023, Monthly Notices of the Royal Astronomical Society, 524, 118, doi: 10.1093/mnras/stad1844
- Bunker et al. (2010) Bunker, A. J., Wilkins, S., Ellis, R. S., et al. 2010, Monthly Notices of the Royal Astronomical Society, 409, 855, doi: 10.1111/j.1365-2966.2010.17350.x
- Bunker et al. (2023) Bunker, A. J., Saxena, A., Cameron, A. J., et al. 2023, JADES NIRSpec Spectroscopy of GN-z11: Lyman-$\alpha$ Emission and Possible Enhanced Nitrogen Abundance in a $z=10.60$ Luminous Galaxy, doi: 10.48550/arXiv.2302.07256
- Burgasser et al. (2023) Burgasser, A. J., Gerasimov, R., Bezanson, R., et al. 2023, arXiv e-prints, arXiv:2308.12107, doi: 10.48550/arXiv.2308.12107
- Bushouse et al. (2022) Bushouse, H., Eisenhamer, J., Dencheva, N., et al. 2022, Zenodo, doi: 10.5281/zenodo.7325378
- Byler et al. (2017) Byler, N., Dalcanton, J. J., Conroy, C., & Johnson, B. D. 2017, The Astrophysical Journal, 840, 44, doi: 10.3847/1538-4357/aa6c66
- Calzetti (2001) Calzetti, D. 2001, Publications of the Astronomical Society of the Pacific, 113, 1449, doi: 10.1086/324269
- Cameron et al. (2023) Cameron, A. J., Saxena, A., Bunker, A. J., et al. 2023, JADES: Probing Interstellar Medium Conditions at $z\sim5.5-9.5$ with Ultra-Deep JWST/NIRSpec Spectroscopy, doi: 10.48550/arXiv.2302.04298
- Carnall et al. (2018) Carnall, A. C., McLure, R. J., Dunlop, J. S., & Davé, R. 2018, Monthly Notices of the Royal Astronomical Society, 480, 4379, doi: 10.1093/mnras/sty2169
- Casey et al. (2022) Casey, C. M., Kartaltepe, J. S., Drakos, N. E., et al. 2022, COSMOS-Web: An Overview of the JWST Cosmic Origins Survey, doi: 10.48550/arXiv.2211.07865
- Castellano et al. (2016) Castellano, M., Dayal, P., Pentericci, L., et al. 2016, The Astrophysical Journal, 818, L3, doi: 10.3847/2041-8205/818/1/L3
- Caswell et al. (2023) Caswell, T. A., de Andrade, E. S., Lee, A., et al. 2023, Matplotlib/Matplotlib: REL: V3.7.2, Zenodo, doi: 10.5281/zenodo.8118151
- Cen & Haiman (2000) Cen, R., & Haiman, Z. 2000, The Astrophysical Journal, 542, L75, doi: 10.1086/312937
- Chabrier (2003) Chabrier, G. 2003, Publications of the Astronomical Society of the Pacific, 115, 763, doi: 10.1086/376392
- Conroy et al. (2010) Conroy, C., White, M., & Gunn, J. E. 2010, The Astrophysical Journal, 708, 58, doi: 10.1088/0004-637X/708/1/58
- Curtis-Lake et al. (2023) Curtis-Lake, E., Carniani, S., Cameron, A., et al. 2023, Nature Astronomy, 7, 622, doi: 10.1038/s41550-023-01918-w
- D’Aloisio et al. (2018) D’Aloisio, A., McQuinn, M., Davies, F. B., & Furlanetto, S. R. 2018, Monthly Notices of the Royal Astronomical Society, 473, 560, doi: 10.1093/mnras/stx2341
- Dijkstra et al. (2014) Dijkstra, M., Wyithe, S., Haiman, Z., Mesinger, A., & Pentericci, L. 2014, Monthly Notices of the Royal Astronomical Society, 440, 3309, doi: 10.1093/mnras/stu531
- Endsley & Stark (2022) Endsley, R., & Stark, D. P. 2022, Monthly Notices of the Royal Astronomical Society, 511, 6042, doi: 10.1093/mnras/stac524
- Endsley et al. (2021) Endsley, R., Stark, D. P., Charlot, S., et al. 2021, Monthly Notices of the Royal Astronomical Society, 502, 6044, doi: 10.1093/mnras/stab432
- Euclid Collaboration et al. (2022) Euclid Collaboration, Moneti, A., McCracken, H. J., et al. 2022, Astronomy and Astrophysics, 658, A126, doi: 10.1051/0004-6361/202142361
- Faisst (2016) Faisst, A. L. 2016, The Astrophysical Journal, 829, 99, doi: 10.3847/0004-637X/829/2/99
- Faisst et al. (2014) Faisst, A. L., Capak, P., Carollo, C. M., Scarlata, C., & Scoville, N. 2014, The Astrophysical Journal, 788, 87, doi: 10.1088/0004-637X/788/1/87
- Ferland et al. (2017) Ferland, G. J., Chatzikos, M., Guzmán, F., et al. 2017, Revista Mexicana de Astronomia y Astrofisica, 53, 385, doi: 10.48550/arXiv.1705.10877
- Finkelstein (2016) Finkelstein, S. L. 2016, Publications of the Astronomical Society of Australia, 33, e037, doi: 10.1017/pasa.2016.26
- Finkelstein et al. (2010) Finkelstein, S. L., Papovich, C., Giavalisco, M., et al. 2010, The Astrophysical Journal, 719, 1250, doi: 10.1088/0004-637X/719/2/1250
- Finkelstein et al. (2012) Finkelstein, S. L., Papovich, C., Ryan, R. E., et al. 2012, The Astrophysical Journal, 758, 93, doi: 10.1088/0004-637X/758/2/93
- Finkelstein et al. (2013) Finkelstein, S. L., Papovich, C., Dickinson, M., et al. 2013, Nature, 502, 524, doi: 10.1038/nature12657
- Finkelstein et al. (2019) Finkelstein, S. L., D’Aloisio, A., Paardekooper, J.-P., et al. 2019, The Astrophysical Journal, 879, 36, doi: 10.3847/1538-4357/ab1ea8
- Finkelstein et al. (2022) Finkelstein, S. L., Bagley, M., Song, M., et al. 2022, The Astrophysical Journal, 928, 52, doi: 10.3847/1538-4357/ac3aed
- Flury et al. (2022) Flury, S. R., Jaskot, A. E., Ferguson, H. C., et al. 2022, The Astrophysical Journal Supplement Series, 260, 1, doi: 10.3847/1538-4365/ac5331
- Fujimoto et al. (2023) Fujimoto, S., Arrabal Haro, P., Dickinson, M., et al. 2023, The Astrophysical Journal, 949, L25, doi: 10.3847/2041-8213/acd2d9
- Furlanetto et al. (2017) Furlanetto, S. R., Mirocha, J., Mebane, R. H., & Sun, G. 2017, Monthly Notices of the Royal Astronomical Society, 472, 1576, doi: 10.1093/mnras/stx2132
- Gaia Collaboration et al. (2023) Gaia Collaboration, Vallenari, A., Brown, A. G. A., et al. 2023, Astronomy and Astrophysics, 674, A1, doi: 10.1051/0004-6361/202243940
- Grogin et al. (2011) Grogin, N. A., Kocevski, D. D., Faber, S. M., et al. 2011, The Astrophysical Journal Supplement Series, 197, 35, doi: 10.1088/0067-0049/197/2/35
- Hainline et al. (2023) Hainline, K. N., Helton, J. M., Johnson, B. D., et al. 2023, Brown Dwarf Candidates in the JADES and CEERS Extragalactic Surveys, doi: 10.48550/arXiv.2309.03250
- Harris et al. (2020) Harris, C. R., Millman, K. J., van der Walt, S. J., et al. 2020, Nature, 585, 357, doi: 10.1038/s41586-020-2649-2
- Hashimoto et al. (2018) Hashimoto, T., Laporte, N., Mawatari, K., et al. 2018, Nature, 557, 392, doi: 10.1038/s41586-018-0117-z
- Heintz et al. (2022) Heintz, K. E., Brammer, G. B., Giménez-Arteaga, C., et al. 2022, Dilution of Chemical Enrichment in Galaxies 600 Myr after the Big Bang, doi: 10.48550/arXiv.2212.02890
- Hoag et al. (2017) Hoag, A., Bradač, M., Trenti, M., et al. 2017, Nature Astronomy, 1, 0091, doi: 10.1038/s41550-017-0091
- Hoag et al. (2018) Hoag, A., Bradač, M., Brammer, G., et al. 2018, The Astrophysical Journal, 854, 39, doi: 10.3847/1538-4357/aaa9c2
- Hoag et al. (2019) Hoag, A., Bradač, M., Huang, K., et al. 2019, The Astrophysical Journal, 878, 12, doi: 10.3847/1538-4357/ab1de7
- Horne (1986) Horne, K. 1986, Publications of the Astronomical Society of the Pacific, 98, 609, doi: 10.1086/131801
- Hu et al. (2019) Hu, W., Wang, J., Zheng, Z.-Y., et al. 2019, The Astrophysical Journal, 886, 90, doi: 10.3847/1538-4357/ab4cf4
- Hutchison et al. (2020) Hutchison, T. A., Walawender, J., & Kwok, S. H. 2020, 11447, 114476A, doi: 10.1117/12.2562864
- Ilbert et al. (2006) Ilbert, O., Arnouts, S., McCracken, H. J., et al. 2006, Astronomy and Astrophysics, Volume 457, Issue 3, October III 2006, pp.841-856, 457, 841, doi: 10.1051/0004-6361:20065138
- Inoue et al. (2016) Inoue, A. K., Tamura, Y., Matsuo, H., et al. 2016, Science, 352, 1559, doi: 10.1126/science.aaf0714
- Izotov et al. (2016) Izotov, Y. I., Schaerer, D., Thuan, T. X., et al. 2016, Monthly Notices of the Royal Astronomical Society, 461, 3683, doi: 10.1093/mnras/stw1205
- Izotov et al. (2018) Izotov, Y. I., Schaerer, D., Worseck, G., et al. 2018, Monthly Notices of the Royal Astronomical Society, 474, 4514, doi: 10.1093/mnras/stx3115
- Jung et al. (2019) Jung, I., Finkelstein, S. L., Dickinson, M., et al. 2019, The Astrophysical Journal, 877, 146, doi: 10.3847/1538-4357/ab1bde
- Jung et al. (2020) —. 2020, The Astrophysical Journal, 904, 144, doi: 10.3847/1538-4357/abbd44
- Jung et al. (2022) Jung, I., Finkelstein, S. L., Larson, R. L., et al. 2022, New $z 7$ Lyman-alpha Emitters in EGS: Evidence of an Extended Ionized Structure at $z \sim 7.7$, doi: 10.48550/arXiv.2212.09850
- Jung et al. (2023) Jung, I., Finkelstein, S. L., Arrabal Haro, P., et al. 2023, CEERS: Diversity of Lyman-Alpha Emitters during the Epoch of Reionization, doi: 10.48550/arXiv.2304.05385
- Kakiichi et al. (2016) Kakiichi, K., Dijkstra, M., Ciardi, B., & Graziani, L. 2016, Monthly Notices of the Royal Astronomical Society, 463, 4019, doi: 10.1093/mnras/stw2193
- Kannan et al. (2022) Kannan, R., Garaldi, E., Smith, A., et al. 2022, Monthly Notices of the Royal Astronomical Society, 511, 4005, doi: 10.1093/mnras/stab3710
- Kluyver et al. (2016) Kluyver, T., Ragan-Kelley, B., Pérez, F., et al. 2016, Jupyter Notebooks—a Publishing Format for Reproducible Computational Workflows, 87–90, doi: 10.3233/978-1-61499-649-1-87
- Koekemoer et al. (2011) Koekemoer, A. M., Faber, S. M., Ferguson, H. C., et al. 2011, The Astrophysical Journal Supplement Series, 197, 36, doi: 10.1088/0067-0049/197/2/36
- Kriek et al. (2015) Kriek, M., Shapley, A. E., Reddy, N. A., et al. 2015, The Astrophysical Journal Supplement Series, 218, 15, doi: 10.1088/0067-0049/218/2/15
- Laigle et al. (2016) Laigle, C., McCracken, H. J., Ilbert, O., et al. 2016, The Astrophysical Journal Supplement Series, 224, 24, doi: 10.3847/0067-0049/224/2/24
- Langeroodi et al. (2023) Langeroodi, D., Hjorth, J., & Zhang, Z. 2023, Little Red Dots or Brown Dwarfs? NIRSpec Discovery of Three Brown Dwarfs Masquerading as NIRCam-Selected Highly-Reddened AGNs, doi: 10.48550/arXiv.2308.10900
- Larson et al. (2022) Larson, R. L., Finkelstein, S. L., Hutchison, T. A., et al. 2022, The Astrophysical Journal, 930, 104, doi: 10.3847/1538-4357/ac5dbd
- Leja et al. (2019) Leja, J., Carnall, A. C., Johnson, B. D., Conroy, C., & Speagle, J. S. 2019, ApJ, 876, 3, doi: 10.3847/1538-4357/ab133c
- Lilly et al. (2009) Lilly, S. J., Le Brun, V., Maier, C., et al. 2009, The Astrophysical Journal Supplement Series, 184, 218, doi: 10.1088/0067-0049/184/2/218
- Magee et al. (2023) Magee, J., Casey, C. M., Cooper, O. R., et al. 2023, Research Notes of the AAS, 7, 110, doi: 10.3847/2515-5172/acd9a5
- Marley et al. (2021) Marley, M. S., Saumon, D., Visscher, C., et al. 2021, ApJ, 920, 85, doi: 10.3847/1538-4357/ac141d
- Marques-Chaves et al. (2021) Marques-Chaves, R., Schaerer, D., Álvarez-Márquez, J., et al. 2021, Monthly Notices of the Royal Astronomical Society, 507, 524, doi: 10.1093/mnras/stab2187
- Mason et al. (2015) Mason, C. A., Trenti, M., & Treu, T. 2015, The Astrophysical Journal, 813, 21, doi: 10.1088/0004-637X/813/1/21
- Mason et al. (2019) Mason, C. A., Fontana, A., Treu, T., et al. 2019, Monthly Notices of the Royal Astronomical Society, 485, 3947, doi: 10.1093/mnras/stz632
- McCracken et al. (2012) McCracken, H. J., Milvang-Jensen, B., Dunlop, J., et al. 2012, Astronomy & Astrophysics, Volume 544, id.A156, NUMPAGES11/NUMPAGES pp., 544, A156, doi: 10.1051/0004-6361/201219507
- McElwain et al. (2023) McElwain, M. W., Feinberg, L. D., Perrin, M. D., et al. 2023, Publications of the Astronomical Society of the Pacific, 135, 058001, doi: 10.1088/1538-3873/acada0
- McLean et al. (2012) McLean, I. S., Steidel, C. C., Epps, H. W., et al. 2012, 8446, 84460J, doi: 10.1117/12.924794
- McLure et al. (2010) McLure, R. J., Dunlop, J. S., Cirasuolo, M., et al. 2010, Monthly Notices of the Royal Astronomical Society, 403, 960, doi: 10.1111/j.1365-2966.2009.16176.x
- Menzel et al. (2023) Menzel, M., Davis, M., Parrish, K., et al. 2023, Publications of the Astronomical Society of the Pacific, 135, 058002, doi: 10.1088/1538-3873/acbb9f
- Naidu et al. (2020) Naidu, R. P., Tacchella, S., Mason, C. A., et al. 2020, The Astrophysical Journal, 892, 109, doi: 10.3847/1538-4357/ab7cc9
- Oesch et al. (2012) Oesch, P. A., Bouwens, R. J., Illingworth, G. D., et al. 2012, The Astrophysical Journal, 759, 135, doi: 10.1088/0004-637X/759/2/135
- Oesch et al. (2015) Oesch, P. A., van Dokkum, P. G., Illingworth, G. D., et al. 2015, The Astrophysical Journal, 804, L30, doi: 10.1088/2041-8205/804/2/L30
- Oesch et al. (2023) Oesch, P. A., Brammer, G., Naidu, R. P., et al. 2023, The JWST FRESCO Survey: Legacy NIRCam/Grism Spectroscopy and Imaging in the Two GOODS Fields, doi: 10.48550/arXiv.2304.02026
- Oke & Gunn (1983) Oke, J. B., & Gunn, J. E. 1983, The Astrophysical Journal, 266, 713, doi: 10.1086/160817
- Oke et al. (1995) Oke, J. B., Cohen, J. G., Carr, M., et al. 1995, Publications of the Astronomical Society of the Pacific, 107, 375, doi: 10.1086/133562
- Ono et al. (2012) Ono, Y., Ouchi, M., Mobasher, B., et al. 2012, The Astrophysical Journal, 744, 83, doi: 10.1088/0004-637X/744/2/83
- Ouchi et al. (2020) Ouchi, M., Ono, Y., & Shibuya, T. 2020, Annual Review of Astronomy and Astrophysics, vol. 58, p.617-659, 58, 617, doi: 10.1146/annurev-astro-032620-021859
- Paardekooper et al. (2015) Paardekooper, J.-P., Khochfar, S., & Dalla Vecchia, C. 2015, Monthly Notices of the Royal Astronomical Society, 451, 2544, doi: 10.1093/mnras/stv1114
- Pentericci et al. (2018) Pentericci, L., Vanzella, E., Castellano, M., et al. 2018, Astronomy & Astrophysics, Volume 619, id.A147, NUMPAGES16/NUMPAGES pp., 619, A147, doi: 10.1051/0004-6361/201732465
- Planck Collaboration et al. (2016) Planck Collaboration, Ade, P. a. R., Aghanim, N., et al. 2016, Astronomy & Astrophysics, Volume 594, id.A13, NUMPAGES63/NUMPAGES pp., 594, A13, doi: 10.1051/0004-6361/201525830
- Planck Collaboration et al. (2020) Planck Collaboration, Aghanim, N., Akrami, Y., et al. 2020, Astronomy & Astrophysics, Volume 641, id.A6, NUMPAGES67/NUMPAGES pp., 641, A6, doi: 10.1051/0004-6361/201833910
- Prochaska et al. (2020) Prochaska, J. X., Hennawi, J., Cooke, R., et al. 2020, Zenodo, doi: 10.5281/zenodo.3743493
- Rieke et al. (2023) Rieke, M. J., Kelly, D. M., Misselt, K., et al. 2023, Publications of the Astronomical Society of the Pacific, 135, 028001, doi: 10.1088/1538-3873/acac53
- Rigby et al. (2023) Rigby, J., Perrin, M., McElwain, M., et al. 2023, Publications of the Astronomical Society of the Pacific, 135, 048001, doi: 10.1088/1538-3873/acb293
- Roberts-Borsani et al. (2022) Roberts-Borsani, G., Treu, T., Mason, C., et al. 2022, Nature and Nurture? Comparing Ly$\alpha$ Detections in UV Bright and Fainter [O III]+H$\beta$ Emitters at $z\sim8$ With Keck/MOSFIRE
- Roberts-Borsani et al. (2016) Roberts-Borsani, G. W., Bouwens, R. J., Oesch, P. A., et al. 2016, The Astrophysical Journal, 823, 143, doi: 10.3847/0004-637X/823/2/143
- Robertson et al. (2013) Robertson, B. E., Furlanetto, S. R., Schneider, E., et al. 2013, The Astrophysical Journal, 768, 71, doi: 10.1088/0004-637X/768/1/71
- Rockosi et al. (2010) Rockosi, C., Stover, R., Kibrick, R., et al. 2010, 7735, 77350R, doi: 10.1117/12.856818
- Saha et al. (2020) Saha, K., Tandon, S. N., Simmonds, C., et al. 2020, Nature Astronomy, 4, 1185, doi: 10.1038/s41550-020-1173-5
- Sanders et al. (2023) Sanders, R. L., Shapley, A. E., Topping, M. W., Reddy, N. A., & Brammer, G. B. 2023, Direct T_e-Based Metallicities of Z=2-9 Galaxies with JWST/NIRSpec: Empirical Metallicity Calibrations Applicable from Reionization to Cosmic Noon, doi: 10.48550/arXiv.2303.08149
- Schouws et al. (2022) Schouws, S., Stefanon, M., Bouwens, R., et al. 2022, The Astrophysical Journal, 928, 31, doi: 10.3847/1538-4357/ac4605
- Shibuya et al. (2012) Shibuya, T., Kashikawa, N., Ota, K., et al. 2012, The Astrophysical Journal, 752, 114, doi: 10.1088/0004-637X/752/2/114
- Smit et al. (2015) Smit, R., Bouwens, R. J., Franx, M., et al. 2015, The Astrophysical Journal, 801, 122, doi: 10.1088/0004-637X/801/2/122
- Smit et al. (2018) Smit, R., Bouwens, R. J., Carniani, S., et al. 2018, Nature, 553, 178, doi: 10.1038/nature24631
- Song et al. (2016) Song, M., Finkelstein, S. L., Livermore, R. C., et al. 2016, The Astrophysical Journal, 826, 113, doi: 10.3847/0004-637X/826/2/113
- Stark (2016) Stark, D. P. 2016, Annual Review of Astronomy and Astrophysics, vol. 54, p.761-803, 54, 761, doi: 10.1146/annurev-astro-081915-023417
- Stark et al. (2017) Stark, D. P., Ellis, R. S., Charlot, S., et al. 2017, Monthly Notices of the Royal Astronomical Society, 464, 469, doi: 10.1093/mnras/stw2233
- Tacchella et al. (2022) Tacchella, S., Finkelstein, S. L., Bagley, M., et al. 2022, ApJ, 927, 170, doi: 10.3847/1538-4357/ac4cad
- Tang et al. (2021) Tang, M., Stark, D. P., Chevallard, J., et al. 2021, Monthly Notices of the Royal Astronomical Society, 503, 4105, doi: 10.1093/mnras/stab705
- Tang et al. (2023) Tang, M., Stark, D. P., Chen, Z., et al. 2023, JWST/NIRSpec Spectroscopy of $z=7-9$ Star Forming Galaxies with CEERS: New Insight into Bright Ly$\alpha$ Emitters in Ionized Bubbles, doi: 10.48550/arXiv.2301.07072
- Tilvi et al. (2020) Tilvi, V., Malhotra, S., Rhoads, J. E., et al. 2020, The Astrophysical Journal, 891, L10, doi: 10.3847/2041-8213/ab75ec
- Treu et al. (2013) Treu, T., Schmidt, K. B., Trenti, M., Bradley, L. D., & Stiavelli, M. 2013, The Astrophysical Journal, 775, L29, doi: 10.1088/2041-8205/775/1/L29
- Virtanen et al. (2020) Virtanen, P., Gommers, R., Oliphant, T. E., et al. 2020, Nature Methods, 17, 261, doi: 10.1038/s41592-019-0686-2
- Weaver et al. (2019) Weaver, J., Toft, S., Davidzon, I., Capak, P., & McCracken, H. 2019, The Farmer: Improved Model-Based Photometry for the next Generation of Galaxy Surveys, 9, doi: 10.5281/zenodo.3554205
- Weaver et al. (2022) Weaver, J. R., Kauffmann, O. B., Ilbert, O., et al. 2022, The Astrophysical Journal Supplement Series, 258, 11, doi: 10.3847/1538-4365/ac3078
- Whitler et al. (2023) Whitler, L., Stark, D. P., Endsley, R., et al. 2023, Insight from JWST/NIRCam into Galaxy Overdensities around Bright Ly$\alpha$ Emitters during Reionization: Implications for Ionized Bubbles at $z \sim 9$, doi: 10.48550/arXiv.2305.16670
- Yan et al. (2012) Yan, H., Finkelstein, S. L., Huang, K.-H., et al. 2012, The Astrophysical Journal, 761, 177, doi: 10.1088/0004-637X/761/2/177
- Zheng et al. (2011) Zheng, Z., Cen, R., Weinberg, D., Trac, H., & Miralda-Escudé, J. 2011, The Astrophysical Journal, 739, 62, doi: 10.1088/0004-637X/739/2/62
- Zitrin et al. (2015) Zitrin, A., Ellis, R. S., Belli, S., & Stark, D. P. 2015, The Astrophysical Journal, 805, L7, doi: 10.1088/2041-8205/805/1/L7
Appendix A Spectroscopic Catalog
Here we provide the full target list, any emission line detections, and any new spectroscopic redshift measurements for the Keck/MOSFIRE observations presented in this paper. Spectroscopic confirmation of EoR LAEs (our primary targets) are discussed in Section §4.2 of the main text; here, we also include the majority of our spectroscopic confirmations, which were lower-redshift filler targets.
Filler targets are selected at specific redshifts with emission lines accessible with MOSFIRE -band; H -emitters at , [Oii]-emitters at , and Ciii]-emitters at . Stars (for alignment and for flux calibration) were also placed on each mask; these are taken from Gaia DR3 and registered to the same reference astrometry as our source catalogs. Any serendipitously observed sources (with naming convention SERENDIP-X with X being an arbitrary number) are also included in the catalog. Positions of the serendipitous detections are carefully reconstructed using deep imaging and relative offset of other sources on the mask, accurate to arcsec. Table 3 shows the first few lines of the data table with the source ID, slitmask, and position of all observed targets, which includes primary targets, filler targets, stars, and serendipitous sources. The full target list is provided in machine-readable form online.
| ID | Mask | RA | Dec |
|---|---|---|---|
| M_WP551495 | wmmc01 | 150.19379 | 2.17021 |
| B_WP450980 | wmmc01 | 150.18992 | 2.16204 |
| star_75 | wmmc01 | 150.19183 | 2.18124 |
| L_WP693466 | wmmc01 | 150.18879 | 2.18037 |
| SERENDIP-1 | wmmc01 | 150.18644 | 2.18126 |
| c2020_pz_0.664_22.8_826089 | wmmc01 | 150.18738 | 2.19157 |
| L_WP930991 | wmmc01 | 150.18792 | 2.20266 |
| c2020_pz_1.65_22.6_640174 | wmmc01 | 150.17921 | 2.17518 |
| c2020_pz_4.25_27.1_702146 | wmmc01 | 150.17733 | 2.18104 |
| … | … | … | … |
Note. — Table 3 is published in its entirety in machine-readable format. A portion is shown here for guidance regarding its form and content.
A total of 330 targets were observed, with 114 primary targets, 15 stars, 35 serendipitous sources, and 166 filler targets. The spectroscopic yield for filler targets is %, including all 56 spectroscopic redshift identifications, whether tentative (39/56) or secure (17/56). We note observed line wavelengths for serendipitous sources, but in all cases except when multiple lines enabled line species identification (e.g. Magee et al., 2023), we do not list line or redshift identifications given their lack of photometric redshift priors in the WERLS target catalog.
Importantly, quality flags indicating confidence class of spectroscopic confirmation are also included in the table. We follow the convention in the zCOSMOS catalog as described in Lilly et al. (2009), wherein 0 = no redshift measurement attempted, 1 = an insecure redshift, 2 = a likely redshift about which there is some doubt, 3 = a very secure redshift, 4 = a very secure redshift with an exhibition-quality spectrum, 9 = a securely detected single line with prior information that enables redshift identification. We add to this convention scheme the confidence class -1 to indicate continuum detection without line detection, which was only relevant for the stars and for a handful of serendipitous sources. All primary targets in the paper are classified with confidence class of 2 for tentative LAEs or 9 for secure LAEs; these are also indicated in the Notes column by “tentative_in_paper” or “secure_in_paper”, respectively. Candidate LAEs that were included in the early vetting process (as described in Section §3.2) but ultimately excluded from this paper are classified with quality flags of 1, and noted by “early_vetting” in the notes. For fillers, only sources with confidence classes of 3 or 4 should be considered secure redshifts, as these are the only multi-line detections. Measurements for all other filler targets should be considered tentative. The first few lines of the spectroscopic data table are shown in Table 4, with the full table provided in machine-readable form online.
| ID | Redshift | Line Species | Confidence Classaafootnotemark: | Notes | |
|---|---|---|---|---|---|
| M_WP551495 | – | – | – | 0 | |
| B_WP450980 | 7.0925 | 9837 | Ly | 2 | tentative_in_paper |
| star_75 | – | – | – | -1 | |
| L_WP693466 | – | – | – | 0 | |
| SERENDIP-1 | – | 10945 | – | 0 | |
| c2020_pz_0.664_22.8_826089 | 0.667 | 10936 | H | 4 | |
| L_WP930991 | – | – | – | 0 | |
| c2020_pz_1.65_22.6_640174 | 1.641 | 9848 | [Oii] | 4 | |
| c2020_pz_4.25_27.1_702146 | – | – | – | 0 | |
| … | … | … | … | … | … |
Note. — Table 4 is published in its entirety in machine-readable format. A portion is shown here for guidance regarding its form and content.