Ethnicity and Biometric Uniqueness: Iris Pattern Individuality in a West African Database
Abstract
We conducted more than 1.3 million comparisons of iris patterns encoded from images collected at two Nigerian universities, which constitute the newly available African Human Iris (AFHIRIS) database. The purpose was to discover whether ethnic differences in iris structure and appearance such as the textural feature size, as contrasted with an all-Chinese image database or an American database in which only 1.53% were of African-American heritage, made a material difference for iris discrimination. We measured a reduction in entropy for the AFHIRIS database due to the coarser iris features created by the thick anterior layer of melanocytes, and we found stochastic parameters that accurately model the relevant empirical distributions. Quantile-Quantile analysis revealed that a very small change in operational decision thresholds for the African database would compensate for the reduced entropy and generate the same performance in terms of resistance to False Matches. We conclude that despite demographic difference, individuality can be robustly discerned by comparison of iris patterns in this West African population.
Index Terms:
Ethnicity, demographic differentials, African, biometric entropy, iris recognition, Equity Measure.I Introduction
Aquestion of increasing salience today for deployment of biometric identification technologies relates to ethnicity; specifically, whether False Match probabilities are worse for some ethnic groups than for others. This has become a particularly notorious problem for face recognition algorithms, with several reports [1] [2] [3] that persons of African descent are much more likely than others to be mis-identified, or even to be mis-classified by image classification systems as gorillas [4]. A more subtle problem is bias among system designers, or data bias creating limited representation in the image training datasets, particularly given the dominance today of machine learning approaches. If a training set is unrepresentative of some ethnic groups (or indeed of gender, age, etc), then performance is demonstrably worse for the poorly represented groups [5]. This problem is compounded by the “black box” nature of deep machine learning methods: it is difficult to know, or even to try to discover, what such algorithms have actually extracted from their training datasets.
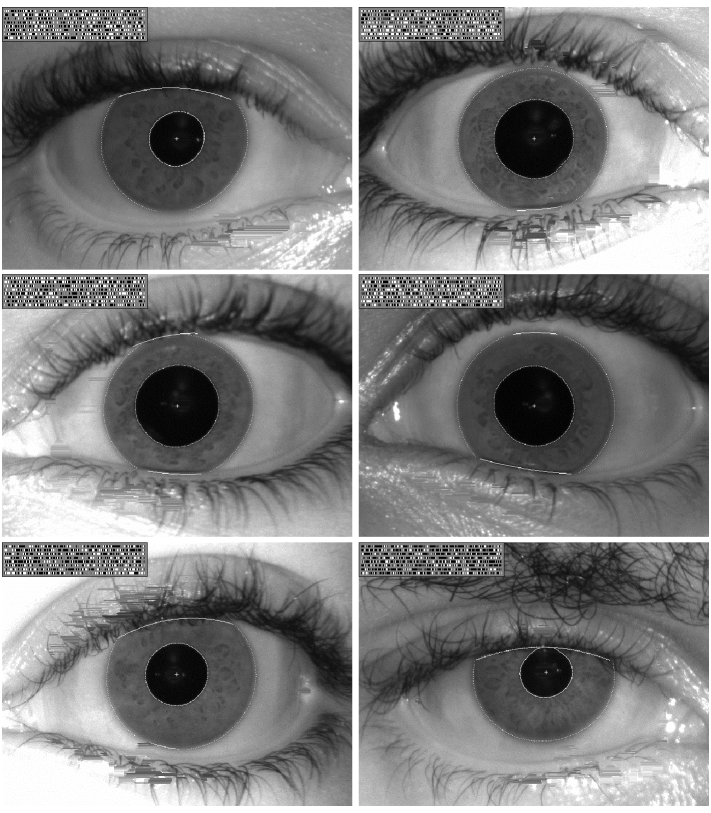
These problems clearly raise public policy issues, and can generate scepticism, suspicion, or even resistance against biometric deployments. There are also purely technical questions related to ethnicity in biometrics, because some traits vary in visibility among different ethnic groups, with possible effects on identifiability. An obvious challenge for iris recognition, for example, is that persons of East Asian heritage frequently have much eyelid occlusion, which may leave less than 50% of the iris visible. Likewise, persons of sub-Saharan African or of Malaysian heritage usually have dense melanin pigmentation, which limits the visibility of iris texture in visible wavelengths. Most iris cameras use near-infrared illumination wavelengths (NIR: 700 – 900nm) in which melanin is almost completely non-absorbing, and therefore less problematic. Nonetheless the anterior layer of the iris in persons of such descents contains a thick blanket of chromatophore cells (superficial melanocytes) [6] that create a coarser texture of crypts and craters as seen in Fig. 1, almost lunar in appearance, rather than the fine fibrous details more typically visible in the iris of persons having (say) “blue eyes” which lack such a thick anterior layer.
There are core mathematical and scientific issues associated with ethnic differences in the traits encoded by biometric technologies. The random variation that is the basis of all biometric discriminability among persons may vary in its complexity or dimensionality across different ethnic groups. It is even conceivable that within some unstudied demographic group, all persons might have identical or very similar iris patterns. Face recognition is bedevilled by genetic determinism of facial appearance at a given age, causing current algorithms to fail utterly to distinguish between monozygotic (MZ) twins, and even between most dizygotic twins [7]. More than 2,000 genes are expressed in the iris [8], and it is well-known that a person’s biogeographic ancestry is correlated with iris colour and general textural appearance [9]. It is possible that strong genetic coherence in some ethnic or social groups which mainly inbreed (e.g. Quilombo; Amish; Haredi) [10] [11] might limit variation among their iris patterns. Although iris pattern detail seems to be epigenetic, as evidenced by the observation that even genetically identical eyes such as those of MZ twins or the two possessed by one person are mathematically uncorrelated in their detailed iris texture [12] [13], iris individuality has not been widely investigated within different demographic groups.
Tools for the quantitative analysis of random variation among patterns, and for comparison of their relative complexity (specifically entropy) of random variation, are provided by Information Theory [14] [15]. The purpose of this paper is to apply such tools to a newly available database of iris images acquired from persons of African descent (Nigerian university students), a demographic group previously unstudied in such biometric research. Our principal question is whether the entropy among their iris patterns differs significantly from that of other demographic datasets in which persons of African descent are absent, such as the Chinese iris image datasets collected by the Chinese Academy of Sciences’ Institute of Automation (CASIA) [16] [17], or the large University of Notre Dame database [18] [19] of iris images in which the ethnic identity of all subjects are tagged but only 1.53% are tagged as of “black or African-American” descent. We hope that this paper contributes to understanding whether, and to what extent, ethnicity affects the ability of iris recognition to discriminate individuals or allows False Matches instead.
II Databases and Methods
The African Human Iris (AFHIRIS) database [20] is the first of its kind, and it was made freely available in 2022. It was collected from 1,028 student and staff volunteers (58% male, 42% female) at Ladoke Akintola University of Technology, Oyo State, Nigeria, and at Landmark University in Omu-Aran, Kwara State, Nigeria. About half of the subjects were aged under 21 years, with the remainder aged 21 - 45 years. They originated from 34 of the 36 States in Nigeria.
Images were captured using a Corvus VistaEY2H handheld dual iris camera. In half of these the subject was wearing spectacles, but because of the camera’s frontal illumination system, very few of these were useable since the iris was heavily obscured by specular reflections from the eyeglasses. Among the other half of the images, acquired without spectacles, 20% were in very poor focus and were discarded. Additionally, eleven persons had been enrolled under multiple identities by the student enrollers. After confirmation, those images were also discarded as ground-truth errors. There remained a total of 1,648 images (each one of a different eye) deemed to be of sufficient quality for this study. Samples illustrating the best image quality are provided in Fig. 1. Images were automatically processed and enrolled into a database of IrisCodes using the classical methods that have been described previously [21] [22] [23] and which are used worldwide in all publicly deployed systems for iris recognition. “All-against-all” cross-comparisons were then performed on all possible pairings among these 1,648 images, making a total of 1,357,128 unique pairings, whose Hamming distances [22] were tabulated and plotted as a histogram in the usual manner. Included among them were comparisons between the right and left eyes of individual persons, but these amounted to only 0.06% (i.e. 824 / 1,357,128) of all the IrisCode pairings. One photograph, binocular and without spectacles, was taken for each person so it is not possible to measure any same-eye Hamming distances.
We also used a Notre Dame database [18] [19] (29,986 images of 1,352 different eyes) and a CASIA database [16] [17] (3,183 images of 400 different Chinese eyes) to contrast biometric entropies, hence discriminability among different persons, compared with AFHIRIS. Those image databases were also without spectacles. Their gender and age distributions were similar to AFHIRIS, being comprised mainly of university students. The same classical IrisCode algorithm [21] [22] [23] was used for all of this work. Recently there has been great interest in alternative, automatically learned (not human-designed) Deep Learning (DL) processes, which did lead to revolutionary improvements in face recognition and in some other fields within computer vision; but they have not yet done so for iris recognition apart from some benefits in segmentation and spoof detection. Moreover, it is impossible to see into such “black boxes” to understand what they have learned from their training data, encoded into millions of learned parameters, across sometimes hundreds of layers. Some independent researchers [24] have described this current situation as the dichotomy between “Deep Learning and deep understanding”.
Quoting from a recent very comprehensive survey [25] of more than 200 papers applying DL to iris recognition: Most of the DL methods “do not work under the one-shot learning paradigm; assume multiple observations of each [eye] to obtain appropriate decision boundaries; and – most importantly – have encoding / matching steps with time complexity that forbid their use in large environments (in particular, for all-against-all settings)” [25]. Additionally, tests by the US National Institute of Standards and Technology (NIST) [26] indicate that the DL-based submissions (identifiable by their heavyweight model size with millions of learned parameters) fail to distinguish between genetically identical eyes. Unlike the classical IrisCode algorithm, they return similarity scores that are much closer for twins’ eyes, and also when comparing the two eyes of a given person, than for unrelated eyes. Probably this is because the DL “black boxes” are encoding and matching periocular data from eye images, such as the shape of the eyelids.
Finally, and of central importance for the topic of this study, the DL methods perform poorly on NIST’s new ethnic “Equity Measure for False Positives”. For a given algorithm, this measure is defined as the factor by which the worst False Match Rate (FMR) suffered by any ethnic group is worse than the geometric mean FMR across all groups using that algorithm. Obviously a value near 1.0 represents ethnic fairness, while larger values progressively signify inequity. The NIST report’s Demographics section [26] shows that DL methods often produce inequity factors of 2.0 or higher, whereas the classical IrisCode remains closer to 1.0 which signifies equal resistance to False Matches across ethnic groups. Given the focus of the present paper, obviously we avoided DL methods. The classical and widely deployed IrisCode approach enables baseline comparisons of entropy estimates, which in turn reveal likelihoods that two different biometric identities may collide by chance. The findings which we will present here, showing only a small impact of ethnicity on iris discriminability, align with the new NIST Equity Measure for False Positives [26] testing the same core IrisCode algorithm.
III Results
The histogram of Hamming distances (HD) across all 1,357,128 possible pairwise comparisons of IrisCodes in the AFHIRIS database is plotted in Fig. 2. As expected, its mean is close to 0.5 because the data bits in IrisCodes are equally likely to be a 0 or 1, and thus when corresponding bits from any two independent IrisCodes are compared, their four joint possibilities (00, 01, 10, 11) are all equiprobable, so therefore half of such paired bits are expected to disagree (HD = 0.5). Indeed comparing pairs of bits using their Exclusive-OR to detect disagreement, which reduces the above four pairs to simply (0, 1, 1, 0) amounts itself to a toss of a fair coin. In Fig. 2 it is clearly very unlikely that fewer than 40% of the bits or more than 60% of the bits compared from independent IrisCodes (HD 0.4 or HD 0.6) will disagree by chance. This is for exactly the same reason that if one tosses a “fair coin” (meaning its probability of coming up Heads is ) enough times, the outcomes are very unlikely to deviate far from a 50% frequency of Heads. The critical consequence for biometric iris recognition is that when two different IrisCodes are compared, if their Hamming distance is smaller than (say about) 0.3, then it is extremely unlikely that they arise from different eyes. The probability that a sample from the distribution in Fig. 2 will be HD 0.3 is infinitesimally small. This is the reason why iris recognition technology (using these algorithms) has such a legendary resistance to False Matches [15] [21] [27] and can survive very large database searches without making any, for example in de-duplication operations by performing all-against-all cross-comparisons.

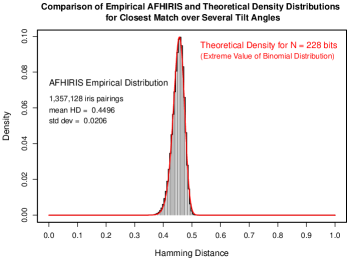
Most informative is the distribution’s standard deviation, , because this reveals the entropy within this database. The greater the number of coin tosses, the narrower the distribution of fractional outcomes will be (regardless of whether the coin is “fair”, or not). In fact the std dev varies inversely with the number of independent tosses. This allows us to estimate the entropy of iris patterns (a measure of their amount of random variation) as the equivalent number of coin tosses that would generate such a distribution when their IrisCodes are compared to compute a Hamming distance. For the AFHIRIS database, it corresponds to 228 tosses of a fair coin in a run. In terms of Information Theory, that means 228 bits of entropy: each toss of a fair coin has 1 bit of entropy (but less if ). In Fig. 3, the same histogram as plotted in Fig. 2 is superimposed with a curve showing the binomial probability density distribution corresponding to tossing a fair coin 228 times in each of many runs, and then tabulating the frequency of observing any given fraction (HD) of Heads, after performing many such runs.
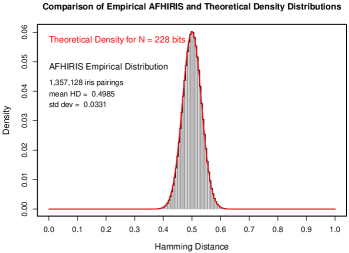
The red curve in Fig. 3 is a plot of the following probability distribution for the fraction of Heads (HD) in a run of tosses of a coin whose probability of Heads is :
| (1) |
where in this case and is the outcome fraction of Bernoulli trials (e.g. observing Heads within a run of coin tosses). (1) can be understood as the product of a combinatorial term and a probability term. The combinatorial term is simply the binomial coefficient for the number of different ways in which items can be selected out of :
This is multiplied by the probability term, which expresses the joint probability that the outcome whose probability is occured times while the alternative outcome whose probability is occured the remaining times. Thus the joint probability associated with any outcome sequence tabulated in the combinatorial term is . It is noteworthy that in the case that , this joint probability term does not depend on , hence Hamming distance, at all. The shape of the overall probability distribution then arises entirely from the combinatorial term. Measuring the std dev for an empirical distribution of HD scores from independent pairings tells us the equivalent number of tosses of a coin (having probability of Heads), namely . In Fig. 2 we measured , and therefore we estimated that the biometric entropy shown in the AFHIRIS database by cross-comparisons among all pairings was bits. The fit in Fig. 3 between the empirical distribution data and the theoretical probability density curve seems to be excellent.
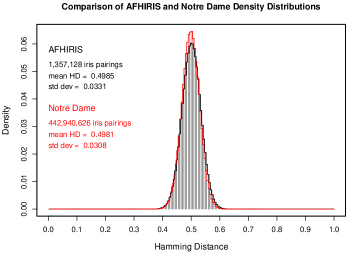
The estimated entropy in a University of Notre Dame database of iris images (in which only 1.53% were tagged as of African descent) is larger, corresponding to bits. Its histogram of cross-comparison HD scores is shown in Fig. 4 (red), superimposed on that for AFHIRIS (black). This difference may reflect the coarser structure in African iris patterns, as seen in Fig. 1, because a fundamental link exists in Information Theory between bandwidth and channel capacity. Lower frequency (coarser) structure is “less busy,” with slower variation, hence lower entropy. But as we shall assess quantitatively, this level of demographic difference in entropy has only a small operational impact on the deployment parameters (decision thresholds) necessary to maintain the same powers of iris discrimination.
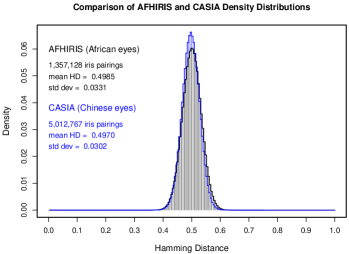
In Fig. 5 we also superimpose the distribution of AFHIRIS all-against-all cross-comparison scores (black) with the distribution of such scores obtained from cross-comparisons (blue) within a database of all-Chinese eyes, acquired by the Chinese Academy of Sciences (CASIA) [16] [17]. The contrast between these two distributions is similar to that observed in Fig. 4. The AFHIRIS distribution reveals a somewhat smaller entropy: a somewhat larger stn dev . (The small shifts in the mean HD score below 0.5 for all three of these distributions seem to arise from illumination gradients created by the local acquisition conditions. Shared gradients within an image dataset reduce cross-comparison HD scores slightly, because the wavelet encodings are sensitive to spatial derivatives even on a gross scale [22].) The main contrast observable in Fig. 5, the larger stn dev for the AFHIRIS database, can be related to the coarser scale African iris texture features as illustrated in Fig. 1 relative to those in Chinese eyes as illustrated in the samples provided at [17].
IV Discussion
Another aspect of some Nigerian iris patterns which may contribute to some loss of entropy relative to Caucasian or Chinese eyes eyes is the occasional appearance of broad radial “stripey” patterns as illustrated in Fig. 6. Just as with the coarse pattern of “lunar” craters seen in Fig. 1, their large scale reduces entropy by imposing a slower form of variation. To the extent that such patterns confine variation to just a single (polar) variable, namely variation along the angular coordinate but much less along the radial coordinate, such structures reduce information capacity for the same reason that a 1-D bar code is a channel with less information capacity than a 2-D bar code.

IrisCodes must be compared over a range of possible “tilt angles” (polar rotations) for a match, because the camera or the head may be tilted, and indeed each eye has a range of cyclotorsion (rotation around its optical axis), reflecting the fact that each eyeball’s pose within its orbital socket is controlled by not just two but three pairs of attached muscles [6]. Therefore the search engine attempts multiple matches after scrolling each IrisCode over some reasonable range of relative rotations, in steps of degrees. Usually seven rotations are attempted before assessing the “best match” possible between any two IrisCodes, but more may be required with handheld monocular cameras (as used in common smartphones) because they are often held at bigger tilt angles. Retrieving the best match after seven comparison rotations spans a tilt range of about 20 degrees.
Attempting multiple matches over some range of candidate rotations and recording only the closest match amounts to Extreme Value Sampling of the histogram distributions shown earlier. Obviously the mean HD score is reduced and a skew bias is introduced, as can be seen in the histogram of Fig. 7, because only the smallest sample from each set of sample scores is retained.
The analysis of this effect can be given a general theoretical form. Let be whatever density distribution is obtained for HD scores between different IrisCodes when compared for only a single relative image tilt. For example, might be the fractional binomial defined as prob(HD) in (1). Its cumulative is the probability of getting a score of or smaller:
| (2) |
or, equivalently,
| (3) |
The probability of not getting a score that is smaller than is therefore in single comparisons, and it is after carrying out such tests independently when considering different relative tilt angles. Thus the cumulative probability distribution for observing an HD score that is or smaller after optimising for relative image tilt is
| (4) |
and the probability density distribution expected for this cumulative is:
| (5) | |||||
In the specific case that the raw density distribution for HD scores is the fractional binomial density prob(HD) as defined in (1), with parameter , and relative tilt angles before selecting the best match in each such group of tilts, the predicted Extreme Value probability distribution is the red curve plotted in Fig. 7. It seems to provide an excellent fit to the empirical data (black bars) for such matches after rotations, and it supports further conclusions.
V Conclusions
Considering biometric identification in the context of Information Theory, iris patterns can be regarded as communication channels [15] where identity is the “signal” being transmitted, and whose channel capacity to distinguish different signals is measured in bits (or bits/mm2). If channel entropy estimated in bits (the equivalent number of Bernoulli trials in Fig. 3) is larger, then more signals can be reliably discriminated. The distribution of cross-comparison HD scores becomes narrower (reduction in ), so its cumulative up to any given HD decision criterion is reduced, both in the raw (Fig. 3) and post-rotations (Fig. 7) distributions, reducing probability of False Matches.
A Kolmogorov-Smirnov test assessing the likelihood that the two collections of samples shown in Fig. 4 (one from cross-comparisons within the Notre Dame database, and the other from within AFHIRIS) could be drawn from the same distribution function, rejects this null hypothesis at astronomical levels. This is not surprising, given the large number of cross-comparison scores in each distribution. The same conclusion arises from performing a Kolmogorov-Smirnov test to compare the CASIA and AFHIRIS distributions shown in Fig. 5. Regarding operational significance of the AFHIRIS entropy reduction, it is useful to construct Quantile-Quantile (QQ) plots as presented in Fig. 8 for Notre Dame and AFHIRIS. They plot the HD decision criterion which, if adopted for one distribution, would reach the same cumulative value (hence the same probability of False Matches) as the other distribution would reach at some other criterion. Fig. 8 shows this both for the raw distributions (left panel) and for the post-rotations distributions (right panel).
Choosing a particular HD value may provide an illustrative example. Measuring offsets in the post-rotation QQ plot of Fig. 8 shows that to achieve False Match resistance comparable to that obtained when operating at a decision threshold of around (say) HD = 0.39 for the Notre Dame database (which contained overwhelmingly Caucasian eyes, and only 1.53% African-American eyes), the decision threshold should just be reduced to around HD = 0.38 for eyes in this West African demographic group. We conclude that with such minor adjustments to compensate for reduced entropy, associated with the comparative scale of features, iris recognition technology can be deployed in this demographic group without any necessary compromise to its now legendary resistance to False Matches. This conclusion aligns with the recent NIST presentation [26] of its ethnic Equity Measure for False Positives, which hovers near 1.1 for the IrisCode algorithm. But this inequity factor ranges up to 2.0 or 3.0 for DL-based submissions. Although the present AFHIRIS database is too small to test False Match rates at the 1-in-a-million level (HD ) or 1-in-a-billion level (HD ), it is noteworthy that NIST did validate and confirm [15] those rates as were predicted long ago [21] by the methods discussed here, when NIST completed 1.2 trillion iris comparisons [27] across geographically disjoint populations.

Acknowledgements
We are grateful to Dr. Emine Krichen (of Idemia) for valuable comments about comparative scores from the NIST Equity Measure [26]; and to the Chinese Academy of Sciences Institute of Automation, and to the University of Notre Dame, for making biometrics databases available [16] [17] [18] [19].
Statistical analyses, and the generation of figures, were performed using the ‘R’ package: https://cran.r-project.org/
Institutional Review Board approvals: Ladoke Akintola University of Technology (ref: LODLC/ERC/2022/024), and Landmark University (ref: LMUERC/CRN/2021/0089). Subjects granted permission for image research and publication.
References
- [1] D. Leslie, “Understanding bias in facial recognition technologies”, arXiv:2010.07023 Computer Vision and Pattern Recognition, 2020.
- [2] D. Castelvecchi, “Is facial recognition too biased to be let loose?” Nature 587 (7834), 19 Nov. 2020, pp. 347–349.
- [3] J.G. Cavazos, P.J. Phillips, C.D. Castillo, A.J. O’Toole, “Accuracy comparison across face recognition algorithms: Where are we on measuring race bias?” IEEE Trans. Biometrics, Behavior, and Identity Science 3 (1), 2021, pp. 101–111.
- [4] https://www.bbc.co.uk/news/technology-33347866, 1 July 2015.
- [5] A. Monea, “Race and computer vision.” In: The Democratization of Artificial Intelligence: – Net Politics in the Era of Learning Algorithms, (A. Sudmann, ed), pp. 189–208. Berlin: Transcript Verlag, 2019.
- [6] R. Snell, M. Lemp, Clinical Anatomy of the Eye (2nd edition). London: Blackwell Science, 1998.
- [7] P. Grother, M. Ngan, K. Hanaoka, “Ongoing Face Recognition Vendor Test (FRVT), Part 2: Identification”. NIST Interagency Report 8238, National Institute of Standards and Technology (Bethesda), 2018.
- [8] R.A. Sturm, M. Larsson, “Genetics of human iris colour and patterns”, Pigment Cell Melanoma Res. 22, 2009, pp. 544–562.
- [9] E. Quillen, J. Guiltinan, S. Beleza, J. Rocha, R. Pereira, M. Shriver, “Iris texture traits show associations with iris color and genomic ancestry”, Am. J. of Human Biology 23 (4), 2011, pp. 567–569.
- [10] https://worldpopulationreview.com/country-rankings/inbreeding-by-country
- [11] R. Lemes, K. Nunes, J. Carnavalli, L. Kimura, R. Mingroni-Netto, D. Meyer, P. Otto, “Inbreeding estimates in human populations: Applying new approaches to an admixed Brazilian isolate.” PLOS ONE (online), 24 April 2018. doi: 10.1371/journal.pone.0196360
- [12] J. Daugman, C. Downing, “Epigenetic randomness, complexity and singularity of human iris patterns”, Proc. Roy. Soc. 268 (1477), 2001, pp. 1737–-1740.
- [13] J. Daugman, C. Downing, “Broken Symmetries, Random Morphogenesis, and Biometric Distance”, IEEE Trans. Biometrics, Behavior, and Identity Science 2 (3), 2020, pp. 271–-277.
- [14] T. Cover and J. Thomas, Elements of Information Theory, 2nd ed. New York: Wiley-Interscience, 2006.
- [15] J. Daugman, “Information theory and the IrisCode”, IEEE Trans. Info. Foren. Sec. 11 (2), 2015, pp. 400–409.
- [16] Chinese Academy of Sciences Institute for Automation (CASIA): Iris Databases – Center for Biometrics and Security Research. http://www.cbsr.ia.ac.cn/english/IrisDatabase.asp
- [17] https://hycasia.github.io/dataset/casia-irisv4/, http://biometrics.idealtest.org/
- [18] K.W. Bowyer, P.J. Flynn, “The ND-IRIS-0405 iris image dataset”, in arXiv:1606.04853, 2016 - arxiv.org
- [19] R. Connaughton, A. Sgroi, K. Bowyer, P. Flynn, “A multi-algorithmic analysis of three iris biometric sensors”, IEEE Trans. Info. For. Sec. 7 (3), 2012, pp. 919-–931.
- [20] O. Akande, N. Ojimba, A. Oghenekaro, et al. “AFHIRIS: African Human Iris Dataset (Ver. 1)”, F1000Research 11 (1549), 2022, https://doi.org/10.12688/f1000research.122759.1
- [21] J. Daugman, “The importance of being random: statistical principles of iris recognition,” Pattern Recognition, 36, 2003, pp. 279-–291.
- [22] J. Daugman, “How iris recognition works”, IEEE Trans. Circuits and Systems for Video Technology 14 (1), 2004, pp. 21–30.
- [23] J. Daugman, “New methods in iris recognition”, IEEE Trans. Systems, Man, and Cybernetics - Part B, 37 (5), 2007, pp. 1167–1175.
- [24] https://www.nist.gov/programs-projects/iris-experts-group-ii-homepage
- [25] K. Nguyen, H. Proença, F. Alonso-Fernandez “Deep Learning for Iris Recognition: A Survey”, (arXiv, October 2022). DOI:10.48550/arXiv.2210.05866
- [26] https://www.nist.gov/programs-projects/iris-exchange-irex-10-ongoing-evaluation-iris-recognition
- [27] P. Grother, G.W. Quinn, J.R. Matey, M. Ngan, W. Salamon, G. Fiumara, and C. Watson, “IREX-III: Performance of Iris Identification Algorithms”. NIST Interagency Report 7836, National Institute of Standards and Technology (Bethesda), 2012.
Author Affiliations and Contact Information
John Daugman and Cathryn Downing are with the Department of Computer Science and Technology,
University of Cambridge, United Kingdom.
e-mail: {John.Daugman, Cathryn.Downing}@CL.cam.ac.uk
Oluwatobi Noah Akande is with the Computer Science Department, Baze University, Abuja, Nigeria.
e-mail: oluwatobi.akande@bazeuniversity.edu.ng
Oluwakemi Christiana Abikoye is with the Computer Science Department, University of Ilorin, Kwara State, Nigeria.
e-mail: abikoye.o@unilorin.edu.ng
![[Uncaptioned image]](/html/2309.06521/assets/Daugman-photo.jpg) |
John Daugman received his degrees at Harvard University and then taught at Harvard before coming to Cambridge University, where he is Professor of Computer Vision and Pattern Recognition. He has held the Johann Bernoulli Chair of Mathematics and Informatics at the University of Groningen, and the Toshiba Endowed Chair at the Tokyo Institute of Technology. His areas of research and teaching at Cambridge include computer vision, information theory, neural computing, and statistical pattern recognition. Awards for his work in science and technology include the Information Technology Award and Medal of the British Computer Society, the “Time 100” Innovators Award, and the OBE, Order of the British Empire. He has been elected a Fellow of: the Royal Academy of Engineering; the US National Academy of Inventors; the Institute of Mathematics and its Applications; the British Computer Society; and he has been inducted into the US National Inventors Hall of Fame. He is the founder and benefactor of the Cambridge Chrysalis Trust. Here he is represented by a sparse sum of 2D Gabor wavelets in six orientations and five frequencies. |
![[Uncaptioned image]](/html/2309.06521/assets/Downing-photo.jpg) |
Cathryn Downing received her B.A. and her Ph.D. degrees at Yale University and Stanford University, respectively. Following post-doctoral appointments at New York University and at Harvard University, she became a Research Associate at Cambridge University. She is a Trustee of the Cambridge Chrysalis Trust. She and Daugman have published together on several subjects related to the present article including: demodulation codes; image quality metrics and predictive norms; radial correlations within iris patterns; the universality of the IrisCode impostors’ distribution; and the effect of severe image compression on iris recognition. She is represented here by a linear combination of just several hundred local 2D Gabor wavelets having six orientations, two quadrature phases, and five frequencies, each an octave apart, thereby spanning four octaves in the same discrete self-similar log-polar system of image representation as is used here for her co-authors’ synthesized photographs. |
![[Uncaptioned image]](/html/2309.06521/assets/Akande-photo.jpg) |
Oluwatobi Akande is a Senior Lecturer in the Department of Computer Science, Baze University, Abuja. He obtained a Bachelor of Technology and Masters of Technology degrees in Computer Science from the Department of Computer Science and Engineering, Ladoke Akintola University of Technology, Ogbomoso, Nigeria in 2012 and 2015 respectively. He also obtained a Doctor of Philosophy degree in Computer Science from the Department of Computer Science, University of Ilorin, Nigeria in 2021. He has passion for problem oriented researches which employ the knowledge of computing he has acquired over the years to solve his immediate societal problems. However, his research interest include Biometrics, Data and Information Security, Medical Image Analysis and Machine learning. The output of his research has been published in more than 60 journals and international conferences. He is an active member of professional bodies such as: IAENG Computer Science, Nigeria Computer Society (NCS), Academics in IT Professions (AITP) and Computer Professionals Registration Council of Nigeria (CPN). His photograph is reconstructed here using the same set of 2D Gabor wavelets in a linear combination of six orientations, two quadrature phases, and five frequencies, each an octave apart, as in the synthesized images of his co-authors. |
![[Uncaptioned image]](/html/2309.06521/assets/Abikoye-photo.jpg) |
Oluwakemi Abikoye is an Associate Professor at the Department of Computer Science, Faculty of Communication and Information Sciences, University of Ilorin, Ilorin, Nigeria. She received her B.Sc degree in Computer Science from the University of Ilorin in 2001, M.Sc degree in Computer Science from University of Ibadan, Ibadan in 2006 and Ph.D. degree in Computer Science also from the University of Ilorin in 2013. She began her academic career at University of Ilorin, Department of Computer Science in 2004 as a Graduate Assistant and rose through the ranks. Oluwakemi is known for her innovative work in Computer/Communication Network Security. She is the author or coauthor of more than 90 papers in International, National and Local refereed Journals and Conference contributions. Her research interests include Cryptography, Computer and Communication Network (Cyber) Security, Biometrics, Human Computer Interaction and Text and Data Mining. She is also a member of the following learned / professional societies such as Nigeria Computer Society (NCS), Science Association of Nigeria (SAN), IEEE and IEEE Computer Society, Computer Professionals Registration Council of Nigeria (CPN), Nigerian Women in Information Technology (NIWIIT), and Academia in Information Technology Profession (AITP). She is currently the Deputy Director (Research), Centre for Research, Development and In-house Training (CREDIT). She is represented in this image by a linear combination of the same set of localised, multi-scale, 2D Gabor wavelets as her co-authors. |