[a]Atreya Acharyya
Identifying multiwavelength counterparts to astrophysical neutrino events
Abstract
High-energy neutrinos originating in astrophysical sources should be accompanied by gamma-rays at production. Depending on the properties of the emission environment and the distance of the source to the Earth, these gamma-rays may be observed directly, or through the detection of lower energy photons that result from interactions with the intervening radiation fields. In this work, we present an automated tool that aims at using data from the Fermi-Large Area Telescope to identify multiwavelength counterparts to astrophysical neutrino events. The main goal of this tool is to enable prompt follow-up observations with ground-based and space-based observatories in order to help pinpoint the neutrino source.
1 Introduction
The extragalactic gamma-ray sky is dominated by blazars [1], a subclass of radio-loud active galactic nuclei (AGN) powered by a central supermassive black hole (SMBH), with relativistic jets pointed close to our line-of-sight. The spectral energy distribution (SED) of a typical blazar comprises two distinct peaks. While the first peak, occurring in the radio to the X-ray regime, has been attributed to synchrotron emission from electrons and positrons within the jet, the physical mechanisms responsible for the second peak, produced in the X-ray to gamma-ray regime, is still a matter of debate. Towards understanding this, the Fermi-Large Area Telescope (LAT, [2]) is a pair conversion telescope capable of detecting gamma-ray photons in the energy range between 20 MeV to above 500 GeV. Primarily operating in survey mode, it scans the entire sky every three hours.
Leptonic models [3, 4] attribute the high-energy peak of the SED to the inverse Compton (IC) scattering of electrons off a source of seed photons, either the same photons emitted through synchrotron emission (synchrotron self-Compton [SSC] model) or photon populations external to the jet (external Inverse Compton [EIC] model). On the other hand, lepto-hadronic models [5, 6] suggest that the second peak may be a result of either proton synchrotron or the decay of high-energy mesons produced in cosmic-ray interactions. A hadronic component of the gamma-ray emission [7] would potentially make AGN prime candidate sources of astrophysical neutrinos [8, 9].
Since 2016, IceCube has been broadcasting automatic real-time alerts for potential astrophysical neutrino candidate events in order to allow for prompt follow-up observations with ground-based and space-based observatories. The alerts are issued by the Astrophysical Multimessenger Observatory Network (AMON111https://www.amon.psu.edu (accessed on 06/06/2023), [10]) and circulated using the Gamma-ray Coordinates Network (GCN)222https://gcn.gsfc.nasa.gov (accessed on 06/06/2023), an open-source platform created by NASA to receive and transmit alerts about astronomical transient phenomena. One of the main goals of these alerts is to allow for follow-up observations with other observatories, in the hope of observing multimessenger events.
In this work, we present an automated tool that aims at using Fermi-LAT data to identify multiwavelength counterparts to astrophysical neutrino events with ground-based and space-based observatories in order to help pinpoint the neutrino source. More specifically, we want to know what is in the region of interest (RoI) around the neutrino alert, whether the RoI is observable from a ground-based observatory and whether anything interesting, for example a gamma-ray flare, is occurring at that particular location. In Section 2, we introduce the main components of the analysis and processing pipeline. In Section 3, we consider a typical example of a neutrino alert, IC230506A-gold-rev1, and discuss the primary outputs from the analysis tool. We summarise our conclusions and discuss some plans for future work in Section 4.
2 Methodology
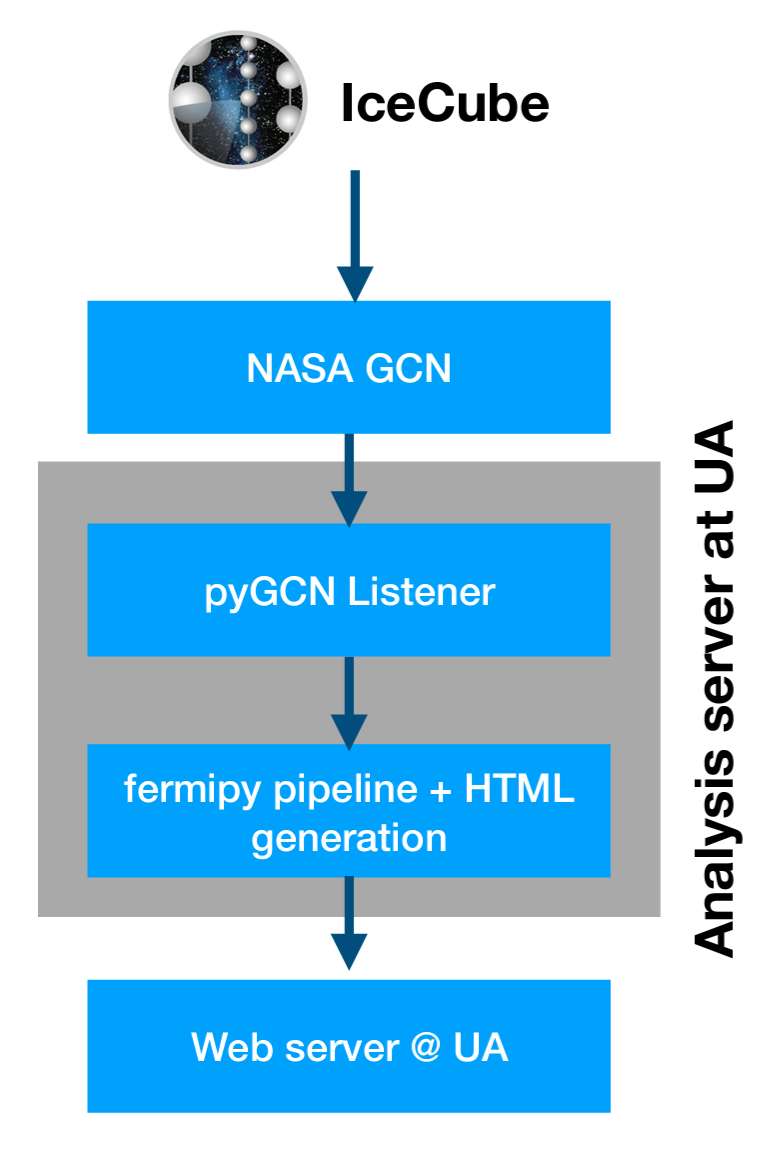
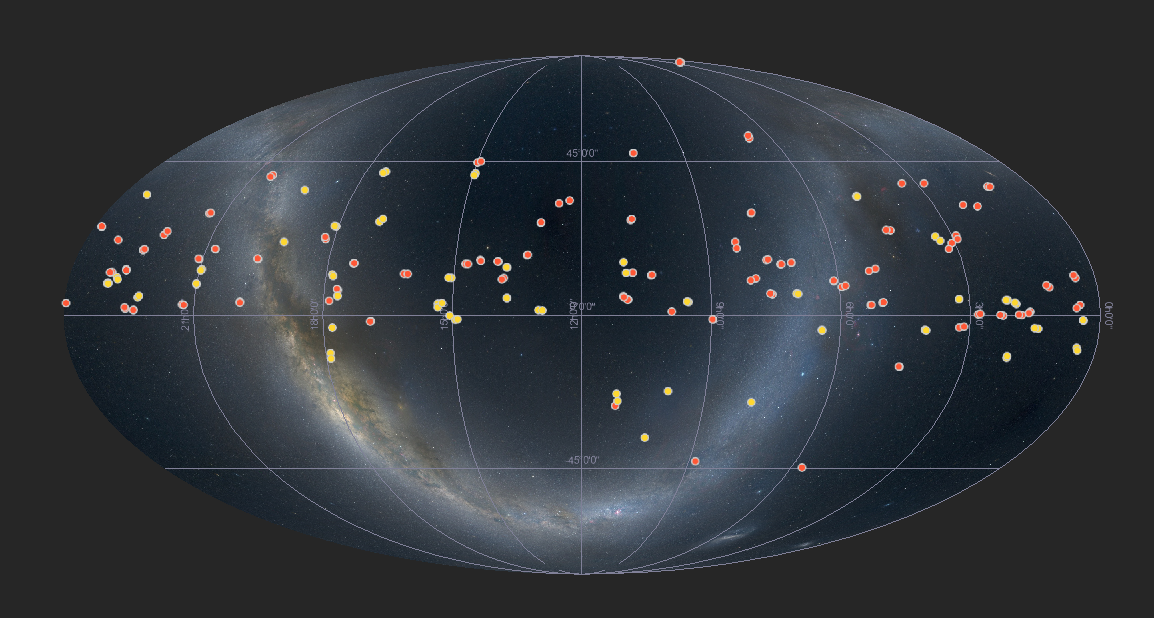
The automated pipeline, illustrated in Fig. 1, listens for incoming AMON_ICECUBE_GOLD and AMON_ICECUBE_BRONZE event alerts coming in through the GCN. These are individual single-neutrino events in the IceCube detector with a neutrino energy in the sub-PeV to 1 PeV energy regime and are shown in Fig. 2 for the time interval between June 19, 2019 and June 6, 2023.
More specifically, the analysis pipeline extracts information from the GCN alert related to the type of event (GOLD or BRONZE), the sky coordinates of the alert along with the associated confidence interval, the date and time of the alert in UTC, and also the corresponding Run_ID and Event_ID. The main components of the tool include performing an automatic Fermi-LAT analysis of the neutrino RoI, calculating the visibilities for common follow-up instruments and collecting multiwavelength archival data for known sources in the RoI. The entire process is then repeated for multiple revisions of a particular alert.
The tool then runs an automatic analysis of the Fermi-LAT photons detected from within the RoI of the neutrino alert over a 30 day interval prior to each individual event. Each analysis uses the Fermi Science Tools version 333http://fermi.gsfc.nasa.gov/ssc/data/analysis/software (accessed on 06/06/2023), FERMIPY version 1.0.1 444http://fermipy.readthedocs.io (accessed on 06/06/2023) [11] in conjunction with the PASS 8 instrument response functions [12]. The contributions from the isotropic and Galactic diffuse backgrounds are modeled using the most recent templates for isotropic and Galactic diffuse emission, iso_P8R3_SOURCE_V2_v1.txt and gll_iem_v07.fits respectively. Sources in the 4FGL-DR3 catalog [13] within a radius of from the best-fit location of each alert are included in the model with their spectral parameters fixed to their catalog values. The gtfindsrc routine is also applied to search for any additional point sources not accounted for in the model. Any source found to have a test statistic (TS, [14]) 9 (roughly corresponding to a significance of 3) is permanently added to the model at the position of its highest TS value.
Moreover, the normalization factor for both the isotropic and Galactic diffuse emission templates are left free to vary, along with the spectral normalization of all modeled sources within the RoI. Finally, the spectral shape parameters of all modeled sources within 3∘ of the alert are left free to vary while those of the remaining sources are fixed to the values reported in the 4FGL-DR3 catalog. A binned likelihood analysis is then performed in order to obtain the spectral parameters best describing the model during the period of observation, using a spatial binning of 0.1∘ pixel-1 and two energy bins per decade. The results, including HTML, FITS files, and images of plots, are mirrored on to the web server (https://multimessenger.ua.edu/fermi/, accessed on 06/06/2023).
3 Discussion
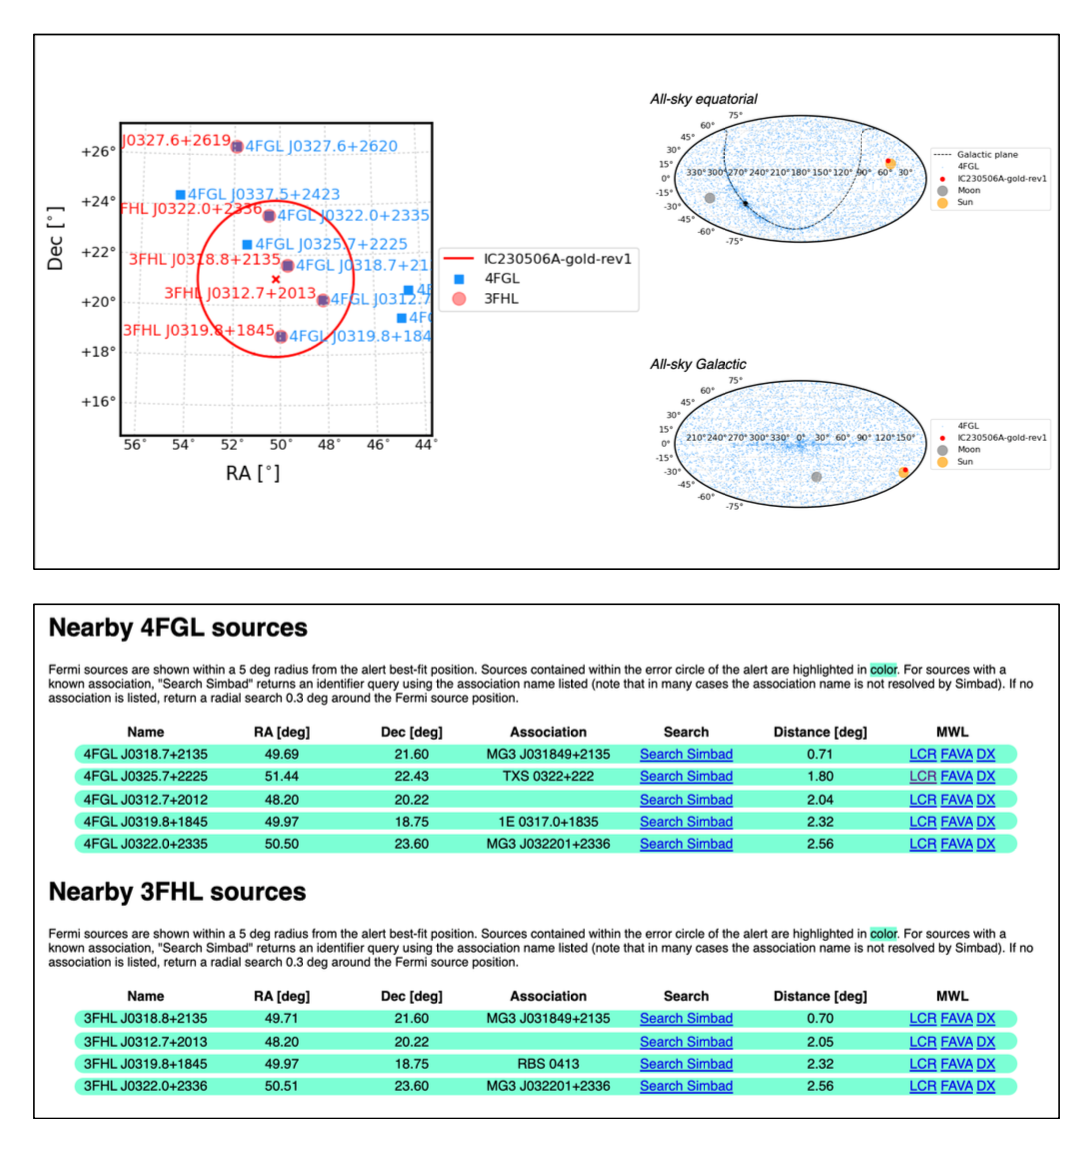
In this Section, we consider a typical example of a neutrino alert, IC230506A-gold-rev1555https://gcn.gsfc.nasa.gov/notices_amon_g_b/137910_29871391.amon (accessed on 06/06/2023), received on 2023-05-06 at 15:53:45 UTC. This was a revised AMON_ICECUBE_GOLD type alert, with Run_ID = 137910, Event_ID = 29871391, and the associated sky coordinates are RA = , Dec = , with a corresponding error radius of . The plots produced by the automated tool are shown in Fig. 3 and Fig. 4.
The output results include a skymap of the neutrino alert, also containing all sources in the confidence region from the 12-year Fermi-LAT catalog (4FGL-DR3, [13]), as well as the third Fermi-LAT catalog of sources significantly detected in the 10 GeV – 2 TeV energy range (3FHL, [15]). These sources are also listed separately in a Table containing their 4FGL and 3FHL names, sky coordinates, distance from the neutrino alert and links to the source entry in Simbad [16], as well as multiwavelength archival data repositories including the Fermi-LAT Light Curve Repository [17] and the Fermi All-sky Variability Analysis (FAVA, [18]) Light Curve Repository.
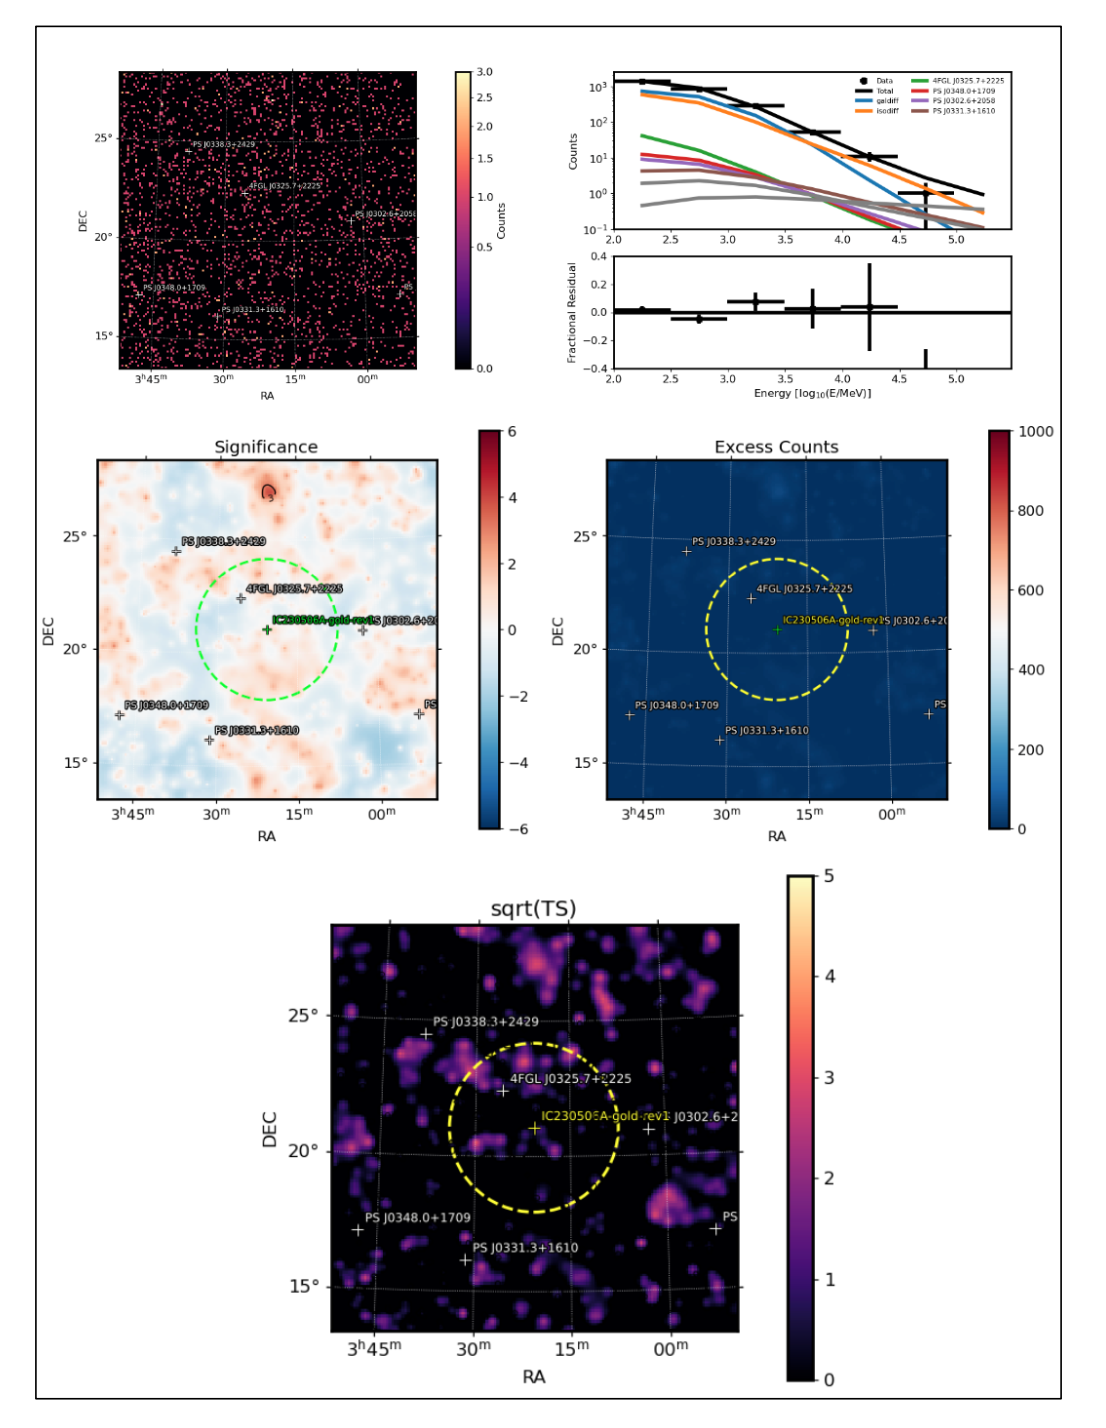
Also shown in Fig. 3, are the set of diagnostic plots produced in this Fermi-LAT data analysis. These are obtained for each individual alert and subsequent revision and include a skymap showing the modelled distribution of the gamma-ray photons obtained after removing all sources found to have a TS < 9 followed by applying the gtfindsrc routine over the RoI, as well as a skymap of the residual significance and the excess photon counts obtained in the analysis over the RoI centred on the location of the alert.
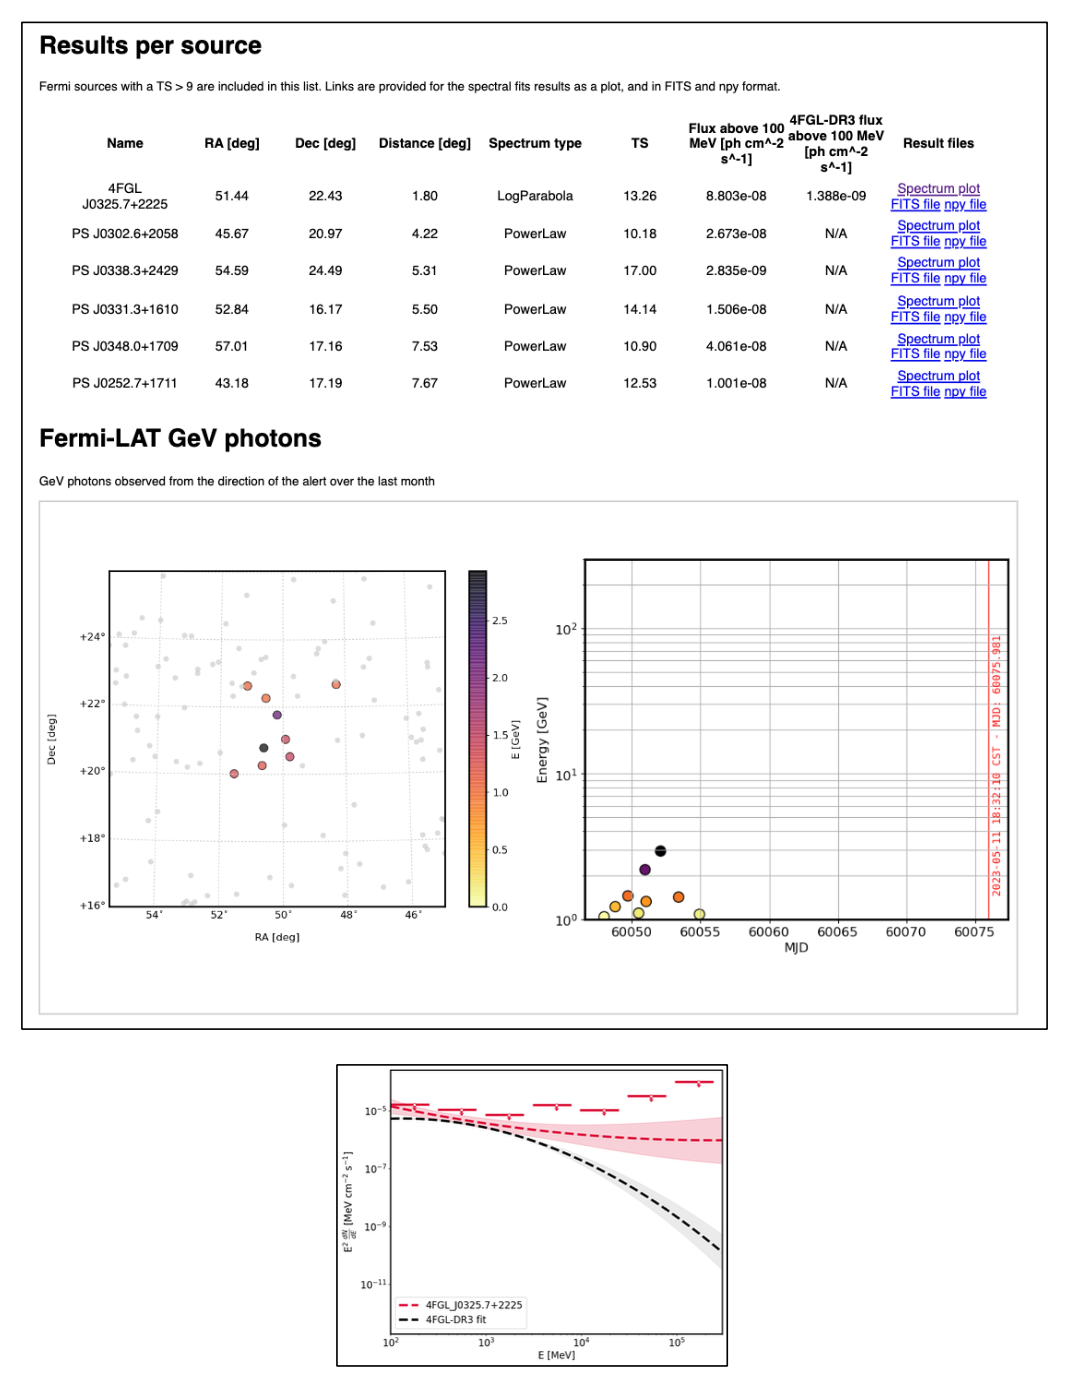
Fig. 4 shows more results obtained from the Fermi-LAT analysis, including both known 4FGL sources having TS , as well as new sources obtained from the gtfindsrc routine. This includes the TS obtained for each source, the measured flux values in the energy range 100 MeV – 300 GeV along with the corresponding 4FGL flux values for known sources. There is also a link to corresponding plots, such as the one shown in Fig. 4, of the Fermi-LAT spectrum for each source, with the 4FGL-DR3 best-fit spectrum [13] also shown for comparison for known sources. Furthermore, we also obtain a skymap and lightcurve of the GeV photons, emitted from within the RoI and having a 99 probability of originating from each individual source, over the one month observation period investigated.
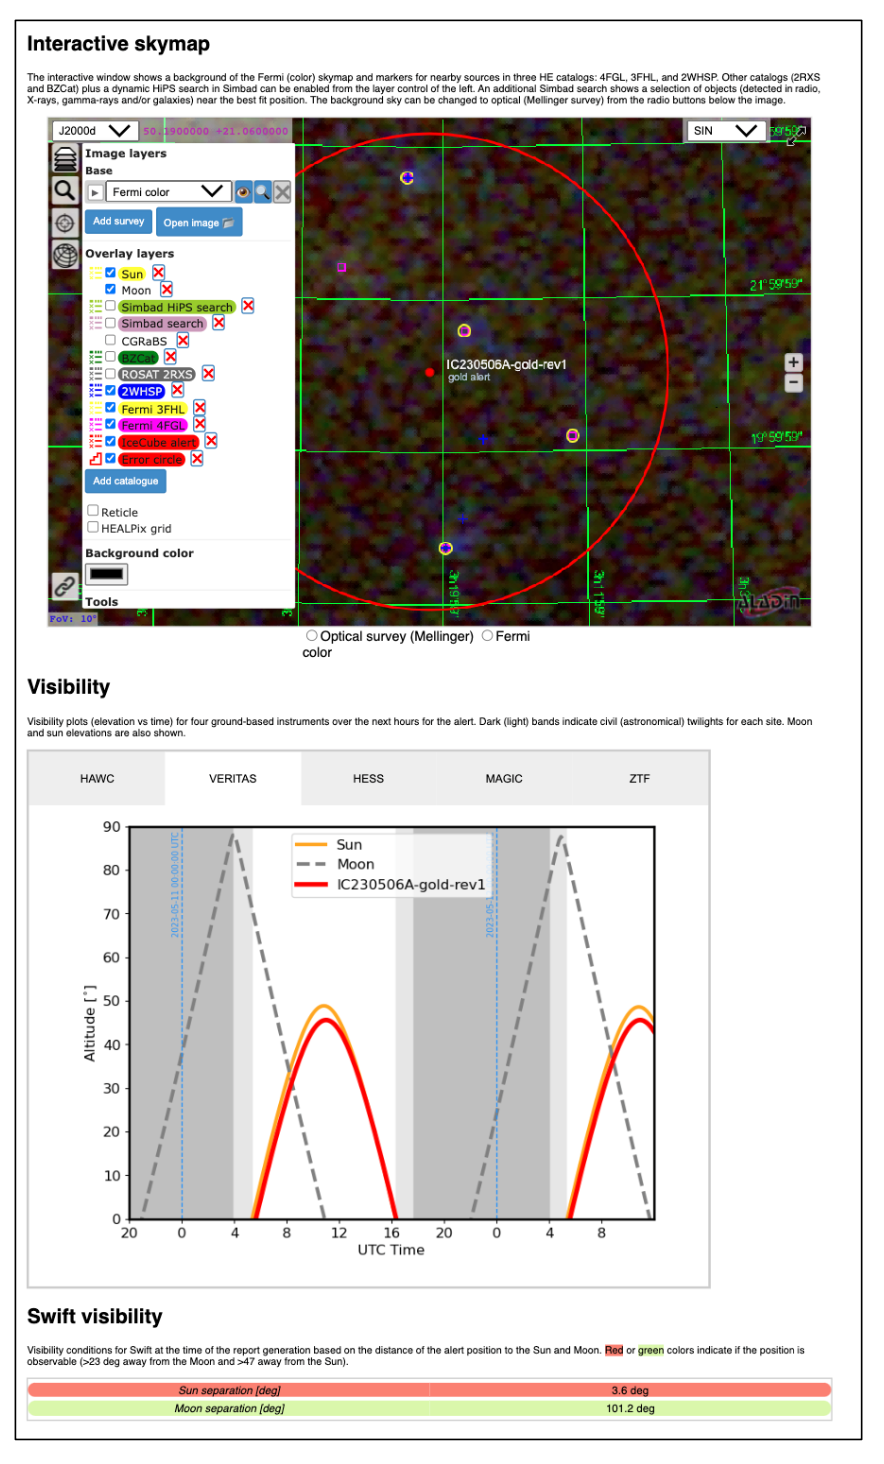
Moreover, the tool also produces an interactive skymap containing markers for nearby sources in three catalogs, namely the 4FGL, 3FHL, and 2WHSP [19]. Other catalogs, for example the 2RXS [20] and BZCat [21] plus a dynamic HiPS search in Simbad, can also be enabled. An additional Simbad search can be made to show a selection of objects detected in radio, X-rays, gamma-rays and galaxies near the best fit position of the alert. The background sky can also be changed to optical (Mellinger survey, [22]) using the radio buttons below the image. Finally, we also produce visibility plots of the RoI for the four ground-based instruments, namely MAGIC, H.E.S.S., VERITAS and HAWC, over the time interval just after the alert, in order to help enable prompt follow-up observations.
4 Conclusions and Future Work
In this work, we introduce an automated tool that aims at using Fermi-LAT data to identify multiwavelength counterparts to astrophysical neutrino events and enable prompt follow-up observations with ground-based and space-based observatories in order to help pinpoint the neutrino source. After discussing the main components of the the analysis and processing pipeline, we walk-through the primary outputs from the analysis tool for a typical example of a neutrino alert, IC230506A-gold-rev1.
It should be noted that this is an early version of the automated tool with plenty of scope for even further improvement. This includes, for example, adding support for 1-year and full-mission Fermi-LAT analysis alongside the month long time period currently analyzed, gathering more multiwavelength data and resources to enable SED construction, and finally improving compatibility with the GCN Kafka Client setup 666https://gcn.nasa.gov/docs/client (accessed on 06/06/2023).
Acknowledgments
A.A. and M.S. acknowledge support through NASA grants 80NSSC22K1515, 80NSSC22K0950, 80NSSC20K1587, 80NSSC20K1494 and NSF grant PHY-1914579.
References
- [1] C.D. Dermer and B. Giebels, Active galactic nuclei at gamma-ray energies, C R Phys. 17 (2016) 594 [1602.06592].
- [2] W.B. Atwood, A.A. Abdo, M. Ackermann, W. Althouse, B. Anderson, M. Axelsson et al., The Large Area Telescope on the Fermi Gamma-Ray Space Telescope Mission, The Astrophysical Journal 697 (2009) 1071 [0902.1089].
- [3] R. Blandford and A. Levinson, Pair Cascades in Extragalactic Jets. I. Gamma Rays, The Astrophysical Journal 441 (1995) 79.
- [4] M. Georganopoulos, F.A. Aharonian and J.G. Kirk, External Compton emission from relativistic jets in Galactic black hole candidates and ultraluminous X-ray sources, The Astronomy and Astrophysics Journal 388 (2002) L25 [astro-ph/0110379].
- [5] G.E. Romero, D.F. Torres, M.M. Kaufman Bernadó and I.F. Mirabel, Hadronic gamma-ray emission from windy microquasars, The Astronomy and Astrophysics Journal 410 (2003) L1 [astro-ph/0309123].
- [6] M. Böttcher, A. Reimer, K. Sweeney and A. Prakash, Leptonic and Hadronic Modeling of Fermi-detected Blazars, The Astrophysical Journal 768 (2013) 54 [1304.0605].
- [7] K. Mannheim, The proton blazar., The Astronomy and Astrophysics Journal 269 (1993) 67 [astro-ph/9302006].
- [8] K. Mannheim, High-energy neutrinos from extragalactic jets, Astroparticle Physics 3 (1995) 295.
- [9] F. Halzen and E. Zas, Neutrino Fluxes from Active Galaxies: A Model-Independent Estimate, The Astrophysical Journal 488 (1997) 669 [astro-ph/9702193].
- [10] M.W.E. Smith, D.B. Fox, D.F. Cowen, P. Mészáros, G. Tešić, J. Fixelle et al., The Astrophysical Multimessenger Observatory Network (AMON), Astroparticle Physics 45 (2013) 56 [1211.5602].
- [11] M. Wood, R. Caputo, E. Charles, M. Di Mauro, J. Magill, J.S. Perkins et al., Fermipy: An open-source Python package for analysis of Fermi-LAT Data, in 35th International Cosmic Ray Conference (ICRC2017), vol. 301 of International Cosmic Ray Conference, p. 824, Jan., 2017 [1707.09551].
- [12] W. Atwood, A. Albert, L. Baldini, M. Tinivella, J. Bregeon, M. Pesce-Rollins et al., Pass 8: Toward the Full Realization of the Fermi-LAT Scientific Potential, arXiv e-prints (2013) arXiv:1303.3514 [1303.3514].
- [13] Fermi-LAT collaboration, :, S. Abdollahi, F. Acero, L. Baldini, J. Ballet et al., Incremental Fermi Large Area Telescope Fourth Source Catalog, arXiv e-prints (2022) arXiv:2201.11184 [2201.11184].
- [14] J.R. Mattox, D.L. Bertsch, J. Chiang, B.L. Dingus, S.W. Digel, J.A. Esposito et al., The Likelihood Analysis of EGRET Data, The Astrophysical Journal 461 (1996) 396.
- [15] M. Ajello, W.B. Atwood, L. Baldini, J. Ballet, G. Barbiellini, D. Bastieri et al., 3FHL: The Third Catalog of Hard Fermi-LAT Sources, Astrophysical Journal Supplement Series 232 (2017) 18 [1702.00664].
- [16] M. Wenger, F. Ochsenbein, D. Egret, P. Dubois, F. Bonnarel, S. Borde et al., The SIMBAD astronomical database. The CDS reference database for astronomical objects, American Association of Pharmaceutical Scientists 143 (2000) 9 [astro-ph/0002110].
- [17] S. Abdollahi, M. Ajello, L. Baldini, J. Ballet, D. Bastieri, J. Becerra Gonzalez et al., The Fermi-LAT Lightcurve Repository, Astrophysical Journal Supplement Series 265 (2023) 31 [2301.01607].
- [18] S. Abdollahi, M. Ackermann, M. Ajello, A. Albert, L. Baldini, J. Ballet et al., The Second Catalog of Flaring Gamma-Ray Sources from the Fermi All-sky Variability Analysis, The Astrophysical Journal 846 (2017) 34 [1612.03165].
- [19] Y.L. Chang, B. Arsioli, P. Giommi and P. Padovani, 2WHSP: A multi-frequency selected catalogue of high energy and very high energy -ray blazars and blazar candidates, The Astronomy and Astrophysics Journal 598 (2017) A17 [1609.05808].
- [20] T. Boller, M.J. Freyberg, J. Trümper, F. Haberl, W. Voges and K. Nandra, Second ROSAT all-sky survey (2RXS) source catalogue, The Astronomy and Astrophysics Journal 588 (2016) A103 [1609.09244].
- [21] E. Massaro, P. Giommi, C. Leto, P. Marchegiani, A. Maselli, M. Perri et al., Roma-BZCAT: a multifrequency catalogue of blazars, The Astronomy and Astrophysics Journal 495 (2009) 691 [0810.2206].
- [22] A. Mellinger, A Color All-Sky Panorama Image of the Milky Way, Publications of the Astronomical Society of the Pacific 121 (2009) 1180 [0908.4360].