Towards Visual Taxonomy Expansion
Abstract.
Taxonomy expansion task is essential in organizing the ever-increasing volume of new concepts into existing taxonomies. Most existing methods focus exclusively on using textual semantics, leading to an inability to generalize to unseen terms and the ”Prototypical Hypernym Problem.” In this paper, we propose Visual Taxonomy Expansion (VTE), introducing visual features into the taxonomy expansion task. We propose a textual hypernymy learning task and a visual prototype learning task to cluster textual and visual semantics. In addition to the tasks on respective modalities, we introduce a hyper-proto constraint that integrates textual and visual semantics to produce fine-grained visual semantics. Our method is evaluated on two datasets, where we obtain compelling results. Specifically, on the Chinese taxonomy dataset, our method significantly improves accuracy by 8.75 %. Additionally, our approach performs better than ChatGPT on the Chinese taxonomy dataset.
1. Introduction
Taxonomies play a crucial role in interpreting semantics and providing valuable knowledge to machines. In the age of large language models, taxonomies are still essential, especially when dealing with domain concepts. Among a a wide range of taxonomies available on the Web (Miller, 1995; Bollacker et al., 2008; Lipscomb, 2000), product taxonomies have been proven particularly useful in e-commerce applications such as query understanding, recommendation systems, and product labeling. However, maintaining a taxonomy manually is a laborious task. Therefore, the taxonomy expansion task has become increasingly valuable.
Existing literature typically emphasizes textual semantics, overlooking the significance of visual semantics. These approaches involve representing term features and aligning them with parent terms, wherein a well-formulated term representation can streamline the matching process. Term representations are classified into two main paradigms: 1) Extracting textual semantics from extensive corpora, by employing implicit relational semantics exclusively (Manzoor et al., 2020) and by relying solely on corpus data to generate a constrained seed-guided taxonomy (Zeng et al., 2021). 2) Deriving structural textual semantics from existing taxonomies, using various techniques such as local egonet (Shen et al., 2020), parent-query-child triplet (Zhang et al., 2021a), and mini-paths (Yu et al., 2020). The above mentioned methods disregards visual semantics, leading to two issues: 1) Models struggle to understand the semantics of unseen terms, impeding their integration into the taxonomy. 2) The ”Prototypical Hypernym Problem” (Levy et al., 2015) occurs in the supervised settings. This problem arises when a model learns that Fruit is a hypernym of Apple and that Apple Juice is semantically akin to Apple, subsequently making the faulty assumption that Fruit is the hypernym of Apple Juice. This highlights the importance of expanding taxonomies to encompass vital features beyond textual semantics and lexical relations.
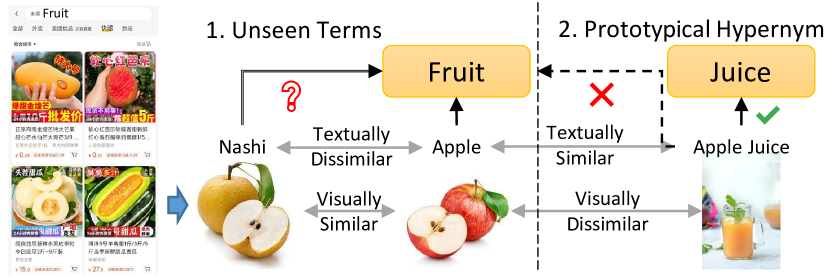
This paper presents Visual Taxonomy Expansion (VTE), a method that enriches term representations by integrating visual semantics derived from images. Visual semantics help to address the limitations mentioned above. 1) VTE enhances model generalization for the comprehension of unseen terms by using similar visual features. Specifically, terms with analogous images, such as Apple and Nashi, are more likely to possess a shared hypernym like Fruit. 2) VTE refines the differentiation between prototypical hypernyms and actual hypernyms by distinct visual semantics. For example, the terms Apple and Apple Juice, which are visually distinct, are less likely to share the same hypernym (Fruit), thereby allowing for differentiation between prototypical hypernyms and real hypernyms (Juice). However, the incorporation of visual semantics introduces a few challenges:
-
•
Coarsely-grained terms, which represent general concepts of several sub-classes, often lack precise images for depiction, making it difficult to find suitable visual semantics.
-
•
Even when visual semantics for coarsely-grained terms can be found, establishing connections with corresponding textual semantics becomes challenging, since both semantics represent the same term.
To tackle challenges in VTE, we utilize potential hypernymy relations from user-click logs (Cheng et al., 2022) and propose a contrastive multitask framework consisting of three representation learning tasks and a detection task. The first task, textual hypernymy learning, aids in comprehending the relationships between hyponyms and hypernyms by clustering hyponyms to produce superior hypernym representations. The second task, visual prototype learning, generates visual semantics of hypernyms by grouping similar images using instance-cluster contrastive learning. The third task, hyper-proto constraint, narrows the gap between textual and visual semantics, resulting in more refined visual prototypes. It models a variant similarity constrained by uncertainty during projection. Additionally, we develop a heuristic fusion method that incorporates both textual and visual semantics to identify hypernymy relationships using an MLP classifier.
To summarize, our major contributions include the following:
-
(1)
To the best of our knowledge, we are the first to propose Visual Taxonomy Expansion (VTE). To achieve this goal, we introduce a contrastive multitask framework that generates missing visual features for hypernyms and organically integrates textual and visual semantics.
-
(2)
We provide two datasets, one in Chinese and the other in English, to support the VTE task. The Chinese taxonomy dataset is the largest Chinese visual taxonomy dataset, containing over 10 thousand edges.
-
(3)
We conduct extensive experiments on two taxonomy expansion datasets and achieve the best results over all baselines. Specifically, our method improve the accuracy by 8.75% on the Chinese taxonomy dataset and 6.91% on the Semeval-2016 dataset. Moreover, we outperform ChatGPT on the Chinese taxonomy dataset. Our datasets and codes are publicly available111https://github.com/DarthZhu/VTE.
2. Related Work
Taxonomy Expansion. Most previous works on taxonomy expansion have focused on designing features to capture diverse representations of terms. Manzoor et al. (2020) expand taxonomies by jointly learning latent representations for edge semantics and taxonomy concepts. Shen et al. (2020) propose a self-supervised method using a graph neural network to encode positional information for taxonomy expansion. Zeng et al. (2021) collect information from complex local-structure information and learn to generate concept’s full name from corpus. Song et al. (2021) design a concept sorting model to extract hyponymy relations and sort their insertion order based on the relationship between newly mined concepts. Similarly, Zhang et al. (2017) utilize the hierarchical information of the existing taxonomy by extracting tree-exclusive features in the taxonomy to improve the coherence of the resulting taxonomy. More recently, Jiang et al. (2022) leverage both semantic and structural features to generate taxonomy-contextualized embeddings for each term. Cheng et al. (2022) exploit user-generated content by constructing a user-click graph to augment structural information and used user-click logs as prior hypernymy sources.
Taxonomy Construction. For taxonomy construction from scartch, existing methods can be divided into two paradigms. Pattern-based methods adopt lexical patterns to extract hypernymy relations between co-occurrences of given pairs (Hearst, 1992; Agichtein and Gravano, 2000; Nakashole et al., 2012; Panchenko et al., 2016). Distributional methods predict hypernymy relations by calculating pairwise scores based on term embeddings (Shwartz et al., 2016; Luu et al., 2016; Cocos et al., 2018; Jin et al., 2018; Roller et al., 2014). Additionally, some methods employ advanced techniques, such as transfer learning (Shang et al., 2020), reinforcement learning (Mao et al., 2018), and entity set expansion techniques (Shen et al., 2019), to construct a taxonomy.
3. Overview
In this section, we firstly define the hypernymy detection task, followed by the framework of our solution.
3.1. Preliminaries
Definition 1. Taxonomy. A taxonomy is a tree-structured hierarchy in which each node is a term, and each edge is a pair of hypernymy relations, indicating that is the hypernym of .
Definition 2. User Click Logs. User click logs record a user query and its corresponding clicked item . Each includes an item name and its image.
3.2. Problem Formulation
Problem Definition. Given an existing taxonomy and a set of terms , where for each , , the goal of the taxonomy expansion task is to attach each term to the existing , such that is expanded to . Each edge represents a new hypernymy pair , where and .
Formally, we define each node as a categorical random variable and the taxonomy as a Bayesian network. The probability of a taxonomy is defined as the joint probability of node set which can be further decomposed into a product of conditional probabilities as follows:
| (1) |
where is the model parameters and is the set of parent(s) of the node . Then, given an existing taxonomy , the taxonomy expansion task is to find the optimal taxonomy by solving the following optimization problem:
| (2) |
Problem Simplification. For a given term , taxonomy expansion tasks find a subset of parents. Since all terms can be considered as an candidate, leading to an enormous potential search space of . Previous works alleviate this problem via restricting that only one term to be the parent of . However, this assumption over-simplifies the problem, neglecting the fact that a term often has multiple hypernyms and the connections between new terms in . To further address this problem, we adopt the idea of utilizing strong prior hypernymy relations from user behaviors (Cheng et al., 2022). Potential hypernymy pairs from user click logs are treated as the source of candidate parents since when users search for an item, it is more likely that they query a super-class of the item. Our statistical analysis of 100 query-click pairs yields 69 pairs containing potential hypernymy relations, thereby highlighting as an excellent source for obtaining prior hypernymy pairs.
3.3. Framework
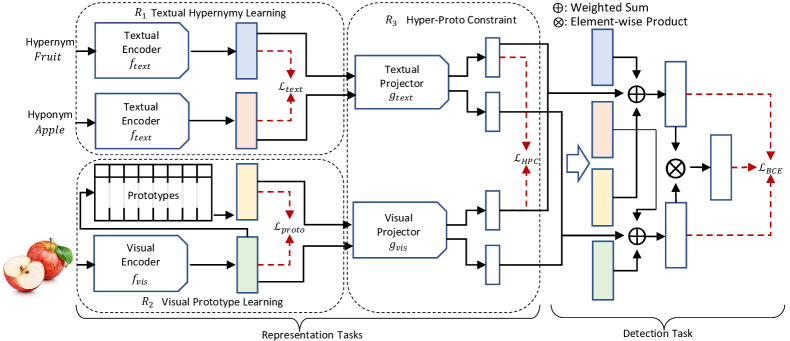
As shown in Figure 2, our solution framework mainly consists of two types of tasks: representation tasks and detection task. The former is composed of three sub-tasks: Textual Hypernymy Learning (), Visual Prototype Learning (), and Hyper-Proto Constraint ().
Representation tasks. : The first task learns the representations of hypernyms and hyponyms in the textual modality. To generate better hypernym representations, hyponyms with the same hypernym are clustered. : The second task learns the representations of hyponyms and the corresponding prototypes in the visual modality. Identical images are clustered and yield a prototype, which is the cluster centroid of identical images, to represent high-level visual semantics for hyponym images. : To bridge the gap between the textual and visual representations, the third task learns the similarity between the textual hypernym representations and the visual prototypes. Both representations are projected and aligned in a shared latent space through contrastive learning.
Detection task is made up of two steps. The first step takes both textual and visual representations of terms as the input and adopts a heuristic fusion method to generate term representations. The second step detects whether hypernymy relation holds according to these representations.
4. Methodology
In this section, we will describe the details of four tasks in our proposed framework.
4.1. : Textual Hypernymy Learning
Textual hypernymy learning learns the representations of hypernyms and hyponyms in the textual modality. To this end, we adopt contrastive learning to cluster textual-semantically similar terms. In this task, a hyponym and its correct parent are defined as the anchor term and the positive sample, while terms that are not ancestors of the hyponym are treated as negative samples.
Formally, given a pair of terms , we define as the anchor and as its positive sample while negative samples , where is the batch size, are hypernyms of other term pairs in one batch. To extract informative representations for contrastive learning, we employ a pre-trained language model, e.g., BERT (Devlin et al., 2019). Specifically, given a term , we feed into a pre-trained contextual language model with an additional linear layer and obtain the contextual representations from the last hidden layer:
| (3) |
Finally, we apply mean pooling and a linear transformation on to generate term-level representation Such that, for a given pair of terms , the encoded textual representations can be denoted as . Based on the textual representations of given term pairs, we have the textual hypernymy learning objective:
| (4) |
where is the dot product and is the temperature hyper-parameter in contrastive learning.
4.2. : Visual Prototype Learning
The visual prototype learning task clusters hyponym images and produces visual prototypes. Visual prototypes are crucial because high-level terms often lack precise images, which leads to a lack of visual semantics. This issue is resolved by adopting prototypical contrastive learning to cluster identical images, which treats an image as an anchor, while the closest prototype is the positive sample, and other prototypes are negative samples. To represent visual prototypes, vector quantization (VQ) is used, which defines prototypes as a codebook.
Specifically, given a hyponym image , we use a ResNet (He et al., 2015) encoder with an additional linear layer to encode to get its visual features We assign to a prototype cluster by defining prototypes as an auxiliary embedding table of size . Each is a vector of size , representing a prototype vector for a potential cluster. We calculate the Euclidean distances between and each , where the closest prototype is chosen. We can derive the prototype for from the following equation:
| (5) |
It is noteworthy that the embedding table should not be updated by gradients; otherwise, the rapid gradient update will break the consistency with the following cluster selection process. Thus, stop gradient is employed on , which is: where treats the input as a constant during back propagation.
Finally, We employ instance-cluster level contrastive learning to cluster identical images, which prevents degeneration in the optimization process. We denote as the anchor and the assigned prototype as the positive sample, and negative samples , denote prototypes chosen by other hyponym images in a batch. We normalize both and and Euclidean distance becomes , which enables us to adopt the InfoNCE loss to simplify the loss computation, where the objective can be written as:
| (6) |
where is the dot product and is the temperature hyper-parameter in contrastive learning.
To ensure consistent prototypes, we employ Exponential Moving Average (EMA) to optimize . We update each prototype by images that select it as follows:
| (7) |
where is a small positive number that prevents division by zero, and is the constant smoothing hyper-parameter. We perform momentum update simultaneously with gradient update, ensuring consistency between and .
4.3. : Hyper-Proto Constraint
The Hyper-Proto Constraint aims to capture the similarity between hypernyms and prototypes. There are two primary reasons why we propose this constraint. Firstly, the visual prototype learning technique we discuss in Section 4.2 clusters images based solely on their visual similarity, which can result in large and noisy clusters. Secondly, we observe that the disparity between textual and visual semantics is substantial. However, quantifying this similarity is challenging because the relationships between hypernyms and prototypes can be diverse. For example, a hypernym such as Food may have many identical visual prototypes, such as those indicating Fruit, Vegetables, and Meat, and vice versa. To address the challenge, we introduce uncertainty (Zhang et al., 2021b).
Namely, given an encoded hypernym representation and a corresponding visual prototype generated by hyponym image , we first adopt a textual projector and a visual projector to project and to a shared latent space respectively. During the process, the last dimension of the projected vector is treated as uncertainty and the remaining dimensions as projected representations:
| (8) |
where , , , and are learnable parameters, and are projected representations, and and represent the uncertainty of the projection process. Then, we scale the uncertainty to lie within :
| (9) |
where is a sigmoid function. If a projector projects a representation with greater uncertainty, it suggests that the representation is more invariant to displacement, indicating that the representation itself is more general. Hence, we assume that the similarity between a general textual representation and its corresponding prototype is weak.
To capture the similarity controlled by uncertainty, we then propose to use contrastive learning with a variant temperature. In this approach, we define the projected hypernym representation as an anchor and its corresponding projected visual prototype as the positive sample. We also include other projected prototype representations as negative samples (), where is the number of prototypes in the batch. To scale each projected representation , we multiply it by its corresponding uncertainty . The proposed Hyper-Proto Constraint (HPC) is given by:
| (10) |
4.4. Detection Task
The detection task aims to fuse representations from both textual and visual modalities and determine whether the hypernymy relation holds for the given term pairs.
While the intuitive way to fuse textual and visual representations is to add them directly, our preliminary experiments show that when faced with previously unseen term pairs, adding visual features leads the model to predict a hypernymy relation even when it is not applicable. To address this issue, we design a fusion method to generate more informative representations.
To achieve this, we first project a pair of textual term representations and its corresponding visual features using projection functions and mentioned in Sec 4.3, which transform them into , , , and , respectively. We then calculate the cosine similarity between term representations of the textual and visual modalities using the following equations:
| (11) |
We assume that if the projected representations are distinct, indicating that the textual and visual semantics are different, additional visual semantics may provide misleading information. In the context of user search, an instance of a term pair, such as (Zebra, Okapi), may pose a challenge to the model’s performance as Okapi, a species of giraffe that features black and white stripes, shares some visual characteristics with Zebra. However, this sort of confusion can be mitigated by assessing the similarity between the textual and visual representations of the terms in the given pair. A low similarity score extracted from such an analysis can prevent the model from ascribing an erroneous hypernymy relation.
Thus, the similarity between the projected representations provides automatic threshold control over the weighted sum. The term representations for each term are then fused as follows:
| (12) |
After fusing the representations, we utilize an MLP module to predict whether the potential hypernymy pair exists in the taxonomy. To enhance the relationship between the two representations, we also include the element-wise product between them in the detection module, which is formulated as:
| (13) |
where and are learnable parameters, is the element-wise product, and is the concatenation of vectors. The classification objective can be expressed as:
| (14) |
4.5. Training and Inference
Training. During training, the objective is the sum of the above four tasks, which is:
| (15) |
It is worth mentioning that although , , and selects in-batch negative samples, the detection task does not automatically generate a negative sample. Thus, we propose to select negatvie samples from a set of potential options, which includes the following terms: 1) Children of the anchor node. 2) Siblings of the anchor node. 3) Random items from user click logs that are neither ancestors nor descants of the anchor node.
Inference. We partition the inference stage into two distinct steps. The first step involves predicting whether the edge connecting a given pair of terms exists within the taxonomy. Here, we directly fuse the generated textual and visual features and subsequently feed them into the classifier for prediction.
Next, we utilize a top-down bootstrapping strategy to expand the predicted hypernymy relationships within the existing taxonomy. The strategy iterates to traverse the existing taxonomy in level-order. At iteration , we reach the level , who has a node set , and for each node , we attach its newly detected hyponyms to at level . Then, we continue the process until we reach the last level of the taxonomy, and there is no further edge that requires attachment.
5. Experiments
This section details our experimental setup and presents the empirical results of our proposed method compared to baseline methods. We also provide a comprehensive analysis of our method to highlight its strengths and weaknesses.
5.1. Experimental Setup
| Dataset | Chinese Taxonomy | |||
|---|---|---|---|---|
| Methods | Accuracy | Precision | Recall | F1 |
| TaxoExpan | 52.45 | 67.52 | 56.86 | 61.73 |
| TMN | 54.30 | 70.39 | 52.07 | 59.86 |
| HyperExpan | 57.15 | 67.41 | 62.59 | 64.91 |
| PTE | 57.80 | 68.32 | 67.01 | 67.65 |
| TaxoEnrich | 56.90 | 61.54 | 86.49 | 71.91 |
| BERT + MLP | 59.00 | 67.84 | 74.57 | 71.05 |
| Ours | 67.75 | 71.23 | 87.55 | 78.55 |
| Dataset | Semeval-2016 | |||
| Methods | Accuracy | Precision | Recall | F1 |
| TaxoExpan | 58.72 | 59.63 | 96.40 | 73.68 |
| TMN | 71.26 | 76.16 | 74.07 | 75.10 |
| HyperExpan | 73.51 | 73.02 | 80.19 | 76.44 |
| PTE | 52.49 | 55.64 | 79.14 | 65.34 |
| TaxoEnrich | 75.46 | 70.80 | 89.81 | 79.18 |
| BERT + MLP | 74.37 | 73.84 | 82.57 | 77.96 |
| Ours | 82.37 | 79.22 | 87.77 | 83.28 |
Baselines. We compare our method with other state-of-the-art taxonomy expansion approaches. For fair comparisons, we use term embeddings from BERT model in all methods. We run five times for each method and report the average performance. Baselines include:
-
•
TaxoExpan (Shen et al., 2020) encodes positional information with a graph neural network and uses a linear layer to predict hypernymy relations.
-
•
TMN (Zhang et al., 2021a) leverages auxiliary signals to augment primal task and adopts channel-wise gating mechanism.
-
•
HyperExpan (Ma et al., 2021) uses hyperbolic graph neural networks to encode concept embedding and computes matching scores for given pairs.
-
•
PTE (Cheng et al., 2022) exploits user-generated content by constructing a user-click graph to augment structural information.
-
•
TaxoEnrich (Jiang et al., 2022) generates taxonomy-contextualized embedding and learns horizontal and vertical representation for each term.
-
•
BERT + MLP uses a BERT model as the encoder and an MLP module as the classifier to predict whether hypernymy relations holds.
Evaluation Metrics. In this paper, we report four important metrics in the taxonomy expansion task: accuracy, precision, recall, and F1 score for every method.
Parameter Settings. We utilize the “bert-base-uncased” and “bert-base-chinese” pre-trained models as our textual backbone, and the “resnet-101” model as our visual backbone. For the prototype embedding table, we set the values of and to 1024 and 256, respectively. The temperature hyper-parameters for contrastive learning are set to and . We also set and for EMA. All parameters, except for the prototypes, are optimized using AdamW (Kingma and Ba, 2014) with a learning rate of 5e-5.
| Methods | Accuracy | Precision | Recall | F1 |
|---|---|---|---|---|
| Ours | 67.75 | 71.23 | 87.55 | 78.55 |
| Visual Feature | ||||
| w/o image | 61.20 | 68.13 | 76.23 | 71.95 |
| Prototype Learning | ||||
| w/o HPC | 65.80 | 70.34 | 85.25 | 77.08 |
| w/o prototype | 62.90 | 64.13 | 88.58 | 74.40 |
| Representation Fusion | ||||
| w/o in Eq.13 | 66.95 | 70.98 | 86.29 | 77.89 |
| w/o in Eq.12 | 66.50 | 70.64 | 86.14 | 77.62 |
| Setting | Accuracy | Precision | Recall | F1 |
|---|---|---|---|---|
| zero-shot | 54.85 | 67.61 | 63.45 | 65.47 |
| 1-shot | 60.55 | 69.85 | 77.98 | 73.69 |
| 2-shot | 64.55 | 70.50 | 78.43 | 74.25 |
| Ours | 67.75 | 71.23 | 87.55 | 78.55 |
5.2. Main Result
Model Comparison. Our method is compared with other baseline methods on two datasets. Based on the findings in Table 1, it can be concluded that: 1) Our method outperforms all other methods on both datasets because we integrate visual semantics and representation learning in taxonomy expansion. More specifically, on the Chinese taxonomy dataset, our model achieves a significant improvement over the second-best method by 8.75% and 6.64% on accuracy and F1 score, respectively. On the Semeval-2016 dataset, we improve the performance by 6.91% and 4.1% on accuracy and F1 score, respectively. 2) Methods that facilitate representation learning (TaxoEnrich and ours) outperform those that only encode structural information (others), which demonstrates that encoding terms more precisely is the top priority for the taxonomy expansion task. 3) All methods achieve lower performance on our constructed dataset for the taxonomy expansion task, which reflects the challenges associated with this dataset. Our dataset includes several hard false parent candidates, such as synonyms, prototypical hypernyms, and siblings of the given query term, making it much more difficult to identify the true parents. 4) Despite achieving the third-best recall on the Semeval-2016 dataset, our method has higher precision than the TaxoEnrich method by more than 8%, with a 2.04% lower recall. Additionally, the precision of the expanded edges is more important than the number of them.
Domain Taxonomy Expansion. Our method is evaluated on the Meituan platform using 3 million query-click pairs collected from user logs within a span of 3 months. The size of real-world product taxonomies increases from 42,714 to 120,872 edges after applying our model.
5.3. Ablation Studies
To assess the impact of each component, an ablation analysis is conducted on our method. Specifically, we remove one component and assess the effectiveness of the remaining combination of components. Table 2 presents the results of these experiments.
From the table, we conclude that: 1) eliminating any component or task decreases performance, highlighting their importance. 2) Visual features are the most critical component, as their removal leads to the highest drop in performance compared to other components. To verify our assumption, prototypes and images are removed to remove the visual features. The resulting model’s performance is then compared to that of our proposed method. Therefore, removing visual features leads to a significant drop in the accuracy and F1 score by 6.55% and 6.6%, respectively. The result confirms that visual semantics play a crucial role in taxonomy expansion tasks. 3) The proposed Visual Prototype learning and Hyper-Proto Constraint improve overall performance, pointing out that they extract crucial visual semantics information. Without HPC, accuracy drops by 1.95%, and F1 score drops by 1.47%. However, without visual prototype learning, the model obtains higher recall but lower precision, highlighting the likelihood of encountering the ”Prototypical Hypernym Problem.” 4) Without our representation fusion methods, the model’s performance slightly drops, demonstrating that the representation fusion methods generate informative representations.
5.4. Detailed Analysis
In this part, we analyze the impact of the three proposed representation learning tasks.
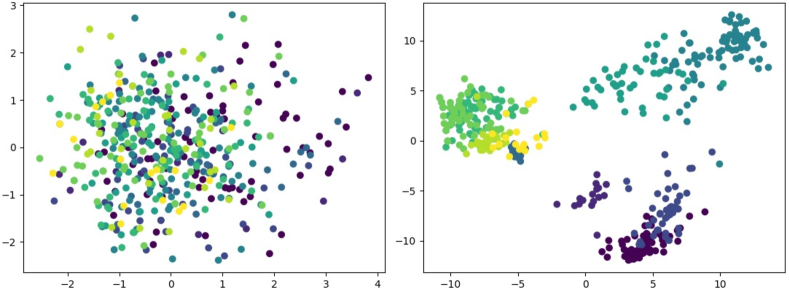
Textual Representation Analysis. Figure 3 illustrates the textual representations before and after training, depicting the textual representation of the Chinese taxonomy dataset’s training data using PCA. We select the top ten hypernyms with the highest number of hyponyms as classes in this visualization. The figure demonstrates that the Textual Hypernymy Learning task groups semantically similar hyponyms into clusters and distinguishes different hypernyms, which proves the effectiveness of the task. Notably, some classes are closer to each other because they represent semantically similar hypernyms themselves.
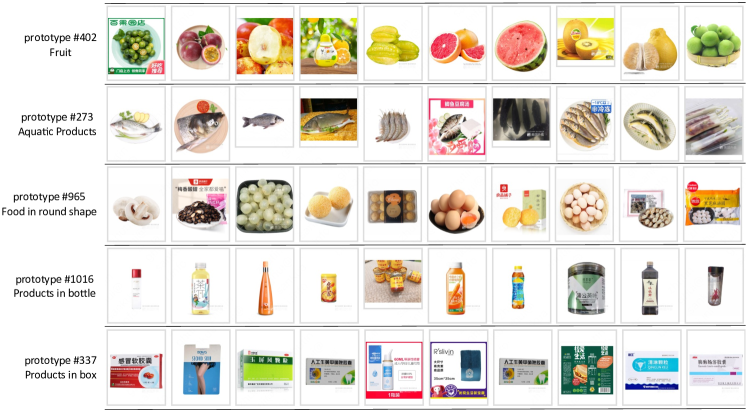
Prototype Analysis. To visualize the correspondence between prototypes and images, we select five prototypes from the prototype embedding table and display the images assigned to each prototype cluster in Figure 5, where each line corresponds to a distinct prototype. Some prototypes correspond to textual concepts (e.g. prototype #402 and #273), while others represent distinctive visual semantics (e.g. prototype #965 and #1016). For example, prototype #402 belongs to a fruit subclass, and prototype #1016 depicts products in bottles that are not represented by textual semantics. More specifically, given the example input of Fruit and Apple Juice in Figure 1, Fruit may correspond to prototype #402, whereas Apple Juice may correspond to prototype #1016, facilitating their distinction. These unique visual semantics present an alternate way to view a term, enhancing the capability to define an unfamiliar term and distinguish a “Prototypical Hypernym.”
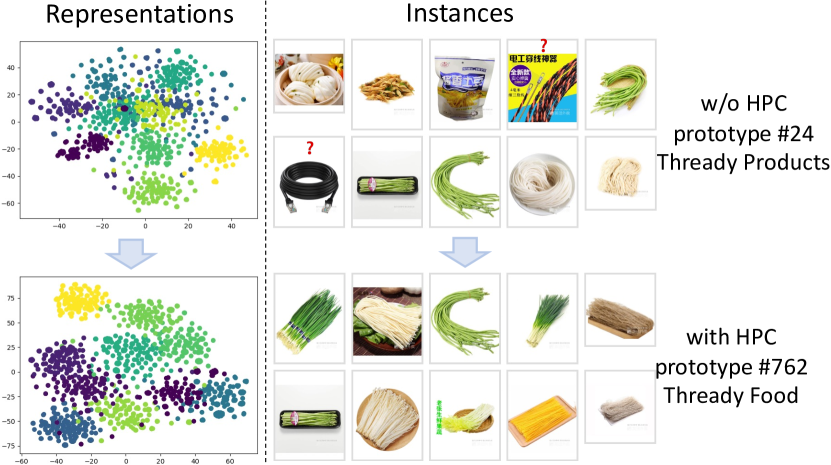
Constraint Analysis. To demonstrate the effectiveness of the proposed HPC, we visualize the visual representations using t-SNE and select the top ten clusters based on the number of instances. We also compare prototypes representing similar visual semantics from models with and without HPC. The visualization is presented in Figure 4. The visual representations, portraying more separate clusters, indicate that HPC enhances the model’s ability to cluster identical images and separates the clusters further. From the instances given in the figure, two prototypes representing “thready objects” are presented. However, with HPC, images of USB Cable and Rope are excluded from the cluster, shifting the cluster’s semantics from “thready products” to “thready food”. This suggests that HPC encourages visual prototypes to convey more fine-grained semantics, showing the effectiveness of the HPC.
Comparison with ChatGPT (Ouyang et al., 2022). To compare with the current state-of-the-art large language model, we conduct experiments on the Chinese taxonomy dataset, using “gpt-3.5-turbo”. The results presented in Table 3 conclude that ChatGPT’s mighty power becomes ineffective when compared with our method. Specifically, despite that multiple samples are given in the prompt, the resulting accuracy drops by 3.2%, and the F1 score declines by 4.3%, highlighting the importance of visual semantics.
5.5. Case Study
| Corrected Cases | Wrong Cases | ||||||||||
|---|---|---|---|---|---|---|---|---|---|---|---|
| Type | Hyper | Hypo | Truth | Ours | BERT | Type | Hyper | Hypo | Truth | Ours | BERT |
| UT | Biscuit | Japanese Mochi | ✓ | ✓ | ✗ | MI | Fruit Shop | Watermelon Cut | ✗ | ✓ | ✗ |
| UT | Lunch Box | Stainless Steel Snack Cup | ✓ | ✓ | ✗ | MI | Swelling | Yunnan Baiyao Ointment | ✗ | ✓ | ✓ |
| PH | Foam | Foaming Gel | ✗ | ✗ | ✓ | LoS | Kanto Cooking | Fish Roe Lucky Bag | ✓ | ✗ | ✓ |
| PH | Loquat | Strong Loquat Lotion | ✗ | ✗ | ✓ | LoS | Baby Products | Piggy Page CD | ✓ | ✗ | ✗ |
To provide a more comprehensible view of the efficiency of our assumption, we present the overall performance improvement, and some cases from the Chinese taxonomy dataset in Table 4 for comparison against the BERT+MLP baseline.
From the statistics of 2,000 test cases, 284 samples have been corrected, whereas only 46 cases were incorrectly predicted, which reaffirms the efficacy of our proposed model in expanding visual taxonomy.
The influence of visual semantics integration can be illustrated further by analyzing some cases in greater detail. The corrected cases can be divided into two categories: 1) Images provide additional semantics for the model. For instance, the hyponym Japanese Mochi cannot be linked with the hypernym Biscuit with mere textual semantics. However, by introducing the image of Japanese Mochi, which resembles the other hyponyms of Biscuit, our model effectively predicts Japanese Mochi as a hyponym of Biscuit. 2) Images differentiate between similar ”prototypical hypernyms”. For example, the corrected negative case involves Strong Loquat Lotion that shares similarities in textual semantics with its candidate hypernym Loquat. When visual features are added, the model is still able to differentiate between the two similar terms.
However, it is important to note that incorporating visual semantics into taxonomy expansion may also result in inaccurate predictions, which can be divided into two categories. 1) Vague images may lead to misleading visual semantics. For instance, our proposed method may predict Watermelon Cut as a hyponym of a Fruit Shop as a result of the fruit pictures in the hyponyms of a Fruit Shop. This was observed in our preliminary experiments, and we develop a heuristic fusion method in section 4.4 to address this issue. 2) There are cases where neither textual nor visual semantics can identify the hypernymy relations, such as the example of Piggy Page CD. In such cases, neither the BERT model nor images can provide detailed semantics.
6. Conclusions
This paper introduces visual features into the taxonomy expansion task by proposing a contrastive multitask framework. The framework clusters textual and visual semantics on their respective modalities and bridges the gap between them. Experimental results demonstrate that our proposed framework outperforms state-of-the-art results on numerous datasets. Additionally, visualization analysis confirms that visual features provide diverse semantics.
7. Acknowledgements
This work is supported by Shanghai Municipal Science and Technology Major Project (No. 2021SHZDZX0103), Science and Technology Commission of Shanghai Municipality Grant (No. 22511105902), and Shanghai Sailing Program (No. 23YF1409400).
References
- (1)
- Agichtein and Gravano (2000) Eugene Agichtein and Luis Gravano. 2000. Snowball: Extracting Relations from Large Plain-Text Collections. In Proceedings of the Fifth ACM Conference on Digital Libraries (San Antonio, Texas, USA) (DL ’00). Association for Computing Machinery, New York, NY, USA, 85–94. https://doi.org/10.1145/336597.336644
- Bollacker et al. (2008) Kurt Bollacker, Colin Evans, Praveen Paritosh, Tim Sturge, and Jamie Taylor. 2008. Freebase: a collaboratively created graph database for structuring human knowledge. In Proceedings of the 2008 ACM SIGMOD international conference on Management of data. 1247–1250.
- Bordea et al. (2016) Georgeta Bordea, Els Lefever, and Paul Buitelaar. 2016. SemEval-2016 Task 13: Taxonomy Extraction Evaluation (TExEval-2). In Proceedings of the 10th International Workshop on Semantic Evaluation (SemEval-2016). Association for Computational Linguistics, San Diego, California, 1081–1091. https://doi.org/10.18653/v1/S16-1168
- Cheng et al. (2022) S. Cheng, Z. Gu, B. Liu, R. Xie, W. Wu, and Y. Xiao. 2022. Learning What You Need from What You Did: Product Taxonomy Expansion with User Behaviors Supervision. In 2022 IEEE 38th International Conference on Data Engineering (ICDE). IEEE Computer Society, Los Alamitos, CA, USA, 3280–3293. https://doi.org/10.1109/ICDE53745.2022.00310
- Cocos et al. (2018) Anne Cocos, Marianna Apidianaki, and Chris Callison-Burch. 2018. Comparing Constraints for Taxonomic Organization. In Proceedings of the 2018 Conference of the North American Chapter of the Association for Computational Linguistics: Human Language Technologies, Volume 1 (Long Papers). Association for Computational Linguistics, New Orleans, Louisiana, 323–333. https://doi.org/10.18653/v1/N18-1030
- Devlin et al. (2019) Jacob Devlin, Ming-Wei Chang, Kenton Lee, and Kristina Toutanova. 2019. BERT: Pre-training of Deep Bidirectional Transformers for Language Understanding. arXiv:1810.04805 [cs.CL]
- He et al. (2015) Kaiming He, Xiangyu Zhang, Shaoqing Ren, and Jian Sun. 2015. Deep Residual Learning for Image Recognition. arXiv:1512.03385 [cs.CV]
- Hearst (1992) Marti A. Hearst. 1992. Automatic Acquisition of Hyponyms from Large Text Corpora. In COLING 1992 Volume 2: The 14th International Conference on Computational Linguistics. https://aclanthology.org/C92-2082
- Jiang et al. (2022) Minhao Jiang, Xiangchen Song, Jieyu Zhang, and Jiawei Han. 2022. TaxoEnrich: Self-Supervised Taxonomy Completion via Structure-Semantic Representations. In Proceedings of the ACM Web Conference 2022 (Virtual Event, Lyon, France) (WWW ’22). Association for Computing Machinery, New York, NY, USA, 925–934. https://doi.org/10.1145/3485447.3511935
- Jin et al. (2018) Wengong Jin, Regina Barzilay, and Tommi Jaakkola. 2018. Junction tree variational autoencoder for molecular graph generation. In International conference on machine learning. PMLR, 2323–2332.
- Kingma and Ba (2014) Diederik P. Kingma and Jimmy Ba. 2014. Adam: A Method for Stochastic Optimization. https://doi.org/10.48550/ARXIV.1412.6980
- Levy et al. (2015) Omer Levy, Steffen Remus, Chris Biemann, and Ido Dagan. 2015. Do Supervised Distributional Methods Really Learn Lexical Inference Relations?. In Proceedings of the 2015 Conference of the North American Chapter of the Association for Computational Linguistics: Human Language Technologies. Association for Computational Linguistics, Denver, Colorado, 970–976. https://doi.org/10.3115/v1/N15-1098
- Lipscomb (2000) Carolyn E Lipscomb. 2000. Medical subject headings (MeSH). Bulletin of the Medical Library Association 88, 3 (2000), 265.
- Luu et al. (2016) Anh Tuan Luu, Yi Tay, Siu Cheung Hui, and See Kiong Ng. 2016. Learning Term Embeddings for Taxonomic Relation Identification Using Dynamic Weighting Neural Network. In Proceedings of the 2016 Conference on Empirical Methods in Natural Language Processing. Association for Computational Linguistics, Austin, Texas, 403–413. https://doi.org/10.18653/v1/D16-1039
- Ma et al. (2021) Mingyu Derek Ma, Muhao Chen, Te-Lin Wu, and Nanyun Peng. 2021. HyperExpan: Taxonomy Expansion with Hyperbolic Representation Learning. In Findings of the Association for Computational Linguistics: EMNLP 2021. Association for Computational Linguistics, Punta Cana, Dominican Republic, 4182–4194. https://doi.org/10.18653/v1/2021.findings-emnlp.353
- Manzoor et al. (2020) Emaad A. Manzoor, Rui Li, Dhananjay Shrouty, and Jure Leskovec. 2020. Expanding Taxonomies with Implicit Edge Semantics. In WWW ’20: The Web Conference 2020, Taipei, Taiwan, April 20-24, 2020, Yennun Huang, Irwin King, Tie-Yan Liu, and Maarten van Steen (Eds.). ACM / IW3C2, 2044–2054. https://doi.org/10.1145/3366423.3380271
- Mao et al. (2018) Yuning Mao, Xiang Ren, Jiaming Shen, Xiaotao Gu, and Jiawei Han. 2018. End-to-End Reinforcement Learning for Automatic Taxonomy Induction. In Proceedings of the 56th Annual Meeting of the Association for Computational Linguistics (Volume 1: Long Papers). Association for Computational Linguistics, Melbourne, Australia, 2462–2472. https://doi.org/10.18653/v1/P18-1229
- Miller (1995) George A Miller. 1995. WordNet: a lexical database for English. Commun. ACM 38, 11 (1995), 39–41.
- Nakashole et al. (2012) Ndapandula Nakashole, Gerhard Weikum, and Fabian Suchanek. 2012. PATTY: A Taxonomy of Relational Patterns with Semantic Types. In Proceedings of the 2012 Joint Conference on Empirical Methods in Natural Language Processing and Computational Natural Language Learning. Association for Computational Linguistics, Jeju Island, Korea, 1135–1145. https://aclanthology.org/D12-1104
- Ouyang et al. (2022) Long Ouyang, Jeff Wu, Xu Jiang, Diogo Almeida, Carroll L. Wainwright, Pamela Mishkin, Chong Zhang, Sandhini Agarwal, Katarina Slama, Alex Ray, John Schulman, Jacob Hilton, Fraser Kelton, Luke Miller, Maddie Simens, Amanda Askell, Peter Welinder, Paul Christiano, Jan Leike, and Ryan Lowe. 2022. Training language models to follow instructions with human feedback. arXiv:2203.02155 [cs.CL]
- Panchenko et al. (2016) Alexander Panchenko, Stefano Faralli, Eugen Ruppert, Steffen Remus, Hubert Naets, Cédrick Fairon, Simone Paolo Ponzetto, and Chris Biemann. 2016. TAXI at SemEval-2016 Task 13: a Taxonomy Induction Method based on Lexico-Syntactic Patterns, Substrings and Focused Crawling. In Proceedings of the 10th International Workshop on Semantic Evaluation (SemEval-2016). Association for Computational Linguistics, San Diego, California, 1320–1327. https://doi.org/10.18653/v1/S16-1206
- Roller et al. (2014) Stephen Roller, Katrin Erk, and Gemma Boleda. 2014. Inclusive yet selective: Supervised distributional hypernymy detection. In Proceedings of COLING 2014, the 25th international conference on computational linguistics: Technical papers. 1025–1036.
- Shang et al. (2020) Chao Shang, Sarthak Dash, Md. Faisal Mahbub Chowdhury, Nandana Mihindukulasooriya, and Alfio Gliozzo. 2020. Taxonomy Construction of Unseen Domains via Graph-based Cross-Domain Knowledge Transfer. In Proceedings of the 58th Annual Meeting of the Association for Computational Linguistics. Association for Computational Linguistics, Online, 2198–2208. https://doi.org/10.18653/v1/2020.acl-main.199
- Shen et al. (2020) Jiaming Shen, Zhihong Shen, Chenyan Xiong, Chi Wang, Kuansan Wang, and Jiawei Han. 2020. TaxoExpan: Self-Supervised Taxonomy Expansion with Position-Enhanced Graph Neural Network. In Proceedings of The Web Conference 2020 (Taipei, Taiwan) (WWW ’20). Association for Computing Machinery, New York, NY, USA, 486–497. https://doi.org/10.1145/3366423.3380132
- Shen et al. (2019) Jiaming Shen, Zeqiu Wu, Dongming Lei, Jingbo Shang, Xiang Ren, and Jiawei Han. 2019. SetExpan: Corpus-Based Set Expansion via Context Feature Selection and Rank Ensemble. arXiv:1910.08192 [cs.CL]
- Shwartz et al. (2016) Vered Shwartz, Yoav Goldberg, and Ido Dagan. 2016. Improving Hypernymy Detection with an Integrated Path-based and Distributional Method. In Proceedings of the 54th Annual Meeting of the Association for Computational Linguistics (Volume 1: Long Papers). Association for Computational Linguistics, Berlin, Germany, 2389–2398. https://doi.org/10.18653/v1/P16-1226
- Song et al. (2021) Xiangchen Song, Jiaming Shen, Jieyu Zhang, and Jiawei Han. 2021. Who Should Go First? A Self-Supervised Concept Sorting Model for Improving Taxonomy Expansion. arXiv:2104.03682 [cs.CL]
- Yu et al. (2020) Yue Yu, Yinghao Li, Jiaming Shen, Hao Feng, Jimeng Sun, and Chao Zhang. 2020. STEAM: Self-Supervised Taxonomy Expansion with Mini-Paths. In Proceedings of the 26th ACM SIGKDD International Conference on Knowledge Discovery & Data Mining (Virtual Event, CA, USA) (KDD ’20). Association for Computing Machinery, New York, NY, USA, 1026–1035. https://doi.org/10.1145/3394486.3403145
- Zeng et al. (2021) Qingkai Zeng, Jinfeng Lin, Wenhao Yu, Jane Cleland-Huang, and Meng Jiang. 2021. Enhancing Taxonomy Completion with Concept Generation via Fusing Relational Representations. In Proceedings of the 27th ACM SIGKDD Conference on Knowledge Discovery & Data Mining (Virtual Event, Singapore) (KDD ’21). Association for Computing Machinery, New York, NY, USA, 2104–2113. https://doi.org/10.1145/3447548.3467308
- Zhang et al. (2021a) Jieyu Zhang, Xiangchen Song, Ying Zeng, Jiaze Chen, Jiaming Shen, Yuning Mao, and Lei Li. 2021a. Taxonomy Completion via Triplet Matching Network. In Thirty-Fifth AAAI Conference on Artificial Intelligence, AAAI 2021, Thirty-Third Conference on Innovative Applications of Artificial Intelligence, IAAI 2021, The Eleventh Symposium on Educational Advances in Artificial Intelligence, EAAI 2021, Virtual Event, February 2-9, 2021. AAAI Press, 4662–4670. https://ojs.aaai.org/index.php/AAAI/article/view/16596
- Zhang et al. (2021b) Oliver Zhang, Mike Wu, Jasmine Bayrooti, and Noah Goodman. 2021b. Temperature as Uncertainty in Contrastive Learning. https://doi.org/10.48550/ARXIV.2110.04403
- Zhang et al. (2017) Xiangling Zhang, Yueguo Chen, Jun Chen, Xiaoyong Du, Ke Wang, and Ji-Rong Wen. 2017. Entity Set Expansion via Knowledge Graphs. In Proceedings of the 40th International ACM SIGIR Conference on Research and Development in Information Retrieval (Shinjuku, Tokyo, Japan) (SIGIR ’17). Association for Computing Machinery, New York, NY, USA, 1101–1104. https://doi.org/10.1145/3077136.3080732
Appendix A Datasets Construction
In this section, we introduce the constructed dataset from Meituan for the taxonomy expansion task. Moreover, we refine a public dataset, namely the Semeval-2016 task 13, to verify the robustness of our method.
A.1. Chinese Taxonomy Dataset
To establish a sizeable product taxonomy dataset comprising images, we rely on the Meituan platform, one of the world’s most extensive life service platforms. We will introduce how we build the training, evaluation and test set.
Our training set draw from the existing Meituan product taxonomy, which comprise about 600,000 edges. However, our observations reveal that 91.67% of these edges follow the suffix pattern, indicating that the hyponym ends with the hypernym. We define these as suffix hypernymy relations that can be readily resolved through simple string matching. To promote diversity, we eliminate all suffix hypernymy relations and expande our focus on non-suffix hypernymy relations. We obtain the associated term images using a targeted image search within the Meituan scenario, where the designated term image is the retrieved product image. With the suffix hypernymy relations eliminated and the images collected, our final training set have 10,697 non-suffix hypernymy pairs, each with a corresponding hyponym image.
For the evaluation and test set, we use user click logs from the Meituan platform, filtered all query-click pairs with the suffix pattern, and ensure that the query is a node within the pre-existing taxonomy. We annotate 2,500 query-click pairs selected at random by five domain experts, where 500 pairs are assigned to the evaluation set.
A.2. Semeval-2016 Dataset
We construct the Semeval-2016 dataset to evaluate the stability and effectiveness of our proposed solution, based on Semeval-2016 task 13 (Bordea et al., 2016). However, this dataset does not contain images for the terms, nor does it have a designated test set. In order to incorporate visual features and establish a test set, we implement a bootstrapping approach. Starting from a randomly selected leaf node from the taxonomy, we take note of its parent node, then remove it from the taxonomy. This process is iterated until 20% of the nodes have been removed from the taxonomy and deemed suitable for use as the test set. The remaining 80% of nodes are allocated for the training set. To enhance the visual representation of each term, we search for each term on Google Images222https://images.google.com. The first image returned by the search engine is used as the representative image for each term, given that the search engine has a ranking system that orders images by relevance.