The Gas Accretion Rate of Star-forming Galaxies over the last 4 Gyr
Abstract
Star-forming galaxies are believed to replenish their atomic gas reservoir, which is consumed in star-formation, through accretion of gas from their circumgalactic mediums (CGMs). However, there are few observational constraints today on the gas accretion rate in external galaxies. Here, we use our recent measurement of the scaling relation between the atomic hydrogen (Hi) mass and the stellar mass in star-forming galaxies at , with the relations between the star-formation rate (SFR) and , and the molecular gas mass and , and the assumption that star-forming galaxies evolve along the main sequence, to determine the evolution of the neutral gas reservoir and the average net gas accretion rate onto the disks of star-forming galaxies over the past 4 Gyr. For galaxies with today, we find that both and in the disk have increased, while has decreased, since . The average gas accretion rate onto the disk over the past 4 Gyr is similar to the average SFR over this period, implying that main-sequence galaxies have maintained a stable Hi reservoir, despite the consumption of gas in star-formation. We obtain an average net gas accretion rate (over the past 4 Gyr) of yr-1 for galaxies with the stellar mass of the Milky Way. At low redshifts, , the reason for the decline in the cosmic SFR density thus appears to be the inefficiency in the conversion of atomic gas to molecular gas, rather than insufficient gas accretion from the CGM.
1 Introduction
Neutral gas is the primary constituent of the interstellar medium (ISM) of star-forming galaxies. It provides the raw material for star-formation, and is consumed in the process. The gas reservoir is expected to be replenished through accretion of gas from the circumgalactic medium (CGM) onto the ‘disks’ of galaxies. The accretion may occur either through cooling of the hot virialized gas in the CGM (the “hot mode”; e.g. Rees & Ostriker, 1977; White & Rees, 1978) or through gas inflow along cold filaments (the “cold mode”; e.g. Binney, 1977; Birnboim & Dekel, 2003; Kereš et al., 2005). However, observational evidence for gas accretion in external galaxies has been scarce, partly because the inflowing gas is diffuse and difficult to detect, and partly due to the lack of unambiguous signatures of accretion. Indirect evidence of gas accretion onto galaxy disks has been found in several recent studies (e.g. Cheung et al., 2016; Spring & Michałowski, 2017; Kleiner et al., 2017; Rahmani et al., 2018; Zahedy et al., 2019). Indeed, insufficient gas accretion to replenish the neutral gas reservoir of galaxies has been proposed to explain the observed decline in the cosmic star-formation rate (SFR) density at (e.g. Chowdhury et al., 2020, 2022a, 2022b).
Scoville et al. (2017) introduced an interesting approach to determine the gas accretion rate as a function of redshift, using dust continuum measurements to infer the ISM masses of galaxies (via an assumed dust-to-gas ratio) and then fitting for the dependence of the ISM mass on the galaxy redshift, stellar mass, and offset from the star-forming main sequence (see also Scoville et al., 2023). They combined the above scaling relation with the assumption of the continuity of main-sequence evolution to infer the gas accretion rate in main-sequence galaxies. We note that the continuity of the main sequence is a standard assumption in the literature (e.g. Renzini, 2009; Peng et al., 2010; Leitner, 2012a; Speagle et al., 2014; Ciesla et al., 2017), with support from both observational evidence (e.g. Rodighiero et al., 2011) and hydrodynamical simulations (e.g. Sparre et al., 2015; Tacchella et al., 2016). However, the dust-to-gas ratio is known to depend critically on galaxy metallicity; the calibration of the ISM mass is thus only applicable to massive galaxies, with near-solar metallicity (stellar mass, at high redshifts; Scoville et al., 2017). Further, even for galaxies with near-solar metallicity in the central regions, the dust-to-gas ratio in the outer disk (which contains a significant fraction of the atomic phase) would be lower than in the central regions (Draine et al., 2007). As noted by Scoville et al. (2017, 2023), the inferred ISM masses are applicable to the inner disks of galaxies, where the assumption of near-solar metallicity is reasonable. The total ISM mass is hence likely to be under-estimated by this approach.
The atomic phase (made up of mainly atomic hydrogen, Hi, and helium) is known to dominate the neutral gas reservoir in main-sequence star-forming galaxies at , accounting for of the neutral gas mass (e.g. Saintonge et al., 2017; Catinella et al., 2018). Measurements of the dependence of the Hi mass of galaxies on the stellar mass and redshift would thus provide a more reliable way of determining the gas accretion rate, compared to the estimates of the total ISM mass. In the local Universe, the dependence of the Hi mass () on the stellar mass () has been determined via studies of individual galaxies in the Hi 21 cm line (e.g. Catinella et al., 2018; Parkash et al., 2018). Unfortunately, the weakness of this line, the main probe of the Hi mass of galaxies, has meant that it is very difficult to determine such Hi scaling relations at cosmological distances via studies of individual galaxies.
We have recently applied the technique of Hi 21 cm stacking (Zwaan, 2000; Chengalur et al., 2001) to Hi 21 cm data from a deep Giant Metrewave Radio Telescope (GMRT) survey of the Extended Groth Strip (EGS; Bera et al., 2019, 2022) to determine the scaling relation for star-forming galaxies at (Bera et al., 2023, see also Sinigaglia et al. (2022); Chowdhury et al. (2022c)). In this Letter, we use this relation, with the main-sequence relation, the scaling relation between molecular gas mass and stellar mass, and the assumption of the continuity of main-sequence evolution, to study the evolution of the different baryonic components of star-forming galaxies over the past 4 Gyr, and to determine the average gas accretion rate over this period.111Throughout this work, we use a flat -cold dark matter (CDM) cosmology, with (, , km s-1 Mpc-1, . Further, all stellar mass and SFR estimates assume a Chabrier initial mass function (Chabrier, 2003).
2 The evolution of the baryonic content of galaxies
The baryonic mass of a galaxy is made up of stars, atomic gas, molecular gas, and ionized gas, with a small contribution from interstellar dust. While the stars and the neutral atomic and molecular gas are predominantly found in the disk of a galaxy, the ionized gas is found in both the disk and the CGM. The baryonic content of a galaxy increases due to accretion of gas from the CGM and the intergalactic medium, and can decrease due to gas outflows driven by supernovae or stellar winds. The net amount of gas accreted over a given time is the difference between the amount of gas accreted and the amount of gas lost in outflows; we will combine these effects to describe the evolution of the net accreted gas mass, . The change in the total baryonic content in the disk of a galaxy over a given time can then be written as
| (1) |
where , , , and are the changes in, respectively, the stellar mass , the atomic gas mass , the molecular gas , and the ionized gas mass , over this time. is the Hi mass and the factor of 1.38 in accounts for the contribution of helium. Finally, the factor accounts for the fraction of stellar mass that is returned to the gas phase (see below; Leitner & Kravtsov, 2011; Scoville et al., 2017).
In the above equation, the stellar mass of a star-forming galaxy is expected to increase with time, at the expense of the neutral gas mass, along with some mass loss due to stellar winds and supernovae. The molecular gas mass increases at the expense of the atomic gas mass, and decreases due to star-formation. The neutral atomic gas mass decreases via conversion to molecular gas, but increases through accretion onto the disk. Finally, the ionized gas mass decreases due to conversion to the neutral atomic phase, but increases due to stellar and supernova-driven outflows. We will neglect the ionized gas mass in what follows, as its mass in the disk is expected to be much lower than the neutral gas mass (e.g. Draine, 2011).
Using the main-sequence relation and its redshift evolution, and the and scaling relations at any pair of redshifts, we can determine the changes in the stellar mass, the neutral atomic gas mass, and the neutral molecular gas mass of galaxies over the redshift range, as a function of their stellar mass. Finally, substituting for , , and in Equation 1 would yield the net gas mass accreted by galaxies between the two redshifts, and thus the average net gas accretion rate. We will apply this formalism to the redshift range , to determine the net average gas accretion rate over the last 4 Gyr.
2.1 Stellar mass build-up along the main sequence
Star-forming galaxies are known to show a tight correlation between the SFR and , known as the main sequence (e.g. Madau & Dickinson, 2014). The main-sequence relation has been shown to exist out to (e.g. Popesso et al., 2023), and is known to evolve with redshift; the evolution has been described using various parametric forms (e.g. Whitaker et al., 2012, 2014; Lee et al., 2015; Leslie et al., 2020; Popesso et al., 2023). Star-forming field galaxies are thought to evolve along the main sequence, i.e. as their stellar mass increases, their SFR changes accordingly to keep them on the main sequence. The knowledge of the redshift evolution of the main-sequence relation can hence be used to trace the stellar-mass history of present-day main-sequence galaxies over their lifetimes (see, e.g., Renzini, 2009; Peng et al., 2010; Leitner, 2012b; Speagle et al., 2014; Scoville et al., 2017, 2023).
Following Scoville et al. (2017, 2023), we will restrict ourselves to main-sequence galaxies and assume the principle of continuity of main-sequence evolution. We will ignore both major mergers222The rate of major mergers is not significant for star-forming galaxies in the stellar mass range considered in this work (e.g. Rodriguez-Gomez et al., 2015); the stellar mass growth is dominated by star-formation for these galaxies (Guo & White, 2008). (which can remove galaxies from the main sequence) and the quenching of star-formation activity. Assuming that today’s main-sequence galaxies were also on the main sequence 4 Gyr ago, i.e. at , we can use the redshift-dependent main-sequence relation to estimate the net change in their stellar masses from to . The increase in the stellar mass of a main-sequence galaxy from to the present epoch is given by
| (2) |
where and are the initial (at ) and final (at ) stellar masses of the galaxy, respectively, is the redshift-dependent main-sequence relation, and is the fraction of stellar mass that is returned to the gas phase via stellar winds or supernovae. The value of depends on the initial mass function and typically lies in the range (see, e.g., Madau & Dickinson, 2014). Here, we assume , applicable for a Chabrier initial mass function (Leitner & Kravtsov, 2011)333Our results do not change significantly if a different value of , within the range , is assumed.. We also assume that this processed gas is not available for further star-formation (e.g. Scoville et al., 2017). We use the redshift-dependent main-sequence relation of Whitaker et al. (2012)444Errors associated with the main-sequence relation have been ignored in this work. Uncertainties in the scaling relations dominate the total errors in our final results.,
| (3) |
where and , to determine the stellar mass at of main-sequence galaxies with present-day stellar mass . We restrict to galaxies with , for which the local scaling relation has been robustly measured today (e.g. Catinella et al., 2018; Parkash et al., 2018). Using Equation 2, this corresponds to galaxies with stellar masses at .
2.2 Molecular gas scaling relations
The evolution of the molecular gas content of main-sequence galaxies has been quantified through measurements of the redshift-dependent scaling relation between and (e.g. Genzel et al., 2015; Tacconi et al., 2018). The molecular gas mass of galaxies is typically estimated from the CO rotational lines, the far-infrared dust continuum emission, or the mm dust continuum (see Tacconi et al., 2020, for a review). We used the redshift-dependent scaling relation555This relation includes the contribution of helium (Tacconi et al., 2020). connecting the ratio of the molecular gas mass to the stellar mass, of a galaxy to its stellar mass (Tacconi et al., 2020),
| (4) |
where , , , and , to determine the molecular gas mass of a main-sequence galaxy from its stellar mass.666Note that we assume that the offset of each galaxy from the main sequence is zero. For each galaxy with present-day stellar mass , we can combine Equations 3 and 4 to determine its molecular gas mass at and , and thus estimate the change in its molecular gas mass between and from the relation
| (5) |
where and are again the initial (at ) and final (at ) stellar masses, respectively, and can be inferred from Equation 4.
2.3 Atomic gas scaling relations
For neutral atomic gas, the scaling relation is known at from direct Hi 21 cm emission studies of individual galaxies (e.g. Catinella et al., 2018; Parkash et al., 2018). We will use the relation obtained for blue, star-forming galaxies of the xGASS sample (Catinella et al., 2018; Bera et al., 2023)777Note that using the scaling relation of Parkash et al. (2018) does not significantly change our results.
| (6) |
At present, there are no estimates of the relation at cosmological distances, , based on Hi 21 cm studies of individual galaxies. However, we have recently used the GMRT to carry out a deep Hi 21 cm emission survey of the EGS, which yielded an estimate of the “mean” relation in blue, star-forming galaxies at with , based on stacking the Hi 21 cm emission from galaxies in different stellar-mass bins (Bera et al., 2023). As noted by Bera et al. (2023), this mean relation may be combined with an assumed lognormal scatter in the relation to infer the “median” scaling relation, which can be directly compared to the scaling relation obtained from a fit to Hi 21 cm emission measurements in individual galaxies. Assuming a lognormal scatter in the relation at that is equal to that at in the xGASS sample, Bera et al. (2023) give the following median scaling relation for blue, star-forming galaxies at in the EGS,
| (7) |
The net change in the atomic gas mass of a main-sequence galaxy from to can then be estimated using the relation
| (8) |
where and are the initial (at ) and final (at ) Hi masses, respectively, and are the initial and final stellar masses respectively, and is the scaling relation (i.e. Equation 7) at the redshift .
3 The evolution of the baryonic composition of galaxies from
We have used Equations 2–8 to determine the changes in the stellar mass, the molecular gas mass, and the atomic gas mass in the disks of present-day main-sequence galaxies between and . As noted earlier, we assume continuity of main-sequence evolution, i.e. that the galaxies evolve along the main sequence (Scoville et al., 2017, 2023).
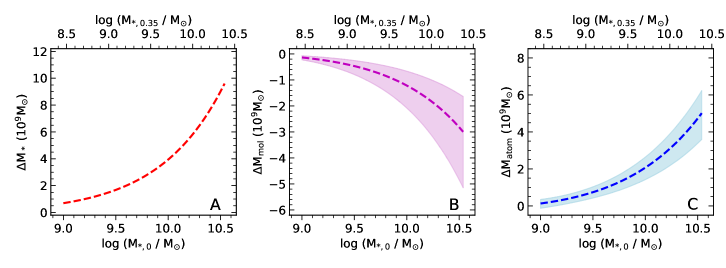
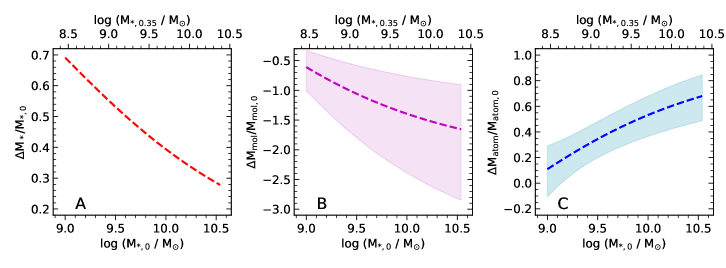
Figures 1[A–C] show, respectively, the changes in the stellar mass , the molecular gas mass , and the atomic gas mass , over the redshift range to , as a function of the stellar mass of galaxies today, . Figures 2[A–C] show, respectively, the fractional changes in the above three quantities (relative to their present-day values) over the same period as a function of the stellar mass today. It is clear (see Figures 1[A] and 2[A]) that the stellar masses of today’s main-sequence galaxies have increased significantly over the past 4 Gyr. Relatively low-mass galaxies, with , have acquired % of their current stellar mass since , while high-mass galaxies, with , have acquired % of their present stellar mass during this period.
Conversely, Figure 1[B] shows that the molecular gas content of all galaxies has declined significantly over the last 4 Gyr. The fractional decline relative to the present-day molecular gas mass is seen (in Figure 2[B]) to be the highest for the highest-mass galaxies, with for . In other words, the molecular gas reservoir of present-day main-sequence galaxies has been steadily consumed by star-formation activity since .
Finally, the solid blue curves (and blue shaded regions) in Figures 1[C] and 2[C] show the evolution of the atomic gas mass and the fractional atomic gas mass, relative to today’s atomic gas mass, of galaxies over the redshift range . We find that is always positive, implying a net increase in the atomic gas mass of galaxies over the last 4 Gyr for all stellar masses. The fractional change in the atomic gas mass (relative to the atomic gas mass today) is low (%) for low-stellar-mass galaxies (with ), but substantial (%) for the highest-stellar-mass galaxies today.
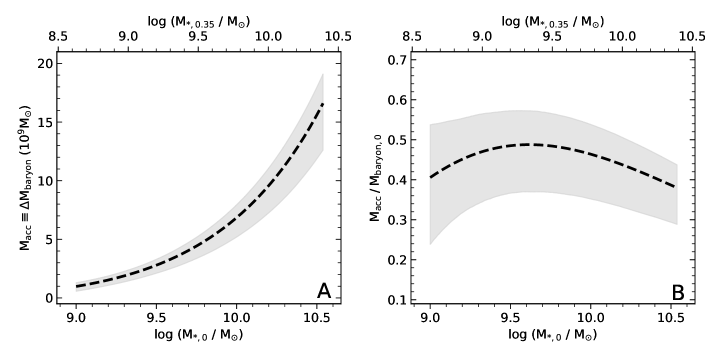
Figure 3[A] plots the change in the total baryonic mass of main-sequence galaxies from to against their stellar mass today, . We note that , the net average gas mass accreted over the last Gyr (i.e. the difference between the gas mass accreted and the gas mass lost due to winds or outflows). The figure shows that all galaxies with stellar mass in the range today have increased their total baryonic mass over the last four Gyr, with the increase being larger for higher stellar masses. However, the fractional change in the total baryonic mass, relative to the baryonic mass today (i.e. ), is seen in Fig. 3[B] to be approximately constant, %, across the above stellar mass range.
For a galaxy of a given stellar mass today, the ratio of to the elapsed time between any two redshifts gives the time-averaged net gas accretion rate between the two redshifts. Fig. 4 plots (dashed black curve) the above average net gas accretion rate from to (i.e. over the last Gyr) as a function of the stellar mass of galaxies today, ; the grey shaded region shows the 68% confidence interval. The dashed red curve shows the average SFR () over the same period, again as a function of the stellar mass today, while the dashed blue curve and blue shaded region show the average net formation rate of molecular hydrogen (i.e. the difference between the formation rate and the destruction rate). The red and black curves are in good agreement, within the errors: this indicates that the average rate of net accretion of gas onto main-sequence galaxies over the last Gyr is sufficient to balance the average SFR in these galaxies. Star-forming galaxies on the main sequence, with today, have thus accreted substantial amounts of gas over the last Gyr to replenish their neutral gas reservoir, maintaining a stable (indeed, slightly increasing) Hi reservoir, despite the continuous consumption of Hi in the star-formation process. We emphasize that this is very unlike the situation towards the end of the epoch of galaxy assembly, , where Chowdhury et al. (2022b) find evidence that insufficient gas accretion is the cause of the decline in the SFR density at .
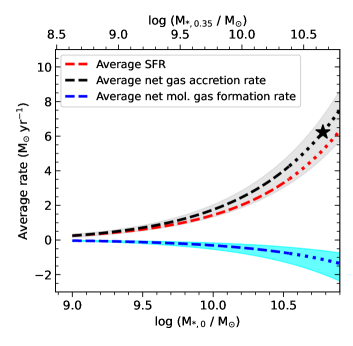
Conversely, it is clear from Fig. 4 that the average net rate of H2 formation over is significantly lower than both the average SFR and the average gas accretion rate. Indeed, the net rate of molecular gas formation is negative, indicating that the atomic-to-molecular gas conversion does not keep pace with the conversion of molecular gas to stars. This implies that it is the inefficient conversion of atomic hydrogen to molecular hydrogen that is likely to be the main cause of the decline in the cosmic SFR density over the last 4 Gyr.
We note that there could be an environmental dependence to the various scaling relations (e.g. Cortese et al., 2011; Catinella et al., 2013). The main-sequence and scaling relations are predominantly based on field galaxies (e.g. Whitaker et al., 2012; Tacconi et al., 2020). We have used the Sloan Digital Sky Survey-DR8 group catalog of Tempel et al. (2012) to find that roughly half of the blue xGASS galaxies used to determine the relation at are field galaxies (see also Catinella et al., 2013). We note that this estimate of % of the xGASS galaxies being field objects is likely to be a lower limit as many of the group galaxies are in “groups” with only members, and may thus well be field galaxies (Tempel et al., 2012). Similarly, Gerke et al. (2012) have used the Voronoi-Delaunay group finder to classify DEEP2 galaxies: of the 260 EGS galaxies used to determine the relation at and that have been classified by Gerke et al. (2012), % are field galaxies (and a significant number of the remaining systems are in groups with members). It thus appears unlikely that the environmental dependence of the scaling relations would significantly affect our results.
The stellar mass of the Milky Way today is (Licquia & Newman, 2015). This lies beyond the stellar mass range at () covered by our results. Assuming that we can extrapolate the Hi scaling relation at to a stellar mass of , we can estimate the average net gas accretion rate of Milky Way-like galaxies over the last Gyr. The results are shown as the dotted curve in Fig. 4. We obtain an average net gas accretion rate of yr-1 (indicated by the star in the figure), over the past 4 Gyr for main-sequence galaxies with the stellar mass of the Milky Way. This is broadly consistent with estimates of the total gas accretion rate onto the Milky Way (e.g. Fox et al., 2014; Richter et al., 2017).
In passing, as noted by Bera et al. (2023), we emphasize that the relation used here is based on a relatively small number of galaxies, and a small cosmic volume, and could hence well be affected by cosmic variance. The possibility of cosmic variance in this relation would affect the present results as well. A wide-field determination of the relation at intermediate redshifts would allow a better estimate of the average gas accretion rate onto the disks of galaxies, using the approach described here.
4 Summary
We present a formalism to determine the evolution of the baryonic composition of star-forming galaxies between any two redshifts, based on the main-sequence relation between SFR and stellar mass, the scaling relation between molecular gas mass and stellar mass, the scaling relation between atomic gas mass and stellar mass, and the assumption that star-forming galaxies continuously evolve along the main sequence. We apply this formalism to our recent estimate of the relation at , to determine the average changes in the stellar, molecular gas, and atomic gas contents of the disks of star-forming galaxies from to , as a function of the galaxy stellar mass today, for the stellar mass range . We find that the stellar and atomic gas masses of today’s main-sequence galaxies have both increased since , while the molecular gas masses of these galaxies have declined over the same period. The fractional increase in the stellar masses (relative to the present-day stellar mass) is % , with larger fractional increases at lower stellar masses, while the fractional increase in the atomic gas masses (relative to the present-day atomic gas mass) is %, with a larger fractional increase at high atomic gas masses.
We combine the changes in the stellar mass, the molecular gas mass, and the atomic gas mass to determine the net change in the baryonic mass of main-sequence galaxies over the last 4 Gyr. We find that the fractional net increase in the baryonic mass of these galaxies, relative to the present-day baryonic mass, is % for stellar masses today of . Finally, we determine the average net gas accretion rate of star-forming galaxies over the last 4 Gyr, finding average net accretion rates of yr-1, similar to the average SFR over this period. The average net gas accretion rate for Milky Way-like galaxies is yr-1 since . We thus find that main-sequence galaxies accrete sufficient amounts of gas over the last Gyr to maintain a stable (and slightly increasing) Hi reservoir, with the gas accretion compensating for the gas consumption via star-formation. The observed decline in the cosmic SFR density over the last Gyr thus appears to arise due to the inefficient conversion from Hi to H2, which does not sufficiently replenish the amount of molecular gas consumed in the process of star-formation.
Acknowledgments
We thank the staff of the GMRT who have made these observations possible. The GMRT is run by the National Centre for Radio Astrophysics of the Tata Institute of Fundamental Research. AB and NK thank Aditya Chowdhury for many discussions on Hi 21 cm stacking that have contributed to this paper. We also thank an anonymous referee whose detailed comments on an earlier version of the manuscript improved the paper. NK acknowledges support from the Department of Science and Technology via a Swarnajayanti Fellowship (DST/SJF/PSA-01/2012-13). AB, NK, JNC also acknowledge the Department of Atomic Energy for funding support, under project 12-R&D-TFR-5.02-0700.
References
- Bera et al. (2019) Bera, A., Kanekar, N., Chengalur, J. N., & Bagla, J. S. 2019, The Astrophysical Journal, 882, L7, doi: 10.3847/2041-8213/ab3656
- Bera et al. (2022) Bera, A., Kanekar, N., Chengalur, J. N., & Bagla, J. S. 2022, ApJ, 940, L10, doi: 10.3847/2041-8213/ac9d32
- Bera et al. (2023) Bera, A., Kanekar, N., Chengalur, J. N., & Bagla, J. S. 2023, ApJL, in press
- Binney (1977) Binney, J. 1977, ApJ, 215, 483, doi: 10.1086/155378
- Birnboim & Dekel (2003) Birnboim, Y., & Dekel, A. 2003, MNRAS, 345, 349, doi: 10.1046/j.1365-8711.2003.06955.x
- Catinella et al. (2013) Catinella, B., Schiminovich, D., Cortese, L., et al. 2013, MNRAS, 436, 34, doi: 10.1093/mnras/stt1417
- Catinella et al. (2018) Catinella, B., Saintonge, A., Janowiecki, S., et al. 2018, MNRAS, 476, 875, doi: 10.1093/mnras/sty089
- Chabrier (2003) Chabrier, G. 2003, PASP, 115, 763, doi: 10.1086/376392
- Chengalur et al. (2001) Chengalur, J. N., Braun, R., & Wieringa, M. 2001, A&A, 372, 768, doi: 10.1051/0004-6361:20010547
- Cheung et al. (2016) Cheung, E., Stark, D. V., Huang, S., et al. 2016, ApJ, 832, 182, doi: 10.3847/0004-637X/832/2/182
- Chowdhury et al. (2022a) Chowdhury, A., Kanekar, N., & Chengalur, J. N. 2022a, ApJ, 937, 103, doi: 10.3847/1538-4357/ac7d52
- Chowdhury et al. (2022b) —. 2022b, ApJ, 931, L34, doi: 10.3847/2041-8213/ac6de7
- Chowdhury et al. (2022c) —. 2022c, ApJ, 941, L6, doi: 10.3847/2041-8213/ac9d8a
- Chowdhury et al. (2020) Chowdhury, A., Kanekar, N., Chengalur, J. N., Sethi, S., & Dwarakanath, K. S. 2020, Nature, 586, 369, doi: 10.1038/s41586-020-2794-7
- Ciesla et al. (2017) Ciesla, L., Elbaz, D., & Fensch, J. 2017, A&A, 608, A41, doi: 10.1051/0004-6361/201731036
- Cortese et al. (2011) Cortese, L., Catinella, B., Boissier, S., Boselli, A., & Heinis, S. 2011, MNRAS, 415, 1797, doi: 10.1111/j.1365-2966.2011.18822.x
- Draine (2011) Draine, B. T. 2011, Physics of the Interstellar and Intergalactic Medium
- Draine et al. (2007) Draine, B. T., Dale, D. A., Bendo, G., et al. 2007, ApJ, 663, 866, doi: 10.1086/518306
- Fox et al. (2014) Fox, A. J., Wakker, B. P., Barger, K. A., et al. 2014, ApJ, 787, 147, doi: 10.1088/0004-637X/787/2/147
- Genzel et al. (2015) Genzel, R., Tacconi, L. J., Lutz, D., et al. 2015, ApJ, 800, 20, doi: 10.1088/0004-637X/800/1/20
- Gerke et al. (2012) Gerke, B. F., Newman, J. A., Davis, M., et al. 2012, ApJ, 751, 50, doi: 10.1088/0004-637X/751/1/50
- Guo & White (2008) Guo, Q., & White, S. D. M. 2008, MNRAS, 384, 2, doi: 10.1111/j.1365-2966.2007.12619.x
- Kereš et al. (2005) Kereš, D., Katz, N., Weinberg, D. H., & Davé, R. 2005, Monthly Notices of the Royal Astronomical Society, 363, 2, doi: 10.1111/j.1365-2966.2005.09451.x
- Kleiner et al. (2017) Kleiner, D., Pimbblet, K. A., Jones, D. H., Koribalski, B. S., & Serra, P. 2017, MNRAS, 466, 4692, doi: 10.1093/mnras/stw3328
- Lee et al. (2015) Lee, N., Sanders, D. B., Casey, C. M., et al. 2015, ApJ, 801, 80, doi: 10.1088/0004-637X/801/2/80
- Leitner (2012a) Leitner, S. N. 2012a, ApJ, 745, 149, doi: 10.1088/0004-637X/745/2/149
- Leitner (2012b) —. 2012b, ApJ, 745, 149, doi: 10.1088/0004-637X/745/2/149
- Leitner & Kravtsov (2011) Leitner, S. N., & Kravtsov, A. V. 2011, ApJ, 734, 48, doi: 10.1088/0004-637X/734/1/48
- Leslie et al. (2020) Leslie, S. K., Schinnerer, E., Liu, D., et al. 2020, ApJ, 899, 58, doi: 10.3847/1538-4357/aba044
- Licquia & Newman (2015) Licquia, T. C., & Newman, J. A. 2015, ApJ, 806, 96, doi: 10.1088/0004-637X/806/1/96
- Madau & Dickinson (2014) Madau, P., & Dickinson, M. 2014, ARA&A, 52, 415, doi: 10.1146/annurev-astro-081811-125615
- Parkash et al. (2018) Parkash, V., Brown, M. J. I., Jarrett, T. H., & Bonne, N. J. 2018, ApJ, 864, 40, doi: 10.3847/1538-4357/aad3b9
- Peng et al. (2010) Peng, Y.-j., Lilly, S. J., Kovač, K., et al. 2010, ApJ, 721, 193, doi: 10.1088/0004-637X/721/1/193
- Popesso et al. (2023) Popesso, P., Concas, A., Cresci, G., et al. 2023, MNRAS, 519, 1526, doi: 10.1093/mnras/stac3214
- Rahmani et al. (2018) Rahmani, H., Péroux, C., Augustin, R., et al. 2018, MNRAS, 474, 254, doi: 10.1093/mnras/stx2726
- Rees & Ostriker (1977) Rees, M. J., & Ostriker, J. P. 1977, MNRAS, 179, 541, doi: 10.1093/mnras/179.4.541
- Renzini (2009) Renzini, A. 2009, MNRAS, 398, L58, doi: 10.1111/j.1745-3933.2009.00710.x
- Richter et al. (2017) Richter, P., Nuza, S. E., Fox, A. J., et al. 2017, A&A, 607, A48, doi: 10.1051/0004-6361/201630081
- Rodighiero et al. (2011) Rodighiero, G., Daddi, E., Baronchelli, I., et al. 2011, ApJ, 739, L40, doi: 10.1088/2041-8205/739/2/L40
- Rodriguez-Gomez et al. (2015) Rodriguez-Gomez, V., Genel, S., Vogelsberger, M., et al. 2015, MNRAS, 449, 49, doi: 10.1093/mnras/stv264
- Saintonge et al. (2017) Saintonge, A., Catinella, B., Tacconi, L. J., et al. 2017, ApJS, 233, 22, doi: 10.3847/1538-4365/aa97e0
- Scoville et al. (2017) Scoville, N., Lee, N., Vanden Bout, P., et al. 2017, ApJ, 837, 150, doi: 10.3847/1538-4357/aa61a0
- Scoville et al. (2023) Scoville, N., Faisst, A., Weaver, J., et al. 2023, ApJ, 943, 82, doi: 10.3847/1538-4357/aca1bc
- Sinigaglia et al. (2022) Sinigaglia, F., Rodighiero, G., Elson, E., et al. 2022, ApJ, 935, L13, doi: 10.3847/2041-8213/ac85ae
- Sparre et al. (2015) Sparre, M., Hayward, C. C., Springel, V., et al. 2015, MNRAS, 447, 3548, doi: 10.1093/mnras/stu2713
- Speagle et al. (2014) Speagle, J. S., Steinhardt, C. L., Capak, P. L., & Silverman, J. D. 2014, ApJS, 214, 15, doi: 10.1088/0067-0049/214/2/15
- Spring & Michałowski (2017) Spring, E. F., & Michałowski, M. J. 2017, MNRAS, 471, L101, doi: 10.1093/mnrasl/slx108
- Tacchella et al. (2016) Tacchella, S., Dekel, A., Carollo, C. M., et al. 2016, MNRAS, 457, 2790, doi: 10.1093/mnras/stw131
- Tacconi et al. (2020) Tacconi, L. J., Genzel, R., & Sternberg, A. 2020, ARA&A, 58, 157, doi: 10.1146/annurev-astro-082812-141034
- Tacconi et al. (2018) Tacconi, L. J., Genzel, R., Saintonge, A., et al. 2018, ApJ, 853, 179, doi: 10.3847/1538-4357/aaa4b4
- Tempel et al. (2012) Tempel, E., Tago, E., & Liivamägi, L. J. 2012, A&A, 540, A106, doi: 10.1051/0004-6361/201118687
- Whitaker et al. (2012) Whitaker, K. E., van Dokkum, P. G., Brammer, G., & Franx, M. 2012, ApJ, 754, L29, doi: 10.1088/2041-8205/754/2/L29
- Whitaker et al. (2014) Whitaker, K. E., Franx, M., Leja, J., et al. 2014, ApJ, 795, 104, doi: 10.1088/0004-637X/795/2/104
- White & Rees (1978) White, S. D. M., & Rees, M. J. 1978, MNRAS, 183, 341, doi: 10.1093/mnras/183.3.341
- Zahedy et al. (2019) Zahedy, F. S., Rauch, M., Chen, H.-W., et al. 2019, MNRAS, 486, 1392, doi: 10.1093/mnras/stz861
- Zwaan (2000) Zwaan, M. A. 2000, PhD thesis, University of Groningen, The Netherlands