A persistent excess of galaxy-galaxy strong lensing observed in galaxy clusters
Abstract
Context. Previous studies have revealed that the estimated probability of galaxy-galaxy strong lensing in observed galaxy clusters exceeds the expectations from the Cold Dark Matter cosmological model by one order of magnitude.
Aims. We aim to understand the origin of this excess by analyzing a larger set of simulated galaxy clusters, and investigating how the theoretical expectations vary under different adopted prescriptions and numerical implementations of star formation and feedback in simulations.
Methods. We performed a ray-tracing analysis of 324 galaxy clusters from the Three Hundred project, comparing the Gadget-X and Gizmo-Simba runs. These simulations, which start from the same initial conditions, were performed with different implementations of hydrodynamics and galaxy formation models tailored to match different observational properties of the intracluster medium and cluster galaxies.
Results. We find that galaxies in the Gizmo-Simba simulations develop denser stellar cores than their Gadget-X counterparts. Consequently, their probability for galaxy-galaxy strong lensing is higher by a factor of . This increment is still insufficient to fill the gap with observations as a discrepancy by a factor still persists. In addition, we find that several simulated galaxies have Einstein radii that are too large compared to observations.
Conclusions. We conclude that a persistent excess of galaxy-galaxy strong lensing exists in observed galaxy clusters. The origin of this discrepancy with theoretical predictions is still unexplained in the framework of the cosmological hydrodynamical simulations. This might signal a hitherto unknown issue with either the simulation methods or our assumptions regarding the standard cosmological model.
Key Words.:
cosmology – dark matter – galaxy clusters – gravitational lensing1 Introduction
In the Cold Dark Matter (CDM) model, dark matter halos form through a hierarchical process in which smaller halos form first and subsequently merge to form larger ones. Consequently, dark matter halos in this framework should contain a hierarchy of substructures (or subhalos) (Giocoli et al., 2008, 2010). Furthermore, numerical simulations show that these subhalos should have cuspy density profiles whose shape is well described by a double power law with a logarithmic slope shallower near the center than in the outskirts. Their concentrations and masses should be anticorrelated (e.g., Navarro et al., 1997; Meneghetti et al., 2014; Wang et al., 2020). These predictions of the CDM model can be tested against observational data on a wide range of scales, ranging from dwarf galaxies to galaxy clusters, employing various techniques. These include counting the satellites in the neighborhood of the Milky Way (Klypin et al., 1999; Moore et al., 1999); detecting signatures of subhalos as perturbations and gaps in stellar streams (e.g., Bonaca et al., 2019); mapping the total mass distribution in galaxy clusters utilizing the galaxy–subhalo connection (e.g., Natarajan & Kneib, 1997; Grillo et al., 2015; Natarajan et al., 2017) or the gravitational imaging technique (e.g., Koopmans, 2005; Vegetti et al., 2012; Hezaveh et al., 2016; Despali et al., 2022); and examining flux-ratio anomalies in strong lensing galaxies (e.g., Mao & Schneider, 1998; Dalal & Kochanek, 2002).
In this letter we focus on a more recent test of the small-scale structure of galaxy clusters proposed by Meneghetti et al. (2020) (hereafter ME20), who used the galaxy-galaxy strong lensing (GGSL) probability as a metric to measure the compactness and abundance of dark-matter subhalos. A few GGSL events per massive galaxy cluster have been detected in deep observations of cluster cores carried out by the Hubble Space Telescope (HST). The observed ability of galaxy clusters to produce such events requires that their galaxy members have total mass distributions compact enough to become critical for strong lensing. Comparing high-fidelity mass reconstructions of strong lensing clusters with results from numerical hydrodynamical simulations, ME20 found that the observed probability of GGSL is higher than expected in the framework of the Cold Dark Matter (CDM) model by nearly one order of magnitude. Some inconsistency also emerged regarding the spatial distribution of cluster galaxies in simulated clusters compared to observations, where observed cluster members appear more centrally concentrated than their simulated counterparts (see also Natarajan et al., 2017).
Bahé (2021) and Robertson (2021) suggested that numerical hydrodynamical simulations with higher mass and spatial resolution, implementing less efficient energy feedback from active galactic nuclei (AGN) compared to the simulations used by ME20, may resolve the above-mentioned discrepancy between theoretical predictions of the GGSL probability and observations. However, Ragagnin et al. (2022) and Meneghetti et al. (2022) (hereafter ME22) used higher-resolution re-simulations of the same clusters employed by ME20, re-calculated the GGSL probability, and found that the results are insensitive to increased resolution. Moreover, they both showed that reducing the efficiency of AGN feedback to suppress star formation actually enhances the GGSL probability in the simulated clusters, but at the price of producing unrealistic overly massive galaxies that do not match the observed cluster member galaxy population.
To further confirm the existence of such a significant discrepancy between galaxy clusters simulated in the framework of the CDM model and observations would signal either an unidentified problem with simulation methods or standard cosmological assumptions. Here we carry out the same analysis as ME20 using two larger sets of simulated galaxy clusters from The Three Hundred project (Cui et al., 2018). The number of lens planes used in the analyses is times larger than in ME20, thus significantly increasing the statistical significance of the results. These simulations were obtained using two independent codes, Gadget (Springel et al., 2005) and Gizmo (Hopkins, 2015). The two codes are based on two completely different hydrodynamical solvers; they also implement very different galaxy formation models tailored to principally reproduce the observed properties of the intracluster medium (ICM) and its scaling relations (Rasia et al., 2015, similar to ME20) and the cluster galaxies (Davé et al., 2019), respectively. It is of utmost importance to investigate whether galaxy formation models that successfully match the cluster members’ stellar properties can confirm the discrepancy found by ME20. This letter is organized as follows. In Sects. 2 and 3 we describe the observational and simulated datasets and summarize the method used to measure the GGSL probability. In Sect. 4 we discuss the results of the comparison between the simulations and observations. Finally, we report our conclusions in Sect. 5.
2 Observational dataset
The observational dataset used in this work comprises five galaxy clusters, namely Abell 2744111For Abell 2744, which has a complex mass distribution characterized by several subclusters, we only consider a region of centered on the main cluster, identified by the two brightest cluster galaxies (see BCG1 and BCG2 in Bergamini et al., 2023b). (, Allen, 1998; Ebeling et al., 2010), MACSJ0416.1-2403 (, Balestra et al., 2016), Abell S1063 (, Balestra et al., 2013), MACSJ1206.2-0847 (, Biviano et al., 2013), and PSZ1-G311.65-18.48 (, Dahle et al., 2016). As presented in previous works, we reconstructed the total mass distribution of these clusters using hundreds of spectroscopically confirmed multiple images of strongly lensed distant galaxies. For these reconstructions we employed a novel technique that combines parametric lens modeling with Lenstool (e.g., Kneib et al., 1996; Jullo et al., 2007; Kneib & Natarajan, 2011; Meneghetti et al., 2017) with velocity-dispersion priors for the cluster members measured from spectroscopy with the Multi Unit Spectroscopic Explorer (MUSE) (Bergamini et al., 2019, 2021; Pignataro et al., 2021; Bergamini et al., 2023a, c, b). Due to the folding in of additional stellar kinematics data, the resulting lens models from this approach are particularly robust on the scales of cluster galaxies relevant for this work.
For each cluster we compute the probability for GGSL following the method proposed by ME20 and including the modifications introduced by ME22.222The modifications introduced by ME22 corrected the previous underestimation of the GGSL probabilities in ME20. In short, the procedure involves the following steps. First, we use the lens model to compute the tangential critical lines for a given source redshift. The tangential critical lines, , correspond to the zero-level contours of the map of the Jacobian tangential eigenvalue,
| (1) |
where and are the lens convergence and shear (e.g., Meneghetti, 2021) obtained from the lens model.
We identify the critical lines connected to the cluster galaxies. We dub these critical lines secondary to distinguish them from the primary critical lines corresponding to the large-scale cluster dark matter halos. Using the deflection angles, , computed with the cluster lens model, we map these critical lines onto the source plane, obtaining the caustics :
| (2) |
In the previous equation, and are the angular diameter distances between the lens and the source planes and between the observer and the source plane, respectively.
For each caustic, we compute the enclosed area. Summing the areas of all secondary caustics, we obtain the GGSL cross section,
| (3) |
Finally, we divide the GGSL cross section by the area sampled by the cluster mass reconstruction (i.e., the area within which cluster galaxies have been identified and included in the lens model) mapped onto the source plane, , and we obtain the GGSL probability:
| (4) |
The same procedure is repeated for several source redshifts, namely .
The size of the critical lines is quantified by means of their equivalent Einstein radius, defined as
| (5) |
where is the area enclosed by the critical line. The same definition of Einstein radius applies also to the primary critical lines. In the following sections we use to indicate the Einstein radius of the cluster’s primary critical line.
3 Simulation dataset
We repeated the above-mentioned procedure to compute the GGSL probabilities for a large set of simulated galaxy clusters from The Three Hundred project. This work compares two sets of these simulations generated from the same initial conditions, namely the Gadget-X and the Gizmo-Simba runs. Both simulation sets comprise full physics hydrodynamical re-simulations of spherical regions of radius Mpc centered on the 324 most massive galaxy clusters drawn from the 1 Gpc MultiDark N-body simulation (MDPL2; Klypin et al., 1996). In addition to implementing different galaxy formation models, the two codes also differ in the hydrodynamical solver adopted. Gadget-X is based on the implementation in the original Gadget code (Springel et al., 2005) of an improved formulation of smoothed particle hydrodynamics (SPH, Beck et al. 2016), which overcomes most of the limitations of the standard SPH. In Gizmo the hydrodynamical forces are computed instead by resorting to a Godunov scheme to solve the Riemann problem between each pair of gas particles (Hopkins, 2015). Specifically, the Gadget-X simulations implement the galaxy formation model outlined in Rasia et al. (2015), while the Gizmo-Simba simulations adopt a model from the Simba simulation described in Davé et al. (2019), and adapted to the resolution of The Three Hundred simulations.
One of the most interesting characteristics of the Gizmo-Simba simulations is that they are calibrated to reproduce several stellar properties of observed cluster galaxies, namely their stellar mass function and colors, and the mass and age of the brightest cluster galaxies (BCGs) (Cui et al., 2022). In contrast, the Gadget-X simulations are tuned to successfully reproduce the observed gas properties and scaling relations in clusters more specifically. The code used for the Gadget-X simulations is extremely similar to that used for the simulations considered in ME20.
The MDPL2 assumes the best-fit cosmological model from Planck Collaboration et al. (2016). The mass resolution in the resimulated regions amounts to M⊙ and M⊙ per dark matter and gas particles, respectively. The softening length is kpc. Cui et al. (2022) provide a detailed description of the Gadget-X and Gizmo-Simba runs of the Three Hundred project and an in-depth discussion of the differences between the galaxy formation models that they implement (see, e.g., their Table 2).
The lensing analysis of The Three Hundred simulations consists of several data products, whose description can be found in Meneghetti et al. (in prep.) (see also Herbonnet et al., 2022; Euclid Collaboration et al., 2023). This analysis uses the deflection-angle, convergence, and shear maps of the 324 clusters obtained by projecting their particles along the three simulation axes. Since the simulation box is uncorrelated with the cluster orientations, these projection directions can be assumed to be random. The maps cover a arcsec field of view with pixels. Since the size of reconstructed regions in the observational dataset amounts to sq. arcmin per cluster on average, for computing the we restricted our analysis to the central arcsec. We used the maps for all clusters in 16 simulation snapshots covering the redshift range . Thus, this analysis uses lens planes for both the Gadget-X and Gizmo-Simba runs. Although we can compare these simulations with the observations only within a much more limited redshift range (), using all these simulated lenses allows us to make a more robust comparison between the two simulation sets.
We used the maps to compute the secondary critical lines for three source redshifts: . We retained those critical lines whose equivalent Einstein radii are . As shown in ME22, assuming this lower limit when comparing the simulations with the observational dataset ensures that the results do not depend on the mass and spatial resolution of the simulations. Then, we mapped the critical lines onto the caustics and computed the GGSL probability as a function of lens and source redshifts. As done by ME22, when computing the GGSL probability in both simulated and observational datasets, we did not account for critical lines with Einstein radii . Critical lines larger than this limit are produced by groups of galaxies or massive galaxies not observed in the observational dataset, as discussed in Sect. 4.2.
4 Results
4.1 GGSL probability
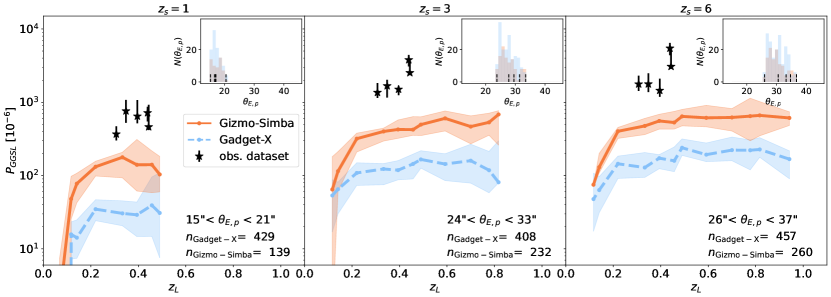
In Fig. 1 we show the probability of GGSL events derived from the lensing analysis of the simulations. We use solid orange and dashed blue lines to display the results for the Gizmo-Simba and Gadget-X datasets, respectively. The error bands show the confidence intervals of the median. They were computed by bootstrap sampling the simulated data 1000 times. The confidence interval was constructed by taking the percentile interval of the bootstrap distribution. From left to right, the three panels refer to source redshifts , , and . According to the results of the Frontier Fields Lens Modeling Comparison Project (Meneghetti et al., 2017), the Einstein radius is one of the cluster properties best constrained by parametric lens inversion methods. In Table 1 we report the values measured for a source redshift for all five clusters in the observational dataset. To match observed and simulated clusters, we selected the simulated clusters such that their primary Einstein radii were consistent with those of the observational dataset. For each source redshift evaluated here, we considered only the simulated clusters with , where and are the smallest and largest primary Einstein radii in the observational dataset. The resulting distributions of for clusters selected in the Gizmo-Simba and Gadget-X datasets in the redshift range of the observed clusters are shown in the insets in the upper right corner of each panel.
| cluster | |||
|---|---|---|---|
| [arcsec] | [] | ||
| Abell 2744 | |||
| Abell S1063 | |||
| MACSJ0416.1-2403 | |||
| MACSJ1206.2-0847 | |||
| PSZ1-G311.65-18.48 |
Independently of the source redshift, we find that clusters in the Gizmo-Simba run have GGSL probabilities higher by a factor compared to their analogs in the Gadget-X simulations. This result also holds outside the redshift range of the observed clusters. The origin of this difference resides in the -based star formation model implemented in the Gizmo-Simba simulations (Davé et al., 2016). A given gas element’s star-formation rate (SFR) in this model depends on its molecular fraction. Under this prescription, galaxies develop denser stellar cores at high redshift compared to the Gadget-X run, where the SFR is regulated by the gas density and temperature (Li et al., 2023). To compensate, stronger feedback is implemented to quench the galaxies to match the observed satellite stellar mass function. Among its successes, this model reproduces the number counts of high- submillimeter-selected galaxies (Lovell et al., 2021). The drawback is that several properties of the ICM in the inner cluster regions, such as the gas mass density, temperature, and entropy profiles, are not equally well reproduced (Li et al., 2023). In particular, the clusters in the Gizmo-Simba run have lower central gas and stellar mass densities compared to the Gadget-X simulations. Consequently, these clusters have smaller by on average. For this reason, as shown in Fig. 1, there are fewer clusters with matching the observational dataset in Gizmo-Simba than in the Gadget-X simulations.
Because of their higher central densities, the galaxies in the Gizmo-Simba simulation set are more resistant to tidal stripping and can survive as stronger lenses as they fall toward the cluster center. However, despite their higher GGSL probabilities, these simulations still do not match the observations. The black stars indicate the GGSL probabilities of all clusters in the observational dataset. The error bars show the confidence limits, derived by randomly sampling the posterior distributions of the lens model parameters. The observed exceeds that measured in the Gizmo-Simba and in the Gadget-X datasets by a factor of and , respectively.
4.2 Secondary critical lines
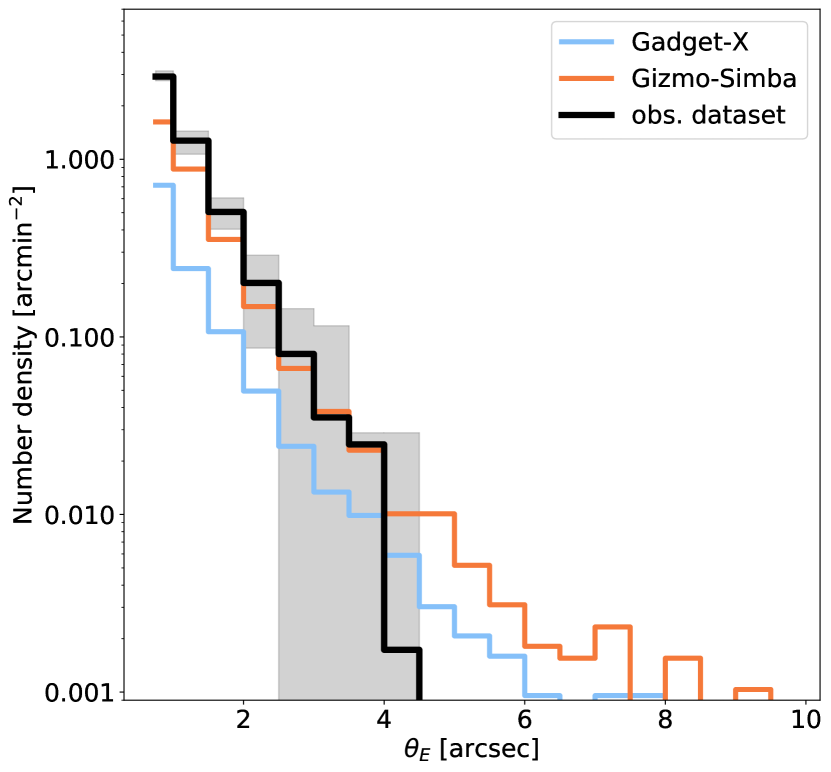
The galaxy formation model implemented in the Gizmo-Simba simulations is calibrated to reproduce several observed properties of cluster galaxies. To assess whether this calibration can also reproduce the observed distribution of secondary critical line sizes, we used the snapshots whose redshifts closely match those of the clusters in the observational dataset, and consider only the galaxy clusters with primary Einstein radii . The number density of secondary critical lines as a function of the size of the Einstein radius is shown in Fig. 2. As the black histogram indicates, the secondary critical lines in the observational dataset have Einstein radii (computed assuming ) in the range . The histogram is the median among 100 realizations per cluster, obtained by randomly sampling the posterior distributions of the Lenstool model parameters. The gray band indicates the range between the minimum and maximum number density among the sampled cluster realizations. We verified that the critical lines with surround a group of four nearby galaxies in Abell 2744. Therefore, these critical lines are not associated with the production of GGSL events.
The number densities of secondary critical lines in the simulations are generally lower than in the observational dataset, especially noticeable in the Gadget-X run. The Gizmo-Simba simulations are closer to the observations, but produce an excess of secondary critical lines with large Einstein radii. We also find a similar surplus of secondary critical lines associated with larger Einstein radii in the Gadget-X simulations. The number of galaxy clusters in the observational dataset is small. To estimate the significance of the excess of secondary critical lines noted in the simulations compared to the observations, we generated 1000 samples containing five clusters each by randomly drawing them from the Gizmo-Simba dataset. We counted how many of these samples do not contain secondary critical lines with and . They are and of the total, respectively.
We did not consider the contribution to the GGSL cross sections from galaxies with Einstein radii because they are associated with structures not present in the observations. Incorrectly considering their contribution would lead to underestimating the gap between GGSL probabilities in simulated and observed galaxy clusters. In addition, a comparison of quantities needs to be performed on a like-to-like basis. As shown in Fig. 8 of ME22, although they represent only a small percentage of the total, these secondary critical lines would make up a significant fraction (up to ) of the GGSL cross section of their host clusters, if accounted for.
The occurrence of large critical lines in the simulated data is related to inefficient AGN energy feedback in the largest galaxies. ME22 showed that some AGN energy feedback schemes, like the one implemented in Bassini et al. (2020) (hereafter BA20), whose efficiency at suppressing star formation is relatively low, favor the production of GGSL events. In simulations implementing such AGN feedback schemes, galaxies develop denser stellar cores, making them stronger lenses. The drawback is that these galaxy formation models tend to produce overly massive galaxies that are simply not found in our observational dataset (see, e.g., Ragagnin et al., 2022). We find a similar result in the Gizmo-Simba run.
The distribution of Einstein radii in the Gadget-X simulations is biased towards large values of because many galaxies are not dense enough to produce critical lines individually. However, groups of nearby galaxies can compensate for the low density thanks to their shear, contributing to a more significant fraction of extended critical lines with than the Gizmo-Simba run. These results agree with those of ME22.
Although it is unlikely, it is possible that some cluster galaxies have unusually high mass given their luminosities, thus lying outside the scaling relations adopted to model the cluster members with Lenstool. In this case, we may incorrectly measure the size of their associated critical lines, especially without strong lensing constraints around them. We note, however, that for all the brightest cluster galaxies, we measure their velocity dispersion spectroscopically, setting strong constraints on their masses.
5 Conclusions
In this letter we followed the method proposed by ME20 and ME22 to measure the GGSL probability in simulations of the Three Hundred project. The number of simulated galaxy clusters in this current dataset is times larger than was previously used. We analyzed two versions of this set of simulations, performed with independent codes and implementing different star formation models. While ME22 focuses in particular on the impact of various AGN feedback schemes on the GGSL probability, in this work we assessed the sensitivity of the results to other aspects of the galaxy formation models, such as the adopted prescription for star formation.
Our results can be summarized as follows:
-
•
The simulated galaxies in the Gizmo-Simba set of The Three Hundred project have larger cross sections for GGSL, which translate into a GGSL probability higher than in the Gadget-X simulation set by a factor of . This increment in the GGSL probability is due to the -based star formation model implemented in the Gizmo-Simba run, which produces dense galactic stellar cores at high redshift. Due to their higher central stellar densities, these galaxies are stronger gravitational lenses.
-
•
Despite the increased production of strong lensing effects, the GGSL probability in the Gizmo-Simba run is still below the level measured in our observational dataset by a factor of . In contrast, the Gadget-X simulations fall short of the observations by a factor of .
-
•
As in previous results reported in ME22, the Einstein-radii distributions of the secondary critical lines in both the Gizmo-Simba and Gadget-X runs starkly differ from that of the observational dataset. In the simulations we find a lower spatial density of critical lines with compared to observations. However, the simulations produce an excess of secondary critical lines with that are simply not found in the observational dataset.
We conclude that current hydrodynamical simulations cannot yet reproduce the GGSL probabilities measured in real galaxy clusters, the demographics of cluster galaxies, and their contributions to the GGSL signal. Interestingly, the galaxies in our observational dataset that contribute to the GGSL probability have masses in the range M⊙ (see Fig. 11 of ME22 and Fig. S5 of ME20). At lower masses, the secondary critical lines have Einstein radii smaller than the lower limit used in our analysis (). Galaxies with masses M⊙ do not contribute significantly to the GGSL signal because of the exponential cutoff of the galaxy mass function at high masses. Thus, GGSL in galaxy clusters occurs on mass scales where the star formation efficiency reaches its maximum value (or conversely, where the feedback efficiency has minimal impact on star formation; e.g., Bullock & Boylan-Kolchin, 2017; Wechsler & Tinker, 2018; Macciò et al., 2020). Perhaps for this reason we find relatively modest variations of the GGSL probability (by a factor of ) when comparing hydrodynamical simulations that implement different galaxy formation models.
In Srivastava et al. (2023), we further investigated the internal structure of cluster galaxies in the Three Hundred project using the maximum circular velocity as a proxy of their compactness. Our ongoing effort to fully understand the impact of baryon physics on GGSL in galaxy clusters in the context of CDM includes producing simulations at higher resolution with improved galaxy formation models that better match the observed properties of the stellar component of cluster galaxies and the ICM at the same time. On the other hand, our results also suggest that alternative models of dark matter should also be explored in an attempt to explain the observed excess of GGSL in galaxy clusters (e.g., Yang & Yu, 2021; Cappelluti et al., 2022; Liu & Bromm, 2022; Mastromarino et al., 2023).
Acknowledgements.
We thank the anonymous referee for their constructive comments. MM was supported by INAF Grant “The Big-Data era of cluster lensing”. We acknowledge financial contributions from PRIN-MIUR 2017WSCC32 and 2020SKSTHZ, INAF “main-stream” grants 1.05.01.86.20 and 1.05.01.86.31, by the ICSC National Recovery and Resilience Plan (PNRR) Project ID CN-00000013 ”Italian Research Center on High-Performance Computing, Big Data and Quantum Computing” funded by MUR Missione 4 Componente 2 Investimento 1.4 - Next Generation EU (NGEU), by the INFN InDark grant and by ASI n.2018-23-HH.0 grant. CG and AR are supported by INAF Theory Grant ”Illuminating Dark Matter using Weak Lensing by Cluster Satellites”. WC, AK and GY acknowledge Ministerio de Ciencia e Innovación (Spain) for partial financial support under research grant PID2021-122603NB-C21. WC is also supported by the STFC AGP Grant ST/V000594/1 and the Atracción de Talento Contract no. 2020-T1/TIC-19882 granted by the Comunidad de Madrid in Spain. We would also like to thank the Red Española de Supercomputación (RES) for granting us computing resources in the MareNostrum supercomputer at Barcelona Supercomputing Center, where all the simulations used in this work have been performed. AK further thanks The Charlatans for the only one I know. This work was in part performed at the Aspen Center for Physics, which is supported by National Science Foundation grant PHY-2210452. This material is partially supported by a grant from the Simons Foundation.References
- Allen (1998) Allen, S. W. 1998, MNRAS, 296, 392
- Bahé (2021) Bahé, Y. M. 2021, MNRAS, 505, 1458
- Balestra et al. (2016) Balestra, I., Mercurio, A., Sartoris, B., et al. 2016, ApJS, 224, 33
- Balestra et al. (2013) Balestra, I., Vanzella, E., Rosati, P., et al. 2013, A&A, 559, L9
- Bassini et al. (2020) Bassini, L., Rasia, E., Borgani, S., et al. 2020, A&A, 642, A37
- Beck et al. (2016) Beck, A. M., Murante, G., Arth, A., et al. 2016, MNRAS, 455, 2110
- Bergamini et al. (2023a) Bergamini, P., Acebron, A., Grillo, C., et al. 2023a, A&A, 670, A60
- Bergamini et al. (2023b) Bergamini, P., Acebron, A., Grillo, C., et al. 2023b, ApJ, 952, 84
- Bergamini et al. (2023c) Bergamini, P., Grillo, C., Rosati, P., et al. 2023c, A&A, 674, A79
- Bergamini et al. (2019) Bergamini, P., Rosati, P., Mercurio, A., et al. 2019, A&A, 631, A130
- Bergamini et al. (2021) Bergamini, P., Rosati, P., Vanzella, E., et al. 2021, A&A, 645, A140
- Biviano et al. (2013) Biviano, A., Rosati, P., Balestra, I., et al. 2013, A&A, 558, A1
- Bonaca et al. (2019) Bonaca, A., Hogg, D. W., Price-Whelan, A. M., & Conroy, C. 2019, ApJ, 880, 38
- Bullock & Boylan-Kolchin (2017) Bullock, J. S. & Boylan-Kolchin, M. 2017, ARA&A, 55, 343
- Cappelluti et al. (2022) Cappelluti, N., Hasinger, G., & Natarajan, P. 2022, ApJ, 926, 205
- Cui et al. (2022) Cui, W., Dave, R., Knebe, A., et al. 2022, MNRAS, 514, 977
- Cui et al. (2018) Cui, W., Knebe, A., Yepes, G., et al. 2018, MNRAS, 480, 2898
- Dahle et al. (2016) Dahle, H., Aghanim, N., Guennou, L., et al. 2016, A&A, 590, L4
- Dalal & Kochanek (2002) Dalal, N. & Kochanek, C. S. 2002, ApJ, 572, 25
- Davé et al. (2019) Davé, R., Anglés-Alcázar, D., Narayanan, D., et al. 2019, MNRAS, 486, 2827
- Davé et al. (2016) Davé, R., Thompson, R., & Hopkins, P. F. 2016, MNRAS, 462, 3265
- Despali et al. (2022) Despali, G., Vegetti, S., White, S. D. M., et al. 2022, MNRAS, 510, 2480
- Ebeling et al. (2010) Ebeling, H., Edge, A. C., Mantz, A., et al. 2010, MNRAS, 407, 83
- Euclid Collaboration et al. (2023) Euclid Collaboration, Giocoli, C., Meneghetti, M., et al. 2023, arXiv e-prints, arXiv:2302.00687
- Giocoli et al. (2010) Giocoli, C., Tormen, G., Sheth, R. K., & van den Bosch, F. C. 2010, MNRAS, 404, 502
- Giocoli et al. (2008) Giocoli, C., Tormen, G., & van den Bosch, F. C. 2008, MNRAS, 386, 2135
- Grillo et al. (2015) Grillo, C., Suyu, S. H., Rosati, P., et al. 2015, ApJ, 800, 38
- Herbonnet et al. (2022) Herbonnet, R., Crawford, A., Avestruz, C., et al. 2022, MNRAS, 513, 2178
- Hezaveh et al. (2016) Hezaveh, Y. D., Dalal, N., Marrone, D. P., et al. 2016, ApJ, 823, 37
- Hopkins (2015) Hopkins, P. F. 2015, MNRAS, 450, 53
- Jullo et al. (2007) Jullo, E., Kneib, J. P., Limousin, M., et al. 2007, New Journal of Physics, 9, 447
- Klypin et al. (1999) Klypin, A., Kravtsov, A. V., Valenzuela, O., & Prada, F. 1999, ApJ, 522, 82
- Klypin et al. (1996) Klypin, A., Primack, J., & Holtzman, J. 1996, ApJ, 466, 13
- Kneib et al. (1996) Kneib, J. P., Ellis, R. S., Smail, I., Couch, W. J., & Sharples, R. M. 1996, ApJ, 471, 643
- Kneib & Natarajan (2011) Kneib, J.-P. & Natarajan, P. 2011, A&A Rev., 19, 47
- Koopmans (2005) Koopmans, L. V. E. 2005, MNRAS, 363, 1136
- Li et al. (2023) Li, Q., Cui, W., Yang, X., et al. 2023, MNRAS, 523, 1228
- Liu & Bromm (2022) Liu, B. & Bromm, V. 2022, ApJ, 937, L30
- Lovell et al. (2021) Lovell, C. C., Geach, J. E., Davé, R., Narayanan, D., & Li, Q. 2021, MNRAS, 502, 772
- Macciò et al. (2020) Macciò, A. V., Crespi, S., Blank, M., & Kang, X. 2020, MNRAS, 495, L46
- Mao & Schneider (1998) Mao, S. & Schneider, P. 1998, MNRAS, 295, 587
- Mastromarino et al. (2023) Mastromarino, C., Despali, G., Moscardini, L., et al. 2023, MNRAS, 524, 1515
- Meneghetti (2021) Meneghetti, M. 2021, Introduction to Gravitational Lensing: With Python Examples, Lecture Notes in Physics (Springer International Publishing)
- Meneghetti et al. (2020) Meneghetti, M., Davoli, G., Bergamini, P., et al. 2020, Science, 369, 1347
- Meneghetti et al. (2017) Meneghetti, M., Natarajan, P., Coe, D., et al. 2017, MNRAS, 472, 3177
- Meneghetti et al. (2022) Meneghetti, M., Ragagnin, A., Borgani, S., et al. 2022, A&A, 668, A188
- Meneghetti et al. (2014) Meneghetti, M., Rasia, E., Vega, J., et al. 2014, ApJ, 797, 34
- Moore et al. (1999) Moore, B., Ghigna, S., Governato, F., et al. 1999, ApJ, 524, L19
- Natarajan et al. (2017) Natarajan, P., Chadayammuri, U., Jauzac, M., et al. 2017, MNRAS, 468, 1962
- Natarajan & Kneib (1997) Natarajan, P. & Kneib, J.-P. 1997, MNRAS, 287, 833
- Navarro et al. (1997) Navarro, J. F., Frenk, C. S., & White, S. D. M. 1997, ApJ, 490, 493
- Pignataro et al. (2021) Pignataro, G. V., Bergamini, P., Meneghetti, M., et al. 2021, A&A, 655, A81
- Planck Collaboration et al. (2016) Planck Collaboration, Ade, P. A. R., Aghanim, N., et al. 2016, A&A, 594, A13
- Ragagnin et al. (2022) Ragagnin, A., Meneghetti, M., Bassini, L., et al. 2022, A&A, 665, A16
- Rasia et al. (2015) Rasia, E., Borgani, S., Murante, G., et al. 2015, ApJ, 813, L17
- Robertson (2021) Robertson, A. 2021, MNRAS, 504, L7
- Springel et al. (2005) Springel, V., Di Matteo, T., & Hernquist, L. 2005, MNRAS, 361, 776
- Srivastava et al. (2023) Srivastava, A., Cui, W., Meneghetti, M., et al. 2023, arXiv e-prints, arXiv:2309.06187
- Vegetti et al. (2012) Vegetti, S., Lagattuta, D. J., McKean, J. P., et al. 2012, Nature, 481, 341
- Wang et al. (2020) Wang, J., Bose, S., Frenk, C. S., et al. 2020, Nature, 585, 39
- Wechsler & Tinker (2018) Wechsler, R. H. & Tinker, J. L. 2018, ARA&A, 56, 435
- Yang & Yu (2021) Yang, D. & Yu, H.-B. 2021, Phys. Rev. D, 104, 103031