Discovery of A Compact X-ray Object with A 614 s Periodicity in the Direction of the Galactic center
Abstract
We report on analysis of X-ray, optical and radio observations of the previously overlooked X-ray source 2CXO J174517.0321356 located just 3.2∘ away from the Galactic center. Timing analysis of X-ray observations of the source with XMM-Newton reveals periodic pulsations with periods of 1228 s and 614 s, with the latter being tentatively considered fundamental. On the other hand, an observation of the object with NuSTAR reveals hard thermal-bremsstrahlung spectrum. Inspection of the archival VLT image reveals, however, no obvious optical counterpart down to mag. Observations made with ATCA showed a possible faint radio counterpart with a positive spectral index () between 1–3 GHz, but follow-up ATCA and VLA observations at frequencies between 4.5–10 GHz and 3–22 GHz, respectively, could not detect it. Given the properties in these three bands, we argue that the most likely origin of the X-ray source is emission from a new intermediate polar close to the Galactic center. Alternatively, and less likely, it is an ultra-compact X-ray binary, which is one of the most compact X-ray binaries.
1 Introduction
Identification of multiple serendipitously discovered X-ray sources in crowded regions of the Galactic plane, and especially the center is notoriously difficult (Hong et al., 2016). This is due to the fact that most of the sources are faint in X-rays which precludes sensitive searches for possible pulsed signal and detailed broadband spectral studies. Therefore, X-ray data alone is most often not sufficient to establish the origin of the source. Additionally, density of optical and infrared sources together with high absorption in the Galactic plane make it complicated to identify and study properties of potential counterpart sources. In fact, even detection of periodic signals in the X-ray band is often insufficient to establish the origin of an X-ray source as characteristic spin and orbital periods of NS (neutron star) and WD (white dwarf) X-ray binaries partly overlap (hundreds of seconds to thousands of seconds).
For example, 4U 182030 is the most compact X-ray binary so far, but the orbital nature of 4U 182030’s 685 s signal discovered in the EXOSAT data was not obvious. It was deduced based on its high , period stability within one year and binary evolution models (Stella et al., 1987). Another example is the most compact binary known to date RX J0806.31527. Its 321 s signal detected in the ROSAT data was mistakenly treated as a rotational period (Israel et al., 1999) before its orbital nature was deduced from a series of spectroscopic observations (Israel et al., 2002; Roelofs et al., 2010). Misidentifications of rotational periodic signals occurred too. For example, although initially different scenarios (Farrell et al., 2010; Malizia et al., 2010) were suggested, AX J1740.22903 (or 2XMM J174016.0290337) was finally found to be an intermediate polar (IP) by optical spectroscopic observations (Masetti et al., 2012; Halpern & Gotthelf, 2010). It is located 1.2∘ away from the Galactic center and has a 626 s modulation in its XMM-Newton light curve. Another example is OGLE-UCXB-01 (Pietrukowicz et al., 2019), which is also suspected to be an IP (Peng & Shen, 2021), despite its name.
Here, we report a newly discovered periodic variability with period 614 s from a previously overlooked X-ray source 2CXO J174517.0321356 (R.A., Dec=; J17453213 hereafter, Gong, 2019; Evans et al., 2019) which is 3.2∘ away from the Galactic center. By analysing its X-ray, optical and radio data, we argue the signal is probably due to a rotational period making it one of the IPs with confirmed periods in the direction of the Galactic center, or less likely, an orbital period making it one of the most compact X-ray binaries 111https://personal.sron.nl/~jeanz/ucxblist.pdf.
2 X-ray
2.1 Archival X-ray Data Analysis
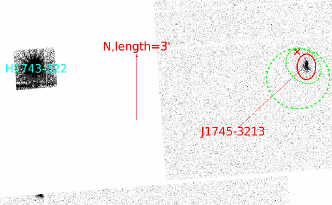
J17453213 was serendipitously covered by a Chandra observation (ObsID=13577) and an XMM-Newton observation (ObsID=0553950201) before 2021 (Table.1 and the left panel of Fig. 1). The 2 ks Chandra/ACIS observation collected about 70 counts (0.3–8 keV, off-axis angle , ) within the 3 detection region given by wavdetect (Freeman et al., 2002). The XMM-Newton observation was made for black hole binary H1743322, which is away from J17453213. Due to the large off-axis angle, the EPIC-PN detector, used in small-window mode, did not cover J17453213. As Fig.1 (left) shows, the X-ray source is significant on the EPIC-MOS detectors.
| Telescope | Instrument | Date | Exposure Time |
|---|---|---|---|
| XMM-Newton | MOS | 2010-10 | 86 ks |
| Chandra | ACIS-I | 2012-02 | 2.0 ks |
| NICER | / | 2019-09–2019-10 | 15 ks |
| VLT | VIMOS | 2013-04 | 120 s |
2.1.1 Spectral Analysis
For XMM, the MOS data were reduced by SAS 19 (Gabriel et al., 2004) with standard procedures. The two event files of MOS1 and MOS2 were generated by emchain, filtered by gti files, which were generated by espfilt automatically, and then barycentric corrected by barycen and DE405 ephemeris. Source photons were extracted between 0.3–10 keV using evselect around the position given by Chandra. Due to the large off-axis angle222https://xmm-tools.cosmos.esa.int/external/xmm_user_support/documentation/uhb/offaxisxraypsf.html of J17453213, which causes elongated images of point sources on the MOS detectors, and the existence of a source nearby (marked by the red X in the left panel of Fig. 1), we tried different regions and finally adopted an elliptical region with semi-major and semi-minor axes of = (MOS1+MOS23,500 photons) as the source extraction region, and a non-concentric ring as the background region (Fig. 1, left).
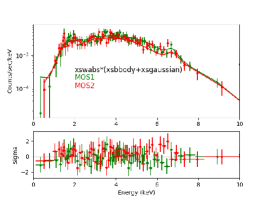
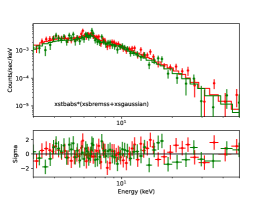
We used Sherpa of CIAO 4.14 (Fruscione et al., 2006) to perform the spectral fitting. Every spectral bin had 25 counts at least. Hence, we adopted chi2datavar instead of the default chi2gehrels as the fit statistic333https://cxc.cfa.harvard.edu/sherpa/statistics. The background was subtracted channel by channel using subtract. The two MOS spectra were fit simultaneously. Among the commonly used models444https://cxc.cfa.harvard.edu/sherpa/models/, we found a simple apec, thermal-bremsstrahlung, thermal-bremsstrahlung with a partial covering absorber (e.g., Haberl et al., 2002) and diskbb led to poor or unreasonable fits to the data. Among most of the models used, residuals around 6.7 keV suggested presence of an iron feature which was thus included in the fits (Fig. 2, left). Due to its broadness (200 eV), the feature is likely to be a mixture of three kinds of iron lines (6.4, 6.7 and 7.0 keV). Nevertheless, adding three Gaussian components made the fitting complicated and difficult to find a global minimum. We also tried to separate the three possible lines like Tomsick et al. (2016) and Coughenour et al. (2022). However, no matter the three line energies and line widths were fixed or not, our fits could not improve significantly or be reasonable. Thus, we only adopted one single Gaussian component, but left the line width free or fixed it at 0.05 keV. Hereafter, all the models we mention include an iron feature.
We found the best models (Table.2) include an absorbed power-law (PL) and an inferior absorbed blackbody (BB). If we adopt the absorbed BB as the moderate choice (which is also acceptable in the second XMM observation) and its parameters ( and kT), the unabsorbed flux and luminosity of J17453213 between 0.3–10 keV are about and (D/1 kpc)2 erg s-1, respectively.
| Model | Parametersa | red.(dof) |
| xstbabs*(powlaw1d+xsgaussian) | =,= | 1.04(109) |
| =6.7 ,=0.2 | ||
| xstbabs*xsbbody | =,kT= | 1.22(112) |
| xstbabs*(xsbbody+xsgaussian) | =,kT= | 1.18(109) |
| =6.7,=0.2 | ||
| xstbabs*xspcfabs*powlaw1d | =,= | 1.22(110) |
| =,= | ||
| xstbabs*xspcfabs*(powlaw1d+xsgaussian) | =,= | 1.18(107) |
| =,= | ||
| =6.7,=0.2 |
a: , and kT are in the unit of keV. is in the unit of . The Galactic foreground extinction is (HI4PI Collaboration et al., 2016).
2.1.2 Timing Analysis
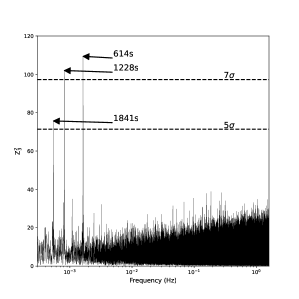
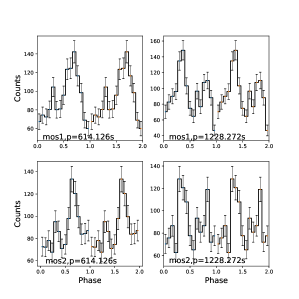
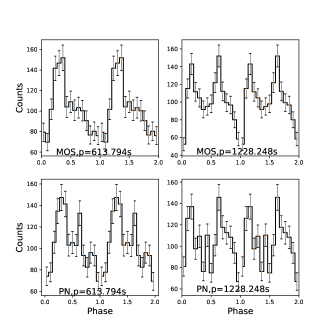
We used the Stingray (Huppenkothen et al., 2019) code, which performs test originally introduced in Buccheri et al. (1983) to detect signals in MOS1, MOS2 and the combined data sets, respectively. We searched in the frequency range 0.0001–1.6 Hz (MOS sampling time 0.3 s) with a frequency step size of Hz (1/(10ExpTime)). Assuming the folded profile can be described by a superposition of three sinusoidal components (n=3), we found the corresponding periods of the most significant signals are around 614.1 s (7.8) and 1228.3 s (7.3) in the combined data set (Fig. 3, left). Nevertheless, the most significant signal in MOS2 data is 613.7 s (1.5). We then folded the X-ray light curve. According to the MOS1 data set, which has the more significant signal (614.2 s (5.5)), it seems there are two different peaks within one cycle (Fig. 3, right).
Seven successful Neutron Star Interior Composition Explorer (NICER; Gendreau et al., 2016) observations were made between 2019-09-19 and 2019-11-05. We analysed the data using HEASoft 6.28 and CALDB version XTI (20200722). Photons were extracted by nicerl2 and barycentric corrected by barycorr. No significant signals around 614 s or 1228 s were detected. Since only about 15 ks raw data were generated in total and J17453213 was much fainter than the detection limit of NICER (Remillard et al., 2022), the data are dominated by background noise and the non-detection was not surprising. Based on the longest observation (ID=2200830102, 7ks), the upper limit of the pulsed fraction(Vaughan et al., 1994; Bachetti et al., 2021) is about 19% with a confidence level of 95%.
2.2 X-ray Observations and Data Analysis
In order to verify its periodicity and check its spectral shape in the hard X-ray band, we made a quasi-simultaneous XMM-Newton (ObsID=0865510101; PI: Gong) and NuSTAR (ObsID=30601021002; PI: Mori) observation on 2021-03-02. This time, the nearby black hole binary H1743322, the target of the old XMM observation, was in the quiescent state.
The new XMM observation was executed in the full window mode. Its data were reduced by the same procedures in Section 2.1. J17453213 was on-axis and covered by MOS and PN simultaneously. We adopted a source extraction region and obtained 3,600 photons (1,770 PN photons and 1,820 MOS photons, respectively) between 0.3–10 keV after the GTI correction. Note that the counts had no obvious advantage compared with the old XMM observation, but the source extraction regions were different. The background region was simply set to be a homocentric annulus with an inner radius of and an outer radius of because this time the X source in Fig. 1 was easily excluded.
The NuSTAR data were reduced using the two commands nupipeline and nuproducts in HEASoft 6.28 with the newest calibration files. The source spectra and photons between 3–78 keV were extracted from r= circular regions centered at the centroids of J17453213′s photons, which had offsets compared with the Chandra position. The spectra were grouped by grppha and every spectral bin had a minimum of 25 counts. The background was selected as a rectangular region away. The barycentric correction was applied by setting the input parameter ’barycorr’ of nupipeline to ’yes’.
2.2.1 Spectral Analysis
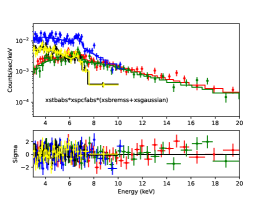
The MOS and PN spectra were fit simultaneously. If no parameters were fixed, BB yielded the best reduced and a consistent fit with the previous XMM observation (the 1st part of Table.3). Both fits had a BB temperature of keV. If line width was fixed, an apec model with a partial covering absorber led to a comparable reduced , with which F-test could not distinguish which model is better. The XMM and NuSTAR spectra were fit between 0.3–20 keV simultaneously. As the photons gets harder, the continuum can not be described by BB anymore. Instead, it is characterised by a partial covering thermal-bremsstrahlung (Fig. 2, middle) or PL (the 2nd part of Table.3). We selected 3–50 keV as the hardest band in case of the significant detector background (Hailey et al., 2016). The NuSTAR spectrum (the 3rd part of Table.3) is described by an absorbed thermal-bremsstrahlung (Fig. 2, right) with an unabsorbed flux and luminosity of and (D/1 kpc)2 erg s-1, respectively. A slightly inferior model is absorbed apec. Adding a partial covering component to either of the two models would yield a worse reduced and let the partial covering factor hit its maximum boundary 1.0.
| Model | Parameters | red.(dof) |
| MOS1+MOS2+PN (0.3-10 keV) | ||
| xstbabs*xspcfabs*(xsbremss+xsgaussian) | =,= | 1.10(147) |
| =,kT= | ||
| =6.7,=0.2 | ||
| xstbabs*xsapec | =,kT= | 1.57(152) |
| xstbabs*xspcfabs*(xsapec+xsgaussian) | =,= | 1.08(148) |
| =,kT= | ||
| =6.5,=0.05(fixed) | ||
| xstbabs*xspcfabs*(powlaw1d+xsgaussian) | =,= | 1.10(147) |
| =,= | ||
| =6.7,=0.2 | ||
| xstbabs*(xsbbody+xsgaussian) | =,kT= | 1.09(149) |
| =6.7,=0.2 | ||
| XMM+NuSTAR (0.3-20 keV) | ||
| xstbabs*xsbremss | =,kT= | 1.46(253) |
| xstbabs*(xsbremss++xsgaussian) | =,kT= | 1.09(250) |
| =6.6,=0.3 | ||
| xstbabs*xspcfabs*(xsbremss+xsgaussian) | =,= | 1.01(248) |
| =,kT= | ||
| =6.6,=0.2 | ||
| xstbabs*xsapec | =,kT= | 1.34(253) |
| xstbabs*(xsapec+xsgaussian) | =,kT= | 1.10(250) |
| =6.6,=0.3 | ||
| xstbabs*xspcfabs*(xsapec+xsgaussian) | =,= | 1.03(248) |
| =,kT= | ||
| =6.5,=0.2 | ||
| xstbabs*xspcfabs*(powlaw1d+xsgaussian) | =,= | 1.01(248) |
| =,= | ||
| =6.7,=0.2 | ||
| xstbabs*(xsbbody+xsgaussian) | =,kT= | 1.52(250) |
| =6.6,=0.2 | ||
| FPMA+FPMB (3-50 keV) | ||
| xstbabs*xsbremss | =,kT= | 1.02(109) |
| xstbabs*(xsbremss++xsgaussian) | =,kT= | 0.85(106) |
| =6.5,=0.4 | ||
| xstbabs*xsapec | =,kT= | 1.00(109) |
| xstbabs*(xsapec+xsgaussian) | =,kT= | 0.88(106) |
| =6.4,=0.4 | ||
| xstbabs*ipm | =,=,= | 1.01(108) |
2.2.2 Timing Analysis
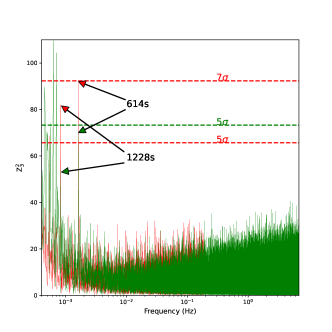
The MOS and PN sampling times of the new observation were 2.6 s and 73.4 ms, respectively. For the PN data set, we searched in the frequency range 0.0001–6.8 Hz with a frequency step size of Hz (1/(10ExpTime)) via test (n=3). The two signals were confirmed (Fig. 4, left). Nevertheless, we found the corresponding period of the most significant signal is around 613.5 s (4.7), which is weakened by strong red noise. No shorter significant signals were discovered. For the combined MOS data set, we searched in the frequency range 0.0001–0.19 Hz and found the corresponding period of the most significant signal is around 613.8 s (7.0). The 1,228 s signal was both weaker in the two cases (Fig. 4, left). Considering in this observation J17453213 was on-axis and had a small source extraction region, and especially the nearly identical peaks we obtained in the MOS data (Fig. 4, right), we take the s (Huppenkothen et al., 2019) signal as the fundamental period tentatively.
Surprisingly, no signals were detected in the NuSTAR photons no matter a r= or a r= extraction region was adopted. The non-detection was not the result of the choice of energy band because 3–10 keV and 3–78 keV were both tried. We attribute the non-detection to the high background of J17453213 in the NuSTAR observation.
3 Archival Optical Data Analysis
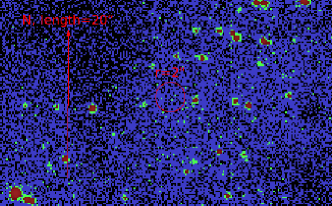
J17453213 is fortuitously located in a field with archival VLT observations. Its VLT R-band image (Fig. 1, right) displays a patchy environment and a nonuniform extinction near J1745-3213. We aligned the astrometry of the VLT-VIMOS image onto the Chandra image using four Tycho stars in the field of view. No optical point sources brighter than the limit of mag555https://www.eso.org/observing/etc/bin/gen/form?INS.NAME=VIMOS+INS.MODE=imaging were detectable within of the X-ray position.
However, the extinction towards the Galactic center is very high. Assuming and adopting a moderate (2.0) based on Table.2 and Table.3, we obtained and (=6,312 Å)666http://www.dougwelch.org/Acurve.html using the extinction model from Cardelli et al. (1989). Therefore, we can exclude a G5-type giant star within 11 kpc, an M5-type giant star within 37 kpc, an A0-type main sequence star within 9 kpc, an A5-type main sequence star within 5.3 kpc, and a B8-type main sequence star within 13.4 kpc (Table 15.7, Allens Astrophysical Quantities, 4th Ed.). But, if we adopted a smaller (1.0), an M0-type main sequence star within 3.6 kpc, a G2-type main sequence star within 16.8 kpc and an A5-type main sequence star within 50 kpc can be excluded.
We note there is a reported cold clump PGCC G357.161.66 (Planck Collaboration et al., 2016) in the same direction. With semi-major and semi-minor axes of , and an angular separation of just , the extinction may be enhanced by the clump.
4 Radio Observations and Data Analysis
4.1 ATCA
Since the optical data showed no source at the location of the Chandra position, we requested and received radio observations on the ATCA. J17453213 was observed over a period of four epochs: 2018-12-22, 2018-12-23, 2018-12-27 and 2019-01-03 for a total integration of 11.5 hours on source. For each observing epoch, the array was in the 1.5D configuration with a minimum baseline length of 107 m and a maximum baseline length of nearly 4,438 m. We utilise the Compact Array Broadband Backend (CABB, Wilson et al., 2011) with our observations being taken at a centre frequency of 2,100 MHz with 2 GHz of instantaneous bandwidth. Continuum data was recorded in 2,048 independent channels of 1 MHz bandwidth each. The flux and bandpass calibrator used for these observations was PKS 1934638 while PKS 175939 was used as a phase calibrator.
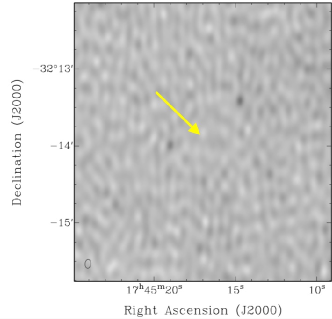
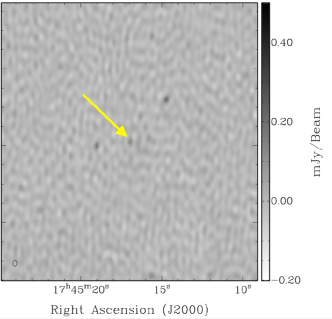
Data were reduced, calibrated and imaged using the miriad software package (Sault et al., 1995) with standard routines. Flagging of the data was largely done with the automated task pgflag. We made naturally-weighted total intensity (Stokes ) mutifrequency images of 900 MHz of bandwidth, centred on 1,730 and 2,550 MHz (Fig. 5). The resultant images have a measured root-mean-squared noise () of 24 and Jy beam-1 for the 1,730 MHz and 2,550 MHz images, respectively.
Interestingly, the source was detected in the upper band, and not the lower band (Fig. 5). The upper-band image centred at 2,550 MHz shows a source at the centre of the imaged field with a peak intensity of Jy beam-1, equivalent to , and suggests a strong positive spectral index of where . Imaging the entire 2 GHz of bandwidth results in a detection of lesser significance () when compared to the upper-band image.
The existence of a signal in only the higher-frequency band is unlikely due to a difference in sensitivity between the two bands, because the number of flagged visibilities due to radio frequency interference (RFI) between the two bands results in the higher-frequency band being only about 10% more sensitive than the lower-frequency band. To test whether the radio emission at the source position was an artefact related to either RFI or some other effect, we systematically removed antennae and observational epochs. In all cases the radio source remained, although we note that removing single epochs provided different source intensity, suggesting J17453213 is mildly radio variable. Despite radio emission remaining for all tests, we do remain somewhat cautious of the source detection.
Out of caution, we followed up our initial set of radio observations with a further ATCA radio observation taken at central frequencies of 5.5 and 9 GHz. This later radio observation was recorded simultaneously with a bandwidth of 2 GHz at each frequency. It was made on 2020-06-18 when the array was in the 1.5C configuration. Calibration, data reduction and analysis followed the same steps as reported above.
J17453213 was not detected in either the 5.5 or 9 GHz band. We measured an RMS noise of 17 and Jy beam-1 for 5.5 GHz and 9 GHz, respectively, over the source position. While tests suggest that the detected radio emission from our 2018/2019 data was likely real, the non-detection in the lower-half of the band, and the non-detection at later times (at a higher frequency) means that the detection at 2,550 MHz should be regarded as preliminary.
4.2 VLA
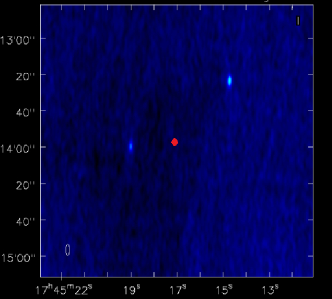
We also performed follow-up radio observations using the VLA. J17453213 was observed for six hours on four separate dates (Project Code=21A-156; PI: Gong). The first two observations measured the spectrum of J17453213 across five radio bands from 2 to 26 GHz during two separate one hour scheduling blocks. One for the three lowest frequencies and the other for the two remaining high frequencies. The exposures in each band range between 705 s to 948 s duration. The third and fourth observations were two hours each in the C and X bands (4–8 and 8–12 GHz, respectively) with an on-source time of about 1.6 hours each. During these observations, the VLA cycled between the target J17453213 and the phase calibrator J17443116 about every 570 s with about 525 s being on target. Each observation used the 3-bit samplers for wideband coverage. The radio sources J1331305 (=3C286) and J17443116 were used as the flux and polarization, and the phase and gain calibrators for each observation, respectively. No polarization leakage calibrators were observed, because the cross-polarization is 1% and varies slowly over several months. This accuracy is sufficient for our needs. Table.4 gives a log of the observations and the measured flux densities in each band. No radio source was detected at the location of J17453213 in any of the observations (e.g., Fig. 6).
The data were calibrated using version 5.6.3 of the CASA (Common Astronomy Applications Software) calibration pipeline (McMullin et al., 2007). The imaging application tclean is used to generate IQUV and RRLL images of each target scan to check for any source confusion and radio frequency interference. None were found. The flux densities are measured by fitting a point source to the UV data using the Julia programming language package Visfit (Barrett, 2022). The package uses a box-constrained Levenberg-Marquardt algorithm to minimize the model residuals. The position of the point source is constrained to be within a region centered on the X-ray source position.
| Date | Band | Freq | RAa | Deca | I |
|---|---|---|---|---|---|
| (GHz) | (arcsecond) | (arcsecond) | (Jy beam-1) | ||
| 2021-06-04T06:25:25Z | S | 3.0 | -2.00 | 2.00 | 14 |
| 2021-06-04T07:10:45Z | C | 6.0 | 0.89 | -0.61 | -50 |
| 2021-06-04T06:03:00Z | X | 10.0 | 0.39 | 1.44 | 10 |
| 2021-06-12T05:28:3Z5 | Ku | 15.0 | 1.59 | -0.93 | 29 |
| 2021-06-12T05:09:25Z | K | 22.0 | 0.53 | -1.32 | -27 |
a: The distance in arcseconds between the fitted point source position and the known X-ray position of J17453213. The search for a point source is constrained to a region.
5 The Nature of J17453213
Based on the 614 s signal, the 6.7-keV iron feature, non-detection of an optical counterpart and its small Galactic latitude (), it is safe to conclude that J17453213 is a Galactic compact object. Nevertheless, as we point out in the first section, it is not necessarily easy to distinguish between a rotational period and an orbital period. Being devoid of an optical counterpart makes a secure identification difficult. Below, we mainly discuss its possibility of being an X-ray binary or a white dwarf binary.
The signal may be interpreted as the rotational period of an accreting pulsar. Pulsars in LMXBs typically spin faster (s) than J17453213 due to high accretion torques. Even the exceptions to the LMXB fast spin rule, symbiotic LMXBs (s, e.g., Masetti et al., 2007) are unlikely too due to their rarity and the presence of M-type giants as companions. The parameter space of a NS-HMXB scenario is quite restricted due to the optical and X-ray faintness of J17453213. Being a HMXB would require an much higher than (8/1 kpc)2 erg s-1 (Grimm et al., 2002).
The signal may be the orbital period of a LMXB, or further, an ultra-compact X-ray binary (UCXB), which belongs to LMXBs with extremely short orbital periods (1 hour, e.g., in ’t Zand et al., 2007a). Due to their short orbital periods, which lead to small Roche lobes, the donors of UCXBs are supposed to be hydrogen-stripped stars or white dwarfs. They tend to be located in globular clusters and the Galactic bulge, while about 40% (Heinke et al., 2013) are just Galactic field UCXBs. A small donor would make J17453213 optically faint (in ’t Zand et al., 2007b, 2009). The existence of an iron feature suggests a He-rich donor (Koliopanos et al., 2014). One may argue that a persistently and extremely low Eddington ratio (0.01 even if =10 kpc and M=1.4 ) for J17453213 is incompatible with a supposedly high driven by gravitational radiation (Bildsten & Deloye, 2004). But, it may be a transient UCXB (Heinke et al., 2013) and a very faint X-ray binary (Heinke et al., 2015), which both have high concentrations near the Galactic center (Bahramian et al., 2021). If the BB choice in the XMM band is correct, then J17453213 is a NS-UCXB because the X-ray spectrum would be much harder for a black hole X-ray binary with such a low . The low can be explained by a small accretion flow to a neutron star limited by the propeller effect and a small disk (Heinke et al., 2015; van den Eijnden et al., 2018b). The BB emission may originate from a hot spot with a radius about 11.3(D/1 kpc) m (Lamb et al., 1973), or more likely, from two antipodal spots on the surface of J17453213. Similar spots appeared on the surfaces of the NS X-ray binaries 1E1743.12843 (kT=1.8 keV, Lotti et al., 2016) and Cir X-1 (kT=1.6 keV, Schulz et al., 2020). The hard band X-ray spectrum of J17453213 is consistent with an IP scenario, but not exclusive to it (e.g., Chakrabarty et al., 2014). If the fundamental period is 1228 s, one piece of evidence against the UCXB scenario is its possible pulse profile. A 180 ∘-separated double-peaked pulse profile usually corresponds to a rotational signal from compact objects like IPs and accreting pulsars (Annala & Poutanen, 2010). A standard example of sources with this sort of pulse profile is black widow pulsars, but a 180 ∘-separated double-peaked pulse profile would require a fine-tuning of the geometries of intra-binary shocks (Romani & Sanchez, 2016). Although orbital modulations of X-ray binaries rarely generate this kind of profile, positive examples do exist, e.g., the HMXB Vela X-1 (Malacaria et al., 2016). If the radio observations in the 1–3 GHz range are accurate, the emission contrast between the lower and higher band of 1–3 GHz could be explained by self-absorbed jets (Kaiser, 2006) naturally.
The spin of polars is usually synchronized or slightly asynchronous to their orbital motion. Except AM CVn systems, most of the CVs have orbital periods longer than 80 mins (Mukai, 2017). For the white dwarf binary scenario, considering the length of the 614 s signal, we interpret it as the rotational period of an IP or the orbital period of an AM CVn system. IPs (Warner, 2003; Mukai, 2017) are a subclass of CVs with moderate magnetic fields strong enough to truncate accretion discs, but weaker than the magnetic fields of polars, which prevent the formation of discs. The accretion stream would follow magnetic filed lines and form a shock when it collides with the magnetic poles of white dwarfs. IPs can show Fe Kα complex (Hellier, & Mukai, 2004), but this is almost ubiquitous in X-ray sources. A secure identification requires a spectroscopic observation in the optical band (e.g., Hare et al., 2021), which is impossible for J17453213. Arguments in favor of an IP identity include: 1) the hard band X-ray spectral shape is consistent with IPs (Mukai, 2017). Sources with thermal bremsstrahlung temperatures in the range of dozens of keV are often identified to be IPs (Tomsick et al., 2016; Clavel et al., 2016; Hare et al., 2021; Coughenour et al., 2022), 2) at least eight IPs show 180 ∘-separated double-peaked pulse profiles (Norton et al., 1999, 2002; Nasiroglu et al., 2012) generated by two-pole accretion, which is good news for an IP scenario if 1228 s is fundamental, and 3) IPs have late-type companions. The strongest counter-argument to the IP nature is the tentative radio detection by ATCA. IPs are not strong radio emitters (Barrett et al., 2017, 2020). J17453213 even showed evidence of radio emission with a positive spectral index. But follow-up radio observations could not confirm it. Therefore, either that detection is an artefact or J17453213 is transient in the radio band. If J17453213 is indeed an IP, using the PSR model derived by Suleimanov et al. (2019), we can estimate a mass (last line of Table.3) for J17453213, which is compatible with the typical mass of an IP (Shaw et al., 2020). For AM CVn systems in particular, they can have Fe Kα emission (Ramsay et al., 2005) and usually can be modelled by optically thin thermal plasma emission (Ramsay et al., 2007). Nevertheless, for those short-period AM CVn systems, they are modelled by BB emission with temperatures of dozens of eV (Nelemans et al., 2004; Solheim, 2010).
In summary, properties like the hard thermal bremsstrahlung spectrum, double-peaked X-ray pulse profile (if 1228 s is fundamental), faint X-ray luminosity, and an invisible companion in the optical band are naturally compatible with an IP origin. Considering either of these properties can be cracked, the nonexistence of an optical counterpart, and the possibility that the J17453213 is transient in the radio band, based on the current data, we argue the second choice for J17453213 is an ultra-compact X-ray binary. A deep search for an infrared counterpart may help reveal its nature.
Acknowledgements
GH would like to thank J. F. Kaczmarek and Paul Barrett for radio observations, data analysis and writing the radio sections.
GH would also like to thank Matteo Bachetti, Roberto Soria, Sean Lake, Kaya Mori, Frank Haberl, George Hobbs and Charles Hailey for proposing observation time, data analysis and revising the paper. Thomas Russell, Liu Zhu, Ge Mingyu, Stefania Carpano, Kim Page, Mason Ng, Keith Arnaud, Feng Ye, Yve Schutt, Cui Kaiming and Jin Chichuan helped analysing the data directly or indirectly. GH is grateful to Victor Doroshenko, Valery Suleimanov and Aarran Shaw for their guidance about intermediate polar.
GH would also like to thank the anonymous reviewers for their careful reading of the paper and presenting constructive suggestions.
The Australia Telescope is funded by the Commonwealth of Australia for operation as a National Facility managed by CSIRO. The National Radio Astronomy Observatory is a facility of the National Science Foundation operated under cooperative agreement by Associated Universities, Inc.
This research has made use of software provided by the Chandra X-ray Center (CXC) in the application packages CIAO and Sherpa. This research is based on observations obtained with XMM-Newton, an ESA science mission with instruments and contributions directly funded by ESA Member States and NASA. This research has made use of the NuSTAR Data Analysis Software (NuSTARDAS) jointly developed by the ASI Space Science Data Center (SSDC, Italy) and the California Institute of Technology (Caltech, USA).
This work is supported by the National Natural Science Foundation of China (Grants no. 11703041).
References
- Annala & Poutanen (2010) Annala, M. & Poutanen, J. 2010, A&A, 520, A76. doi:10.1051/0004-6361/200912773
- Bachetti et al. (2021) Bachetti, M., Pilia, M., Huppenkothen, D., et al. 2021, ApJ, 909, 33. doi:10.3847/1538-4357/abda4a
- Bahramian et al. (2021) Bahramian, A., Heinke, C. O., Kennea, J. A., et al. 2021, MNRAS, 501, 2790. doi:10.1093/mnras/staa3868
- Barrett et al. (2017) Barrett, P. E., Dieck, C., Beasley, A. J., et al. 2017, AJ, 154, 252
- Barrett et al. (2020) Barrett, P., Dieck, C., Beasley, A. J., et al. 2020, Advances in Space Research, 66, 1226
- Barrett (2022) Barrett, P. E. 2022, AJ, 163, 58. doi:10.3847/1538-3881/ac3ed9
- Bildsten & Deloye (2004) Bildsten, L. & Deloye, C. J. 2004, ApJ, 607, L119. doi:10.1086/421844
- Buccheri et al. (1983) Buccheri, R., Bennett, K., Bignami, G. F., et al. 1983, A&A, 128, 245
- Cardelli et al. (1989) Cardelli, J. A., Clayton, G. C., & Mathis, J. S. 1989, ApJ, 345, 245. doi:10.1086/167900
- Chakrabarty et al. (2014) Chakrabarty, D., Tomsick, J. A., Grefenstette, B. W., et al. 2014, ApJ, 797, 92. doi:10.1088/0004-637X/797/2/92
- Clavel et al. (2016) Clavel, M., Tomsick, J. A., Bodaghee, A., et al. 2016, MNRAS, 461, 304. doi:10.1093/mnras/stw1330
- Coughenour et al. (2022) Coughenour, B. M., Tomsick, J. A., Shaw, A. W., et al. 2022, MNRAS, 511, 4582. doi:10.1093/mnras/stac263
- Evans et al. (2019) Evans, I. N., Allen, C., Anderson, C. S., et al. 2019, AAS/High Energy Astrophysics Division
- Farrell et al. (2010) Farrell, S. A., Gosling, A. J., Webb, N. A., et al. 2010, A&A, 523, A50
- Freeman et al. (2002) Freeman, P. E., Kashyap, V., Rosner, R., et al. 2002, ApJS, 138, 185. doi:10.1086/324017
- Fruscione et al. (2006) Fruscione, A., McDowell, J. C., Allen, G. E., et al. 2006, Proc. SPIE, 6270, 62701V. doi:10.1117/12.671760
- Gabriel et al. (2004) Gabriel, C., Denby, M., Fyfe, D. J., et al. 2004, Astronomical Data Analysis Software and Systems (ADASS) XIII, 314, 759
- Gendreau et al. (2016) Gendreau, K. C., Arzoumanian, Z., Adkins, P. W., et al. 2016, Proc. SPIE, 9905, 99051H. doi:10.1117/12.2231304
- Gong (2019) Gong, H. 2019, AAS/High Energy Astrophysics Division, 112.51
- Grimm et al. (2002) Grimm, H.-J., Gilfanov, M., & Sunyaev, R. 2002, A&A, 391, 923. doi:10.1051/0004-6361:20020826
- Haberl et al. (2002) Haberl, F., Motch, C., & Zickgraf, F.-J. 2002, A&A, 387, 201
- Hailey et al. (2016) Hailey, C. J., Mori, K., Perez, K., et al. 2016, ApJ, 826, 160. doi:10.3847/0004-637X/826/2/160
- Halpern & Gotthelf (2010) Halpern, J. P. & Gotthelf, E. V. 2010, The Astronomer’s Telegram, 2664
- Hare et al. (2021) Hare, J., Halpern, J. P., Tomsick, J. A., et al. 2021, ApJ, 914, 85. doi:10.3847/1538-4357/abfa96
- Heinke et al. (2013) Heinke, C. O., Ivanova, N., Engel, M. C., et al. 2013, ApJ, 768, 184. doi:10.1088/0004-637X/768/2/184
- Heinke et al. (2015) Heinke, C. O., Bahramian, A., Degenaar, N., et al. 2015, MNRAS, 447, 3034
- Hellier, & Mukai (2004) Hellier, C., & Mukai, K. 2004, MNRAS, 352, 1037
- HI4PI Collaboration et al. (2016) HI4PI Collaboration, Ben Bekhti, N., Fl?er, L., et al. 2016, A&A, 594, A116. doi:10.1051/0004-6361/201629178
- Hong et al. (2016) Hong, J., Mori, K., Hailey, C. J., et al. 2016, ApJ, 825, 132. doi:10.3847/0004-637X/825/2/132
- Huppenkothen et al. (2019) Huppenkothen, D., Bachetti, M., Stevens, A. L., et al. 2019, ApJ, 881, 39. doi:10.3847/1538-4357/ab258d
- in ’t Zand et al. (2007a) in ’t Zand, J. J. M., Jonker, P. G., & Markwardt, C. B. 2007a, A&A, 465, 953
- in ’t Zand et al. (2007b) in ’t Zand, J. J. M., Kuiper, L., den Hartog, P. R., et al. 2007b, A&A, 469, 1063
- in ’t Zand et al. (2009) in ’t Zand, J. J. M., Jonker, P. G., Bassa, C. G., et al. 2009, A&A, 506, 857
- Israel et al. (1999) Israel, G. L., Panzera, M. R., Campana, S., et al. 1999, A&A, 349, L1
- Israel et al. (2002) Israel, G. L., Hummel, W., Covino, S., et al. 2002, A&A, 386, L13. doi:10.1051/0004-6361:20020314
- Kaiser (2006) Kaiser, C. R. 2006, MNRAS, 367, 1083
- Koliopanos et al. (2014) Koliopanos, F., Gilfanov, M., Bildsten, L., et al. 2014, MNRAS, 442, 2817
- Lamb et al. (1973) Lamb, F. K., Pethick, C. J., & Pines, D. 1973, ApJ, 184, 271
- Lotti et al. (2016) Lotti, S., Natalucci, L., Mori, K., et al. 2016, ApJ, 822, 57
- Malacaria et al. (2016) Malacaria, C., Mihara, T., Santangelo, A., et al. 2016, A&A, 588, A100. doi:10.1051/0004-6361/201527009
- Malizia et al. (2010) Malizia, A., Bassani, L., Sguera, V., et al. 2010, MNRAS, 408, 975. doi:10.1111/j.1365-2966.2010.17157.x
- Masetti et al. (2007) Masetti, N., Landi, R., Pretorius, M. L., et al. 2007, A&A, 470, 331
- Masetti et al. (2012) Masetti, N., Parisi, P., Jiménez-Bailón, E., et al. 2012, A&A, 538, A123. doi:10.1051/0004-6361/201118559
- McMullin et al. (2007) McMullin, J. P., Waters, B., Schiebel, D., et al. 2007, Astronomical Data Analysis Software and Systems XVI, 376, 127
- Mukai (1993) Mukai, K. 1993, Legacy, 3, 21
- Mukai (2017) Mukai, K. 2017, PASP, 129, 062001
- Nasiroglu et al. (2012) Nasiroglu, I., Słowikowska, A., Kanbach, G., et al. 2012, MNRAS, 420, 3350. doi:10.1111/j.1365-2966.2011.20256.x
- Nelemans et al. (2004) Nelemans, G., Yungelson, L. R., & Portegies Zwart, S. F. 2004, MNRAS, 349, 181. doi:10.1111/j.1365-2966.2004.07479.x
- Norton et al. (1999) Norton, A. J., Beardmore, A. P., Allan, A., et al. 1999, A&A, 347, 203
- Norton et al. (2002) Norton, A. J., Quaintrell, H., Katajainen, S., et al. 2002, A&A, 384, 195. doi:10.1051/0004-6361:20011820
- Peng & Shen (2021) Peng, S. & Shen, R.-F. 2021, ApJ, 916, 80. doi:10.3847/1538-4357/ac06a7
- Pietrukowicz et al. (2019) Pietrukowicz, P., Mróz, P., Udalski, A., et al. 2019, ApJ, 881, L41. doi:10.3847/2041-8213/ab372d
- Planck Collaboration et al. (2016) Planck Collaboration, Ade, P. A. R., Aghanim, N., et al. 2016, A&A, 594, A28. doi:10.1051/0004-6361/201525819
- Ramsay et al. (2005) Ramsay, G., Hakala, P., Marsh, T., et al. 2005, A&A, 440, 675. doi:10.1051/0004-6361:20052950
- Ramsay et al. (2007) Ramsay, G., Brocksopp, C., Groot, P. J., et al. 2007, 15th European Workshop on White Dwarfs, 372, 425
- Remillard et al. (2022) Remillard, R. A., Loewenstein, M., Steiner, J. F., et al. 2022, AJ, 163, 130. doi:10.3847/1538-3881/ac4ae6
- Roelofs et al. (2010) Roelofs, G. H. A., Rau, A., Marsh, T. R., et al. 2010, ApJ, 711, L138. doi:10.1088/2041-8205/711/2/L138
- Romani & Sanchez (2016) Romani, R. W. & Sanchez, N. 2016, ApJ, 828, 7. doi:10.3847/0004-637X/828/1/7
- Sault et al. (1995) Sault, R. J., Teuben, P. J., & Wright, M. C. H. 1995, Astronomical Data Analysis Software and Systems IV, 433
- Shaw et al. (2020) Shaw, A. W., Heinke, C. O., Mukai, K., et al. 2020, MNRAS, 498, 3457. doi:10.1093/mnras/staa2592
- Schulz et al. (2020) Schulz, N. S., Kallman, T. E., Heinz, S., et al. 2020, ApJ, 891, 150
- Solheim (2010) Solheim, J.-E. 2010, PASP, 122, 1133. doi:10.1086/656680
- Stella et al. (1987) Stella, L., Priedhorsky, W., & White, N. E. 1987, ApJ, 312, L17
- Suleimanov et al. (2019) Suleimanov, V. F., Doroshenko, V., & Werner, K. 2019, MNRAS, 482, 3622. doi:10.1093/mnras/sty2952
- Tomsick et al. (2016) Tomsick, J. A., Rahoui, F., Krivonos, R., et al. 2016, MNRAS, 460, 513. doi:10.1093/mnras/stw871
- van den Eijnden et al. (2018b) van den Eijnden, J., Degenaar, N., Pinto, C., et al. 2018, MNRAS, 475, 2027
- Vaughan et al. (1994) Vaughan, B. A., van der Klis, M., Wood, K. S., et al. 1994, ApJ, 435, 362. doi:10.1086/174818
- Warner (2003) Warner, B. 2003, Cataclysmic Variable Stars, by Brian Warner, pp. 592. ISBN 052154209X. Cambridge, UK: Cambridge University Press, September 2003., 592. doi:10.1017/CBO9780511586491
- Wilson et al. (2011) Wilson, W. E., Ferris, R. H., Axtens, P., et al. 2011, MNRAS, 416, 832