Connections between resonant inelastic x-ray scattering and complementary x-ray spectroscopies: probing excitons at Al K and L1 edges of -Al2O3
Abstract
We present an ab initio study of neutral core and valence electronic excitations in -Al2O3 by solving the Bethe-Salpeter equation (BSE) of many-body perturbation theory within an all-electron framework. Calculated spectra at the Al K and L1 edges are in remarkable agreement with available experiments from X-ray absorption (XAS) and X-ray Raman spectroscopy once excitonic effects are taken into account. The combination of the BSE spectra for the two techniques confirms the dipole-forbidden nature of the exciton prepeak as suggested by recent calculations based on density-functional theory. Moreover, we make predictions for resonant inelastic X-ray scattering (RIXS) spectra at K and L1 edges, which strikingly fully overlap also beyond an independent-particle picture.
The RIXS calculations reveal two distinct regimes as a function of incoming photon energy. Below and at the XAS threshold, we observe Raman-like features, characterised by strong excitonic effects, which we directly compare to peaks in the loss function. Above the XAS threshold, instead, fluorescence features become predominant: RIXS spectra can be well described and analyzed within an independent-particle approximation showing similarity with the X-ray emission spectrum.
I Introduction
The past decades have witnessed huge progress in both the experimental resolution Zimmermann et al. (2020); Ament et al. (2011); de Groot (2001) and the computational accuracy Rehr and Albers (2000); Rehr (2006); de Groot et al. (2021) of X-ray spectroscopies that probe core levels in materials. Core-level spectroscopiesDe Groot and Kotani (2008) have thus become a key tool for the study of a vast number of materials properties, which is evidenced by the surge of interest in their applications across chemistry, physics, biology, and materials science van Bokhoven and Lamberti (2016).
The fundamental processes of photon absorption, emission and scattering give rise to prominent spectroscopies that measure neutral electronic excitations in materialsHuotari (2012). X-ray absorption (XAS), also referred as X-ray absorption near-edge spectroscopy, is determined by electronic transitions from core levels to unoccupied states, while X-ray emission (XES) stems from the decay of valence electrons to fill a core hole, providing complementary information on occupied states. Finally, resonant inelastic X-ray scatteringSchülke (2007) (RIXS) results from the coherent combination of X-ray absorption and emission. In RIXS, the energy of an incoming photon is tuned to resonate with a specific core level, and the subsequent relaxation of a valence electron to fill the core hole is accompanied by the emission of a photon of lower energy. As a result, RIXS probes low-energy excitations of the various degrees of freedom (i.e., charge, spin, lattice) of materialsAment et al. (2011); Kotani and Shin (2001). If, instead, the incident photon energy is much higher than the typical binding energies of core levels, one has the non-resonant inelastic X-ray scatteringSchülke (2007) (NRIXS), also called X-ray Raman scattering (XRS) when used to measure core-level properties.
These X-ray spectroscopies share attractive properties. The large penetration depth of photons, especially in the hard X-ray regime, allows better bulk sensitivity than for spectroscopies that make use of electrons, such as photoelectron spectroscopy. Moreover, the use of the distinctive atomic transitions (i.e., the absorption edges) of the different kinds of atoms ensures chemical sensitivity, providing element and orbital specific information of the local chemical environments in complex materials. In particular, the selection rules of the photoexcitation make it convenient to identify the character of the electronic excitations. Within an independent-particle picture, XES and XAS spectra can be simply related, respectively, to the occupied and unoccupied projected density of states (PDOS) of the absorbing atom with the angular momentum component that fulfils the selection rules. Similarly, RIXS spectra can be associated to the projected joint density of states (JDOS).
However, electron-electron interactions can dramatically alter this independent-particle picture. In particular, according to the semiempirical final-state rulevon Barth and Grossmann (1982); Rehr et al. (2005), one has to deal with the strong perturbing potential due the presence of a core hole in the final state. Indeed, the electron-hole attraction gives rise to core excitons in XAS and XRS, and to both core and valence excitons in RIXS. Excitons manifest as strong enhancements of the spectral weight at the onsets and are often even the main feature in the spectra.
In order to take into account the effects of the electronic interactions, a variety of methods have been developed at different levels of approximation, ranging from the real-space multiple-scattering formalism Zabinsky et al. (1995); Soininen et al. (2005); Kas et al. (2011), to cluster models Josefsson et al. (2012); Haverkort et al. (2012); Maganas et al. (2014) and many-body perturbation theory Shirley (1998, 2000); Shirley et al. (2001); Vinson et al. (2011, 2016, 2017, 2019); Vorwerk et al. (2020, 2022); Gilmore et al. (2021) (MBPT). Within the context of MBPT, the first-principles solution of Bethe-Salpeter equation Strinati (1988); Hanke and Sham (1979) (BSE) is nowadays the state-of-the-art approach to deal with excitonic effects for both core and valence excitationsBechstedt (2014); Martin et al. (2016). The BSE within an all-electron frameworkVorwerk et al. (2019) will be therefore adopted also in the present study.
The aims of the present work are to conduct an in-depth analysis of RIXS spectra, while accounting for coherence and excitonic effects throughout the entire process, and to establish direct connections with the complementary spectroscopy techniques that also measure neutral excitations in materials, such as XAS, XRS and XES. Our study is focused on -Al2O3, which is a prototypical wide-band gap insulator with a broad range of applications, including catalysis, ceramics, and electronicsLin et al. (2019); Hickmott (2004).
Since the BSE has consistently demonstrated its accuracy in describing similar experiments, our conclusions can be reliably extended to other wide band-gap materials.
We have calculated XAS and XRS spectra at the Al K edge reproducing very well the available experimental spectraManuel et al. (2012); Fulton et al. (2015); Delhommaye et al. (2021) when strong excitonic effects, which determine the main peak in the spectra, are properly taken into account. Consistently with results from literature, we find that an excitonic prepeak is also present in the XRS spectrum at large momentum transfer. This prepeak is not visible in the calculated XAS spectrum because dipole forbidden, while it is enabled in the experiments by the coupling with atomic vibrations. Moreover, we demonstrate that both XAS and RIXS spectra at the Al L1 edge are the same as the corresponding spectra at the Al K edge, which suggests that L1 edges could be a valuable alternative in the soft X-ray regime to K edges that require hard X-rays. The analysis of RIXS spectra shows that excitonic effects are mostly visible for excitation energies smaller than (or similar to) the absorption edges, and how for higher excitations energies the RIXS spectra tend to XES spectra where excitonic effects are less relevant.
The article is organized as follows. In Sec. II, we briefly present the basic theoretical concepts for the calculation of the spectra, together with a summary of the computational details. In Sec. III.1 we discuss the calculated XAS and XRS spectra at Al K edge. RIXS spectra for K and L1 edges are then compared and analysed in Sec. III.2. Finally, in Sec. IV, we summarize the main conclusions and give an outlook of the present work.
II Theoretical framework and computational details
II.1 The Bethe-Salpeter equation for excitation spectra
The BSE is an in principle exact equation for the electron-hole correlation function, which is directly linked to the various neutral electronic excitation spectraBechstedt (2014); Martin et al. (2016). Within the GW approximation Hedin (1965) and using a statically screened Coulomb interaction , the BSE can be expressed as an eigenvalue problem for the two-particle excitonic Hamiltonian Onida et al. (2002): .
The matrix elements of the excitonic Hamiltonian can be written in the basis of electron-hole transitions between Bloch orbitals111For simplicity, here we consider explicitly only a spin-unpolarised situation. , which in the ab initio framework are usually calculated within the Kohn-Sham schemeKohn and Sham (1965) of density-functional theory (DFT).
In this basis the matrix elements read:
| (1) |
Here is the independent-particle excitation energy calculated in the GW approximation. is the Coulomb interaction without its long-range, macroscopic, component:
| (2) |
where is a reciprocal-lattice vector and is a wave vector in the first Brillouin zone. The modified Coulomb interaction enters the excitonic Hamiltonian as an exchange electron-hole repulsion and is responsible for crystal local field effect Wiser (1963); Adler (1962). The screened Coulomb interaction is calculated in the random-phase approximation (RPA). It plays the role of the direct electron-hole attraction and is responsible for excitonic effects.
In the Tamm-Dancoff approximation Taylor (1954) (which will be assumed henceforth), one considers only resonant transitions between occupied states and empty states . For XAS spectra is a core level , while for optical spectra is a valence band . In both cases, the absorption spectra, which are described by the imaginary part of the macroscopic dielectric function in the long wavelength limit , are obtained in terms of the excitonic eigenvectors and eigenvalues asOnida et al. (2002):
| (3) |
where is the volume of the system and the oscillator strengths are defined as:
| (4) |
By setting the direct electron-hole interaction to 0 in the excitonic Hamiltonian (1), one finds the absorption spectra within RPA. Moreover, by switching off both electron-hole interactions and , the independent-particle approximation (IPA) is retrieved and the absorption spectrum becomes:
| (5) |
The direct comparison between Eq. (3) and Eq. (5) shows that the electron-hole interactions affect the spectra in two ways: by modifying the peak positions, through a change of excitation energies from the interband transition energies to the excitonic energies , and by altering the peak intensities, through the mixing of the independent-particle transitions that are weighted by the excitonic coefficients .
In XES spectra, the transitions take place between occupied valence states and empty core levels . In this case, there are no electron-hole interactions since both initial and final states contain one hole, but no excited electron. Therefore, XES spectra are usually calculated in the independent-particle pictureMortensen et al. (2017). In the dipole limit one has:
| (6) |
In this approximation, one neglects the effect of the core hole on valence statesAoki and Ohno (2019).
By further assuming that the oscillator strengths in Eqs. (5) and (6) fulfill the dipole selection rule, but are transition-independent constants, the spectra would be equivalent to the PDOS for empty states in XAS and the PDOS for occupied states for XES.
If, at variance with Eq. (1), the excitonic Hamiltonian includes the full Coulomb interaction :
| (7) |
one obtains the loss function, i.e., the inverse macroscopic dielectric functionGatti and Sottile (2013)
| (8) |
in terms of the excitonic eigenvectors and eigenvalues: . By comparing the two excitonic Hamiltonians Eq. (1) and Eq. (7), we understand that the long-range component of the Coulomb interaction gives rise to the difference between the macroscopic dielectric function in the limit, see Eq. (3), and its inverse , see Eq. (8). When the electronic states are localised, such as for core levels, the long-range component of the Coulomb interaction becomes ineffective in the excitonic Hamiltonian (8), and therefore the two spectra (3) and (8) coincideOnida et al. (2002); Sottile et al. (2005); Mizuno and Ohmura (1967).
NRIXS usually investigates electron-hole transitions from valence bands to conduction bands , while XRS focuses on transitions from core levels to conduction bands . In both cases, the excitation spectra are described by the dynamic structure factorSchülke (2007), which is proportional to the loss function (8). A big advantage of scattering spectroscopies with respect to absorption is the possibility to probe electronic excitations as a function of the momentum transfer , going well beyond the dipole limit .
In the case of RIXS222Here we consider only the so called direct RIXS, in contrast to indirect RIXS, where the core hole potential induces secondary excitationsAment et al. (2011). Moreover, we focus on the electronic excitations only., the excitonic Hamiltonian (7) has to be solved twice. In the first BSE, one deals with a core exciton Hamiltonian , where the electron-hole transitions are from core levels to conduction bands . In the second BSE, one has a valence exciton Hamiltonian: , where the transitions are from valence bands to conduction bands . Here we consider only vertical interband excitations at the same point, i.e., we calculate RIXS spectra in the long-wavelength limit.
RIXS spectra can be then obtained from the two sets of excitonic eigenvalues and eigenvectors asVorwerk et al. (2020, 2022):
| (9) |
Here the energy loss is equal to the difference between the incident photon energy and the emitted photon energy : , is the lifetime of the core hole and the oscillator strengths are
| (10) | ||||
| (11) |
with the momentum operator and and the light polarization unity vectors333 Differently from Eq. (4) that adopts a longitudinal gauge, in Eq. (10)-(11) the oscillator strengths are written in the transverse gauge. The two gauges are equivalent in the long-wavelength limitDel Sole and Girlanda (1993), where the polarization unity vectors and the wave vectors play the same role defining the direction of the perturbation. Therefore, the oscillator strengths in Eq. (10) are equivalent to those in the XAS spectra from Eq. (3). Similarly, the oscillator strengths in Eq. (11) correspond to those entering XES spectra in Eq. (6)..
While the possible peak positions in the scattering spectra from Eqs. (8) and (9) are the same, their intensities can be very different. For example, in contrast to NRIXS, RIXS spectra even in the dipole limit can display dipole-forbidden excitations, such as - transitionsAment et al. (2011); Kotani and Shin (2001); Rueff and Shukla (2010), since they stem from a different two-step process. In general, RIXS spectra strongly depend on the excitation energies in the denominators of Eq. (9). For fixed excitation energy , RIXS spectra are usually plotted and analysed as a function of the energy loss , (i.e., as ), or of the emission energy (i.e., as ).
In the IPA the RIXS spectrum (9) becomes:
| (12) |
which is given by a combination of vertical transitions (i.e., at the same point) between core levels of energies , valence bands , and conduction bands . If the peak intensities are further assumed to be constant in Eq. (12), the RIXS signal becomes proportional to the JDOS (projected on the angular component selected by the excitation-disexcitation process). When electron-hole interactions are weak, one may therefore relate RIXS to band-structure propertiesJohnson and Ma (1994); Ma (1994); Carlisle et al. (1995, 1999, 2000); Shirley (2000); Kotani and Shin (2001). On the contrary, excitonic effects also in RIXS spectra mix the various interband transitions, blurring the picture based on the single-particle band structure.
II.2 Computational details
The computational strategy of the present work follows the one that we have already successfully employed for -Al2O3 in Ref. Urquiza et al. (2023). We have adopted the experimental lattice parameter Newnham and Haan (1962) Å and angle in the rhombohedral primitive cell. Calculations have been performed using the full-potential all-electron (AE) approach, as implemented in the Exciting code Gulans et al. (2014); Vorwerk et al. (2019). The Kohn-Sham ground-state wave functions have been calculated within the local density approximation Kohn and Sham (1965) (LDA) of DFT. The Brillouin zone has been sampled with a -grid, using plane waves (PW) expansion with a cutoff energy of 12 Hartree. The AE approach includes muffin-tin (MT) spheres with radii of 2 bohr and 1.45 bohr for aluminum and oxygen, respectively.
BSE calculations are performed on a -grid shifted by (0.05, 0.15, 0.25). In XAS and RIXS simulations, BSE matrix elements are calculated with a cutoff , maintaining a PW cutoff of 7 Hartree for the wave functions. XRS calculations are performed with a PW cutoff of 10 Hartree and .
To obtain the RPA screening of we used the same parameters as in the BSE, including 100 conduction bands. The BSE Hamiltonian was constructed considering 12 (4) occupied states and 20 (60) unoccupied states for the optical (L1 and K edge) spectrum. In order to take into account GW correctionsMarinopoulos and Grüning (2011), the LDA band gap has been opened by a rigid scissor correction of 2.64 eV. Excitations spectra at the Al L1 and K edges have been aligned with the experimental spectra, applying a downshift of the corresponding LDA core level energies of 17.18 eV and 62.9 eV, respectively. For the XRS spectrum, the downshift is 61.2 eV. XAS and XRS spectra for the Al K edge have been convoluted with a Lorentzian broadening of 0.7 eV to match the experimental broadening, bigger than the inverse core-hole lifetime of 0.42 eV Fuggle and Inglesfield (2005); Campbell and Papp (2001).
The K and L1 RIXS spectra have been calculated with the BRIXS code Vorwerk et al. (2020); Vorwerk (2021), considering the first (lowest-energy) 17000 and 80000 BSE eigenvectors and eigenvalues for the core and valence excitations, respectively, which gives a converged RIXS spectrum for an energy loss window of 20 eV.
For a better comparison between RIXS spectra at Al K and L1 edges we have used the same core-hole inverse lifetime of 0.2 eV. The RIXS and XES spectra have been plotted using a broadening of 0.1 eV.
III Results and discussion
-Al2O3 is made of alternate layers of Al and O atoms that are stacked along the axis of our cartesian reference frame. The nature of the chemical bond is largely ionic: the valence bands have mostly O character, while the bottom conduction band is mainly due to Al . The wide band gapWill et al. (1992); French et al. (1994) of 9.6 eV concurs with the low dielectric constantHarman et al. (1994); Schubert et al. (2000) of 3 to give rise to strong excitonic effects for both valence and core excitationsMarinopoulos and Grüning (2011); Urquiza et al. (2023).
Since the final state of XAS is the intermediate state of RIXS, its analysis is propaedeutic to understand RIXS spectra. Therefore, in Sec. III.1 we will first analyse XAS and XRS spectra, before moving to the study of RIXS spectra in Sec. III.2.
III.1 XAS and XRS at Al K edge
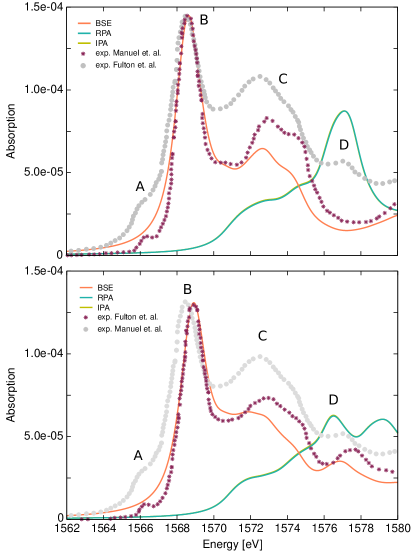
Fig. 1 compares two experimental Al K edge XAS Manuel et al. (2012); Fulton et al. (2015) with the absorption spectra calculated within the IPA, the RPA and the BSE. The top and bottom panels display the spectra for two polarization directions: parallel () and perpendicular () to the Al2O3 layers, respectively. While the spectrum of Fulton et al. Fulton et al. (2015) represents an average of the polarization directions, the polarized XAS experiment by Manuel et al. Manuel et al. (2012) has been done on a single crystal: the two measured spectra distinguish the two orientations.
Like for the optical spectra and the shallower core edgesUrquiza et al. (2023), the two Al K edge XAS spectraManuel et al. (2012) display only a small anisotropy, which is very well captured by the BSE calculations. The IPA and RPA curves are on top of each other, meaning that the contribution of crystal local fields is negligible. This result may seem surprising since Al electrons are localised, giving rise to an inhomogeneous charge response that could be responsible for strong local fieldsOnida et al. (2002). However, electrons are also not highly polarizable, which implies that the induced charge is so small that local field effects are negligible. On the contrary, taking into account excitonic effects in the BSE spectra is crucial to reproduce the main features of the experiments, notably the most prominent peak (B) and the secondary peaks (C) and (D). The ratio between the features (B) and (C) is an important indicator for aluminium coordinationKato et al. (2001); Mogi et al. (2004), used in particular to distinguish the tetrahedral AlO4 from the octahedral AlO6 of -Al2O3.
In the experimental spectra there is also a prepeak (A) at eV that is not present in the calculated spectra. In the BSE calculation, we actually find an excitonic eigenvalue at the same energy. However, its oscillator strength is negligibly small, i.e., it is a dark exciton. Indeed, it corresponds to electron-hole transitions from the core level to the bottom of the conduction band around the point with mostly character, which therefore are dipole forbidden. This prepeak (A) has been extensively studied both theoretically and experimentally Li et al. (1995); Cabaret et al. (1996); Ildefonse et al. (1998); Mo and Ching (2000); Cabaret et al. (2005); Cabaret and Brouder (2009); Brouder et al. (2010); Manuel et al. (2012); Nemausat et al. (2016). The current interpretation is that atomic vibrations enhance the Al hybridization at the bottom of the conduction band, by deviating the Al atoms from their centrosymmetric positions and thus enabling Al atomic-like transitions in the measured XAS spectra. Between the prepeak (A) and the main peak (B) we also identify additional excitons that have low oscillator strengths but are not completely dark. They correspond to transitions from states to the first conduction band, for points between and T, characterised by non-zero Al hybridisation.
The binding energy of the lowest energy dark exciton is 1.69 eV, while the three main exciton peaks (B), (C) and (D) are within the continuum of electron-hole transitions of the IPA spectrum.
In order to corroborate the interpretation that the prepeak (A) in XAS is associated to a dipole-forbidden exciton, we also calculate the XRS spectra from the solution of the BSE at the same Al K edge.
In the dipole limit , for localised electrons such as core levels, the loss function (measured by XRS, see Eq. (8)) tends to the absorption spectrum (measured by XAS, see Eq. (3)):
| (13) |
Mathematically, this results from . In this situation, the absorption spectrum and the loss function yield the same information. As the magnitude of the momentum transfer increases, instead, XRS probes non-dipolar transitions, potentially leading to the emergence of features not visible in the XAS spectra.
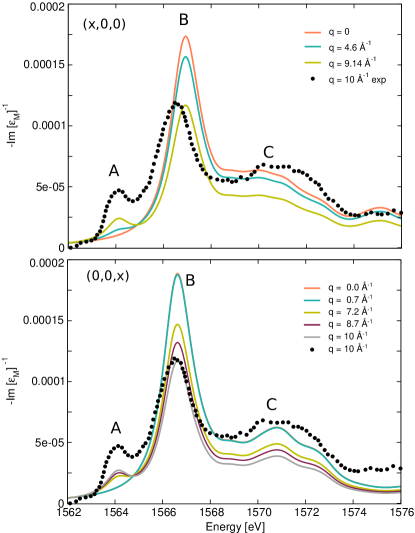
The BSE loss functions calculated for different momentum transfers along the and Cartesian directions are shown in Fig 2, and compared to the experimental XRS spectrumDelhommaye et al. (2021) for Å-1. The measurement was done on a powder sample, therefore its momentum direction dependence could not be resolved. Also in this case the agreement between the BSE spectrum and experiment is noteworthy, and could be further improved by taking into account the coupling with atomic vibrationsDelhommaye et al. (2021).
In the dipole limit , the loss functions match the corresponding absorption spectra in Fig. 1, as expected from the previous discussion. The loss function remains the same, without any trace of the prepeak (A), also for Å-1, which corresponds to the momentum carried by X-ray photons absorbed at 1.5 KeV energy in the Al K edge XAS. Instead, as the value further increases, the prepeak (A) becomes progressively more visible and intensifies in the loss function. It becomes clearly detectable in the spectrum for Å-1. This behavior demonstrates unequivocally its non-dipolar origin.
Besides changing their relative intensities, the three main features (A), (B), (C) do not show appreciable dispersions as a function of the momentum transfer . Only the exciton peak (B) slightly disperses (by 0.1 eV) to higher energies for along . The non-dispersive character of these excitations is a manifestation of their localised nature.
In summary, our BSE calculations highlight the strong core excitonic effects at the Al K edge of XAS and XRS. The combination of absorption and loss function spectra strongly supports the non-dipolar Al character of the exciton prepeak (A). It becomes visible in the spectra either for a coupling with atomic vibrations or at finite momentum transfers . Our results based on the solution of the many-body BSE agree with the single-particle DFT-based approachDelhommaye et al. (2021); Manuel et al. (2012); Brouder et al. (2010); Grad et al. (2022), where the final state is calculated for a supercell with a core-hole localised on the absorbing atom444Or, also, by using the schemeNakanishi and Ohta (2009).. The strong electron-hole attraction is explicitly accounted for in the BSE by the screened Coulomb interaction term , and implicitly in the DFT approach by allowing for electronic relaxation in presence of a core holeLiang et al. (2017).
III.2 Resonant inelastic x-ray scattering at Al L1 and K edges
While, in principle, unoccupied states could be equivalently probed in XAS by excitations from either or core levels, theoretical and experimental investigations predominantly focus on K edges disregarding L1 edges. In the independent-particle picture, excitation spectra of -Al2O3 at Al K and L1 edges can be described by the same unoccupied Al PDOSNufer et al. (2001). When excitonic effects are taken into account, instead, one could expect that the higher degree of localisation of the core hole could lead to stronger electron-hole interactions at the K edge than at the L1 edge. Their impact on the spectra would be therefore different.
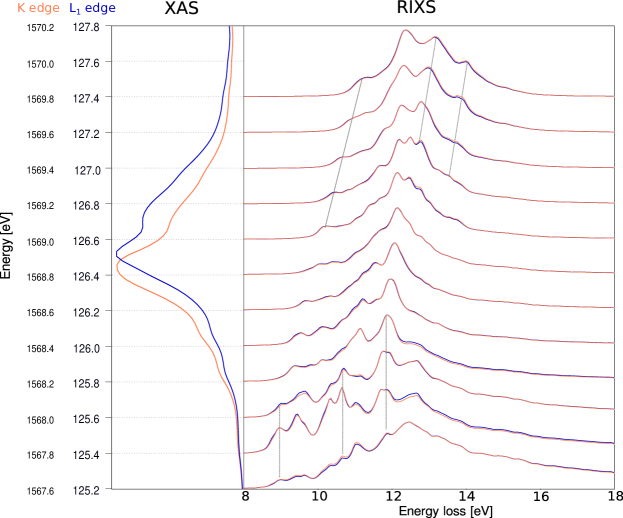
Instead, in the left panel of Fig. 3, the comparison of the Al K and L1 XAS spectra calculated within the BSE shows that their equivalence holds also beyond the independent-particle picture. Indeed, the two calculated spectra are extremely similar, besides a small shift ( 0.1 eV) of the main peak, and an overall scaling factor of of the intensity of the L1 edge with respect to the K edge (the former being more intense than the latter).
Moreover, the right panel of Fig. 3 shows that also RIXS spectra calculated from the BSE at the L1 and K edges overlap almost entirely, for all the incoming photon energy spanning a wide energy range of 2.6 eV across the corresponding XAS edge. Therefore, our detailed comparison of both XAS and RIXS spectra suggests that the less common L1 edge could be equivalently utilized (if the background is not too high) at the place of the K edge. To the best of our knowledge, RIXS spectra of -Al2O3 have not been measured at these edges yet. Our calculations thus represent a prediction for the direct RIXS channel. In the following, we will analyse in detail only the RIXS spectra at the L1 edge, since the K edge RIXS yields the same information.
Following Shirley and coworkersJia et al. (1996); Carlisle et al. (1999); Shirley (2000), we can distinguish two qualitatively different regimes for RIXS spectra (even though this separation is not sharp). For incoming photon energies below the XAS onset (i.e., for ), the energy conservation in Eq. (9) implies that peaks in the spectra are located at the same energy losses independently of the excitation energy . Equivalently, the emission photon energies increase linearly with increasing incoming photon energies . In this case, the excitations are said to have a Raman-like behavior. Instead, for incoming photon energies above the XAS onset, the denominators in Eq. (9) enhance the resonant conditions (within an energy range dictated by the inverse lifetime ). In this regime, the energies of the peaks in the spectra increase linearly with the excitation energies . They are thus located at constant emission energies , displaying a fluorescence-like behavior.
The right panel Fig. 3 illustrates how the BSE approach is capable to capture both regimes (the thin black lines across the different spectra indicate these two regimes). Indeed, for excitation energies below the edge, we can identify several Raman peaks in the RIXS spectra that are located at constant energy loss, even though their shape strongly changes with . Such changes in the spectrum with only small variations in cannot be explained in terms of a XAS modulation, highlighting the coherence between the absorption and emission processes. For excitation energies above the edge, instead, all the main structures of the RIXS spectra qualitatively change their behavior, displaying a linear dependence on the excitation energy, i.e., they become fluorescences. Due to their different nature, we will analyze these two regimes in more detail, separately.
III.2.1 RIXS up to the XAS threshold: connection with the loss function
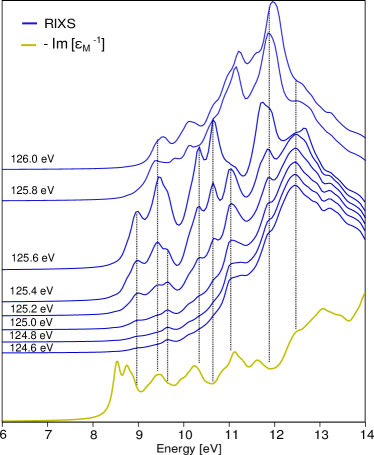
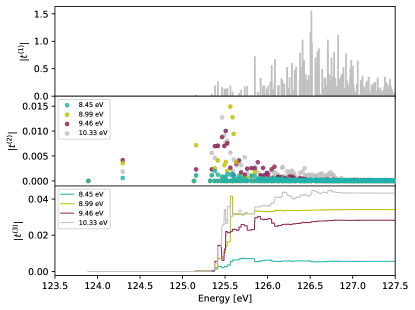
Fig. 4 focuses on the L1 RIXS spectra for incoming photon energies taken every 0.2 eV between 124.6 and 126 eV, i.e., below the XAS threshold.
The RIXS spectra are also compared to the loss function (8) for . Even though the possible excitation energies in RIXS and in the loss function are the same (Eqs. (8)-(9) share the same energy conservation terms), the corresponding peak intensities in the two cases are generally very different (in particular, in the RIXS spectra they are also strongly dependent on the incoming photon energy , which enhances features at resonant energies through the denominators in Eq. (9)). Since moreover in a solid the possible excitation energies form a continuum, matching the corresponding features on the basis of a direct comparison of the spectra is generally not obvious (see the vertical lines in Fig. 4). For the -Al2O3 spectra in Fig. 4, in particular, the most evident discrepancy are the two peaks in the loss function below 9 eV that are missing in the RIXS spectra. They correspond to two bound excitonsUrquiza et al. (2023) located inside the band gap of -Al2O3. We can therefore wonder: Why aren’t they visible also in the RIXS spectra? And, more in general, how can we use the information from the BSE eigenvalues and eigenfunctions to analyse RIXS spectra and connect them with the loss function?
In order to address these questions in detail and analyze the interference between core and valence excitons, we introduce the cumulative oscillator strength for the peak of energy in the RIXS spectrum:
| (14) |
For , yields the peak intensity in the RIXS spectrum (calculated for incoming photon energy ) associated to the excitation energy . Its plot as a function of the energy reflects the interference between absorption and emission processes, represented by the terms and at the numerator of Eq. (14), respectively. Since they are complex numbers, the interference can be constructive or destructive, displaying the many-body character of the excitationsUrquiza et al. (2023); Lorin et al. (2021). At the same time also the denominator of Eq. (14) may cross zero for , expressing the resonant nature of RIXS. As a result, is generally not a monotonic function of the energy .
The top and middle panels of Fig. 5 respectively show the absorption oscillator strenghts (see Eq. (10)), and the excitation pathways for few selected valence excitons (see Eq. (11)), as a function of the core excitation energy. To understand why the first peak in the loss function is not visible in RIXS, in the bottom panel of Fig. 5 we analyze the cumulative oscillator strenght . In this analysis, the incoming photon energy is set to 125.6 eV, corresponding to the higher energy for which Raman features are noticeable. The behavior of the valence exciton with energy eV is compared with those of the excitons at energies 8.99 eV, 9.45 eV, and 10.33 eV, corresponding to the first three visible peaks in the RIXS spectra. For all the valence excitons , the excitation pathways are not zero at low excitation energies eV, where the absorption oscillators are instead negligible, due to the forbidden nature of the transition between the Al core level and the bottom of the conduction band, primarily of Al character. Accordingly, they do not contribute to the RIXS spectrum. For the exciton eV, the values of the other excitation pathways are very small, canceling out the contributions of the absorption oscillators for all other energies. The resulting oscillator strength is therefore always very small, and as a result the exciton is not visible in the RIXS spectrum. For the other valence excitons corresponding to the visible peaks in the RIXS spectrum, instead, the emission contributions provide constructive interference with the absorption oscillators at higher energies. As a result, the peaks are visible in the RIXS spectrum.
From this analysis, we can therefore conclude that the lowest-energy peaks in the loss function (see the yellow curve in Fig. 4) are not visible in the RIXS spectra because the first absorption step, corresponding to the excitation from core level to the bottom conduction states, is forbidden. In the Al L1 and K edges of -Al2O3, RIXS is not able to probe the lowest energy valence exciton states involving combinations of top-valence and bottom-conduction states, but only excitons with higher energies ( 9 eV) stemming from higher conduction states.
III.2.2 RIXS at and beyond the XAS threshold: excitonic effects fading away and connection with XES
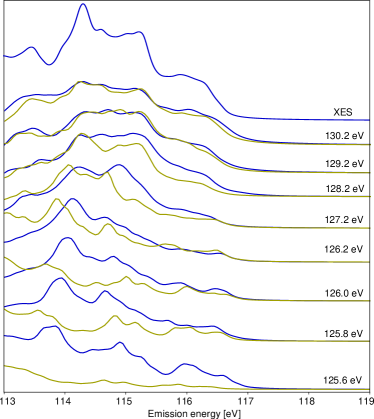
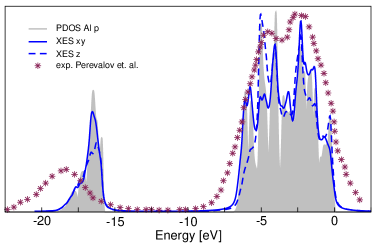
Fig. 6 presents BSE and IPA RIXS spectra for excitation energies across and above the XAS Al L1 threshold. The two series of spectra have been obtained from Eqs. (9) and (12), respectively. Note that, in order to highlight fluorescence features, here the spectra have been plotted as a function of the emission photon energy , instead of the energy loss , as shown in Figs. 3-4.
Below the threshold and for energies up to 128.2 eV large differences between IPA and BSE spectra are noticeable. This implies that strong excitonic effects impact RIXS in -Al2O3, making it impossible an interpretation based only on a band-structure picture.
One should therefore adopt a many-body picture, where the intermediate and final states correspond to a superposition of many single-particle states at different crystal momenta and from different bands.
On the contrary, for incoming photon energies well above the XAS threshold, the IPA and the BSE provide quite similar results. In this regime, the features observed at constant emission energy are indicative of a two-step fluorescence process, where absorption and emission are independent. Consequently, the absorption process (represented by the contributions in Eq. (9)) acts as a scaling factor and the RIXS spectrum is characterised by fluorescence features (determined by the contributions in Eq. (9)). At high incoming photon energies, since excitonic effects are negligible, the BSE RIXS (9) becomes similar to IPA RIXS (12), and since absorption and emission are decoupled, the RIXS spectrum also becomes very close to the XES spectrum (6).
Moreover, as evidenced by Fig. 7, the XES spectrum can be very well described by the angular component of Al in the PDOS for the valence band. The PDOS shows peaks between -20 eV and -15 eV corresponding to aluminum states hybridized with the oxygen states. Separated by a large gap of 8 eV, starting at -7 eV up to the maximum of the valence band set at 0 eV, one finds Al states mostly hybridized with O states. Even though the separation between the O and groups of bands is underestimated in the LDA, the calculations reproduce very well the experimental XES spectrum from Ref.Perevalov, T. V. et al. (2010), including the two-peak structure in the O valence band.
Even in a material like -Al2O3 where strong excitonic effects are at play (for both core and valence excitations), we can therefore conclude that at high photon energy RIXS is still capable to provide information about band-structure properties.
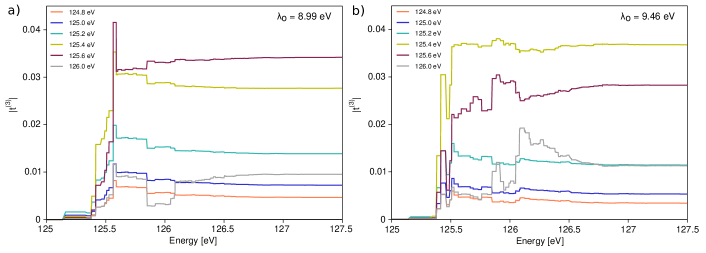
In order to understand how Raman features in RIXS spectra give way to fluorescence features as the incoming photon energy increases, we examine the dependence of the oscillator strenghts (14) on , for specific optical excitons 8.99 eV and 9.46 eV, as shown in Fig. 9. The two plots show that for incoming photon energies below the XAS threshold (125.6 eV), the interference patterns are relatively constant. On the other hand, the intensity increases accordingly with the resonance between and the core exciton energies , reaching the highest value at 125.4–126.6 eV. Beyond this energy, the oscillator strength decays as a result of two effects: the loss of resonance (for the two specific optical exciton considered here) and the change in the interference pattern produced by the sign in the denominator of Eq. (9). As a result, becomes negligible in the case of the first peak, at an energy loss of 8.99 eV, while it remains visible but with lower intensity at 9.46 eV. This explains the RIXS features of Fig. 4, where the first peak disappears after 125.6 eV and the second peak is visible up to 126.0 eV.
The second observation that can be extracted from the plots is that even though the absorption oscillator strength and excitation pathways are the same for a given , when the incoming photon energies are beyond the XAS threshold, the contributions to tend to shift to higher energies as increases. This trend is more noticeable in the fluorescence regime, which will be explained below.
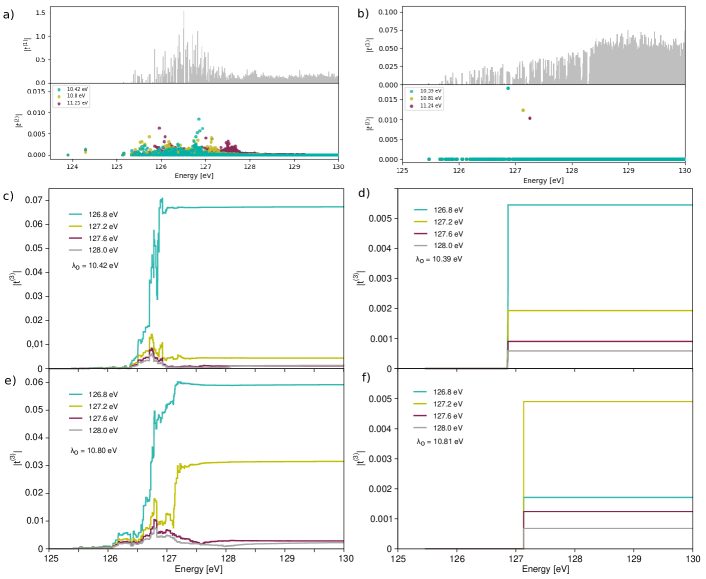
Fig 9 shows the absolute value of the absorption oscillator strengths and the excitation pathways for (a) BSE and (b) IPA RIXS, at three different energy losses: 10.4, 10.8 and 11.2 eV. The resulting cumulative oscillator strengths calculated for BSE RIXS at two values are displayed in panels (c) (10.42 eV) and (e) (10.80 eV). Similarly, the calculated within IPA are displayed in the panels (d) for 10.39 eV and (f) for 10.81 eV. The figure highlights the fact that, given a specific optical exciton , the differences in the with incoming photon energy are only given by the effect of the denominator of Eq. (9), as discussed above.
Here it is interesting to notice that the largest contributions of the excitation pathways (panels (a) and (b)) tend to be centered around higher energies as the energy of the valence excitons increases (this has been also observed in Fig. 5). These excitons stem from electron-hole transitions of higher energies, originating from valence and conduction states farther away from the top valence and bottom conduction, respectively. Correspondingly, a larger excitation energy is required to probe those higher-energy conduction states.
If one compares the RIXS oscillator strengths for the BSE (panels (c) and (e)) and IPA (panels (d) and (f)), it is possible to conclude that the blueshifts in the energy contributions to for increasing are the result of the excitonic effects, which give more weight to higher core excitons as increases, while in the IPA picture the jump in the is given at a constant energy for all .
If we compare the (c)-(f) panels in Fig 9, it is noticeable how the RIXS oscillator strength for high leads to negligible values at low energy-loss peaks (panels (c) and (d)), while they become more prominent as the energy loss increases (panels (e) and (f)). This analysis provides the last piece to understand the movement of peaks in the fluorescence regime. The fact that the excitation pathways (panels (a) and (b)) shift to higher core energies as one moves to higher optical excitation energies (or energy loss) imposes resonance (according to Eq (9)) at higher incoming photon energy . Consequently, the increase of causes that RIXS oscillator strength becomes more intense at higher .
As a summary, one can highlight that within the many body picture, has two main effects: 1) before the XAS edge, it acts as a scaling factor, leaving the role of the interference to the interplay between and at each optical exciton energy ; and 2) for incoming photon energies in resonance and beyond the XAS edge, it determines for each core exciton , whether the interference between and will be constructive or destructive according to the sign.
IV Conclusions
We have presented an in-depth analysis of RIXS spectra, considering coherence and excitonic effects throughout the process. Additionally, we have established several connections between RIXS and complementary spectroscopy techniques that assess neutral excitations in materials, specifically XAS, XRS, and XES. We have applied the BSE approach to study core and semicore excitations of corundum -Al2O3, a widely used material due to its optical and structural properties.
The comparison between experimental Al K edges XAS spectra and calculated spectra at different polarization directions has demonstrated that excitonic effects are crucial to reproduce most features of the experimental data. The experimental prepeak (A) observed at 1566 eV is a dark exciton representing dipole-forbidden transitions in the calculations. However, it becomes a bright exciton in the calculated loss functions at finite momentum transfers, which includes multipole contributions.
Remarkably, our study reveals that both XAS and RIXS spectra, even when calculated within the BSE, at the K and L1 edges exhibit a high degree of agreement. This result suggests the use of soft X-ray techniques for studying the L1 edge and extracting the same information as the traditionally explored K edge.
For excitation energies below the XAS onset, the RIXS spectra show a Raman-like behavior, where the energy losses remain constant as the incident photon energy is varied. The comparative analysis of the Raman losses between RIXS and the loss function sheds light on differences in selection rules and intensity enhancements between the two techniques. Beyond the XAS threshold, RIXS displays a two-step fluorescence behavior, with peaks shifting in accordance with , highlighting the loss of coherence between the absorption and the emission processes. The agreement with XES emphasizes the similarities between fluorescence and emission. In the same fashion, excitonic effects become weaker for excitation energies well above the threshold. Therefore, if one wishes to probe valence excitons by RIXS, excitation energies below or at the edge should be selected. Conversely, if band-structure properties are the target, higher excitation energies should be preferred.
Altogether, these findings contribute to a deeper understanding of the RIXS process, its behavior in different energy regimes, and its connection with other spectroscopic techniques, facilitating further insights into materials’ electronic properties.
Acknowledgements.
We acknowledge valuable discussions with Christian Vorwerk. We thank the French Agence Nationale de la Recherche (ANR) for financial support (Grant Agreements No. ANR-19-CE30-0011). Computational time was granted by GENCI (Project No. 544).References
- Zimmermann et al. (2020) P. Zimmermann, S. Peredkov, P. M. Abdala, S. De Beer, M. Tromp, C. Müller, and J. A. van Bokhoven, Coordination Chemistry Reviews 423 (2020), 10.1016/j.ccr.2020.213466.
- Ament et al. (2011) L. J. P. Ament, M. van Veenendaal, T. P. Devereaux, J. P. Hill, and J. van den Brink, Rev. Mod. Phys. 83, 705 (2011).
- de Groot (2001) F. de Groot, Chemical Reviews 101, 1779 (2001).
- Rehr and Albers (2000) J. J. Rehr and R. C. Albers, Rev. Mod. Phys. 72, 621 (2000).
- Rehr (2006) J. Rehr, Radiation Physics and Chemistry 75, 1547 (2006).
- de Groot et al. (2021) F. M. de Groot, H. Elnaggar, F. Frati, R. pan Wang, M. U. Delgado-Jaime, M. van Veenendaal, J. Fernandez-Rodriguez, M. W. Haverkort, R. J. Green, G. van der Laan, Y. Kvashnin, A. Hariki, H. Ikeno, H. Ramanantoanina, C. Daul, B. Delley, M. Odelius, M. Lundberg, O. Kuhn, S. I. Bokarev, E. Shirley, J. Vinson, K. Gilmore, M. Stener, G. Fronzoni, P. Decleva, P. Kruger, M. Retegan, Y. Joly, C. Vorwerk, C. Draxl, J. Rehr, and A. Tanaka, Journal of Electron Spectroscopy and Related Phenomena 249, 147061 (2021).
- De Groot and Kotani (2008) F. De Groot and A. Kotani, Core level spectroscopy of solids (CRC press, 2008).
- van Bokhoven and Lamberti (2016) J. van Bokhoven and C. Lamberti, X-Ray Absorption and X-Ray Emission Spectroscopy: Theory and Applications, vol. 1 (Wiley, 2016).
- Huotari (2012) S. Huotari, “Spectroscopy in the frequency domain,” in Fundamentals of Time-Dependent Density Functional Theory, edited by M. A. Marques, N. T. Maitra, F. M. Nogueira, E. Gross, and A. Rubio (Springer Berlin Heidelberg, Berlin, Heidelberg, 2012) pp. 15–28.
- Schülke (2007) W. Schülke, Electron Dynamics by Inelastic X-Ray Scattering, Oxford Series on Synchrotron Radiation (OUP Oxford, 2007).
- Kotani and Shin (2001) A. Kotani and S. Shin, Rev. Mod. Phys. 73, 203 (2001).
- von Barth and Grossmann (1982) U. von Barth and G. Grossmann, Phys. Rev. B 25, 5150 (1982).
- Rehr et al. (2005) J. J. Rehr, J. A. Soininen, and E. L. Shirley, Physica Scripta 2005, 207 (2005).
- Zabinsky et al. (1995) S. I. Zabinsky, J. J. Rehr, A. Ankudinov, R. C. Albers, and M. J. Eller, Phys. Rev. B 52, 2995 (1995).
- Soininen et al. (2005) J. A. Soininen, A. L. Ankudinov, and J. J. Rehr, Phys. Rev. B 72, 045136 (2005).
- Kas et al. (2011) J. J. Kas, J. J. Rehr, J. A. Soininen, and P. Glatzel, Phys. Rev. B 83, 235114 (2011).
- Josefsson et al. (2012) I. Josefsson, K. Kunnus, S. Schreck, A. Föhlisch, F. de Groot, P. Wernet, and M. Odelius, The Journal of Physical Chemistry Letters 3, 3565 (2012).
- Haverkort et al. (2012) M. W. Haverkort, M. Zwierzycki, and O. K. Andersen, Phys. Rev. B 85, 165113 (2012).
- Maganas et al. (2014) D. Maganas, P. Kristiansen, L.-C. Duda, A. Knop-Gericke, S. DeBeer, R. Schlögl, and F. Neese, The Journal of Physical Chemistry C 118, 20163 (2014).
- Shirley (1998) E. L. Shirley, Phys. Rev. Lett. 80, 794 (1998).
- Shirley (2000) E. L. Shirley, Journal of Electron Spectroscopy and Related Phenomena 110-111, 305 (2000).
- Shirley et al. (2001) E. L. Shirley, J. Soininen, G. Zhang, J. Carlisle, T. Callcott, D. Ederer, L. Terminello, and R. Perera, Journal of Electron Spectroscopy and Related Phenomena 114-116, 939 (2001).
- Vinson et al. (2011) J. Vinson, J. J. Rehr, J. J. Kas, and E. L. Shirley, Phys. Rev. B 83, 115106 (2011).
- Vinson et al. (2016) J. Vinson, T. Jach, M. Müller, R. Unterumsberger, and B. Beckhoff, Phys. Rev. B 94, 035163 (2016).
- Vinson et al. (2017) J. Vinson, T. Jach, M. Müller, R. Unterumsberger, and B. Beckhoff, Phys. Rev. B 96, 205116 (2017).
- Vinson et al. (2019) J. Vinson, T. Jach, M. Müller, R. Unterumsberger, and B. Beckhoff, Phys. Rev. B 100, 085143 (2019).
- Vorwerk et al. (2020) C. Vorwerk, F. Sottile, and C. Draxl, Phys. Rev. Res. 2, 042003 (2020).
- Vorwerk et al. (2022) C. Vorwerk, F. Sottile, and C. Draxl, Phys. Chem. Chem. Phys. 24, 17439 (2022).
- Gilmore et al. (2021) K. Gilmore, J. Pelliciari, Y. Huang, J. J. Kas, M. Dantz, V. N. Strocov, S. Kasahara, Y. Matsuda, T. Das, T. Shibauchi, and T. Schmitt, Phys. Rev. X 11, 031013 (2021).
- Strinati (1988) G. Strinati, La Rivista del Nuovo Cimento (1978-1999) 11, 1 (1988).
- Hanke and Sham (1979) W. Hanke and L. J. Sham, Phys. Rev. Lett. 43, 387 (1979).
- Bechstedt (2014) F. Bechstedt, Many-Body Approach to Electronic Excitations: Concepts and Applications, Springer Series in Solid-State Sciences (Springer Berlin Heidelberg, 2014).
- Martin et al. (2016) R. M. Martin, L. Reining, and D. M. Ceperley, Interacting Electrons: Theory and Computational Approaches (Cambridge University Press, 2016).
- Vorwerk et al. (2019) C. Vorwerk, B. Aurich, C. Cocchi, and C. Draxl, Electronic Structure 1, 037001 (2019).
- Lin et al. (2019) B. Lin, L. Heng, B. Fang, H. Yin, J. Ni, X. Wang, J. Lin, and L. Jiang, ACS Catalysis 9, 1635 (2019).
- Hickmott (2004) T. W. Hickmott, Journal of Applied Physics 33, 2669 (2004).
- Manuel et al. (2012) D. Manuel, D. Cabaret, C. Brouder, P. Sainctavit, A. Bordage, and N. Trcera, Phys. Rev. B 85, 224108 (2012).
- Fulton et al. (2015) J. L. Fulton, N. Govind, T. Huthwelker, E. J. Bylaska, A. Vjunov, S. Pin, and T. D. Smurthwaite, The Journal of Physical Chemistry B 119, 8380 (2015).
- Delhommaye et al. (2021) S. Delhommaye, G. Radtke, C. Brouder, S. P. Collins, S. Huotari, C. Sahle, M. Lazzeri, L. Paulatto, and D. Cabaret, Phys. Rev. B 104, 024302 (2021).
- Hedin (1965) L. Hedin, Phys. Rev. 139, A796 (1965).
- Onida et al. (2002) G. Onida, L. Reining, and A. Rubio, Rev. Mod. Phys. 74, 601 (2002).
- Note (1) For simplicity, here we consider explicitly only a spin-unpolarised situation.
- Kohn and Sham (1965) W. Kohn and L. J. Sham, Phys. Rev. 140, A1133 (1965).
- Wiser (1963) N. Wiser, Phys. Rev. 129, 62 (1963).
- Adler (1962) S. L. Adler, Phys. Rev. 126, 413 (1962).
- Taylor (1954) J. C. Taylor, Phys. Rev. 95, 1313 (1954).
- Mortensen et al. (2017) D. R. Mortensen, G. T. Seidler, J. J. Kas, N. Govind, C. P. Schwartz, S. Pemmaraju, and D. G. Prendergast, Phys. Rev. B 96, 125136 (2017).
- Aoki and Ohno (2019) T. Aoki and K. Ohno, Phys. Rev. B 100, 075149 (2019).
- Gatti and Sottile (2013) M. Gatti and F. Sottile, Phys. Rev. B 88, 155113 (2013).
- Sottile et al. (2005) F. Sottile, F. Bruneval, A. G. Marinopoulos, L. K. Dash, S. Botti, V. Olevano, N. Vast, A. Rubio, and L. Reining, International Journal of Quantum Chemistry 102, 684 (2005).
- Mizuno and Ohmura (1967) Y. Mizuno and Y. Ohmura, Journal of the Physical Society of Japan 22, 445 (1967).
- Note (2) Here we consider only the so called direct RIXS, in contrast to indirect RIXS, where the core hole potential induces secondary excitationsAment et al. (2011). Moreover, we focus on the electronic excitations only.
- Note (3) Differently from Eq. (4\@@italiccorr) that adopts a longitudinal gauge, in Eq. (10\@@italiccorr)-(11\@@italiccorr) the oscillator strengths are written in the transverse gauge. The two gauges are equivalent in the long-wavelength limitDel Sole and Girlanda (1993), where the polarization unity vectors and the wave vectors play the same role defining the direction of the perturbation. Therefore, the oscillator strengths in Eq. (10\@@italiccorr) are equivalent to those in the XAS spectra from Eq. (3\@@italiccorr). Similarly, the oscillator strengths in Eq. (11\@@italiccorr) correspond to those entering XES spectra in Eq. (6\@@italiccorr).
- Rueff and Shukla (2010) J.-P. Rueff and A. Shukla, Rev. Mod. Phys. 82, 847 (2010).
- Johnson and Ma (1994) P. D. Johnson and Y. Ma, Phys. Rev. B 49, 5024 (1994).
- Ma (1994) Y. Ma, Phys. Rev. B 49, 5799 (1994).
- Carlisle et al. (1995) J. A. Carlisle, E. L. Shirley, E. A. Hudson, L. J. Terminello, T. A. Callcott, J. J. Jia, D. L. Ederer, R. C. C. Perera, and F. J. Himpsel, Phys. Rev. Lett. 74, 1234 (1995).
- Carlisle et al. (1999) J. A. Carlisle, E. L. Shirley, L. J. Terminello, J. J. Jia, T. A. Callcott, D. L. Ederer, R. C. C. Perera, and F. J. Himpsel, Phys. Rev. B 59, 7433 (1999).
- Carlisle et al. (2000) J. Carlisle, S. Blankenship, L. Terminello, J. Jia, T. Callcott, D. Ederer, R. Perera, and F. Himpsel, Journal of Electron Spectroscopy and Related Phenomena 110-111, 323 (2000).
- Urquiza et al. (2023) M. L. Urquiza, M. Gatti, and F. Sottile, Phys. Rev. B 107, 205148 (2023).
- Newnham and Haan (1962) E. E. Newnham and Y. M. Haan, Zeitschrift fur Kristallographie - Crystalline Materials 117, 235 (1962).
- Gulans et al. (2014) A. Gulans, S. Kontur, C. Meisenbichler, D. Nabok, P. Pavone, S. Rigamonti, S. Sagmeister, U. Werner, and C. Draxl, Journal of Physics: Condensed Matter 26, 363202 (2014).
- Marinopoulos and Grüning (2011) A. G. Marinopoulos and M. Grüning, Phys. Rev. B 83, 195129 (2011).
- Fuggle and Inglesfield (2005) J. C. Fuggle and J. E. Inglesfield, eds., Unoccupied Electronic States, Fundamentals for XANES, EELS, IPS and BIS (Springer Berlin, Heidelberg, 2005) p. 347.
- Campbell and Papp (2001) J. Campbell and T. Papp, Atomic Data and Nuclear Data Tables 77, 1 (2001).
- Vorwerk (2021) C. W. Vorwerk, PhD thesis, Humboldt-Universität zu Berlin (2021).
- Will et al. (1992) F. G. Will, H. G. De Lorenzi, and K. H. Janora, Journal of the American Ceramic Society 75, 295 (1992).
- French et al. (1994) R. H. French, D. J. Jones, and S. Loughin, Journal of the American Ceramic Society 77, 412 (1994).
- Harman et al. (1994) A. K. Harman, S. Ninomiya, and S. Adachi, Journal of Applied Physics 76, 8032 (1994).
- Schubert et al. (2000) M. Schubert, T. E. Tiwald, and C. M. Herzinger, Phys. Rev. B 61, 8187 (2000).
- Kato et al. (2001) Y. Kato, K.-i. Shimizu, N. Matsushita, T. Yoshida, H. Yoshida, A. Satsuma, and T. Hattori, Phys. Chem. Chem. Phys. 3, 1925 (2001).
- Mogi et al. (2004) M. Mogi, T. Yamamoto, T. Mizoguchi, K. Tatsumi, S. Yoshioka, S. Kameyama, I. Tanaka, and H. Adachi, Materials Transactions 45, 2031 (2004).
- Li et al. (1995) D. Li, G. M. Bancroft, M. E. Fleet, X. H. Feng, and Y. Pan, American Mineralogist 80, 432 (1995).
- Cabaret et al. (1996) D. Cabaret, P. Sainctavit, P. Ildefonse, and A.-M. Flank, Journal of Physics: Condensed Matter 8, 3691 (1996).
- Ildefonse et al. (1998) P. Ildefonse, D. Cabaret, P. Sainctavit, G. Calas, A.-M. Flank, and P. Lagarde, Physics and Chemistry of Minerals 25, 112 (1998).
- Mo and Ching (2000) S.-D. Mo and W. Y. Ching, Phys. Rev. B 62, 7901 (2000).
- Cabaret et al. (2005) D. Cabaret, E. Gaudry, M. Taillefumier, P. Sainctavit, and F. Mauri, Physica Scripta 2005, 131 (2005).
- Cabaret and Brouder (2009) D. Cabaret and C. Brouder, Journal of Physics: Conference Series 190, 012003 (2009).
- Brouder et al. (2010) C. Brouder, D. Cabaret, A. Juhin, and P. Sainctavit, Phys. Rev. B 81, 115125 (2010).
- Nemausat et al. (2016) R. Nemausat, C. Brouder, C. Gervais, and D. Cabaret, Journal of Physics: Conference Series 712, 012006 (2016).
- Grad et al. (2022) G. B. Grad, E. R. González, J. Torres-Díaz, and E. V. Bonzi, Journal of Physics and Chemistry of Solids 168, 110788 (2022).
- Note (4) Or, also, by using the schemeNakanishi and Ohta (2009).
- Liang et al. (2017) Y. Liang, J. Vinson, S. Pemmaraju, W. S. Drisdell, E. L. Shirley, and D. Prendergast, Phys. Rev. Lett. 118, 096402 (2017).
- Nufer et al. (2001) S. Nufer, T. Gemming, C. Elsässer, S. Köstlmeier, and M. Rühle, Ultramicroscopy 86, 339 (2001).
- Jia et al. (1996) J. J. Jia, T. A. Callcott, E. L. Shirley, J. A. Carlisle, L. J. Terminello, A. Asfaw, D. L. Ederer, F. J. Himpsel, and R. C. C. Perera, Phys. Rev. Lett. 76, 4054 (1996).
- Lorin et al. (2021) A. Lorin, M. Gatti, L. Reining, and F. Sottile, Phys. Rev. B 104, 235149 (2021).
- Perevalov, T. V. et al. (2010) Perevalov, T. V., Gritsenko, V. A., and Kaichev, V. V., Eur. Phys. J. Appl. Phys. 52, 30501 (2010).
- Del Sole and Girlanda (1993) R. Del Sole and R. Girlanda, Phys. Rev. B 48, 11789 (1993).
- Nakanishi and Ohta (2009) K. Nakanishi and T. Ohta, Journal of Physics: Condensed Matter 21, 104214 (2009).