An in-depth view of the metallicity distribution of the Small Magellanic Cloud
Abstract
The spatial metallicity distribution of star clusters in the Small Magellanic Cloud (SMC) has recently been found to correlate as a V-shaped function with the semi-major axis of an elliptical framework proposed to assume a projected galaxy flattening. We report results on the impact that the use of such a framework can produce on our understanding of the SMC formation and its chemical enrichment. We show that clusters with similar semi-major axes are placed at a very different distances from the SMC centre. The recently claimed bimodal metallicity distribution of clusters projected on the innermost SMC regions and the V-shaped metallicity gradient fade away when actual distances are used. Although a large dispersion prevails, clusters older than 1 Gyr exhibit a shallow metallicity gradient, caused by slightly different spatial distributions of clusters younger and older than 4 Gyr; the former being more centrally concentrated and having a mean metallicity ([Fe/H]) 0.15 dex more metal-rich than that of older clusters. This metallicity gradient does not show any dependence with the position angle, except for clusters placed beyond 11 kpc, which are located in the eastern side of the galaxy.
keywords:
galaxies: individual: SMC – galaxies: star clusters: general1 Introduction
The spatial metallicity distribution of the Small Magellanic Cloud (SMC) has recently been reanalysed by De Bortoli et al. (2022) from a compilation of metallicities of 57 star clusters. They derived mean Ca II triplet metallicities for six SMC star clusters, which were added to previous metallicity estimates derived using the same technique of other 51 star clusters, taken from their previous works or the literature. They showed that the metallicity estimates of these 57 star clusters are on the same scale. As far as we are aware, this is the largest compilation of SMC star cluster metallicities. From the analysis of this spectroscopic dataset as a function of the projected distance, De Bortoli et al. (2022) found that there would seem to be a bimodal metallicity distribution for star clusters located in the innermost region of the SMC. Apparently, both metal-rich and metal-poor star cluster groups do not exhibit any metallicity gradient, but considered together, they show a negative metallicity gradient similar to that of field stars, which show a unimodal distribution throughout the SMC main body. For star clusters located beyond the SMC innermost region, De Bortoli et al. (2022) found a positive metallicity gradient.
The change in the slope of the metallicity gradient, from a negative to a positive value while moving from the SMC centre outwards, was previously suggested by Parisi et al. (2009); Parisi et al. (2015); Bica et al. (2020); Parisi et al. (2022) and Oliveira et al. (2023), among others, who successively enlarged the star cluster sample analysed. The recent work by De Bortoli et al. (2022) is based on these previous ones. Previously, Piatti (2011) analysed a statistically complete old SMC star cluster sample (age 1 Gyr) and found no metallicity gradient, but a metallicity spread across the entire SMC body. Williams et al. (2022), more recently, performed numerical simulations to describe the formation of the old SMC star cluster population assuming a negligible metallicity gradient.
In this work we in-depth revisit the analysis of the metallicity distribution for star clusters located in the innermost SMC regions and of the V-shaped metallicity grandient. As can be seen, the actual metallicity distribution is a key piece of information to recover the SMC formation history and to properly trace its interaction with the Large Magellanic Cloud (LMC) and the Milky Way (Rubele et al., 2018; Massana et al., 2022). Since a V-shaped metallicity gradient or a lack of any trend of the metallciity with the distance from the SMC centre implies different channels for the SMC formation and evolution, we think that reconciling the above discrepancies is of an important impact for our comprehensive knowledge in this field of research. In Section 2, we dig up the constrains of previous approaches that led them to conclude on the metallicity bimodality and V-shaped metallicity gradient, while in Section 3 we describe actual facts that will comprehensively help reconstructing the SMC formation and its interaction history.
2 Data analysis and discussion
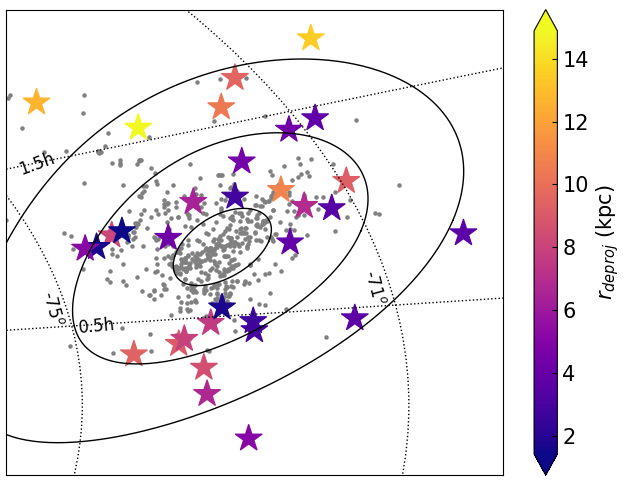
Crowl et al. (2001) used the angular distance to the SMC centre in right ascension and in declination and the line-of-sight depth of 12 old SMC star clusters to study their spatial distribution and the behaviour of their ages and metallicities with the position in the galaxy. They found that the SMC is a triaxial galaxy with the declination, the right ascension and the line-of-sight as the three axis with ratios of approximately 1:2:4. With the aim of mitigating the lack of accurate star cluster heliocentric distances in the literature, Piatti et al. (2007) introduced an elliptical framework that reflected more accurately the SMC flattening. The ellipse has a position angle of 54 and a ratio of 1/2, with centre at RA = 00h 52m 45s, Dec. = -72 49 43 (Crowl et al., 2001). They used the semi-major axis –parallel to the SMC main body– as a meaningful indicator of the projected distance to the SMC centre. Thus, they assumed that cluster age and metallicity variations, if any, correlate much better with a pseudo-elliptical (projected) distance measured from the galaxy centre than with the radial distance, or distances defined along the right ascension or declination axes. For the sake of the reader, Fig. 1 shows as an example three ellipses superimposed on the spatial distribution of the star clusters catalogued by Bica et al. (2020).
Such an elliptical framework has been adopted by different authors when dealing with the SMC metallicity gradient. For instance, Choudhury et al. (2020, see also ()) employed near-infrared photometry from the VISTA Survey of the Magellanic Clouds (VMC, Cioni et al., 2011) to map metallicity trends in the SMC using the elliptical framework of Piatti et al. (2007). They found that field stars show a unimodal metallicity distribution across the galaxy with a shallow V-shaped metallicity gradient. As star clusters are considered, several works arrived to the conclusion of a V-shaped metallicity gradient, in very good agreement with outcomes from the analysis of field stars (e.g., Bica et al., 2020; Parisi et al., 2022; Oliveira et al., 2023, and references therein). De Bortoli et al. (2022) added to this picture of the SMC metallicty map the result of a bimodal metallicity distribution for stars clusters located within the innermost regions of the galaxy (semi-major axis 3.4).
The aforementioned framework does not consider the depth of the SMC, which is much more extended than the size of the galaxy projected in the sky (Ripepi et al., 2017; Muraveva et al., 2018; Graczyk et al., 2020). In this sense, star clusters observed projected onto the innermost regions can be distributed along the whole line-of-sight, so that their distances from the SMC centre can also be very different. This simple possibility has important consequences in our understanding of the SMC formation process. Whether the SMC formed from a outside-in radial collapse (Pagel & Tautvaisiene, 1998), from a major merger Tsujimoto & Bekki (2009), from a closed-box formation model (Da Costa & Hatzidimitriou, 1998), etc, has its own implications in the conclusions that can be drawn from the observed spatial metallicity distribution of star clusters.
| ID | Ref. | [Fe/H] | Ref. | |
|---|---|---|---|---|
| (kpc) | (dex) | |||
| AM3 | 62.84.6 | 1 | -0.750.11 | 4 |
| B99 | — | -0.840.04 | 5 | |
| B168 | 61.92.1 | 2 | -1.080.09 | 10 |
| BS121 | — | -0.660.07 | 6 | |
| BS188 | 52.73.0 | 2 | -0.940.13 | 10 |
| BS196 | 50.12.0 | 2 | -0.890.08 | 10 |
| H86-97 | — | -0.710.05 | 5 | |
| HW31 | — | -1.120.37 | 8 | |
| HW40 | 65.54.2 | 1 | -0.780.05 | 5 |
| HW41 | — | -0.960.36 | 8 | |
| HW42 | 54.52.7 | 3 | -0.950.42 | 8 |
| HW47 | — | -0.920.04 | 6 | |
| HW56 | 53.51.2 | 2 | -0.970.20 | 10 |
| HW67 | — | -0.720.04 | 5 | |
| HW84 | — | -0.910.05 | 6 | |
| HW85 | 54.01.6 | 2 | -0.820.14 | 10 |
| HW86 | — | -0.610.06 | 6 | |
| IC1708 | 65.21.5 | 2 | -1.110.17 | 10 |
| K3 | 60.61.1 | 2 | -0.850.03 | 5 |
| K6 | — | -0.630.02 | 5 | |
| K7 | 64.32.4 | 4 | -0.830.06 | 7 |
| K8 | 69.82.3 | 2 | -0.760.07 | 4 |
| K9 | — | -1.120.05 | 5 | |
| K37 | 62.42.0 | 4 | -0.790.11 | 5 |
| K38 | 66.71.9 | 4 | -0.650.18 | 8 |
| K44 | 62.22.7 | 2 | -0.780.03 | 7 |
| L1 | 56.91.0 | 2 | -1.040.03 | 5 |
| L2 | 54.53.5 | 1 | -1.280.09 | 4 |
| L3 | 53.53.4 | 1 | -0.750.33 | 8 |
| L4 | 53.72.4 | 2 | -1.080.04 | 6 |
| L5 | — | -1.250.05 | 6 | |
| L6 | 54.92.3 | 2 | -1.240.03 | 6 |
| L7 | — | -0.760.06 | 6 | |
| L19 | — | -0.870.03 | 6 | |
| L27 | — | -1.140.06 | 6 | |
| L32 | — | -0.960.04 | 7 | |
| L38 | 64.01.1 | 1 | -1.390.03 | 7 |
| L43 | 58.83.3 | 4 | -0.940.03 | 7 |
| L91 | — | -1.010.35 | 8 | |
| L100 | 58.60.7 | 2 | -0.890.14 | 10 |
| L106 | — | -0.880.06 | 6 | |
| L108 | — | -1.050.05 | 6 | |
| L110 | 47.92.3 | 2 | -1.030.05 | 6 |
| L112 | — | -1.080.07 | 5 | |
| L113 | 50.51.7 | 2 | -1.030.04 | 5 |
| L116 | — | -0.890.02 | 7 | |
| NGC121 | 64.91.2 | 2 | -1.190.12 | 9 |
| NGC152 | 61.95.4 | 1 | -0.720.02 | 7 |
| NGC339 | 57.64.1 | 2 | -1.150.02 | 7 |
| NGC361 | 55.81.7 | 2 | -0.900.03 | 7 |
| NGC411 | 51.83.3 | 1 | -0.740.04 | 7 |
| NGC416 | 60.01.9 | 1 | -0.850.04 | 7 |
| NGC419 | 56.21.3 | 2 | -0.620.02 | 7 |
| NGC643 | — | -0.820.03 | 6 | |
| OGLE-SMC113 | — | -0.800.07 | 5 |
With the aim of performing a more realistic analysis of the star cluster spatial metallicity distribution, we here introduce the actual distance of an star cluster to the SMC centre as an independent variable, In order to compute star cluster distances to the SMC centre, we made use of: i) the compilation of star clusters of De Bortoli et al. (2022); ii) the mean SMC heliocentric distance (62.440.81 kpc; Graczyk et al., 2020; de Grijs & Bono, 2015); and iii) an homogeneous compilation of accurate star cluster heliocentric distances. The 57 star clusters in De Bortoli et al. (2022) were used for comparison purposes of the resulting metallicity gradients by using their derived star cluster metallicities (see Table 1). As for the star cluster distances, we based our analysis on the distance scale built from accurate heliocentric distance estimates by Piatti (2021a, see Table 1). To avoid repetition, we refer the reader to that work for details on the construction of that distance scale. Besides the compilation of distances in Piatti (2021a), we included those in de Grijs & Bono (2015) (AM3, HW40, Lindsay 2, Lindsay 3, Lindsay 38, NGC 152, NGC 411, NGC 416), in Dias et al. (2022) (Kron 7, Kron 37, Kron 38, Lindsay 43), and in Piatti (2022) (HW 42), respectively. All the added star cluster distances are put in the Piatti (2021a)’s distance scale. We gathered in total 32 star clusters with accurate distances and with metallicity estimates in De Bortoli et al. (2022) (see Table 1).
The mean SMC distance (=62.5 kpc Graczyk
et al., 2020), the star cluster distances
(, see Table 1) and the angular distances of the
star clusters to the SMC centre () were used to compute deprojected distances ()
as follows:
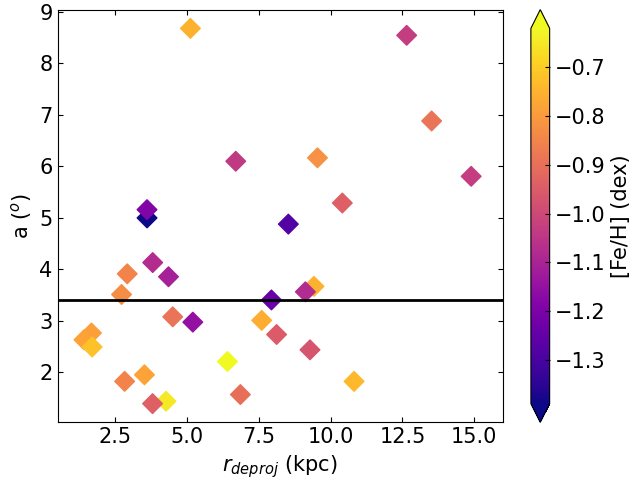
Fig. 1 shows the spatial distribution of the 32 star clusters painted with different colours according to their values. As can be seen, star clusters located close to an ellipse (e.g., 5) have different deprojected distances ( 3 - 14 kpc), which confirms the suspicion that clusters at different distances to the SMC centre can have similar semi-major axis values. The uncovered behaviour is highlighted in Fig. 2, which reveals the lack of linearity between the semi-major axis and the deprojected distance. Particularly, Fig. 2 shows that the innermost star clusters selected by De Bortoli et al. (2022) ( 3.4) span deprojected distances from 1.4 up to 10.8 kpc. Therefore, star clusters projected on to the innermost regions are not necessarily located close to the SMC centre. This seems a straightforward outcome, that is helpful to quantify in order to assess the level of accuracy of the interpretations of the spatial metallicity distributions built using semi-major axes. The limited number of SMC star clusters with accurate heliocentric distance estimates calls our attention of the need of an effort to homogeneously determine distances for a large sample of clusters. Fortunately, there are ongoing observing campaigns aimed at obtaining homogeneous data for the Magellanic Clouds (e.g., see Table 1 of Maia et al., 2019).
From Fig. 2 we also found a unimodal metallicity distribution for star clusters located inside a volume of radius (deprojected distance) 3.5 and estimated for them a mean metallicity of [Fe/H] = -0.800.05 dex. In consequence, the metallicity bimodality found by De Bortoli et al. (2022) rather seems to reflect the superposition of star clusters with different metallicity values placed across the entire SMC extent along the innermost line-of-sight. On the other hand, a bimodal metallicity distribution in the innermost region of the SMC, with a metal-poor ([Fe/H]-1.15 dex) and a metal-rich ([Fe/H]-0.80 dex) peak, respectively, would imply two different star cluster formation epochs that took place only in the inner SMC body, while the outer SMC body kept without noticing them. The SMC is a relative low-mass galaxy (total mass 2109M⊙, Stanimirović et al., 2004), in which star clusters and field stars have evolved synchronically over time (Harris & Zaritsky, 2004; Piatti & Geisler, 2013; Piatti, 2015), and where interactions with the LMC has triggered stellar formation throughout the entire galaxy body (Piatti, 2011, 2012; Rubele et al., 2018). In addition, unimodal spatial metallicity distributions have been observed for field stars (Choudhury et al., 2018; Choudhury et al., 2020).
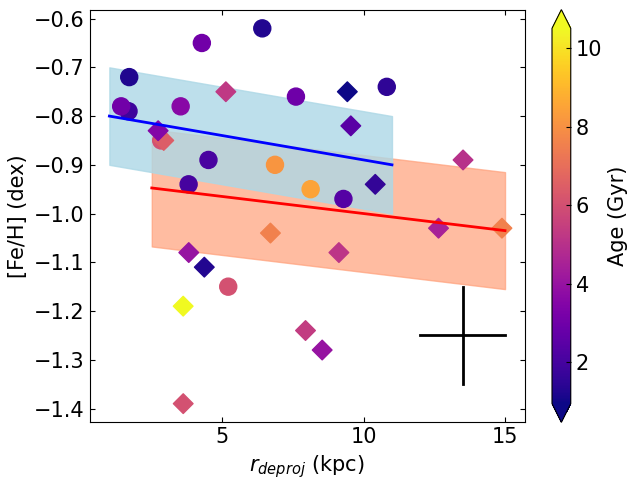
Fig. 3 shows the resulting metallicity gradient. Points are coloured according to the star cluster ages, which were taken from Bica et al. (2020) for uniformity purposes. Fig. 3 suggests that an overall metallicity dispersion prevails for star clusters older than 1 Gyr. Nevertheless, Fig. 3 also hints at star clusters younger than 4 Gyr are found distributed from the SMC centre out to 11 kpc and with a mean [Fe/H] -0.85 dex; while older star clusters are distributed from 3 kpc out to outermost SMC regions and with a mean [Fe/H] -1.0 dex. This slight mean metallicty offset ([Fe/H]=0.15 dex) between younger and older star clusters, that in turn have slight different spatial distributions, tell us about a subtle metallicity gradient of -0.0100.015 dex/kpc. Such a small metallicity gradient arises because the younger the star clusters (the slightly more centrally concentrated), the more metal-rich they are, within the overall metallicity dispersion. For completeness purposes, we split the star cluster sample in two groups with values smaller and larger than 3.4 (circle and diamond in Fig. 3), respectively. and performed linear regressions between their metallicities and deprojected distances. Fig. 3 shows the results of these fits. As can be seen, we did not detect any V-shaped trend of the metallicity with the distance from the SMC centre, as shown by De Bortoli et al. (2022, and references therein). However, Fig. 2 shows that star clusters with values between 3.0 and 5.5 are more metal-poor than those outside that range. Therefore, we conclude that the V-shaped gradient is not real, but a trend that appears when using projected distances as an independent variable. Likewise, field stars seem to share a shallow metallicity gradient with a large dispersion (see, e.g., Mucciarelli et al., 2023, and references therein).
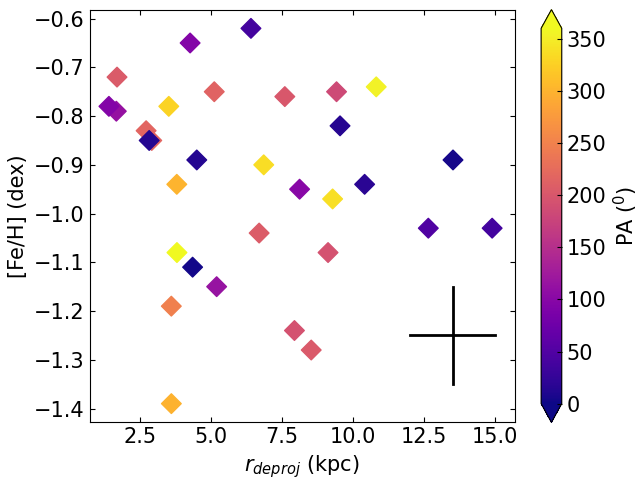
We additionally examined whether the described metallicity gradient has any dependence
with the position angle (PA) measured eastward from the SMC major axis. We assumed that
the SMC major axis is rotated 54 anticlockwise from the North. The PAs in this
rotated system were computed using the positionAngle routine from
PyAstronomy111https://github.com/sczesla/PyAstronomy (PyA, Czesla
et al., 2019)
and the observed distances in the sky to the SMC centre in RA () and
Dec (), respectively, as follows:
= -(RA - RASMC) cos(Dec) cos(PASMC) + (Dec - DecSMC) sin(PASMC),
= (RA - RASMC) cos(Dec) sin(PASMC) + (Dec - DecSMC) cos(PASMC).
Fig. 4 shows that there is not any dependency with the PA, with the sole exception of the three farthest star clusters (BS196, Lindsay 110, Lindsay 113; 11 kpc) located in the SMC eastern side. Their heliocentric distances ( 47-50 kpc) are akin to that of the Magellanic Bridge, so that their positions reflect their motions towards de LMC. Indeed, Piatti (2021b) fitted the rotation disc that best resembles the observed motions of SMC star clusters and found that it is kinematically synchronised with that of field red giants, showing some velocity stretching towards the LMC. For the sake of the reader, if we considered the different SMC sectors, namely: Northern bridge (-15 PA () 40); Bridge (40 PA () 90); West-halo (160 PA () 270); and Counter-bridge (300 PA () 345) (Dias et al., 2022), we would find from Fig. 4 no different gradients.
3 conclusions
Since recent years, the spatial distribution of the SMC has been described as a V-shaped
function from its centre outwards, with a negative slope for the innermost region of the galaxy,
and a positive one for the outer galaxy body. As far as we are aware, this kind of correlation of
the metallicity with the position in a galaxy has only been observed in the SMC. Because of the
important implications of the knowledge of the observed spatial metallicity distribution in our
understanding of the galaxy formation process, its chemical enrichment and the interaction with
the LMC and the Milky Way, we revisited the construction of the SMC star cluster spatial metallicity
distribution. We found from a limited sample of star clusters that needs to be enlarged
for a larger coverage in deprojected distances that:
The elliptical framework adopted to trace the spatial metallicity distribution
(Piatti et al., 2007), by using the so-called semi-major axis as an independent variable, and from which
the V-shaped gradient arises, misleads
the star cluster positions. Star clusters with a similar semi-major axis are found to be located
at very different distances from the SMC centre, in some cases by more than 10 kpc apart.
The bimodal metallicty distribution for the innermost SMC region
would seem to be caused by the consideration of projected distances instead
of the actual ones. Outer and inner star clusters that, according to their 3D positions have
different metallicities, are seen along the same line-of-sight.
The star clusters (ages 1 Gyr) show a shallow metallicity gradient (-0.01 dex/kpc)
as a function of their deprojected distances to the SMC centre. This gradient is caused by
slightly different spatial distributions of star clusters younger and older than 4 Gyr.
The younger ones are more centrally concentrated and have a mean metallicity ([Fe/H])
0.15 dex more metal-rich than those older. Nevertheless, a overall metallicity dispersion
prevails.
The spatial metallicity distribution of star clusters analysed in this work would not seem to show any dependence with the position angle, although there is some hint of star clusters placed beyond 11 kpc from the SMC centre to be located in the eastern side of the galaxy. Such a somehow spatial asymmetry witnesses the interaction between both Magellanic Clouds, with SMC star clusters moving towards the LMC.
Acknowledgements
We thank the referee for the thorough reading of the manuscript and timely suggestions to improve it.
4 Data availability
Data used in this work are available upon request to the author.
References
- Bica et al. (2020) Bica E., Westera P., Kerber L. d. O., Dias B., Maia F., Santos João F. C. J., Barbuy B., Oliveira R. A. P., 2020, AJ, 159, 82
- Choudhury et al. (2018) Choudhury S., Subramaniam A., Cole A. A., Sohn Y.-J., 2018, MNRAS, 475, 4279
- Choudhury et al. (2020) Choudhury S., et al., 2020, MNRAS, 497, 3746
- Cioni et al. (2011) Cioni M.-R. L., et al., 2011, A&A, 527, A116
- Crowl et al. (2001) Crowl H. H., Sarajedini A., Piatti A. E., Geisler D., Bica E., Clariá J. J., Santos Jr. J. F. C., 2001, AJ, 122, 220
- Czesla et al. (2019) Czesla S., Schröter S., Schneider C. P., Huber K. F., Pfeifer F., Andreasen D. T., Zechmeister M., 2019, PyA: Python astronomy-related packages (ascl:1906.010)
- Da Costa & Hatzidimitriou (1998) Da Costa G. S., Hatzidimitriou D., 1998, AJ, 115, 1934
- De Bortoli et al. (2022) De Bortoli B. J., Parisi M. C., Bassino L. P., Geisler D., Dias B., Gimeno G., Angelo M. S., Mauro F., 2022, A&A, 664, A168
- Dias et al. (2021) Dias B., et al., 2021, A&A, 647, L9
- Dias et al. (2022) Dias B., et al., 2022, MNRAS, 512, 4334
- Graczyk et al. (2020) Graczyk D., et al., 2020, ApJ, 904, 13
- Harris & Zaritsky (2004) Harris J., Zaritsky D., 2004, AJ, 127, 1531
- Maia et al. (2019) Maia F. F. S., et al., 2019, MNRAS, 484, 5702
- Massana et al. (2022) Massana P., et al., 2022, MNRAS, 513, L40
- Mucciarelli et al. (2023) Mucciarelli A., Minelli A., Bellazzini M., Lardo C., Romano D., Origlia L., Ferraro F. R., 2023, A&A, 671, A124
- Muraveva et al. (2018) Muraveva T., et al., 2018, MNRAS, 473, 3131
- Oliveira et al. (2023) Oliveira R. A. P., et al., 2023, arXiv e-prints, p. arXiv:2306.05503
- Pagel & Tautvaisiene (1998) Pagel B. E. J., Tautvaisiene G., 1998, MNRAS, 299, 535
- Parisi et al. (2009) Parisi M. C., Grocholski A. J., Geisler D., Sarajedini A., Clariá J. J., 2009, AJ, 138, 517
- Parisi et al. (2015) Parisi M. C., Geisler D., Clariá J. J., Villanova S., Marcionni N., Sarajedini A., Grocholski A. J., 2015, AJ, 149, 154
- Parisi et al. (2022) Parisi M. C., Gramajo L. V., Geisler D., Dias B., Clariá J. J., Da Costa G., Grebel E. K., 2022, A&A, 662, A75
- Piatti (2011) Piatti A. E., 2011, MNRAS, 418, L69
- Piatti (2012) Piatti A. E., 2012, MNRAS, 422, 1109
- Piatti (2015) Piatti A. E., 2015, MNRAS, 451, 3219
- Piatti (2021a) Piatti A. E., 2021a, MNRAS, 508, 3748
- Piatti (2021b) Piatti A. E., 2021b, A&A, 650, A52
- Piatti (2022) Piatti A. E., 2022, Research Notes of the American Astronomical Society, 6, 271
- Piatti & Geisler (2013) Piatti A. E., Geisler D., 2013, AJ, 145, 17
- Piatti et al. (2007) Piatti A. E., Sarajedini A., Geisler D., Gallart C., Wischnjewsky M., 2007, MNRAS, 382, 1203
- Ripepi et al. (2017) Ripepi V., et al., 2017, MNRAS, 472, 808
- Rubele et al. (2018) Rubele S., et al., 2018, MNRAS, 478, 5017
- Stanimirović et al. (2004) Stanimirović S., Staveley-Smith L., Jones P. A., 2004, ApJ, 604, 176
- Tsujimoto & Bekki (2009) Tsujimoto T., Bekki K., 2009, ApJ, 700, L69
- Williams et al. (2022) Williams M. L., Bekki K., McKenzie M., 2022, MNRAS, 512, 4086
- de Grijs & Bono (2015) de Grijs R., Bono G., 2015, AJ, 149, 179