A High-Sensitivity Radon Emanation Detector System for Future Low-Background Experiments
Abstract
Radioactive radon atoms originating from the primordial and decay chains are constantly emanated from the surfaces of most materials. The radon atoms and their radioactive daughter isotopes can significantly contribute to the background of low-background experiments. The progeny , for example, dominates the background of current liquid xenon-based direct dark matter detectors. We report on a new detector system to quantify the surface emanation rate of materials. Using cryogenic physisorption traps, emanated radon atoms are transferred from an independent emanation vessel and concentrated within the dedicated detection vessel. The charged radon daughter isotopes are collected electrostatically on a silicon PIN photodiode to spectrometrically measure the alpha decays of and . The overall detection efficiency is 36 % for both polonium channels. The radon emanation activity of the emanation vessel was measured to be , resulting in a detection sensitivity of 0.06 at C.L..
1 Introduction
Time projection chambers (TPCs) filled with cryogenic liquid xenon (LXe) are one of the leading technologies to directly search for ultra-rare processes, such as neutrinoless double beta decay or WIMP dark matter scattering. The best constraints on spin-independent WIMP-nucleon scattering for WIMP masses above to date come from dual-phase LXe TPCs with multi tonne-scale targets [1, 2, 3, 4]. One of the most critical backgrounds in these experiments arises from the decay of (radon) and its progenies. Radon is part of the ubiquitous primordial decay chain and emanates off any detector component via recoil ejection and diffusion. Due to its comparatively long half-life of and its chemical inertness, it distributes within the LXe target and cannot be mitigated via target fiducialization. For similar reasons, radon contributes to the background in current and future searches for the neutrinoless double beta decay of [5, 6, 7], where radon emanation and subsequent high-energy decays result in backgrounds in the region of interest around .
The XENONnT dark matter experiment has recently reported a radon activity concentration of [8], which has been further reduced below in the meanwhile [4]. Future dark matter experiments with a LXe target above , such as DARWIN [9] or XLZD [10], aim at exploring the entire WIMP parameter space accessible to the LXe TPC technology [11, 12] and offer an interesting neutrino physics program [13, 14, 15]. To reach the design sensitivity, their background must be dominated by irreducible interactions of solar and atmospheric neutrinos [9]. This requires reducing the concentration of to [12], corresponding to an order-of-magnitude improvement compared to the current-generation [4]. The planned double beta experiment nEXO aims for a similar concentration of about [7].
This challenging goal will be met by a combination of background mitigation methods: surface treatment [16], detector design [17, 18, 19], active radon removal [20, 21, 22] as well as by using only ultra-low-emanation materials for all detector parts in direct contact with xenon. Radon emanation depends on material properties and is often only a measure of surface contamination. Therefore, emanation rates must be quantified using highly sensitive radon emanation detectors, rather than relying on potentially misleading bulk measurements of activity via standard gamma spectrometry.
The concept of the electrostatic radon emanation chamber [23, 24] used in this work is by now an integral part of the radiopurity assay of modern rare-event searches [25, 26, 27, 28, 29]. Such an instrument consists of a gas-tight vacuum vessel that houses a silicon PIN photodiode set to negative high-voltage, creating an electrical drift field with respect to the vessel on ground potential. atoms present in the vessel will eventually decay, leaving a fraction of the daughter in a positively charged state as a consequence of the alpha decay recoil [30, 31]. The ionized daughters are then collected electrostatically on the surface of the PIN diode, where the isotopes and are identified by measuring the induced charge signal proportional to the energy deposited by their alpha decays. Modeling the evolution of the detected activity of the radon daughters during the measurement allows the inference of the sample’s radon emanation rate .
This work presents the design, construction, and performance of the MonXe radon emanation detector. Section 2 describes the working principle and experimental setup of the detector. Section 3 explains the operation of the instrument. Section 4 elaborates on its performance in terms of background, efficiency, and sensitivity. Section 5 presents exemplary screening measurements of high-activity zeolite granulate and a low-activity PTFE sample. The article concludes in Section 6 with a summary and an outlook on future detector optimizations.
2 Experimental Setup
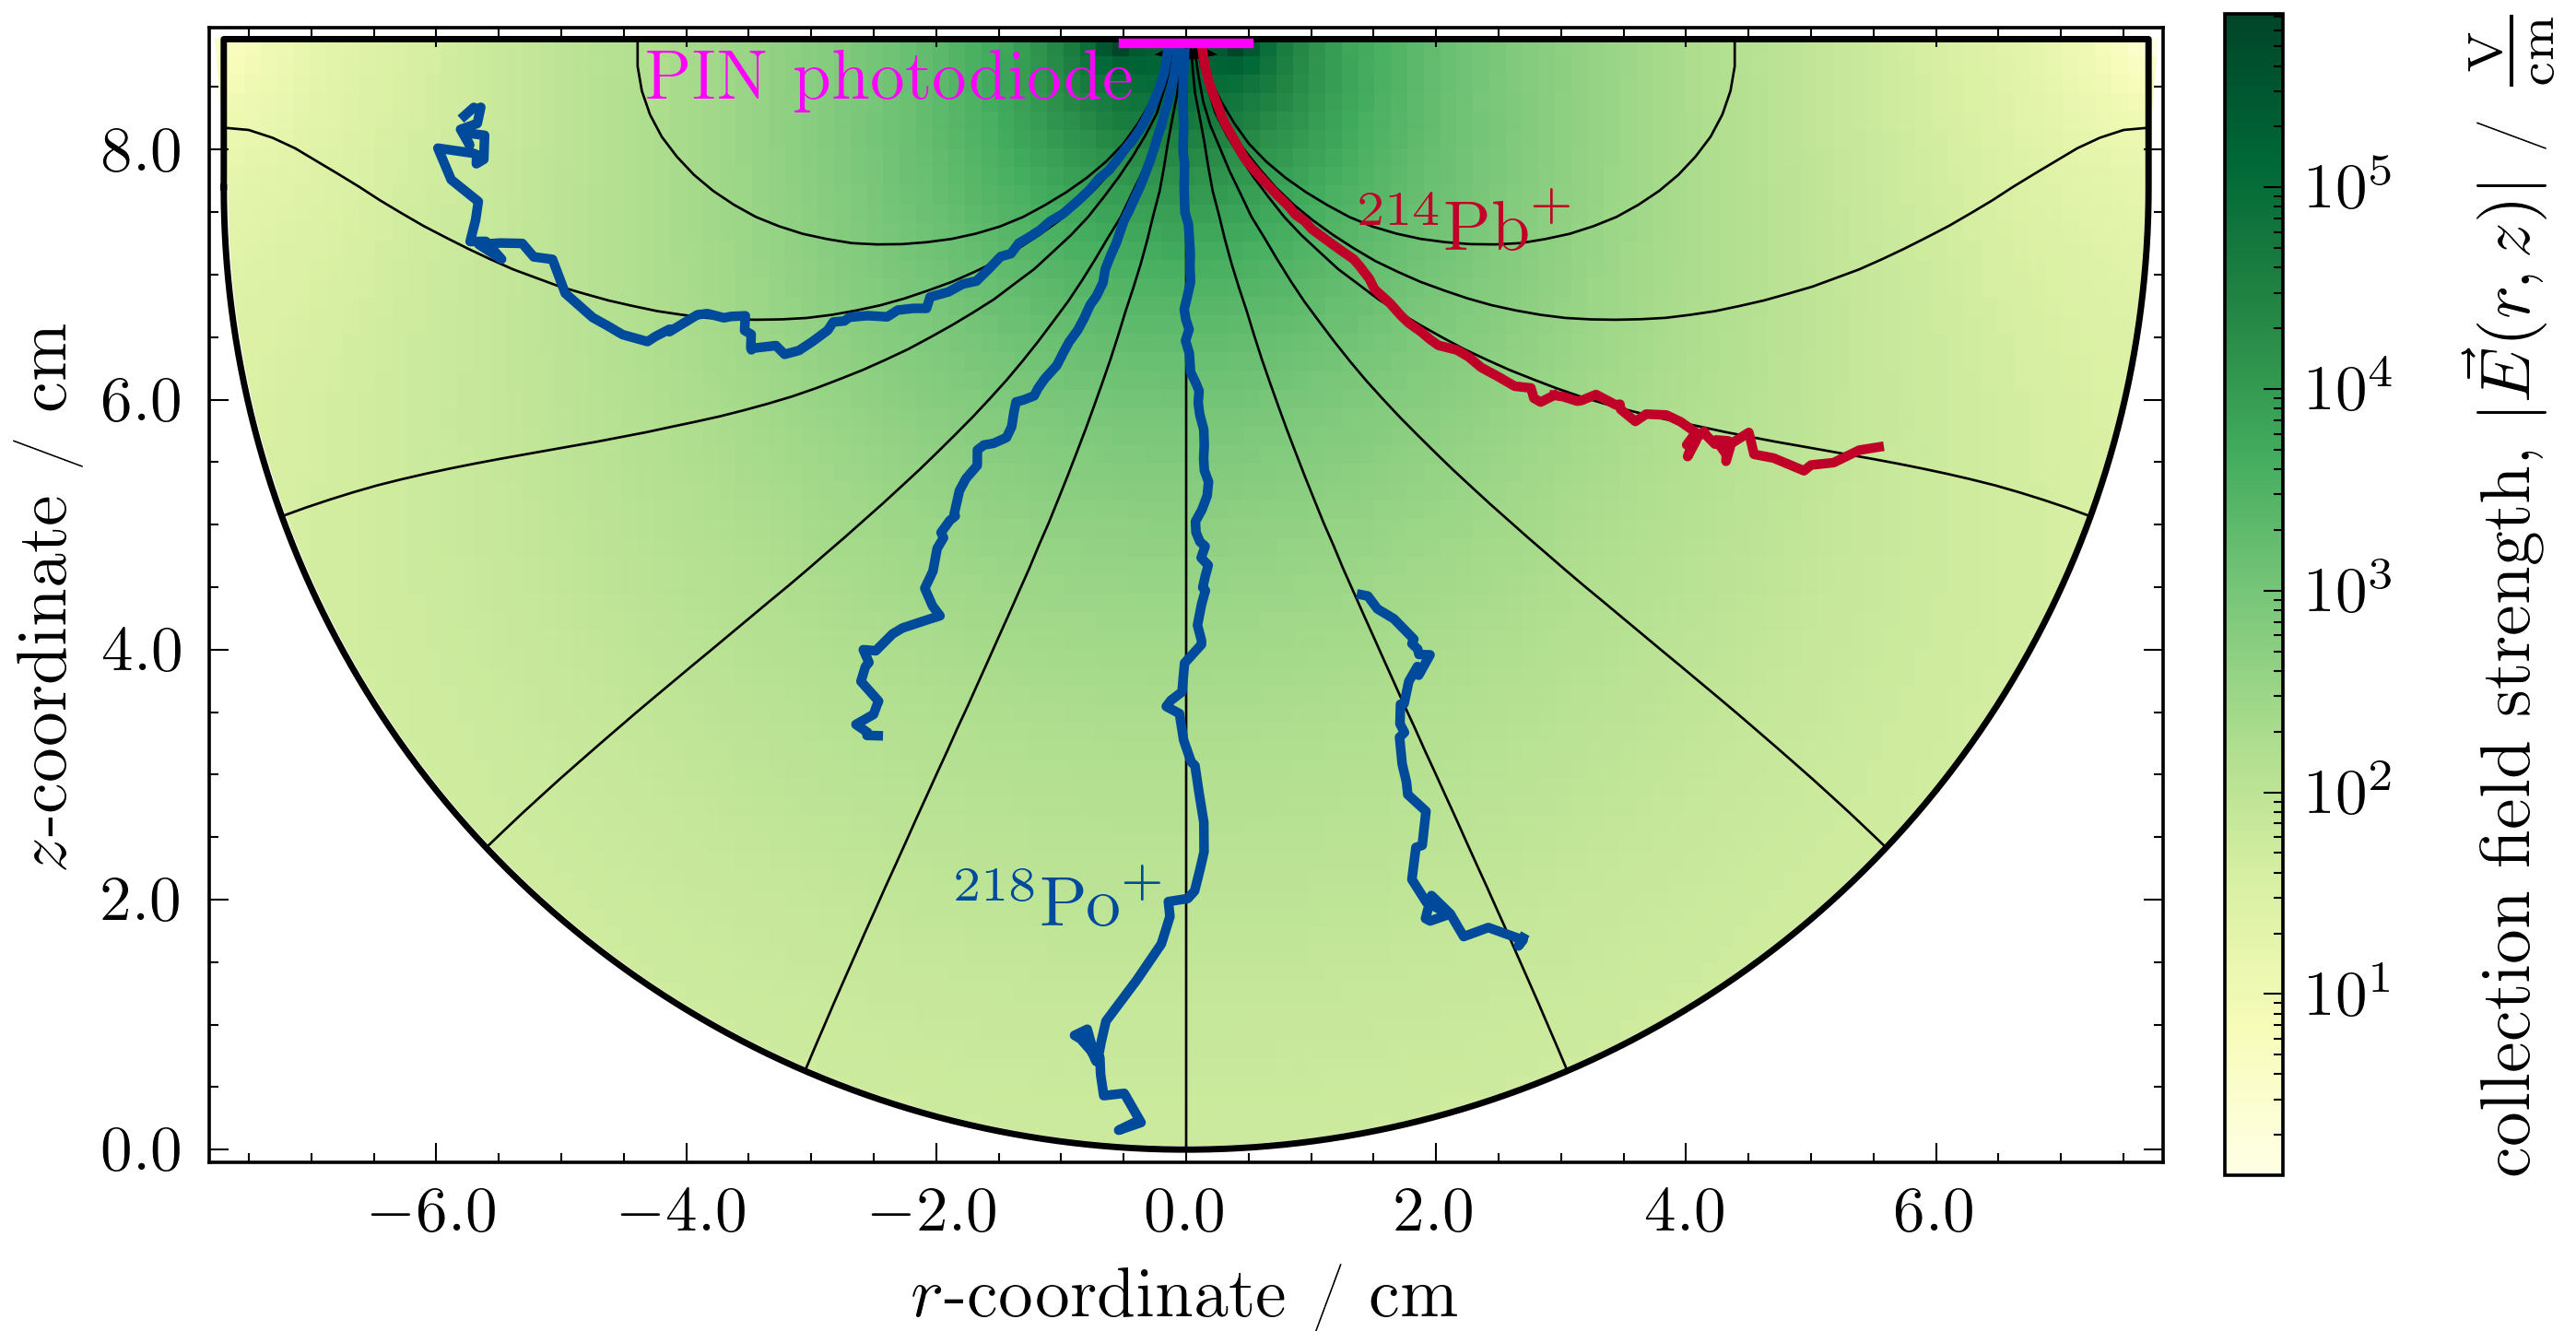
The MonXe radon detector system comprises two decoupled vacuum vessels: one for accommodating the emanating sample and the other for actual radon detection. This dual-vessel setup facilitates measuring radon emanation rates from large samples in one vessel while optimizing the collection efficiency of charged radon progenies in the other. A photograph of the detector system is shown in the left panel of Figure 1. The gas system connecting both vessels is sketched in the right panel. The hemispherical shape of the detection vessel (DV), with a radius of and a volume of , was optimized in terms of electrostatic collection efficiency via dedicated particle-tracking simulations taking into account diffusion effects, as shown in Figure 2. The PIN diode is installed in the central bore of the vessel’s CF160 flange, with the diode surface being aligned with the inner flange plane. The CF160 flange features six additional CF16 flanges to connect sensors and the concentration line. The detection vessel’s inner surface is electropolished to minimize its intrinsic radon emanation. The cylindrical emanation vessel (EV) has a height of and an inner diameter of , corresponding to a volume of . It is closed off with CF250 flanges on both sides. The entire system was built from CF/Conflat and VCR metal-sealed UHV components and exhibits a leak rate below .
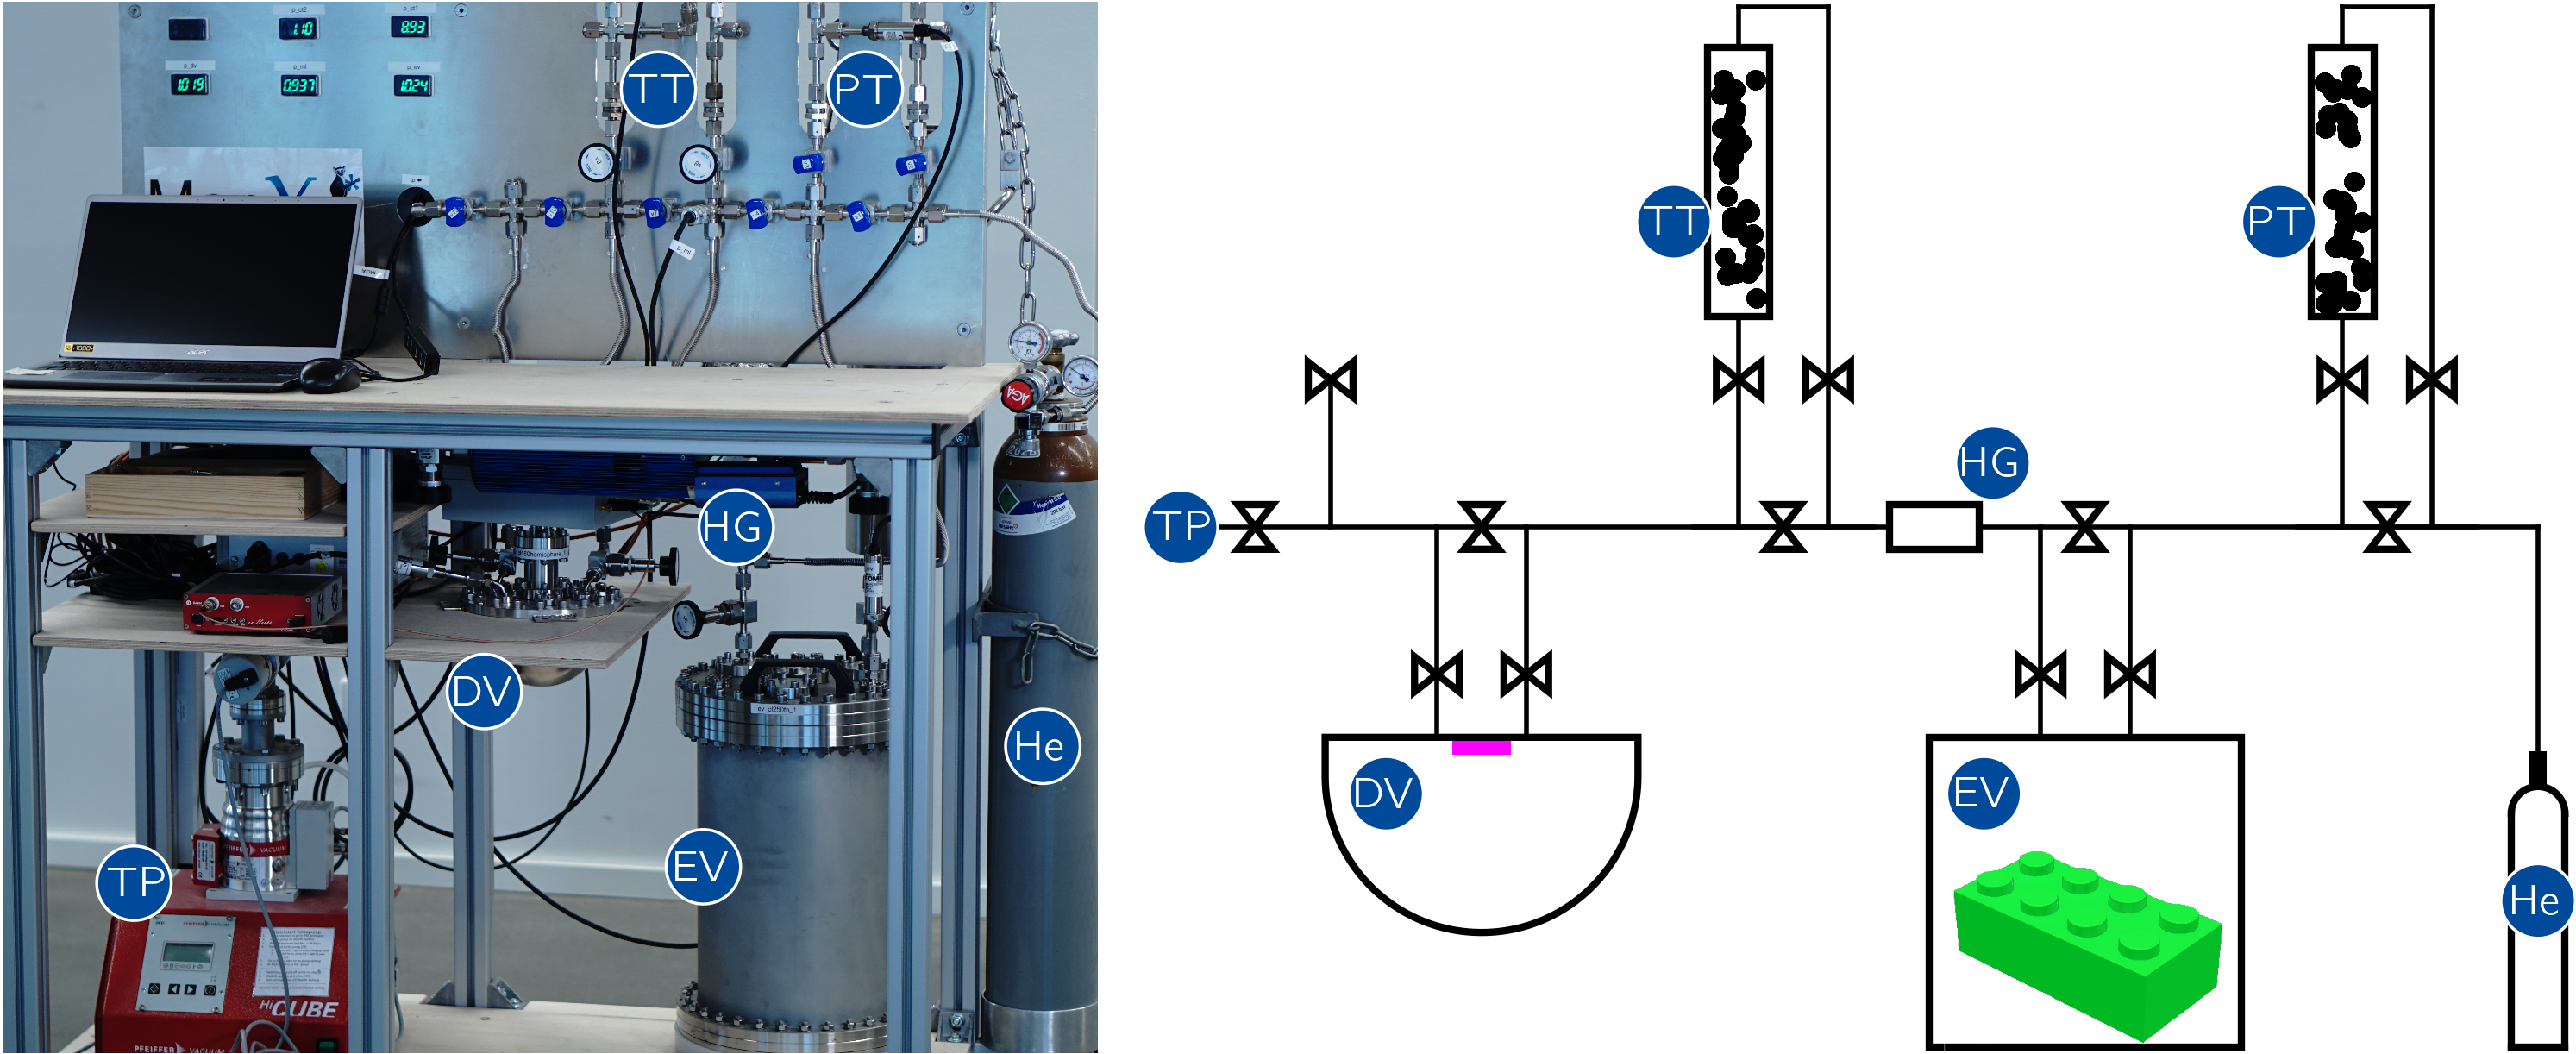
Samples of arbitrary material, size, and shape can be placed inside the emanation vessel, which is evacuated after installation of the sample, and afterwards refilled with of purified helium. In principle, several emanation vessels could be installed in parallel to speed up an extensive measurement campaign. The emanation rate of a sample is assessed by transferring the emanated radon atoms into the detection vessel via cryogenic physisorption on activated charcoal (charcoal: Blücher Saratech 100050-VC000021). Helium (grade 5.0) is used as carrier gas; the gas bottle is directly attached to the purification trap (PT), which is kept at cryogenic temperature during operation by immersing it into a liquid nitrogen bath. This purifies the helium gas introduced into the system, removing radon and other contaminants. The emanation vessel is filled with helium gas which is subsequently extracted from the system by means of a vacuum pump via the cold transfer trap (TT), also kept at liquid nitrogen temperature, where the radon atoms are adsorbed. The transfer (purification) trap is made of an electropolished stainless steel cylinder of 10.0 cm length and 1.2 cm (4.0 cm) inner diameter to accommodate 10 g (75 g) of activated charcoal. By heating the transfer trap to , the radon gets desorbed and is flushed into the detection vessel using purified helium gas until the normal operating pressure of is reached.
Pressure sensors (OMEGA PX409) monitor the emanation and detection vessels during the radon transfer and measurement phases. A hot zirconium getter (SAES MonoTorr PS3-MT3-R-2), installed between the emanation vessel and the gas system’s main line, removes impurities outgassing from the sample that could otherwise neutralize the charged radon progeny and reduce the electrostatic collection efficiency.
The silicon PIN photodiode (Hamamatsu S3590-09 [33]) installed inside the detection vessel has a photosensitive area of . The diode does not feature a protective epoxy cover but directly exposes its p-layer to minimize the absorption of the energy of the impinging alpha particles in an inactive material layer. The diode is embedded in a PTFE cylinder installed in a CF40 double nipple centered on the flange of the detection vessel. Its surface aligns with the level of the flange’s vacuum side. The diode pins are connected through the PTFE to two SHV coaxial feedthroughs. Their air sides are directly connected to a custom-developed frontend electronics module. It provides a high-voltage of to the diode to establish an almost radial electrical collection field between the grounded vessel and the diode, as depicted in Figure 2. A battery installed in series provides the reverse bias voltage of to the diode. The analog current signal of the diode is capacitatively decoupled from the high-voltage circuit and fed into a two-stage low-noise preamplifier with a total transimpedance gain of and a bandwidth of . Low- and high-pass filters reduce the electronic noise. The shaped signals from the alpha decays of and with energies of and create amplitudes of and , respectively. The typical decay time of the signals is . They are digitized and analyzed by a 14-bit multichannel analyzer (CAEN DT5781a) sampling the signal at . An event is read out if the pulse exceeds a threshold set sufficiently low to be surpassed by any relevant alpha signal. For every event, its timestamp, pulse height, and raw waveform data are stored. Storage of the raw data could be disabled, however, especially during detector commissioning the direct access to the waveform data was very useful.
During every measurement, which consists of the radon transfer and data acquisition phases, ambient and process parameters, such as temperatures and pressures, are monitored and stored in a database. A custom-developed lightweight slow control system running on an industry-grade microcontroller (KUNBUS RevPi Core 3) is used for that purpose.
3 Measurement Procedure
has a long half-life of . is thus assumed to be produced and emanated with constant radon emanation activity . The emanation rate of a sample is determined by measuring the alpha decays of the radon daughter isotopes and . The standard measurement procedure with the radon emanation detector consists of three phases: radon emanation, radon transfer, and the polonium activity measurement. The activities of the various isotopes in these phases can be computed analytically by solving the respective rate equations; the time evolution of every isotope depends on its radioactive decays and the decays of its mother isotopes.
Radon Emanation:
The sample under study is closed off in the emanation vessel EV, which is subsequently evacuated and filled up with purified helium to atmospheric pressure. Governed by the half-life of , the emanated radon activity within the emanation vessel asymptotically approaches the secular equilibrium activity .
Radon Transfer:
Typically after a few half-lives, the accumulated radon atoms are concentrated and transferred from the emanation vessel EV into the detection vessel DV via the transfer trap TT. Prior to the procedure, the transfer trap is purged of radon by repeated filling with purified helium gas, followed by heating and evacuation. The transfer trap is then immersed in liquid nitrogen and continuously filled with about of helium until the temperature and consequently the pressure in the trap stabilize. Finally, the gas content of the emanation vessel is evacuated through the transfer trap, and the extracted radon atoms are adsorbed onto the porous charcoal. Afterwards, the trap is closed off, filled with purified helium, and then heated up to such that the radon atoms desorb and mix with the carrier gas. By opening the line from the transfer trap to the previously evacuated detection vessel, the carrier gas and hence the majority of the radon atoms can expand into the detection vessel. Any remaining radon atoms are finally transported into the detection vessel by flushing purified helium through the transfer trap until an absolute pressure of is reached. There is currently no direct measurement of the helium flow, but the pressure increase in the detection vesselis monitored and the flow is adjusted such that this last step takes roughly 2 minutes.
Polonium Activity Analysis:
Most impurities, e.g., contaminants from outgassing and the radon decay products themselves, are removed by the hot getter during the transfer from the emanation vessel EV into the detection vessel DV. Thus, the and sample signal activities inside the detection vessel, and , are zero at the start of the measurement , i.e., when the detection vessel is closed shut, and increase until radon and polonium are in secular equilibrium. Once equilibrium is reached, the radon and polonium activities decrease according to the characteristic time scale of radon. The and decays are identified by their respective energy, as shown in the right panel of Figure 4 on page 4. The number of detected events from a certain polonium isotope during a measurement interval is given by
| (3.1) |
which takes into account the detection efficiency (see Section 4.2) and the mean number of expected background events from both the detection vessel and the emanation vessel (see Section 4.1). Since the polonium signal activities can be expressed in analytical form (as the solution of a system of coupled, inhomogeneous first-order differential equations), Equation (3.1) can be solved for the radon activity at . By additionally taking into account the duration of the radon emanation and transfer phases, one can then extrapolate the radon emanation activity of the sample under study.
4 Detector Performance
In this Section, we present results on the performance of the radon emanation detector obtained during detector commissioning.
4.1 Backgrounds
During a sample measurement, both the detection vessel DV and emanation vessel EV also emanate atoms, that, along with leakage of other decays into the region of interest and detector artifacts, contribute to the overall number of measured events , as expressed by Equation (3.1).
The detection vessel background was measured multiple times after being filled with of purified helium. After approximately four weeks, average equilibrium background rates of 2.4 counts per day (cpd; ) and 1.5 cpd () were recorded in the regions of interest for the 218Po and 214Po channels, respectively. These rates comprise the sum of intrinsic 222Rn emanation from the detection vessel and additional components that potentially result from the leakage of other decays, such as those from the 220Rn chain, as well as detector-specific artifacts. Because the background rates may be time-dependent, we calculate the expected number of background counts for each sample measurement separately. To do this, we determine the average number of events in the background-only measurements, , which were detected within the same window used for a given sample measurement. This number is subtracted from the number of sample events recorded.
The radon emanation background rate of the emanation vessel is determined in a measurement without sample, following the procedure outlined in Section 3 and accounting for the detection vessel background determined above. Two such background measurements were conducted. For both measurements, both polonium channels are in excellent agreement with one another. Taking into account the detection efficiencies from Equation (4.3) yields a value of
| (4.1) |
The expected number of emanation vessel background events is then computed by integrating the emanation vessel polonium activity model :
| (4.2) |
We correct the time-dependent activity models for the emanation and transfer durations, which allows us to account for unavoidable temporal variations of the processes, caused by, e.g., different sample and emanation vessel sizes. The emanating from the sample and emanation vessels has a half-life of and is thus expected to decay during the sample transfer. All of its non-noble progenies will plate out on the getter or porous charcoal. -induced backgrounds from the emanation vessel or the sample itself are thus neglected.
4.2 Detection Efficiency
The overall detection efficiency is obtained by comparing the experimentally measured emanation rate with the known reference value of a calibrated sample. The sample was provided by G. Zuzel (Jagiellonian University, Kraków, Poland). It consists of two 2 mm thick stainless steel discs with a diameter of 20 mm, onto which ions were electrodeposited. The reference measurements of the same source were carried out by H. Simgen at the Max-Planck-Institut für Kernphysik (MPIK) in Heidelberg, Germany, utilizing miniaturized proportional counters [34] and finding an emanation activity of . The source is stored in a CF40 vacuum vessel, which can be closed off by two VCR bellow valves. For the calibration measurements, it was connected to the gas system, replacing the emanation vessel.
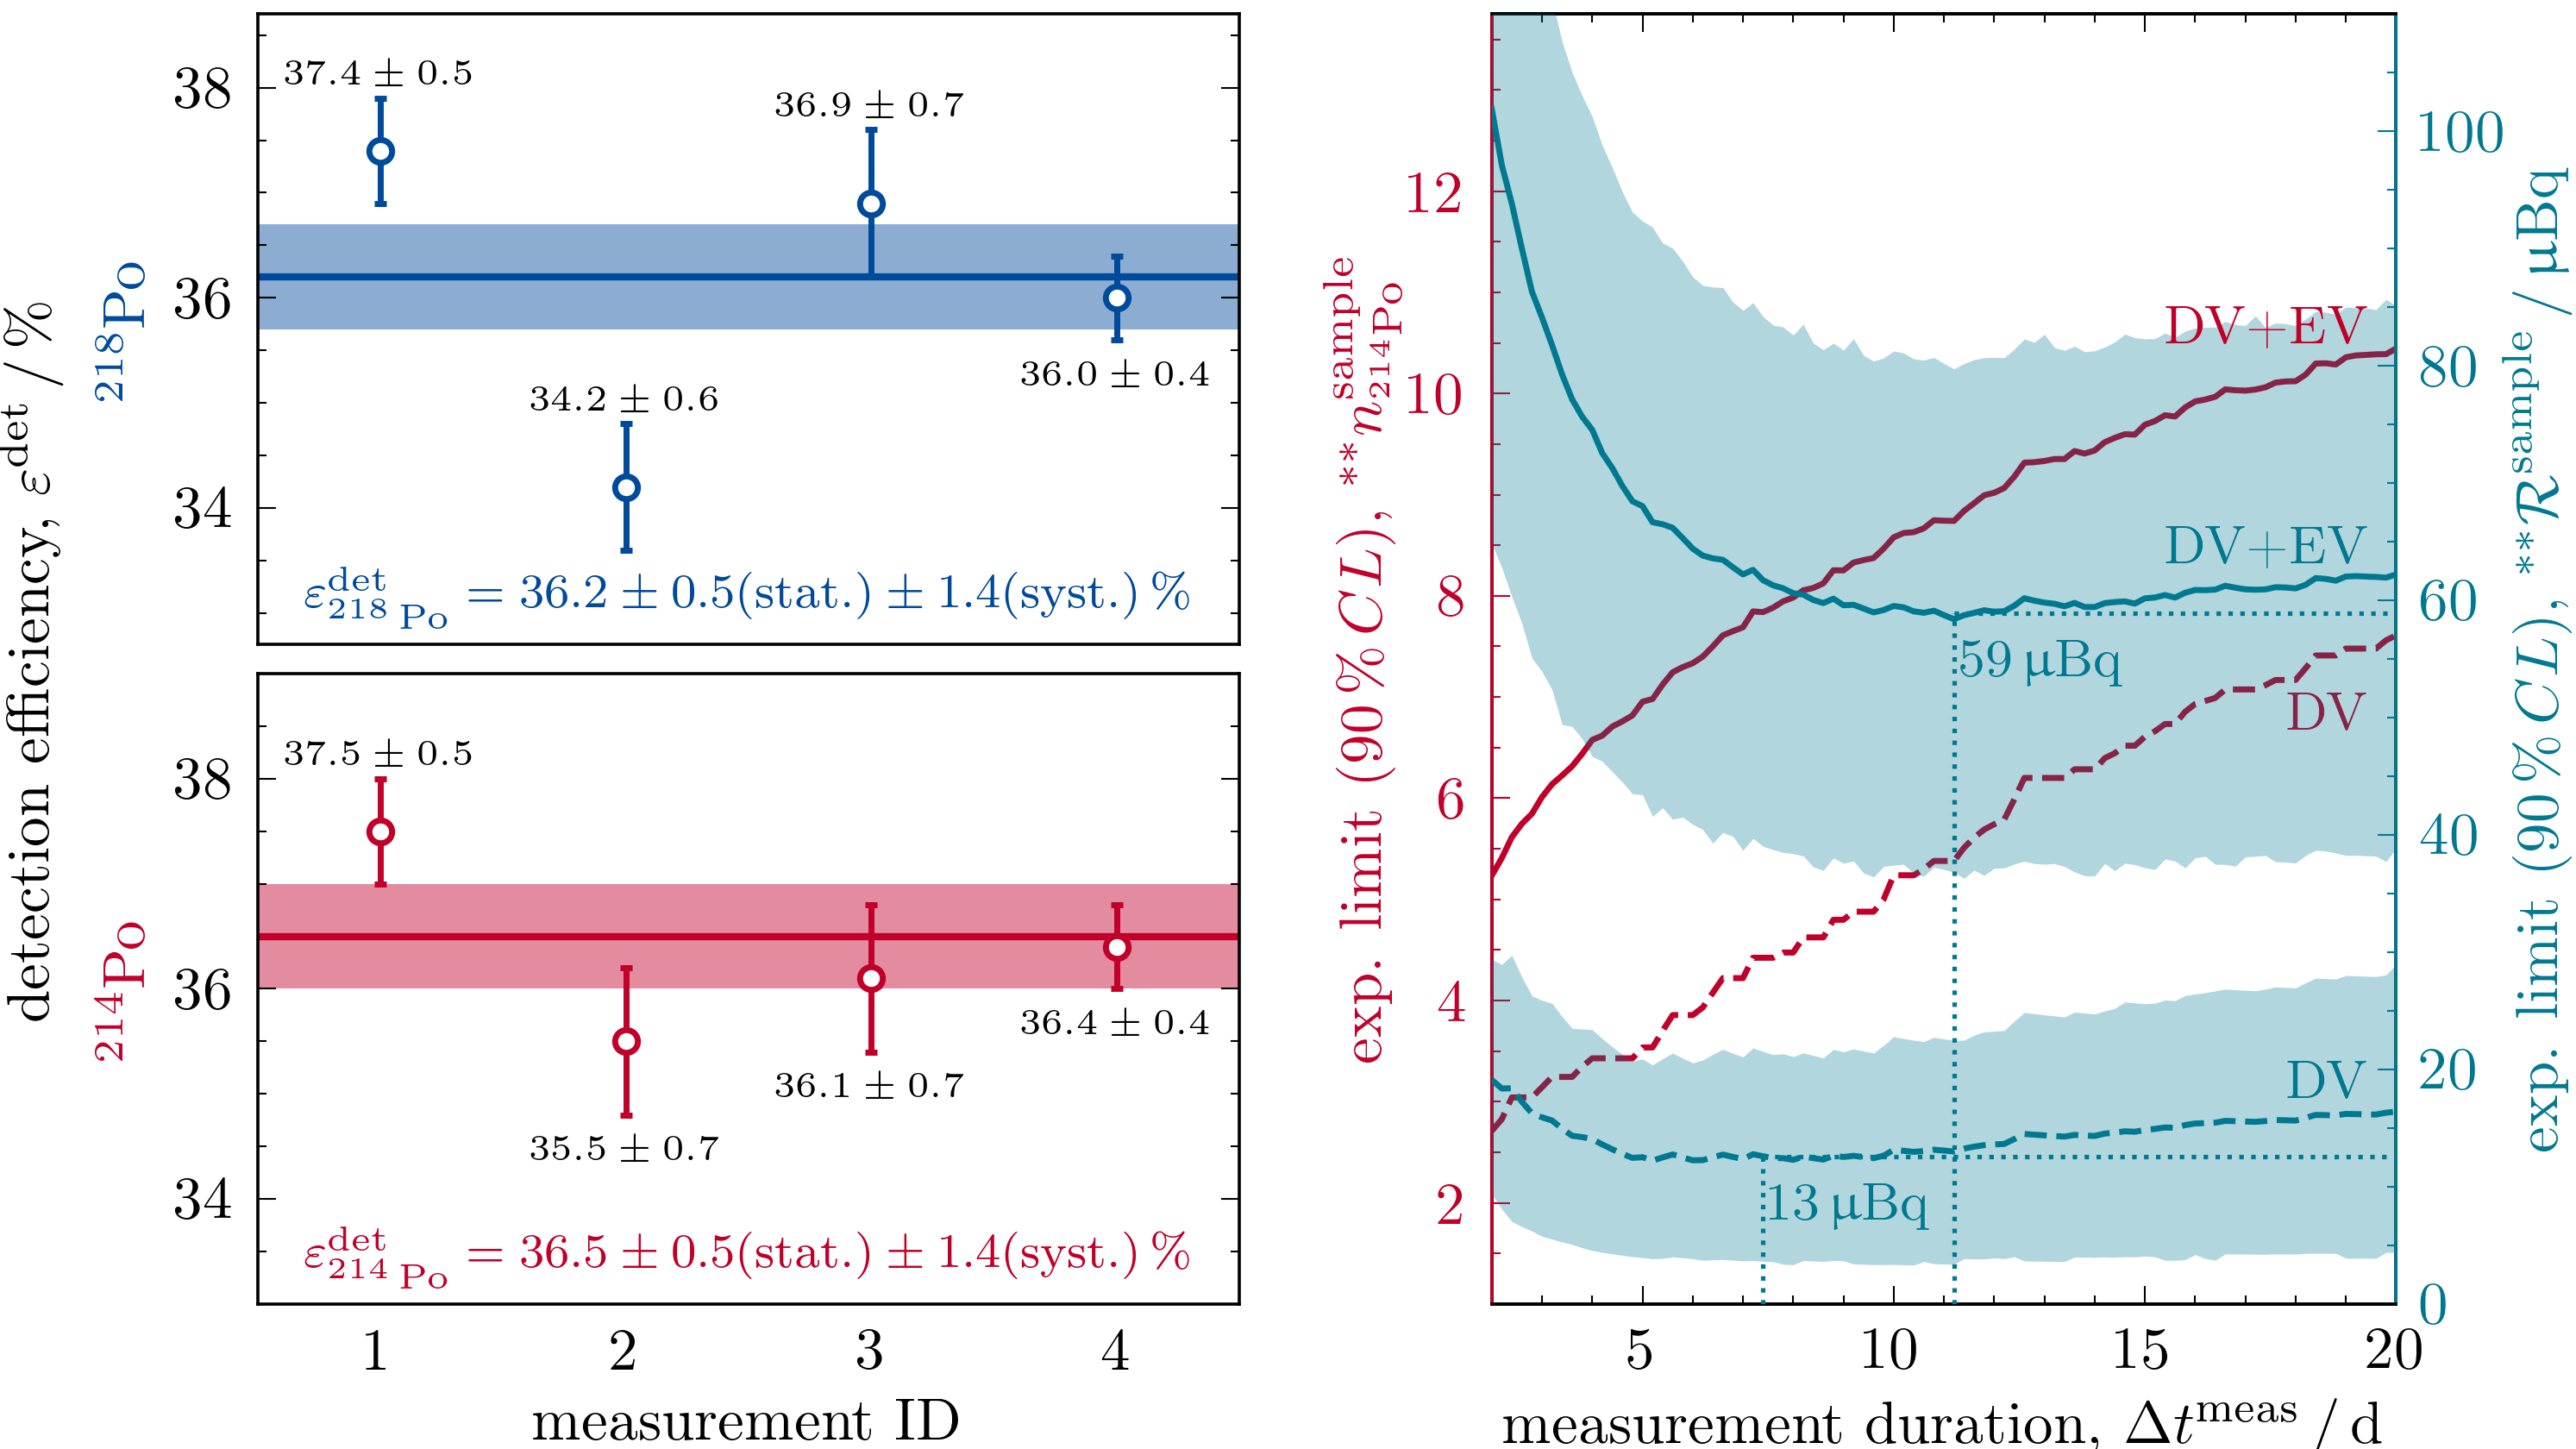
The calibration campaign consisted of four individual measurements of the radon emanation rate of the calibrated sample, following the routine presented in Section 3. The left panel of Figure 3 shows the individual results relative to the reference value. The measurement’s statistical uncertainties result from the Poissonian process of counting the number of polonium decays. We attribute the larger spread of the data to systematic variations in the manual transfer procedure, and adjust for this overdispersion by scaling the combined uncertainty by roughly a factor of two, such that the fit of a constant to all measurements yields . Combining the consistent results of both polonium channels (the individual values are given in the left panel of Figure 3) we infer MonXe’s detection efficiency to be
| (4.3) |
The systematic uncertainty is dominated by the uncertainty of the reference measurement. Note that already includes efficiency losses of at least due to the finite solid angle coverage of the active photodiode for alpha particles emitted on its surface. The particle tracking simulation studies depicted in Figure 2 indicate an electrostatic collection efficiency close to for the realized hemispherical detection vessel geometry and a static collection field generated by a high-voltage of [32]. We furthermore expect a transfer efficiency of roughly . By expanding and flushing the much smaller volume of the calibration source’s emanation vessel directly into the detection vessel, we found the same radon activity as with the established transfer protocol. Also, small variations in the transfer temperature and helium flow do not alter the transfer efficiency. A potential source of efficiency losses might be insensitive areas of the silicon PIN photodiode. Nevertheless, the detection efficiency measured here suggests the fraction of initially recoil-ionized ions in helium being at least , exceeding the value of found in earlier works [30].
4.3 Sensitivity
We evaluate the detector sensitivity in terms of a single-bin Poisson counting experiment, following the analysis scheme outlined in Section 3: The integer number of measured events is Poisson-distributed with the expected value . Whether or not significantly exceeds the expected background , given a significance level , is determined by computing the corresponding -value assuming the background-only hypothesis. If , the background-only hypothesis is considered rejected by the data, and one can determine the sample’s radon emanation rate from the excess number of signal events.
If no signal above the background is observed, i.e., if , we quote the observed upper limit on the number of signal events as the largest value of that still yields less than detected events with probability :
| (4.4) |
The observed upper limit is thus
| (4.5) |
In Equation (4.5), the sum of Poissonian probabilities is identified with the cumulative chi-squared distribution , which then allows computing in analytical form.
To estimate the experimental sensitivity, we compute the distribution of expected upper limits on the detected number of signal events at . Monte Carlo data resembling the distribution of the number of observed events under the assumption of the background-only hypothesis is generated according to Equation (4.5). The right panel of Figure 3 shows the median expected upper limit on the number of signal events from the sample for the line and two different background contributions vs. the measurement time. Via the activity model (3.1), assuming infinite emanation time (which is approximately the case after an emanation period of four weeks) and infinitesimal transfer time, and taking into account the detection efficiency of Equation (4.3), one can translate the expected upper limit of signal events into the corresponding upper limit on the radon emanation rate .
The fluctuations in the right panel of Figure 3 are due to the quantized number of expected detector vessel background events . Initially, the sensitivity curves steeply decrease until they reach a local minimum. For longer measurement times, the mean and width of the distributions show a steady increase. This (at first glance counter-intuitive) time-dependence is caused by the asymptotically falling ratio of accumulated signal events (emanated by the sample and transferred once into the detection vessel) and background events (constantly emanated from the detection vessel walls): While the signal activity will decrease exponentially with increasing measurement time as the sample decays, the background activity remains constant, once secular equilibrium is reached. For the standard measurement procedure, i.e., a sample placed inside the emanation vessel EV, we hence quote the sensitivity of the MonXe radon emanation detector as the minimum of the curve taking into account the background from both vessels (EV+DV):
| (4.6) |
As a consequence of the time behavior shown in Figure 3, a measurement is terminated, and an upper limit on the emanation rate of the sample is placed if no signal is detected after twelve days. The theoretical detection vessel background-only sensitivity of
| (4.7) |
is only valid for radon emanation measurements of components such as vacuum vessels, getters, or valves that can be directly connected to the MonXe system. For comparison, the miniaturized proportional counters at the Max-Planck-Institut für Kernphysik (MPIK) in Heidelberg, Germany, which are among the most sensitive radon emanation instruments to date, achieve sensitivities of 40 [34] with some counters exhibiting an intrinsic emanation activity up to four times lower than the detection vessel background rate of our detector. The background emanation activity of the MPIK emanation vessel is , which is similar to that of the four times smaller MonXe emanation vessel given in Equation (4.1). The R.E.S. facility at the South Dakota School of Mines and Technology uses a detector concept similar to MonXe and features two large emanation chambers of 13 l and 300 l. Its sensitivity of [35] is comparable to the one of our instrument, while our vessel backgrounds and detection efficiency are slightly superior [26].
5 Sample Screening Measurements
In this section, we demonstrate the performance of the MonXe radon emanation detector based on two samples with very different emanation rates.
5.1 High-Activity Sample: Zeolite Granulate
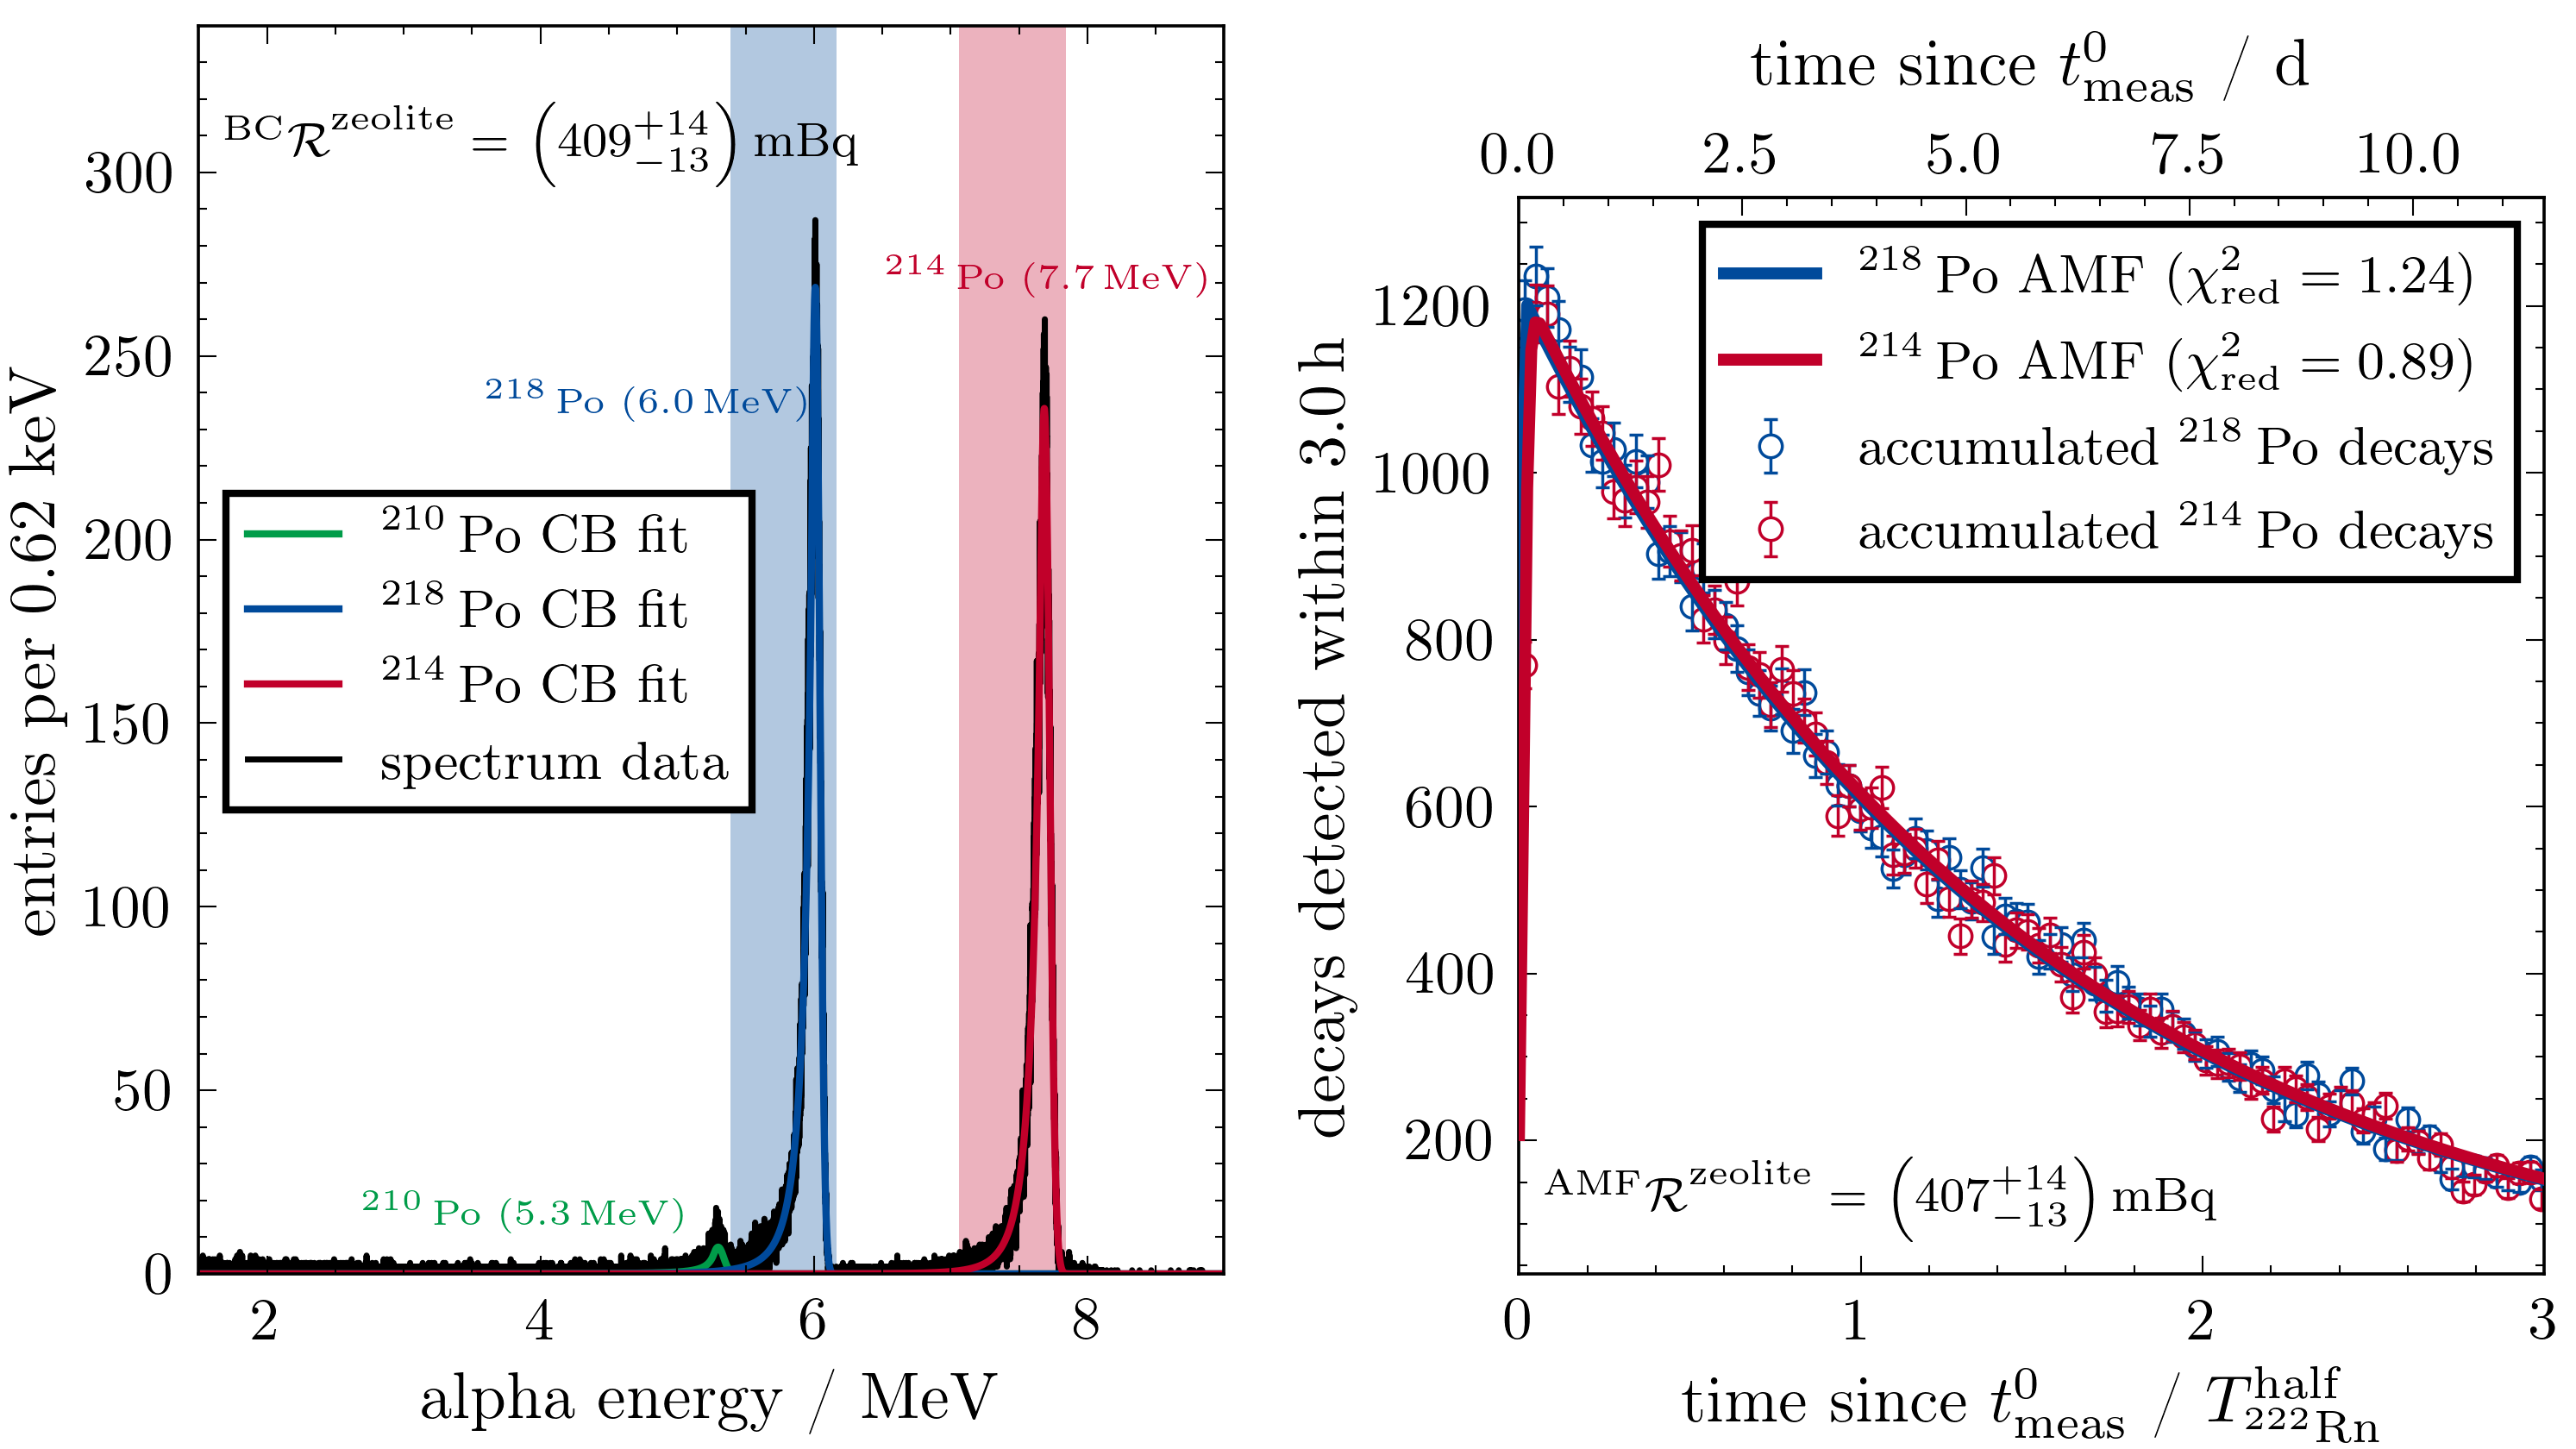
Zeolites are a class of microporous minerals typically used as an adsorbent, e.g., in backing pump adsorption traps to prevent the backstreaming of oil vapor. The examined sample consists of of commercial zeolite adsorbent pellets (Pfeiffer Vacuum Technology AG Zeolith PK 001 248-T). The left panel of Figure 4 shows the alpha energy spectrum acquired over a measurement period of and after an emanation time of . One can clearly distinguish three peaks corresponding to the energies of the alpha particles emitted by , , and , at , , and , respectively. The long half-life of of strongly suppresses the peak. The peak shapes of and are well described by a Crystal Ball function [36]. Their low-energy tails are attributed to angle-of-incidence-dependent energy losses when the alpha particles traverse the insensitive p-layer of the PIN photodiode. From the Crystal Ball fits, one can extract the energy resolution of , determined as the full width at half maximum of the peak. The energy scale is defined by identifying the peak’s mean values from the fit with the respective alpha energies. The and events are selected from a predefined energy interval around the peak means. These were chosen to include over of the Crystal Ball integrals while excluding the stray events mentioned in Section 4.1. Since the integral coverage proved to be robust against the fit uncertainties, the data were not corrected for the selection inefficiency. Following the box-counting (BC) analysis presented in Section 3, which takes into account the background contributions of the detection and emanation vessels, the specific radon emanation activity of the zeolite sample is
| (5.1) |
The box-counting analysis essentially ignores the knowledge of the individual event trigger timestamps. However, for high-activity samples, this timing information can be utilized to validate the underlying model assumptions. Instead of just counting all events recorded during the entire measurement , one can subdivide in equal intervals and count the detected polonium events in each bin for intervals, as shown in the right panel of Figure 4. For each time interval, Equation (3.1) applies, and the number of radon atoms at can be determined from the fit of the activity model to the data. The reduced -values of and indicate an excellent agreement between data and model for both and . Both analysis methods yield identical radon emanation rates.
The bulk activity of the zeolite granulate was additionally measured with the high-purity germanium gamma-spectrometer GeMSE [37]. The activity was inferred from the and gamma lines of and assuming secular equilibrium among and its short-lived daughters. To avoid the radon emanated from the sample being removed from the sample cavity by the gamma spectrometer’s nitrogen purge, the sample was kept in gas-tight plastic bags. The measured activity of reveals that (at normal temperature and helium pressure, and assuming secular equilibrium) only 5 % of the atoms produced in decays are emanated from the porous zeolite granulate.
5.2 Low-Activity Sample: Semi-Finished PTFE
Polytetrafluoroethylene (PTFE, Teflon®) is a widely used construction material in most low-background experiments due to its unique electrical insulation and optical properties. PTFE semi-finished products are compression molded and sintered from granulated PTFE resin. Here we present measurements of the radon emanation of two semi-finished PTFE samples: a sample manufactured by ElringKlinger AG and a sample manufactured by Fluorseals S.p.A.. Each sample consisted of three cubic blocks (320 160 60 mm3 of 6 kg mass each).
In preparation for the measurements, a few microns were milled off from all surfaces of the blocks. Because PTFE is expected to emanate only trace amounts of radon [25], a series of narrow grooves of depth were additionally saw-milled into the two largest faces of the cuboids to increase the total surface area from to per sample. The blocks were cleaned in a bath of nitric acid, then immersed in deionized water and ethanol, and finally blow-dried with pressurized helium. To reduce potential outgassing of ambient radon that might have diffused into the porous material, the emanation vessel housing the cleaned PTFE samples was continuously evacuated with the turbomolecular pump for two weeks prior to the start of the actual emanation process of roughly three weeks. By the start of the measurement, any contribution from ambient radon would have decreased by more than . Because of the additional evacuation, we assume the remaining fraction to be even smaller.
For both sample measurements, the and channels led to compatible results; the following radon emanation activities were measured:
| (5.2) |
The systematic uncertainties from the calibration are a factor of ten smaller than the statistical uncertainties and are thus omitted in the following. A second measurement of the Fluorseals sample yielded upper limits of and for the and channels, respectively, in agreement with the first measurement. The Fluorseals detection corresponds to a total sample emanation activity of and thus lies only slightly above the theoretical optimum sensitivity of the detector of , given in Equation (4.7). Statistical fluctuations can easily move the measured activity above or below the detector’s significance limit.
For reference, the PTFE reflectors used in the XENON1T dark matter experiment exhibit an emanation activity of [25], which is comparable to the value inferred for the Fluorseals sample. These measurements were conducted with the miniaturized proportional counter infrastructure at the Max-Planck-Institut für Kernphysik in Heidelberg; a sample with a total mass of and a surface area of was examined. The XENON1T reflectors were treated with a new diamond milling head to achieve a smooth surface to optimize the material’s light reflectivity [38]. Since radon emanation strongly depends on the surface properties of a sample, it is possible that this particular treatment led to an improved micro-porosity of the surface compared to the one of our saw-milled grooves. With an emanation activity of , the PTFE used in the LZ dark matter experiment is also cleaner. A very large sample of it was measured with the R.E.S. facility mentioned above [26].
6 Conclusion
The background of many rare-event search experiments is affected by the radioactive decays of and its daughters. As radon emanates from any detector construction material, quantifying the emanation rate of potential materials is crucial for optimizing the background of the next generation of low-background experiments. In this work, we present the design and performance of the MonXe radon emanation detector, designed to contribute to the radiopurity assay programs of the future astroparticle physics observatories DARWIN [9] and XLZD [10].
MonXe’s detection concept is based on the spectrometric measurement of alpha decays of polonium atoms, which have been electrostatically collected on the surface of a silicon PIN photodiode. By utilizing cryogenic physisorption traps, the radon atoms emanating from a sample are transferred into a separate detection vessel. The alpha decays of the daughters and are measured with an energy resolution of and an detection efficiency of about per isotope. The sensitivity of the instrument, taking into account the measured backgrounds in the emanation and detection vessels, was determined as at C.L.. The performance of the MonXe radon emanation detector was demonstrated by determining the radon emanation of high-activity commercial zeolite granulate and two samples of semi-finished PTFE, with emanation rates close to the instrument’s sensitivity.
At the time of writing, the MonXe detector is operated manually. However, it is foreseen to automate the radon sample transfer from the emanation into the detection vessel by controlling new pneumatic valves and mass flow controller by the slow control system. A second independent emanation vessel is currently under construction and will decrease turnover times between measurements. The second vessel will be electropolished to possibly improve its intrinsic emanation, which currently limits the instrument’s sensitivity.
Acknowledgments
This work was supported by the European Research Council (ERC) grant No. 724320 (ULTIMATE). We gratefully acknowledge H. Simgen and J. Westermann (Max-Planck-Institut für Kernphysik, Heidelberg, Germany) for performing the reference calibration measurements, and G. Zuzel (Jagiellonian University, Kraków, Poland) for providing the calibration source. We also thank the teams of the mechanical and electronics workshops of Institute of Physics, Freiburg, and in particular R. Mori for the development of the preamplifier. Finally, we thank all the Bachelor students and interns who contributed to commissioning the detector: J. Alt, W. Boemke, L. God, R. Kirsch, and V. Lieb.
References
- [1] XENON collaboration, Dark matter search results from a one tonneyear exposure of XENON1T, Physical Review Letters 121 (2018) 111302 [1805.12562].
- [2] PandaX-4T collaboration, Dark Matter Search Results from the PandaX-4T Commissioning Run, Physical Review Letters 127 (2021) 261802 [2107.13438].
- [3] LZ collaboration, First dark matter search results from the LUX-ZEPLIN (LZ) experiment, Physical Review Letters 131 (2023) [2207.03764].
- [4] XENON collaboration, First dark matter search with nuclear recoils from the XENONnT experiment, Physical Review Letters 131 (2023) [2303.14729].
- [5] EXO-200 collaboration, Search for Majorana neutrinos with the first two years of EXO-200 data, Nature 510 (2014) 229 [1402.6956].
- [6] NEXT collaboration, Measurement of radon-induced backgrounds in the NEXT double beta decay experiment, Journal of High Energy Physics 10 (2018) 112 [1804.00471].
- [7] nEXO collaboration, nEXO: neutrinoless double beta decay search beyond 1028 year half-life sensitivity, Journal of Physics G: Nuclear and Particle Physics 49 (2022) 015104 [2106.16243].
- [8] XENON collaboration, Search for new physics in electronic recoil data from XENONnT, Physical Review Letters 129 (2022) 161805 [2207.11330].
- [9] DARWIN collaboration, DARWIN: towards the ultimate dark matter detector, Journal of Cosmology and Astroparticle Physics 11 (2016) 017 [1606.07001].
- [10] J. Aalbers et al., A next-generation liquid xenon observatory for dark matter and neutrino physics, Journal of Physics G: Nuclear and Particle Physics 50 (2023) 013001 [2203.02309].
- [11] J. Billard, E. Figueroa-Feliciano and L. Strigari, Implication of neutrino backgrounds on the reach of next generation dark matter direct detection experiments, Physical Review D 89 (2014) 023524 [1307.5458].
- [12] M. Schumann, L. Baudis, L. Bütikofer, A. Kish and M. Selvi, Dark matter sensitivity of multi-ton liquid xenon detectors, Journal of Cosmology and Astroparticle Physics 10 (2015) 016 [1506.08309].
- [13] L. Baudis, A. Ferella, A. Kish, A. Manalaysay, T. Marrodan Undagoitia and M. Schumann, Neutrino physics with multi-ton scale liquid xenon detectors, Journal of Cosmology and Astroparticle Physics 01 (2014) 044 [1309.7024].
- [14] DARWIN collaboration, Sensitivity of the DARWIN observatory to the neutrinoless double beta decay of 136Xe, The European Physical Journal C 80 (2020) 808 [2003.13407].
- [15] DARWIN collaboration, Solar neutrino detection sensitivity in DARWIN via electron scattering, The European Physical Journal C 80 (2020) 1133 [2006.03114].
- [16] S. Bruenner, D. Cichon, G. Eurin, P. Herrero Gómez, F. Jörg, T. Marrodán Undagoitia et al., Radon daughter removal from PTFE surfaces and its application in liquid xenon detectors, The European Physical Journal C 81 (2021) 343 [2009.08828].
- [17] K. Sato, M. Yamashita, K. Ichimura, Y. Itow, S. Kazama, S. Moriyama et al., Development of a dual-phase xenon TPC with a quartz chamber for direct dark matter searches, Progress of Theoretical and Experimental Physics 2020 (2020) 113H02 [1910.13831].
- [18] Y. Wei, J. Long, F. Lombardi, Z. Jiang, J. Ye and K. Ni, Development and performance of a sealed liquid xenon time projection chamber, Journal of Instrumentation 16 (2021) P01018 [2007.16194].
- [19] J. Dierle, A. Brown, H. Fischer, R. Glade-Beucke, J. Grigat, F. Kuger et al., Reduction of -induced backgrounds in a hermetic dual-phase xenon time projection chamber, The European Physical Journal C 83 (2023) 9 [2209.00362].
- [20] M. Murra, D. Schulte, C. Huhmann and C. Weinheimer, Design, construction and commissioning of a high-flow radon removal system for XENONnT, The European Physical Journal C 82 (2022) 1104 [2205.11492].
- [21] K. Abe, K. Hieda, K. Hiraide, S. Hirano, Y. Kishimoto, K. Kobayashi et al., Radon removal from gaseous xenon with activated charcoal, Nuclear Instruments and Methods in Physics Research Section A: Accelerators, Spectrometers, Detectors and Associated Equipment 661 (2012) 50–57.
- [22] E. Aprile, J. Aalbers, F. Agostini, M. Alfonsi, F.D. Amaro, M. Anthony et al., Online removal by cryogenic distillation in the XENON100 experiment, The European Physical Journal C 77 (2017) 358 [1702.06942].
- [23] E. Albrecht and A. Kaul, Continuous registration of concentration in air, in Assessment of Airborne Radioactivity in Nuclear Operations, pp. 643–649, International Atomic Agency, 1967.
- [24] M. Wojcik, G. Zuzel and H. Simgen, Review of high-sensitivity radon studies, International Journal of Modern Physics A 32 (2017) 1743004.
- [25] XENON collaboration, 222Rn emanation measurements for the XENON1T experiment, The European Physical Journal C 81 (2021) 337 [2009.13981].
- [26] LZ collaboration, The LUX-ZEPLIN (LZ) radioactivity and cleanliness control programs, The European Physical Journal C 80 (2020) 1044 [2006.02506].
- [27] M. Laubenstein and I. Lawson, Low background radiation detection techniques and mitigation of radioactive backgrounds, Frontiers in Physics 8 (2020) 506.
- [28] XENON collaboration, Material radiopurity control in the XENONnT experiment, The European Physical Journal C 82 (2022) 599 [2112.05629].
- [29] PandaX-4T collaboration, Low radioactive material screening and background control for the PandaX-4T experiment, Journal of High Energy Physics 06 (2022) 147 [2112.02892].
- [30] A.J. Howard and W.P. Strange, Heavy-ion migration through argon and helium in weak electric fields, Journal of Applied Physics 69 (1991) 6248–6256.
- [31] P. Pagelkopf and J. Porstendörfer, Neutralisation rate and the fraction of the positive -clusters in air, Atmospheric Environment 37 (2003) 1057.
- [32] W. Boemke, Collection and transfer efficiency assessment of the MonXe radon emanation chamber, B.Sc. thesis, 2021.
- [33] Hamamatsu Photonics K.K., Large area Si PIN photodiodes, https://www.hamamatsu.com/content/dam/hamamatsu-photonics/sites/documents/99_SALES_LIBRARY/ssd/s3590-08_etc_kpin1052e.pdf.
- [34] G. Zuzel and H. Simgen, High sensitivity radon emanation measurements, Applied Radiation and Isotopes 67 (2009) 889.
- [35] M.A. Bowles, Minimizing backgrounds for the SuperCDMS SNOLAB dark-matter experiment, Ph.D. thesis, 2019.
- [36] The SciPy community, scipy.stats.crystalball, https://scipy.github.io/devdocs/reference/generated/scipy.stats.crystalball.html.
- [37] D.R. García, D. Baur, J. Grigat, B. Hofmann, S. Lindemann, D. Masson et al., GeMSE: a low-background facility for gamma-spectrometry at moderate rock overburden, Journal of Instrumentation 17 (2022) P04005 [2202.06540].
- [38] XENON collaboration, The XENON1T Dark Matter Experiment, The European Physical Journal C 77 (2017) 881 [1708.07051].