SSIG: A Visually-Guided Graph Edit Distance for Floor Plan Similarity
Abstract
††This paper is published as a workshop paper at ICCV 2023We propose a simple yet effective metric that measures structural similarity between visual instances of architectural floor plans, without the need for learning. Qualitatively, our experiments show that the retrieval results are similar to deeply learned methods. Effectively comparing instances of floor plan data is paramount to the success of machine understanding of floor plan data, including the assessment of floor plan generative models and floor plan recommendation systems. Comparing visual floor plan images goes beyond a sole pixel-wise visual examination and is crucially about similarities and differences in the shapes and relations between subdivisions that compose the layout. Currently, deep metric learning approaches are used to learn a pair-wise vector representation space that closely mimics the structural similarity, in which the models are trained on similarity labels that are obtained by Intersection-over-Union (IoU). To compensate for the lack of structural awareness in IoU, graph-based approaches such as Graph Matching Networks (GMNs) are used, which require pairwise inference for comparing data instances, making GMNs less practical for retrieval applications. In this paper, an effective evaluation metric for judging the structural similarity of floor plans, coined SSIG (Structural Similarity by IoU and GED), is proposed based on both image and graph distances. In addition, an efficient algorithm is developed that uses SSIG to rank a large-scale floor plan database. Code will be openly available.
1 Introduction
Floor plans, as one of the most celebrated media for communicating and thinking in architectural design, are horizontal orthographic projections of a particular building’s floor. Floor plans are simple but powerful representations of space, conveying a richness of information about the compositional structure of buildings – the shapes, proportions, and relations between the building’s individual subdivisions. The compositional structure of a building is a key factor in the architectural quality.
The multi-modal nature of floor plans as pictorial (as images), graphical (as a set of geometrical entities), and topological (as graphs) entities, leverage different data modeling and machine learning frameworks for digital representation and machine understanding in the domain of architectural design. In particular, floor plan synthesis, such as floor plan generation [9, 10, 18] or style transfer [1], has often been explored. Another major research line is that of architectural element recognition in which the goal is to automatically learn to extract geometrical features from floor plan images e.g. walls or furniture [7, 3, 14].
Despite the developments in the generative models for floor plans, there have been few valuable attempts at developing data-driven methods to reason about floor plans, such as floor plan retrieval by effectively comparing data instances i.e. measuring similarity. As found by [13], structural similarity judgment for floor plans is a challenging task – it is multi-faceted and is about the shapes and proportions, visual features, and relations between the floor plan’s subdivisions. Generally speaking, comparing floor plans is about finding commonalities in the underlying structure, hence referred to as structural similarity.
The most effective methods for measuring structural similarity between floor plans rely on deeply learned vector representations with the goal to make the feature vector space reflect structural similarity i.e. the distance between feature vectors is small for structurally similar floor plans and vice versa. To train such models, [8] propose to use weakly supervised deep metric learning setup by obtaining similarity labels through Intersection-over-Union (IoU). To compensate for the lack of structural awareness in IoU, [13, 4] use Graph Matching Networks (GMNs) [6] that naturally embed topological information in the feature vectors. Besides the fact that GMNs hinder the practical usability [22], we believe that simpler frameworks could learn similarly effective vector representations when the objective is better aligned with structural similarity in the first place. In our work, we develop an improved objective and opt for simplicity. We start by investigating the merits and bottlenecks of well-known image- and graph-based similarity metrics.
The Intersection-over-Union (IoU) is often used as an evaluation metric to measure structural similarity e.g. to find similar or matching pairs for deep metric learning models [13, 4], to evaluate the accuracy of structural reasoning algorithms [7], or to evaluate the output diversity of generative models [9]. In this paper, we show how IoU fails to robustly measure structural similarity because 1) IoU is overly sensitive to geometric perturbations in the image representation of a floorplan and 2) IoU is often unable to identify important differences in the connectivity between space subdivisions such as doors, walls, openings.
Floor plans have been successfully modelled as graphs [9, 13], which allows for graph matching algorithms to compute a distance (similarity) between a pair of graphs. For example, the Graph Edit Distance (GED) computes the minimum cost of converting a source graph into another (isomorphic to it) target graph [17]. For example, [9] uses GED to check the compatibility between generated layouts. Although GED effectively captures topological similarity and with that addresses some of IoU’s limitations, we show that GED has inherent limitations when used for measuring structural similarity.
Independently, image- and graph-based similarity metrics lack to holistically capture the structural similarity between floor plans. Therefore, instead of treating images and graphs in isolation, we propose an evaluation metric that ascertains closeness based on the floor plans’ corresponding image and graph, called SSIG. In addition, an efficient algorithm based on SSIG is used to rank RPLAN [26], a large-scale floor plan database, on structural similarity. Our contributions include:
-
•
A study on the distributions and correlations between IoU and GED on a large-scale floor plan database, with one main finding: IoU and GED independently fail to robustly capture structural similarity.
-
•
A proposed simple yet powerful measure for the structural similarity of floor plans.
-
•
An effective ranking technique to sort a large floor plan database, hence developing a starting point for proper evaluation and training of floor plan retrieval models.
2 Related works
Floor plan representations.
Floor plans are digitally represented in various ways that each emphasize different components of interest e.g. as images allowing to model fine-grained details such as materialization and furniture [21, 5], geometries that explicitly model the shapes, proportions and locations of the shapes of the subdivisions [13], and graphs that model the relations between the subdivisions [9, 13, 18, 12].
Floor plan analysis.
Traditional approaches on floor plan analysis – or similar data such as documents [28] or UIs [2] – involve primitive heuristics to approximate a floor plan distance and are, hence, instance-specific [11]. More recently, two-step approaches became the standard to approximate similarity of floor plans [27, 16, 20, 23, 21, 19, 25, 12], in which the first step involves extracting relevant features from an image e.g. a graph representation of the room connectivity [12] and the second step computes a distance based on the extracted features e.g. a subgraph matching algorithm for graph similarity [16]. Besides the fact that the two-step approaches are prone to error propagation, the two-step approaches assume that the extracted features, such as the access graph, completely and accurately capture all aspects of floor plans. In our work, we challenge this assumption, particularly concerning semantic image and access graph representations of floor plans.
Structural similarity by Graph Neural Networks.
Recently, Graph Neural Networks (GNN) have been proposed to learn floor plan similarity [13, 8, 4], learning floor plan vector representations in an end-to-end fashion. Most successfully, [4, 13] leverage Graph Matching Networks (GMN) [6] in combination with weakly-supervised labels based on the IoU. Due to the cross-graph information sharing in GMNs, [13] found that GMNs compensate for the lack of structural awareness in IoU and naturally learn to embed the structural commonalities in the vector representations. A critical shortcoming of GMNs is that vector representations cannot be computed in isolation, therefore limiting the practical usability. We believe that the main reason that cross-graph information sharing is needed is that essentially the wrong objective is injected – that is to mimic a distance metric inspired by IoU. We show that our metric, which is a combination between visual- and a graph-inspired similarity scores, can be leveraged to rank a floor plan database for which the retrievals share similar characteristics as to the works in [13].
3 Method
In this section, we develop a simple yet effective strategy to numerically approximate structural similarity between floor plans. Formally, we seek a similarity function between two floor plans and :
| (1) |
in which is the (mathematical) space of a floor plan. can be multi-modal e.g. a joint space of images and graphs: . The goal is to make closely mimic the structural similarity between floor plans: the larger the structural similarity the larger and vice versa.
The section is split into three main parts. The first part explores the modeling and attribution of floor plans, (Subsec. 3.1). The second part investigates known and frequently used image- and graph-based similarity metrics (Subsec. 3.2, 3.3). The third part describes the new similarity metric (Subsec. 3.4), and provides an algorithm that can efficiently rank a floor plan dataset (Subsec. 3.5).
3.1 Floor plan representations
In this work, we consider three well-known floor plan representations: 1) the pictorial image, 2) the semantic image, and 3) the access graph.

Pictorial image
Conventionally, floor plans are modeled as images. All floor plan images that are either grayscale or RGB and do not contain any categorial information at pixel level about the semantics of the subdivisions are referred to as pictorial images, (Fig. 1, Left).
Semantic image
Floor plans are structured arrangements consisting of subdivisions – areas such as a living room or bathroom, openings such as doors or windows, and separators such as walls or railings. All floor plans that have categorical labels for subdivision areas and/or semantic information encoded at pixel level are referred to as semantic images in our definition, , in which is the number of subdivision categories (Fig. 1, Center). In the semantic image representation, pixel values correspond to subdivision categories e.g. 1 ”living room”, 2 ”bathroom”, 16 ”internal wall”, etc.
Access graph
Floor plans often have clearly identifiable relations between subdivisions e.g. access information between two rooms by means of a door. Even though semantic images efficiently capture the shapes and categories of the subdivisions, semantic image maps do not explicitly define the relations between the subdivisions.
Instead, floor plans can be attributed an access graph, directly laying bare the topological structure of the subdivisions (Fig. 1, Right). Formally, a graph is defined as a 4-tuple , in which is a finite set of nodes, is the set of edges, and and are the node and edge labelling functions respectively [15]. The nodes in an access graph correspond to the areas, and the edges to connections between the areas.
Depending on the use-case and feature accessibility, the nodes and edges can have (one or several) attributes. Usually, room-type information is encoded on the nodes, and edges are only present if a door is in between two rooms, hence edges do not have an attribute [9, 18, 24]. Even though we agree that access connectivity is the most important relation between rooms, an important relation is disregarded: room adjacency. Room adjacency is an influential factor e.g. for decisions around privacy, structural integrity, and function. Access graphs, in the remainder of this work, have therefor a connectivity-type attribute, which is either ”door” or ”adjacent”.
Proposed by [8], it is noteworthy to mention that several approaches compute the edge features. Specifically, edge features between two nodes are computed by pairwise geometric features, such as the ratio between areas or the relative position.
3.2 Intersection-over-Union
The Intersection-over-Union (IoU) is not considered a proper distance metric, but it is a well-adopted evaluation metric for tasks where measuring the overlap between regions or sets is important, such as in object detection or segmentation tasks. In turn, IoU is often used as a measure for estimating structural similarity in various applications related to floor plans e.g. for finding similar or matching floor plan pairs for similarity learning [13, 4], evaluating the accuracy of segmentation algorithms [7], or to check the diversity of outputs in floor plan generation [9]. The IoU is commonly defined as the fraction between the amount of overlap and the union of two binary images and :
| (2) |
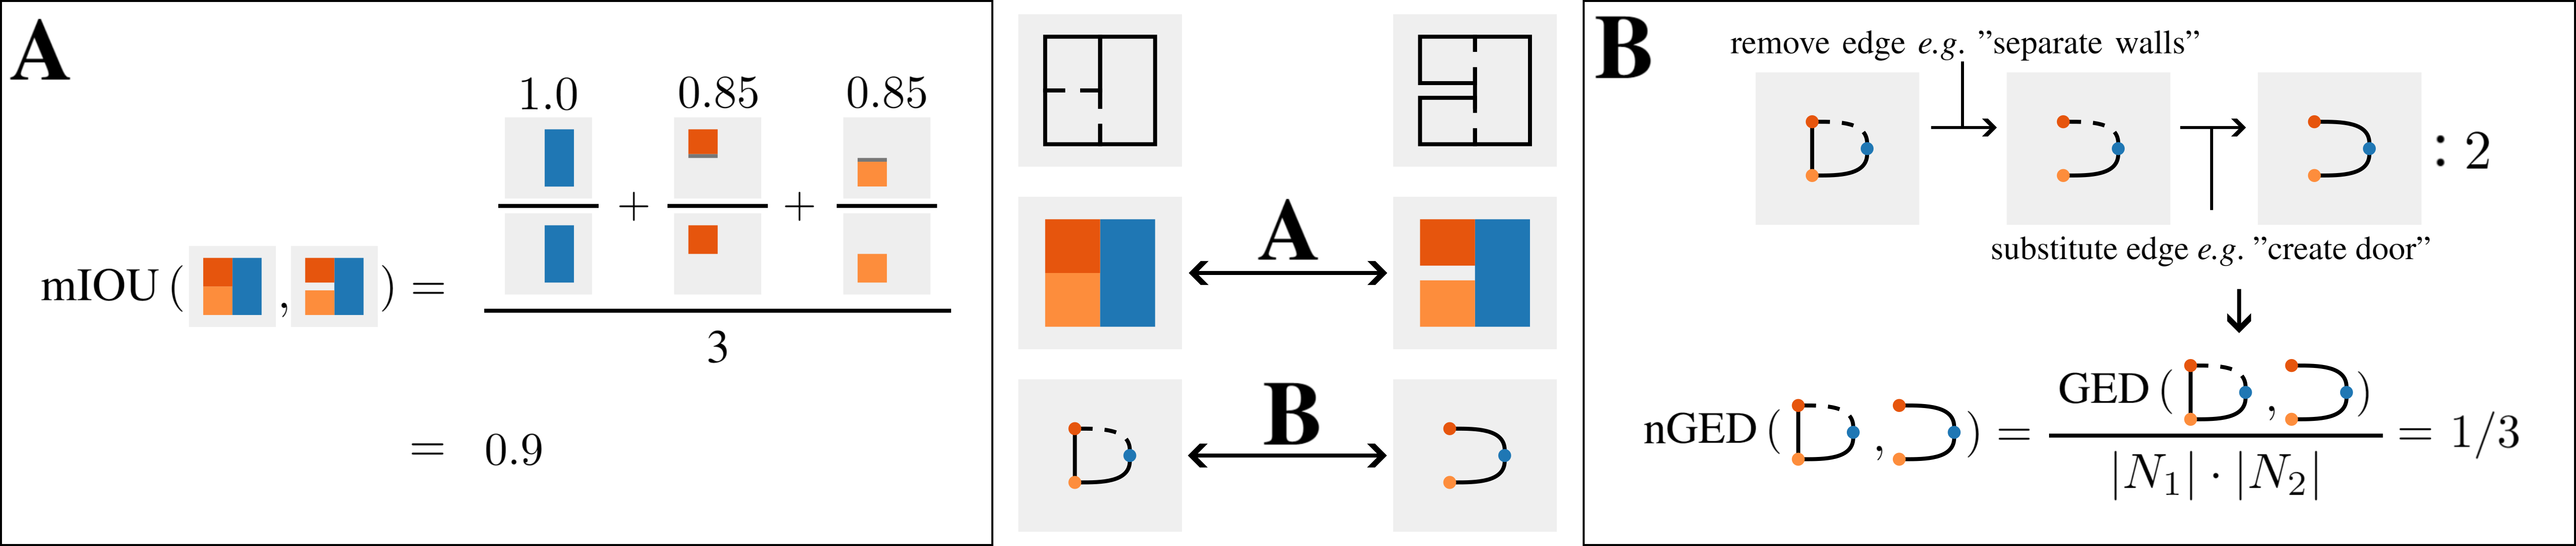
When more classes are present in an image e.g. in the case of semantic images (), IoU is computed per class and the results are aggregated to find the final score. For example, the mean IoU (mIoU) computes the average IoU, with respect to the ground truth, across the different classes, therefore treating every class similarly regardless of its proportion to the image size.
| (3) |
where is the number of classes.
Even though IoU is a powerful metric that in part is suitable for approximating structural similarity between floor plans, IoU frequently fails on both extremes: 1) false-negative: low IoU - high structural similarity, and 2) false-positive: high IoU - low structural similarity. 1) IoU is over-sensitive to irrelevant geometric perturbations in the image e.g. translation, rotations, and scale. For example, when identical floor plans are centered at different locations in an image, the IoU will be low; falsely indicating that the floor plans are not structurally similar. 2) IoU frequently fails to correctly identify the connectivity in floor plans e.g. small ”air gaps” between rooms are hardly identified by IoU yet are indicative of structural characteristics (see example in Fig. 2).
3.3 Graph Edit Distance
The Graph Edit Distance (GED) [17], is another measure to judge similarity between floor plans, used for e.g. compatibility of generated layouts [10] or for floor plan retrieval [12]. GED is a metric that quantifies the similarity (dissimilarity) between two graphs by computing the minimum cost of transforming one graph into (a graph isomorphic to) in terms of a sequence of edit operations , referred to as the edit path. Edit operations typically include node and edge deletions, insertions, and substitutions, which can have different costs. Given a set of graph edit operations and associated costs , the is formally defined as,
| (4) |
in which denotes the set of edit paths that transforms into (a graph isomorphic to) . In our work, all edit operations have the same cost, hence Eq. 4 becomes,
| (5) |
such that . GED in this case is equivalent to the smallest number of edit operations. To normalize the GED between 0 and 1, we define the Normalized Graph Edit Distance (nGED) by dividing GED with the product of the orders111Note that Eq. 6 does not strictly normalizes GED. Even so, for floor plans e.g., in [26], nGED will always be below 1. Furthermore, the product of the orders, instead of for example the sum, nicely spreads the nGED distributions. – the number of nodes – of the graphs ( and ):
| (6) |
nGED can be used as of measure of closeness between the topology of two floor plans, in which a small nGED suggests that two floor plans share topological characteristics, which could be, for example, indicative of commonalities in flow or function between two buildings.
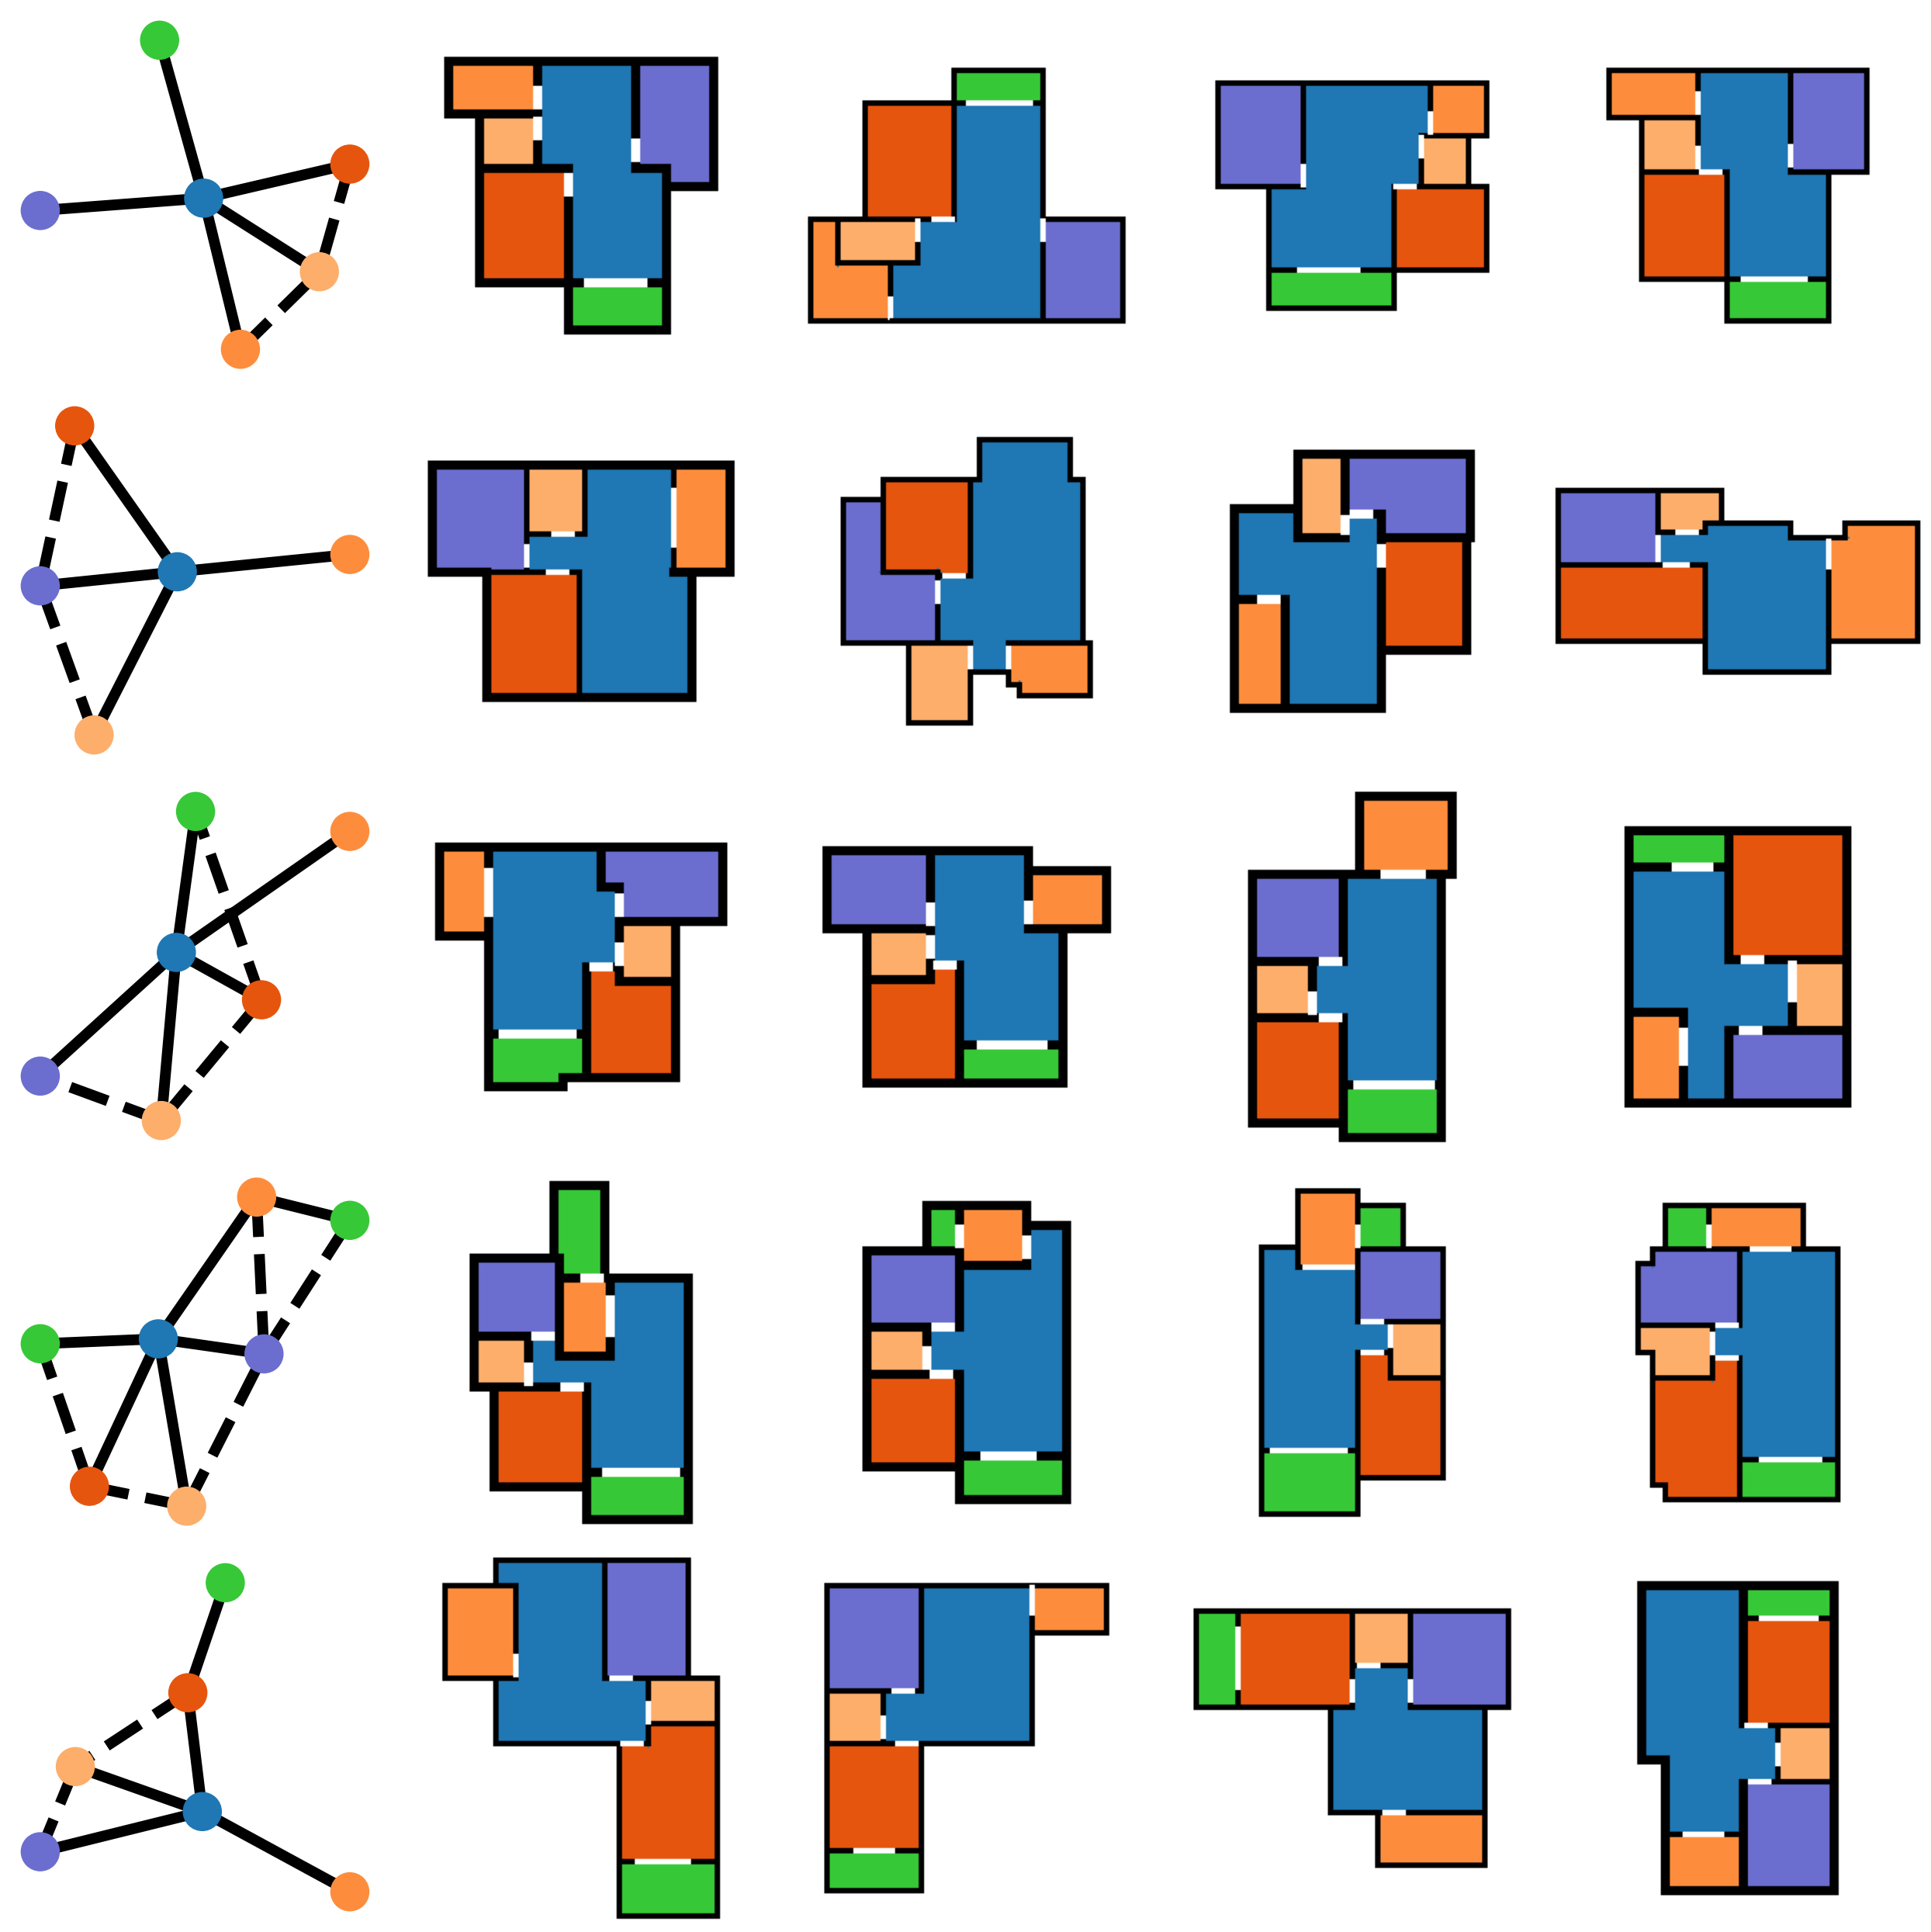
nGED has several limitations. First of all, the amount of different floor plans possible for a particular access graph is huge, for which many corresponding floor plans pairs are not structurally similar (see Fig. 3). Second, it is unclear which edit costs align with structural similarity: Is the removal of a node or an edge more costly? Does the node label matter? etc. Third, nGED is compute-heavy which limits its use in real-time systems e.g. floor plan retrieval in search engines. We elaborate more on the shortcomings in Subsec. 4.2.
In Subsec. 4.3 we investigate the trends and correlations between nGED and mIoU on RPLAN [26] empirically.
3.4 A Visually-guided Graph Edit Distance
Independently, IoU and GED fail to holistically capture structural similarity between floor plans. Therefore, instead of treating images and graphs separately, we propose a metric that ascertains closeness based on the semantic image and access graph. We define the similarity between a pair of floor plans , , as
| (7) |
Coined as SSIG (Structural Similarity by IoU and GED), 7 essentially computes a weighted average between a IoU-based and a nGED-based similarity metric. is a weight that allows to tune between the relevance of nGED w.r.t. mIoU: the higher the less influence nGED and vice versa.222Note that nGED , hence increasing the power term decreases nGED. For example for RPLAN [26], the mIoU and nGED distributions are balanced when . Specifically, balanced distributions here means that the IoU and nGED probability density functions have as much overlap as possible.
3.5 Efficient algorithm for ranking
Even for small graphs, GED is a compute-heavy measure, usually taking several seconds per floor plan pair. When SSIG is used for evaluation, pair mining, or direct floor plan retrieval on large datasets, the time constrain hugely limits practical usage. We propose an algorithm that drastically speeds up retrieval and finds structurally similar pairs relatively fast.
First, mIoU is computed for every combination of floor plan pairs in the dataset. Second, only the (set between 50 and 100) best scoring pairs on mIoU for each floor plan identity are kept. Third, the SSIG is computed for each remaining pair. Fourth, the corresponding lists for each floor plan identity are ranked on SSIG in descending order.
The algorithm assumes that the best matches (highest SSIG scores) are found in the -best mIoU pairs. In the next session, we empirically find that the assumption generally holds if is large enough. In Subsec. 4.4, we show that for ranking RPLAN, the assumption holds for relatively small . For a dataset with size (usually between 10k and 100k), the algorithm is orders of magnitude faster than brute-forcing through it.
An assessment of the ranking algorithm and relation to floor plan retrieval systems are provided in the following section (Sec. 4).
4 Results and Evaluation
4.1 Data
In this paper, RPLAN [26] is used for analysis and evaluation. RPLAN is a large-scale dataset containing floor plan images with semantically segmented areas, consisting of 80k single-unit apartments across Asia. We further cleaned the dataset, where there were several apartments with rooms without any doors i.e. disconnected in terms of the topology. Moreover, apartments are removed that are not fully connected and/or for which our graph extraction algorithm cannot reliably compute the corresponding access graphs. The cleaned dataset contains 56k apartments. Furthermore, we found that RPLAN contains many (near) duplicates. For evaluation of the ranking algorithm (Subsec. 4.4), we remove the (near) duplicates to reduce clutter in the results. Duplicates are removed by a threshold on mIoU, . Duplicates are not removed when assessing the distributions and correlations of mIoU and nGED.
4.2 Distributions
To understand the relations between the pairwise similarity measures (mIoU and nGED) and how they relate to structural similarity, we start by investigating the probability density functions of the pairwise similarity measures ( and , respectively). and are approximated by computing IoU and GED for over a million randomly sampled floor plan pairs. For brevity, we use ”IoU” and ”GED” instead of ”mIoU” and ”nGED”.
IoU
IoU is computed according to Eq. 3 and across all subdivision categories except for the ”background”. The histogram of the distribution is provided in Fig. 4 in the middle left plot in blue. The mean of the distribution is around 0.25 which means that on average approximately 25% of the pixels are overlapping. We also plot the IoU distribution for the 50 best-scoring examples on IoU per floor plan identity, shown in orange. As expected, compared to the full IoU distribution, the mean is significantly shifted. The spike around 1.0 can be attributed to the many (near) duplicates in the dataset.
To give an idea of the diversity of floor plan samples, Fig. 4 (top row) highlights floor plans with different ’originality’ scores. The originality is computed by the average IoU score for a given sample with all remaining samples. The more right ( 0.1) the more original i.e. seldom and the more left ( 0.4) the less original i.e. more frequent. Generally speaking, the originality positively correlated mostly with the complexity of the shapes of both the rooms and boundaries.
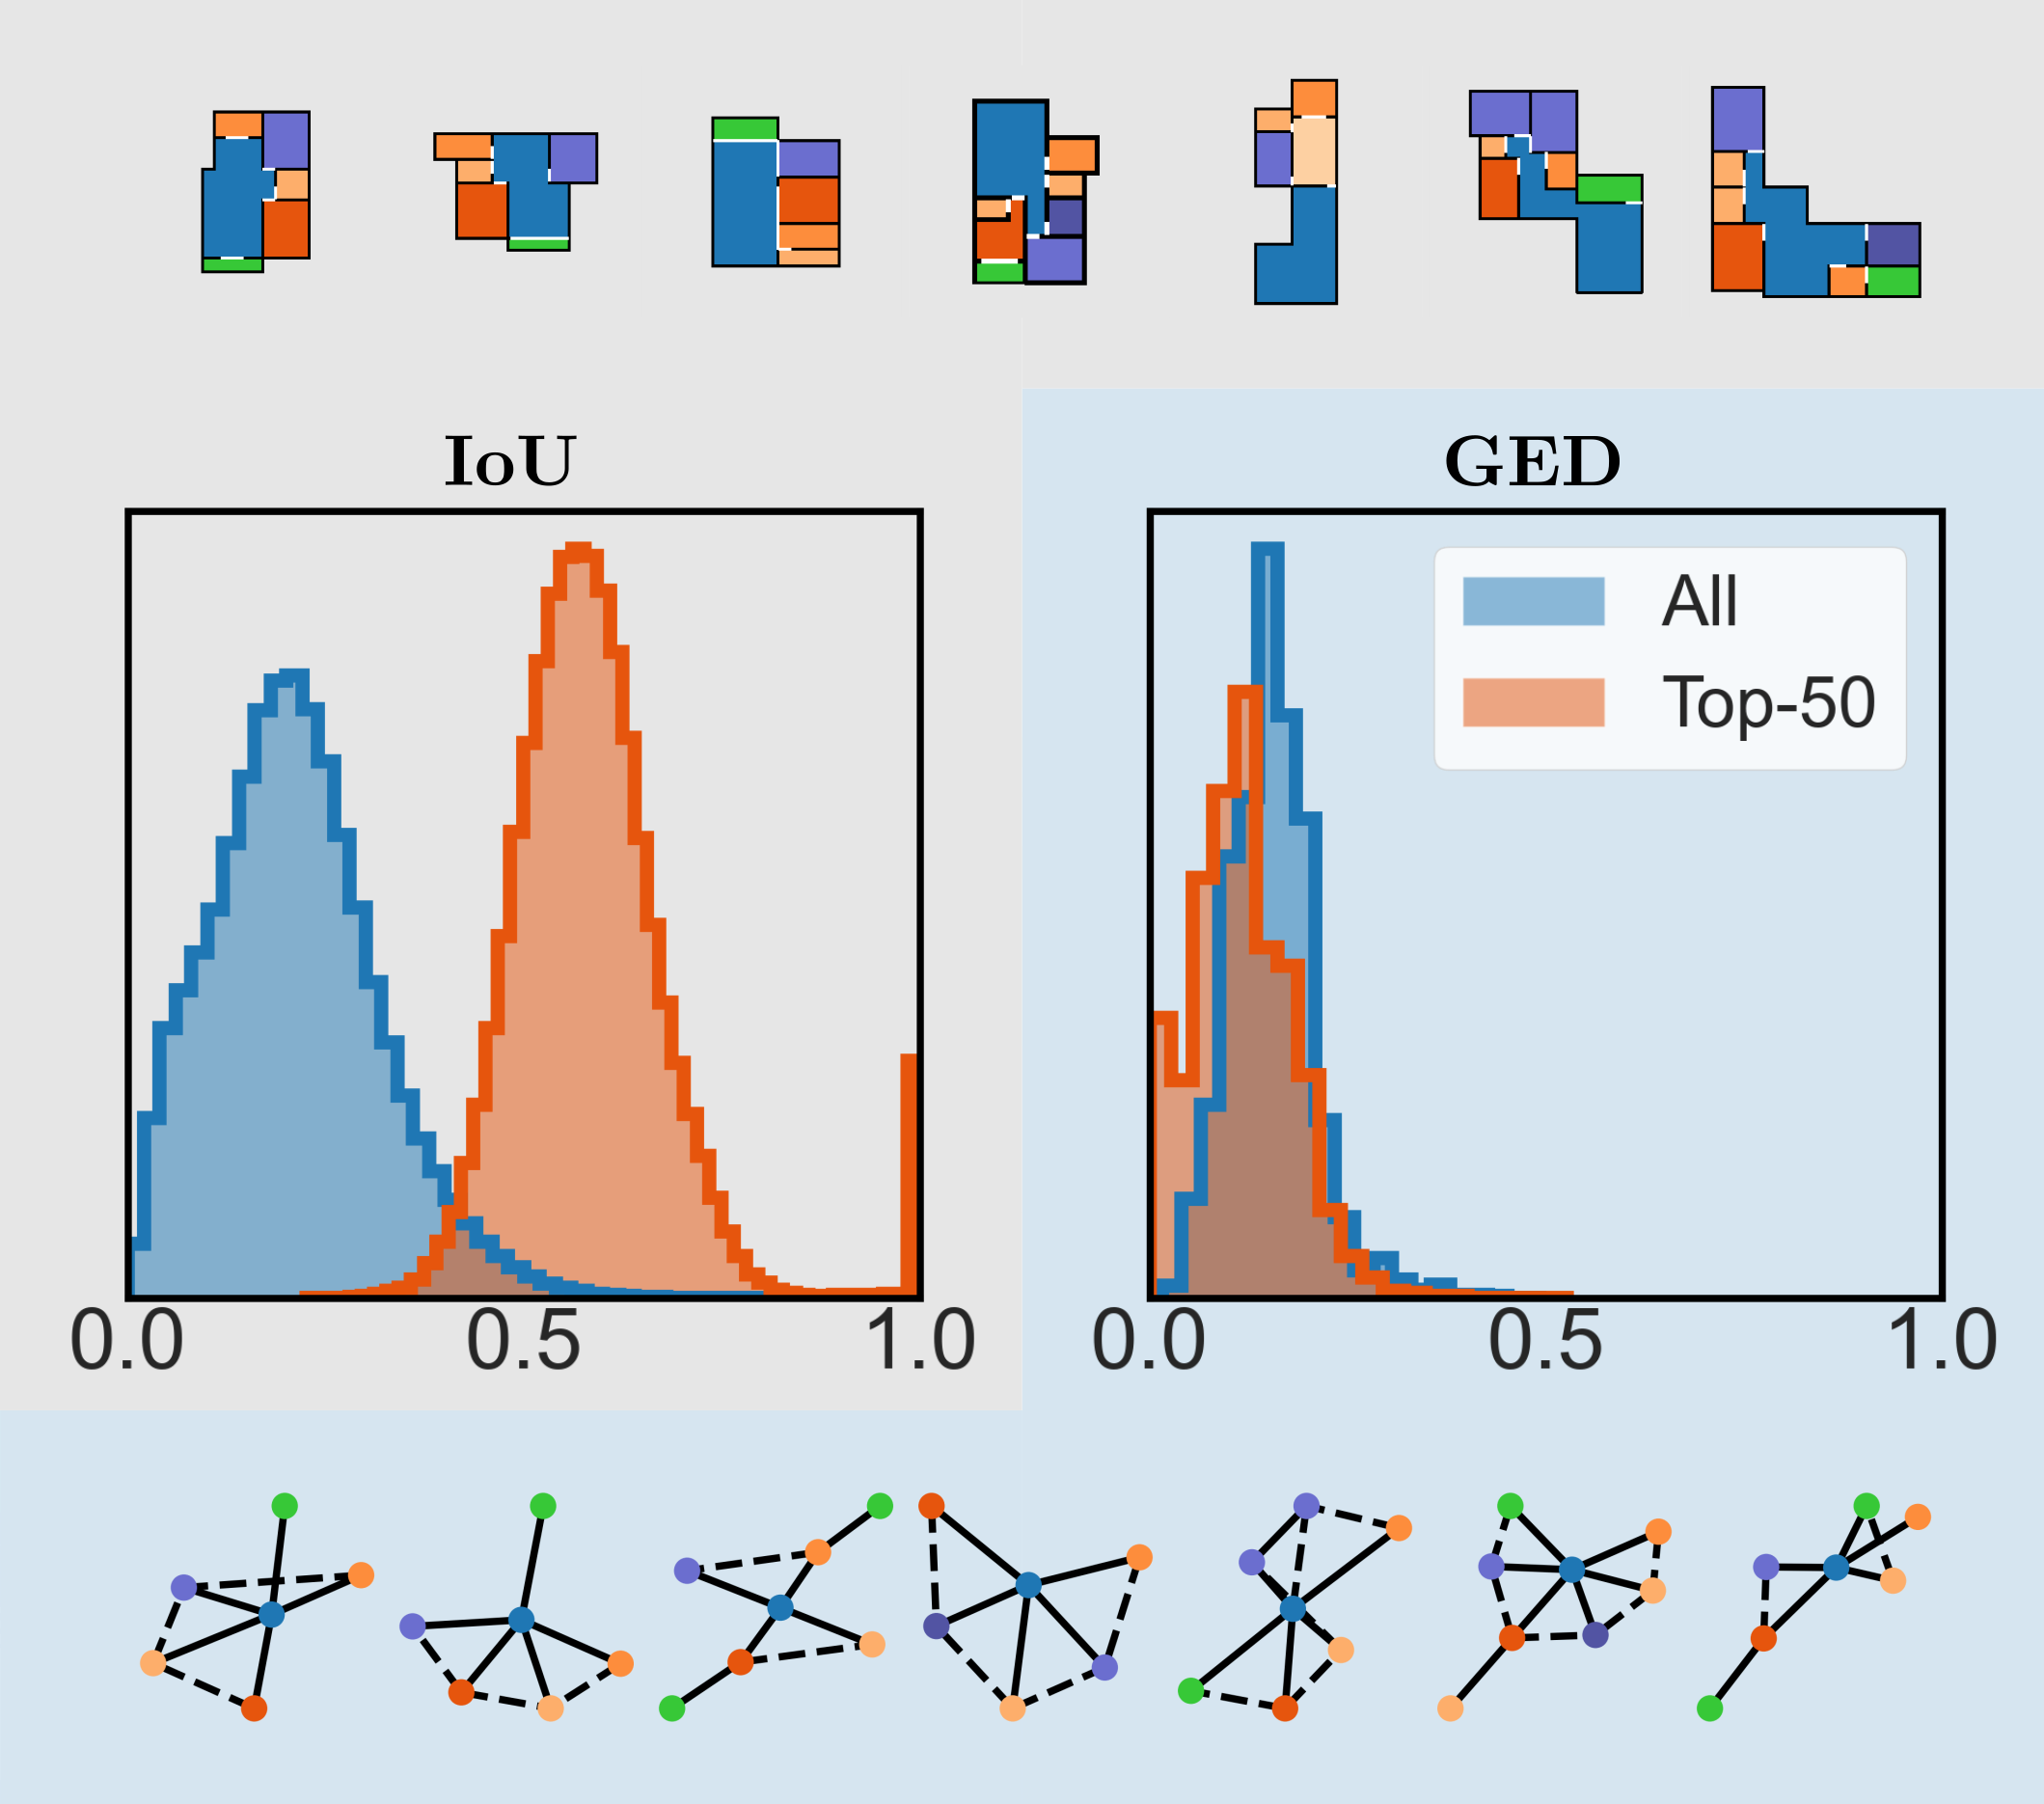
GED
nGED is computed according to Eqs. 5 and 6 and hence cost for node and edge deletions, insertions, and substitutions are kept the same. The histogram of the full distribution is illustrated in Fig. 4 in the middle right plot in blue. We also plot the GED distribution for the 50 best scoring examples on IoU per floor plan identity, shown in orange. Surprisingly, both full and top-50 distributions are nearly similar, revealing a weak (if at all) correlation between IoU and GED. The weak correlation is further investigated in the next section.
It is worth noting that there are only 50 unique GED values in our population of random pairs. The limited range of GED values can be attributed to:
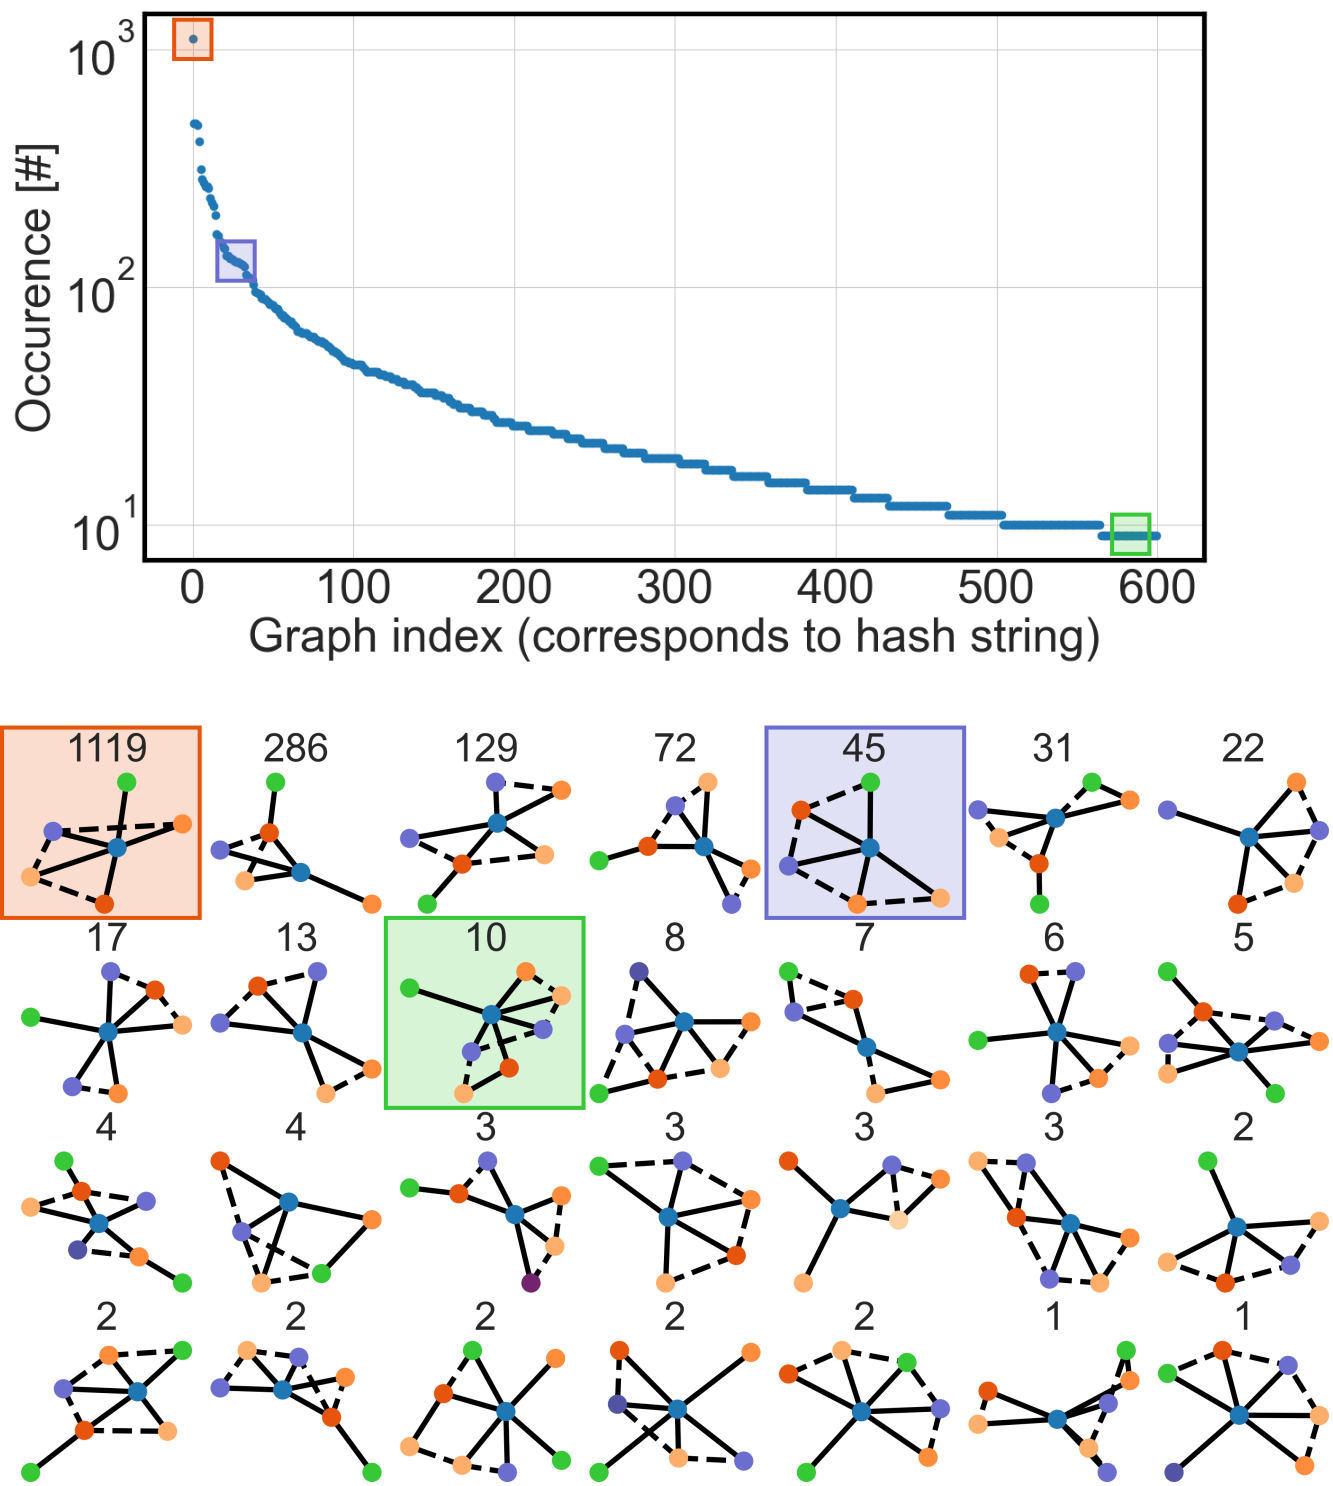
Firstly, the amount of floor plan pairs that share the same underlying base graph – all possible graphs present in the dataset for which each pairwise combination is isomorphic: is isomorphic to – is relatively large. To make our point, we sort all base graphs based on the number of corresponding floor plans and show the huge imbalance between base graph occurrences (see Fig. 5). For example, more than 25% of the data (14k samples) correspond to the 100 most prominent base graphs only. Visualized in Fig. 4 (bottom row) and similar to the IoU originality scores, we score floor plans on graph originality as well. Graph originality is based on the number of corresponding floor plans for a given base graph: the more original the fewer floor plans per base graph. While the main patterns of graph originality are to be more closely investigated, on average the number of nodes as well as edges slightly increase with originality.
Secondly, revealed empirically by the graph originality distribution, the distribution of topology – the graph’s structure – alone is small because the graphs are limited in size (number of connections) and order (number of subdivisions). Furthermore, the topological types are limited as well. Typically, access graphs are confined to be flower-like and thus centered around a single node. The central node is usually the living room and/or hallway.
Indeed, the majority of floor plans stem from a limited collection of base graphs, and only a few node and edge attributes are considered, leading to the ineffectiveness of measuring structural similarity solely based on graph similarity.
4.3 Correlations
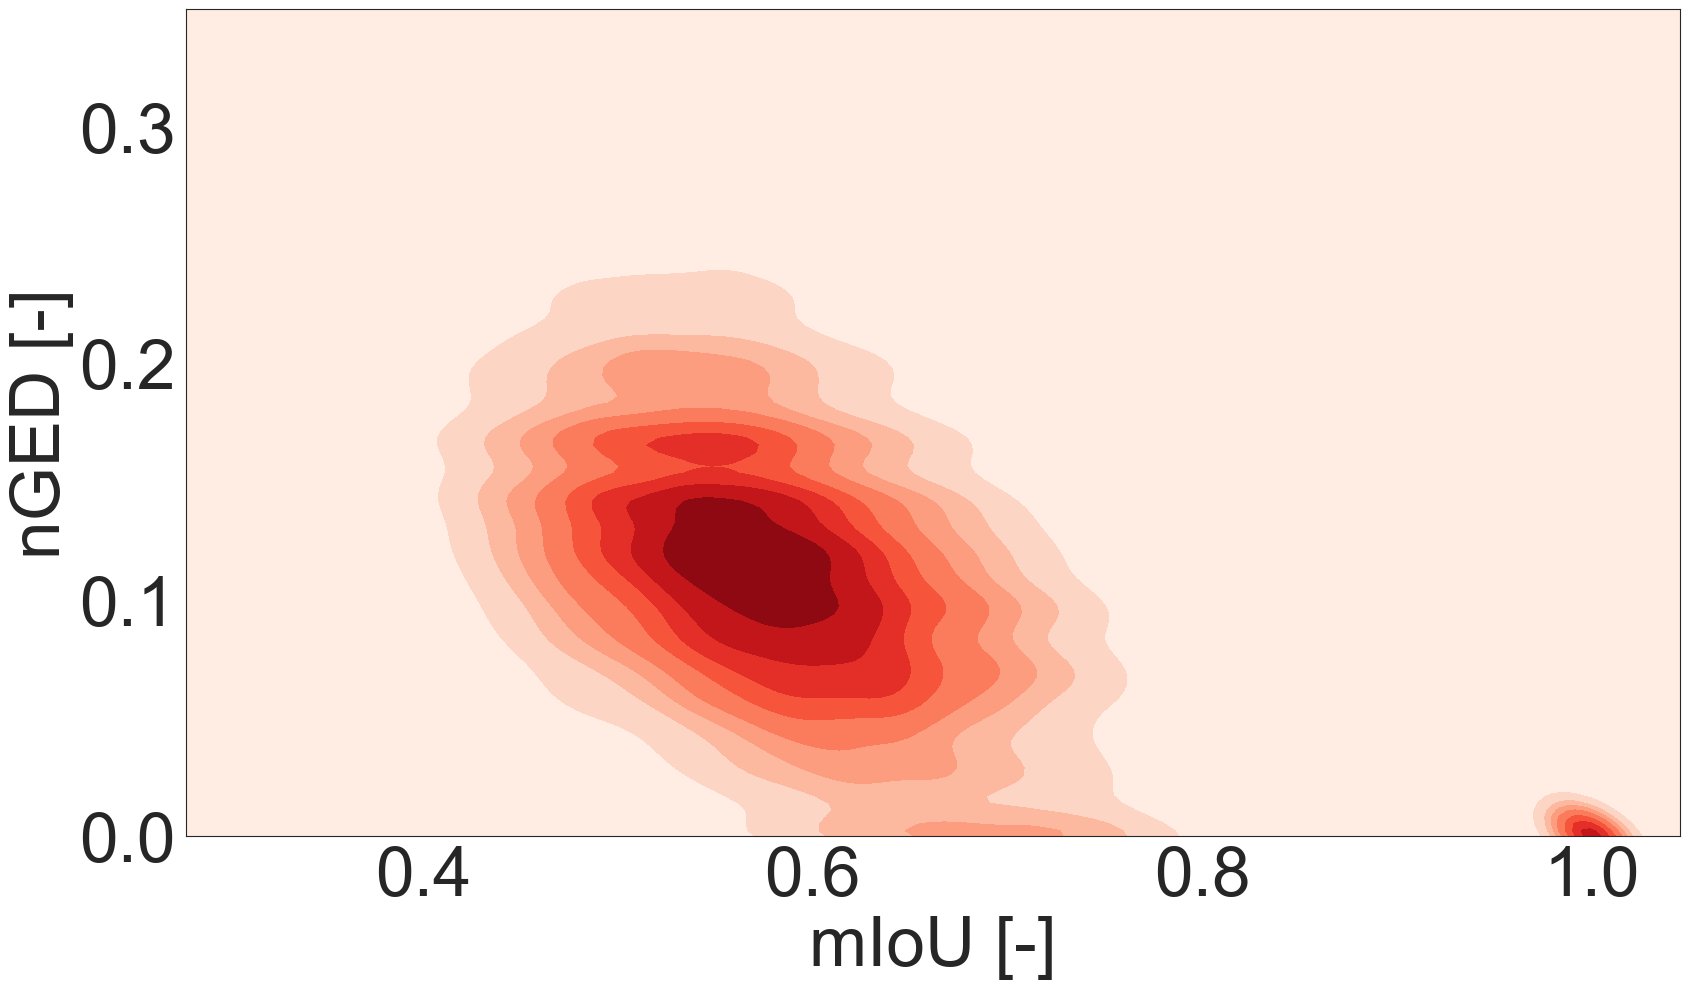
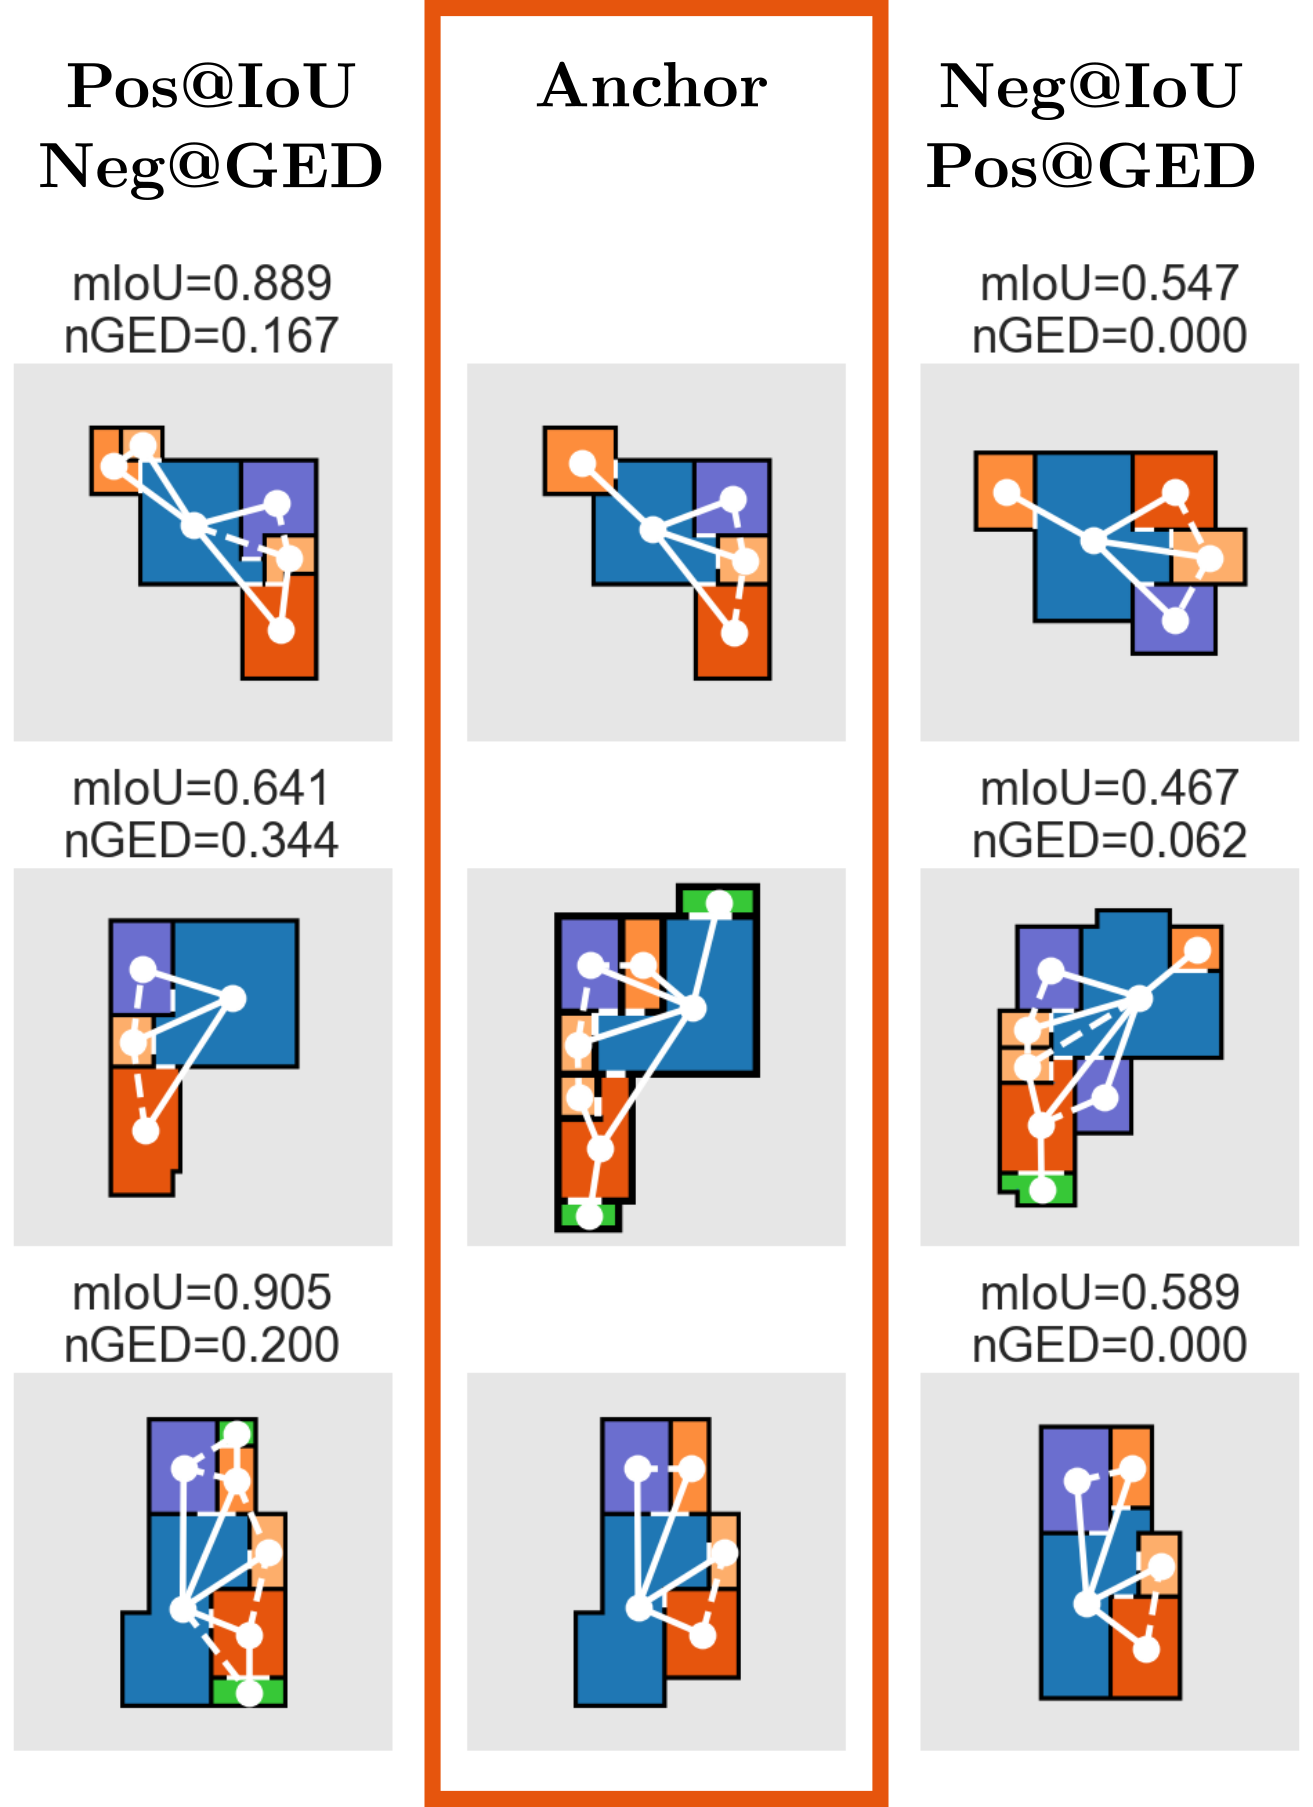
The correlation between IoU and GED is further investigated. The 2D density map of IoU and GED is depicted in Fig. 6 and plotted as a heatmap. We define a positive correlation when increments in visual similarity i.e. higher IoU result in increments in the graph-based similarity i.e. lower GED. Effectively we measure the correlation between IoU and negative GED. The heatmap shows for increasing IoU ranges that GED distributions shift towards lower values, hence the correlation between IoU and GED is positive. To be precise, the Pearson correlation coefficient is 0.503 between mIoU and -nGED, hence GED and IoU are moderately correlated. However, the overlapping regions between GED distributions for different IoU ranges are often large. Specifically, IoU and GED oppose each other 38% of the time – opposition here means that a higher IoU results in a higher GED or that a lower IoU results in a lower GED. Several examples in which IoU and GED oppose each other are given in Fig. 7.
From the triplets shown in Fig. 7, many characteristics of IoU and GED rise to the surface. For an anchor, we define pos@IoU as the positive (IoU high) and neg@IoU as the negative query (IoU low). The same holds for pos@GED (GED low) and neg@GED (GED high). Most prominent is the sensitivity of IoU w.r.t. the overall shape of the building: in all cases, the overall shape between the anchor and the pos@IoU are nearly identical and slightly different for the pos@GED. On the other hand, the number of rooms is often different between the anchor and pos@IoU while (nearly) always equivalent between the anchor and pos@GED: placing or removing rooms is detrimental for GED but in many cases does not hurt IoU so much. Another difference between pos@IoU and pos@GED is the fact that changes in the room shapes – especially to the central space – are not penalized by GED yet detrimental for IoU. The examples reveal the difficulty of measuring the structural similarity of floor plans. Apparently, both measures independently cannot fully grasp structural similarity.
4.4 Floor plan retrieval
We evaluate our ranking algorithm provided in Subsec. 3.5 and qualitatively compare the retrievals to independent IoU- and GED-based rankings, and to retrievals based on a deeply learned metric [13].
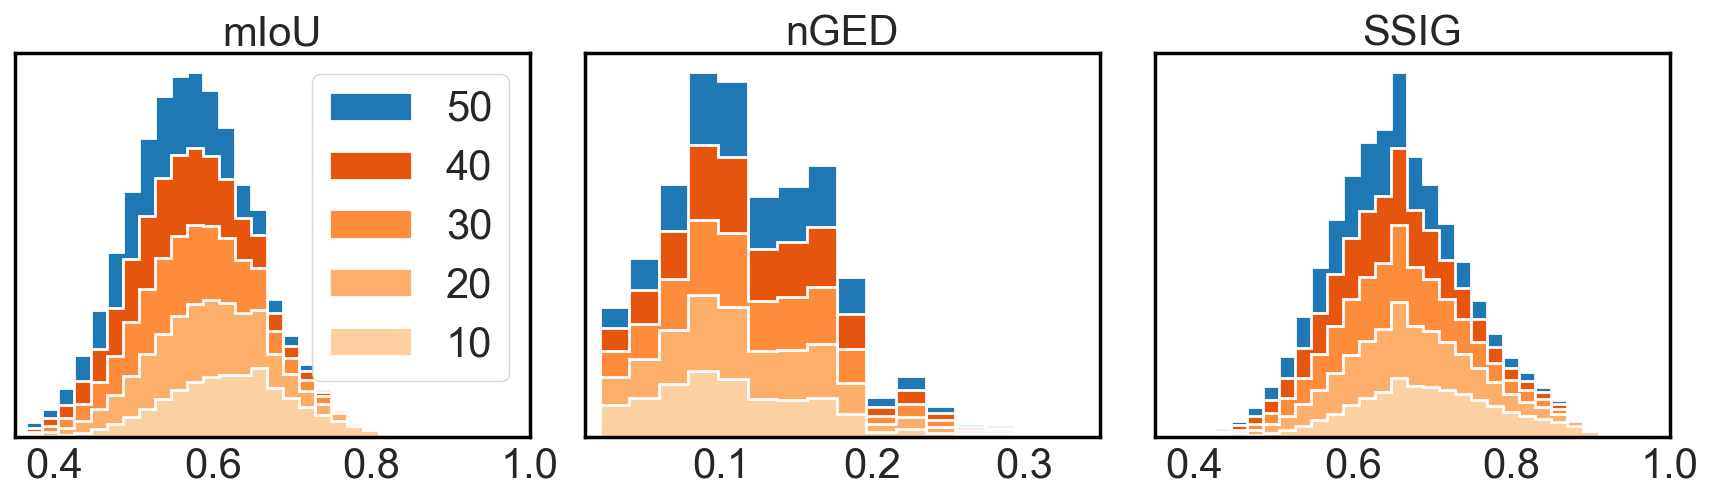
We start by finding a proper value for – the number of samples (when ranked on IoU) considered for further SSIG assessment. In Fig. 9, the distributions for IoU, GED, and SSIG are provided for various values of . In our observation, for relatively large values of SSIG (0.7) every linear increase in adds fewer samples every time. We found for RPLAN that values of = 50 seldom change the top-10 on SSIG. Compared to measuring SSIG on the whole dataset, SSIG only needs to be computed 50 times. We believe that IoU, at least in the case of RPLAN, is a proper first step to find correspondences in structural similarity coarsely, while GED is a proper help to measure structural similarity on a finer level. Hence, we refer to our ranking method as a visually-guided graph edit distance.
Our algorithm is compute-efficient w.r.t. GMNs. Depending on the size and originality of the floor plan’s corresponding access graphs, our algorithm takes between 1 and 5 s on a single CPU per unseen sample to fully rank it. Compared to LayoutGMN, the same computation takes approximately 1500 s. Hence, our algorithm is compute-efficient w.r.t. GMNs.
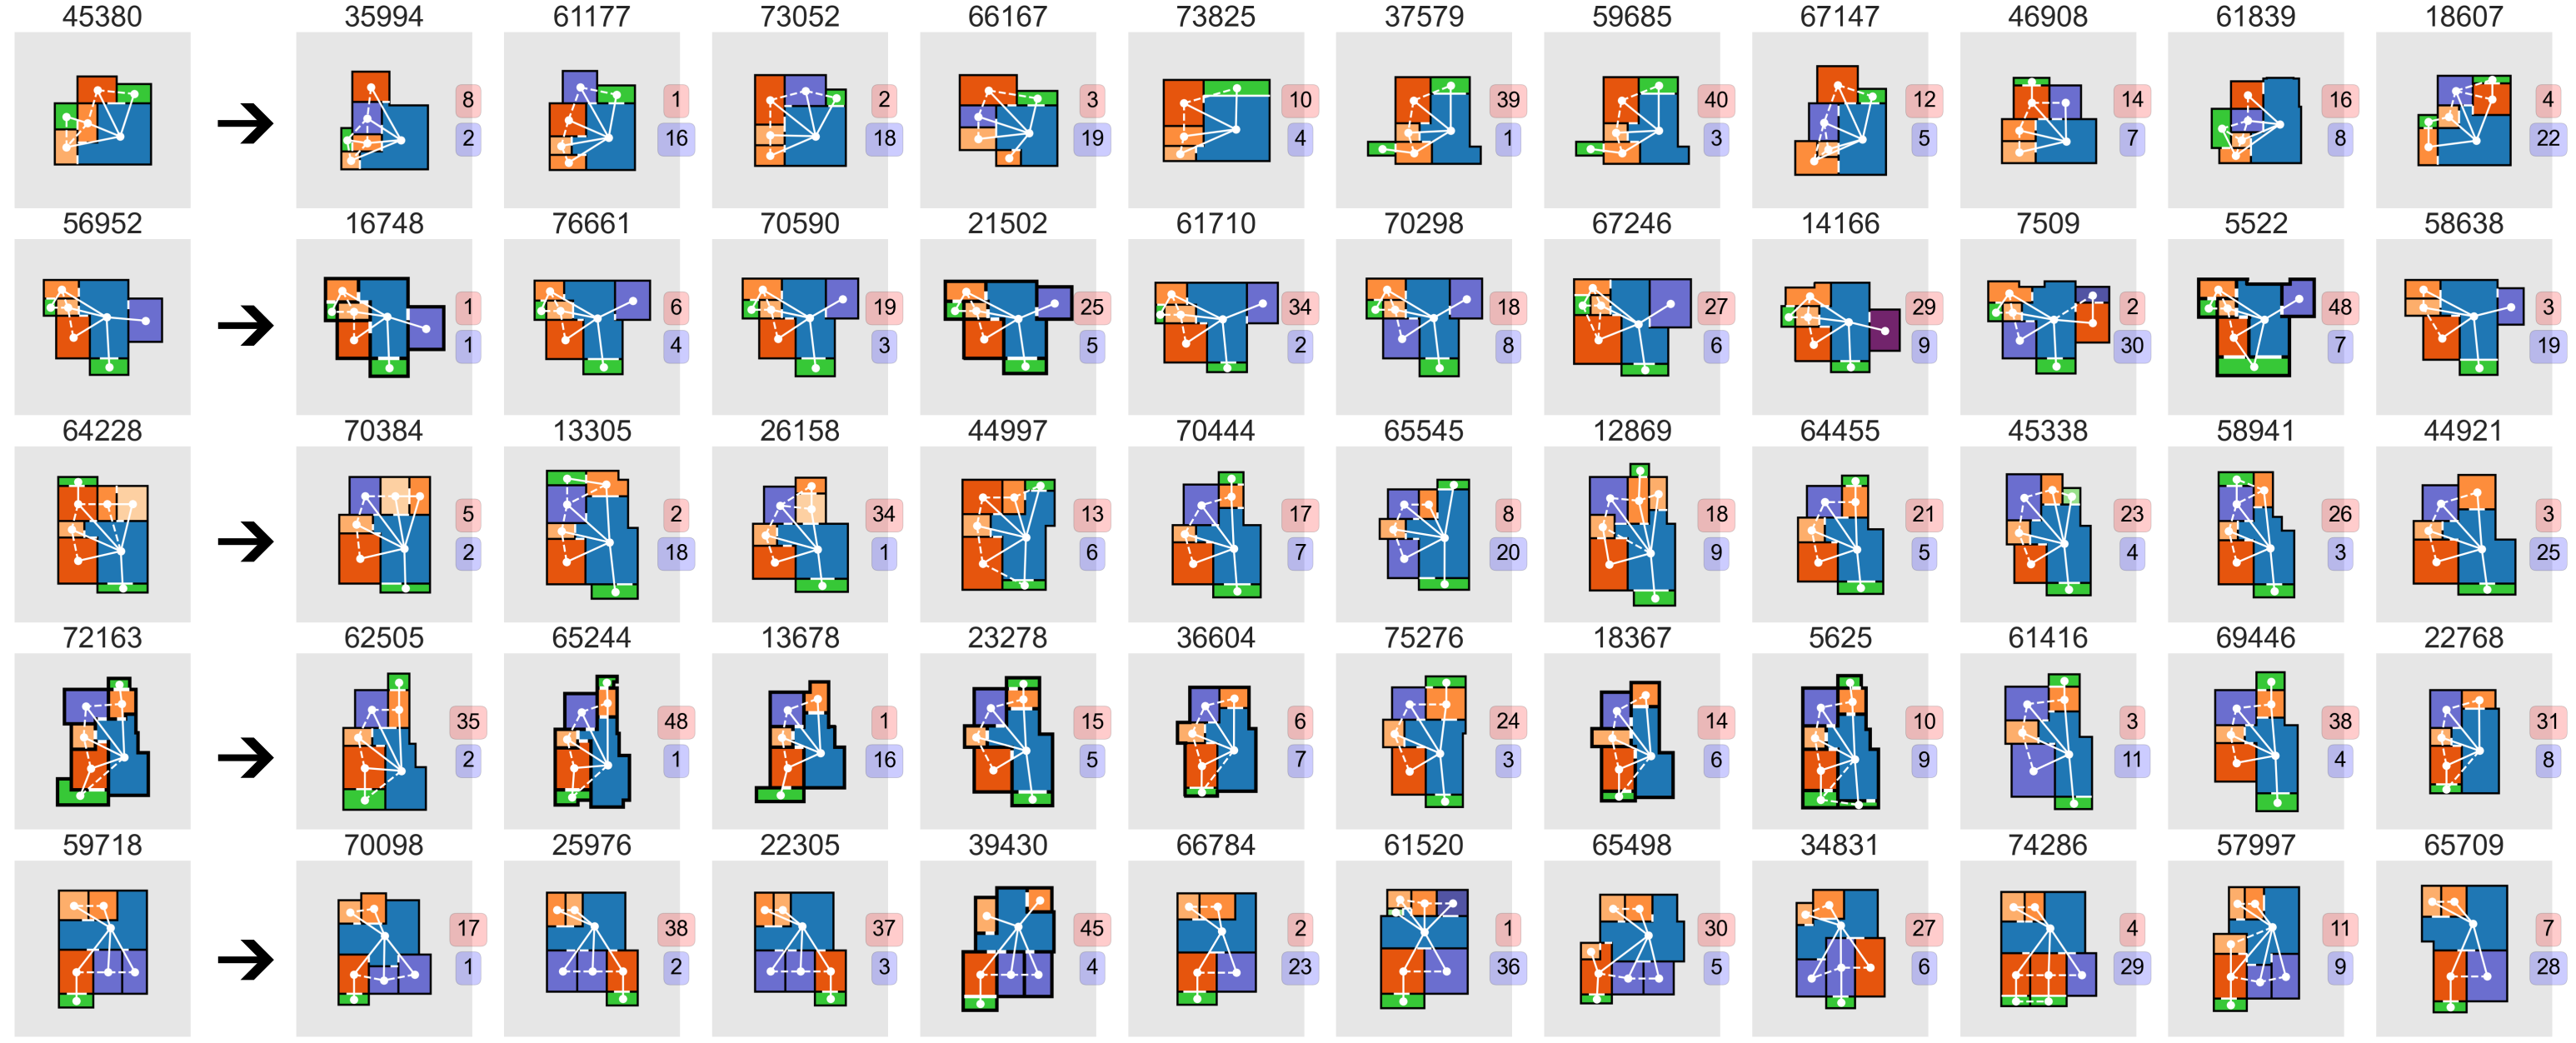
Randomly picked retrievals (top 10) of our method are shown in Fig. 8 and compared against IoU- and GED-only ranks. In red and blue are IoU and GED ranks, respectively. Not surprisingly the SSIG, IoU, and GED ranks are quite different which can be attributed to the fact that the correlation between IoU and GED is only weakly positive (see Subsec. 4.3). Compared to IoU- and GED-only retrievals, it can be seen that SSIG indeed compensates for ’failures’ in IoU and GED. For example in the last row of Fig. 8, the first 4 retrieval results, even though having a low IoU value, are compensated by GED, while the 5th retrieval is compensated by IoU, even though having a low GED value. Similar compensation for failures can be found back in the retrievals of deeply learned metrics, see [13, 4, 8].
5 Conclusion and future work
In this work, we showed that image- as well as graph-based similarity metrics alone are likely not enough to robustly measure structural similarity between floor plans. We overcome the shortcomings by combining IoU and GED into one metric, called SSIG. We qualitatively showed that a floor plan database which is ranked on SSIG shares similar characteristics to results of state-of-the-art methods that use GMNs to compute the ranking.
This work is however limited to investigating IoU and GED and does not consider other well-known image- and graph-based similarity metrics. Moreover, we did not conduct any user study to rigorously assess our claims further. In future studies we hope to address both limitations.
The formulation of similarity as defined in Eq. 1 is setup in a task-agnostic manner - the formulation addresses floor plan similarity as a single overall measure. In many cases, however, a more realistic way to setup similarity might be dynamic (e.g., based on categories), hence, allowing for different similarity scores across multiple use cases whether used in floor plan tailored search engines, evaluation of floor plan generation, etc. Our aim is to work on such formulations in the future.
We believe that SSIG will pave a way towards improved data-driven research on floor plans, such as for providing a more natural objective to train deep metric learning frameworks that do not necessarily require information sharing across branches.
References
- [1] Stanislas Chaillou. AI + Architecture | Towards a New Approach. Harvard University, Jan. 2019.
- [2] Biplab Deka, Zifeng Huang, Chad Franzen, Joshua Hibschman, Daniel Afergan, Yang Li, Jeffrey Nichols, and Ranjitha Kumar. Rico: A Mobile App Dataset for Building Data-Driven Design Applications. In Proceedings of the 30th Annual ACM Symposium on User Interface Software and Technology, UIST ’17, pages 845–854, New York, NY, USA, Oct. 2017. Association for Computing Machinery.
- [3] Shreyas Hampali, Sinisa Stekovic, Sayan Deb Sarkar, Chetan S. Kumar, Friedrich Fraundorfer, and Vincent Lepetit. Monte Carlo Scene Search for 3D Scene Understanding. In 2021 IEEE/CVF Conference on Computer Vision and Pattern Recognition (CVPR), pages 13799–13808, Nashville, TN, USA, June 2021. IEEE.
- [4] Jiongchao Jin, Zhou Xue, and Biao Leng. SHRAG: Semantic Hierarchical Graph for Floorplan Representation. In 2022 International Conference on 3D Vision (3DV), pages 271–279, Sept. 2022. ISSN: 2475-7888.
- [5] Rasika Khade, Krupa Jariwala, Chiranjoy Chattopadhyay, and Umapada Pal. A rotation and scale invariant approach for multi-oriented floor plan image retrieval. Pattern Recognition Letters, 145:1–7, May 2021.
- [6] Yujia Li, Chenjie Gu, Thomas Dullien, Oriol Vinyals, and Pushmeet Kohli. Graph Matching Networks for Learning the Similarity of Graph Structured Objects. In Proceedings of the 36th International Conference on Machine Learning, pages 3835–3845. PMLR, May 2019. ISSN: 2640-3498.
- [7] Chen Liu, Jiajun Wu, Pushmeet Kohli, and Yasutaka Furukawa. Raster-To-Vector: Revisiting Floorplan Transformation. In 2017 Proceedings of the IEEE International Conference on Computer Vision, pages 2195–2203, 2017.
- [8] Dipu Manandhar, Dan Ruta, and John Collomosse. Learning Structural Similarity of User Interface Layouts Using Graph Networks. In Andrea Vedaldi, Horst Bischof, Thomas Brox, and Jan-Michael Frahm, editors, Computer Vision – ECCV 2020, volume 12367, pages 730–746. Springer International Publishing, Cham, 2020. Series Title: Lecture Notes in Computer Science.
- [9] Nelson Nauata, Kai-Hung Chang, Chin-Yi Cheng, Greg Mori, and Yasutaka Furukawa. House-GAN: Relational Generative Adversarial Networks for Graph-Constrained House Layout Generation. In Andrea Vedaldi, Horst Bischof, Thomas Brox, and Jan-Michael Frahm, editors, Computer Vision – ECCV 2020, Lecture Notes in Computer Science, pages 162–177, Cham, 2020. Springer International Publishing.
- [10] Nelson Nauata, Sepidehsadat Hosseini, Kai-Hung Chang, Hang Chu, Chin-Yi Cheng, and Yasutaka Furukawa. House-GAN++: Generative Adversarial Layout Refinement Network towards Intelligent Computational Agent for Professional Architects. pages 13632–13641, 2021.
- [11] Lawrence O’Gorman and Rangachar Kasturi. Executive briefing: document image analysis. IEEE Computer Society Press, Los Alamitos, Calif, 1997.
- [12] Hyejin Park, Hyegyo Suh, Jaeil Kim, and Seungyeon Choo. Floor plan recommendation system using graph neural network with spatial relationship dataset. Journal of Building Engineering, page 106378, Mar. 2023.
- [13] Akshay Gadi Patil, Manyi Li, Matthew Fisher, Manolis Savva, and Hao Zhang. LayoutGMN: Neural Graph Matching for Structural Layout Similarity. In 2021 IEEE/CVF Conference on Computer Vision and Pattern Recognition (CVPR), pages 11043–11052, Nashville, TN, USA, June 2021. IEEE.
- [14] Morteza Rahbar, Mohammadjavad Mahdavinejad, Amir H. D. Markazi, and Mohammadreza Bemanian. Architectural layout design through deep learning and agent-based modeling: A hybrid approach. Journal of Building Engineering, 47:103822, Apr. 2022.
- [15] Pau Riba, Andreas Fischer, Josep Lladós, and Alicia Fornés. Learning graph edit distance by graph neural networks. Pattern Recognition, 120:108132, Dec. 2021.
- [16] Qamer Uddin Sabri, Johannes Bayer, Viktor Ayzenshtadt, Syed Saqib Bukhari, Klaus-Dieter Althoff, and Andreas Dengel. Semantic Pattern-based Retrieval of Architectural Floor Plans with Case-based and Graph-based Searching Techniques and their Evaluation and Visualization:. In Proceedings of the 6th International Conference on Pattern Recognition Applications and Methods, pages 50–60, Porto, Portugal, 2017. SCITEPRESS - Science and Technology Publications.
- [17] Alberto Sanfeliu and King-Sun Fu. A distance measure between attributed relational graphs for pattern recognition. IEEE Transactions on Systems, Man, and Cybernetics, SMC-13(3):353–362, May 1983. Conference Name: IEEE Transactions on Systems, Man, and Cybernetics.
- [18] Mohammad Amin Shabani, Sepidehsadat Hosseini, and Yasutaka Furukawa. HouseDiffusion: Vector Floorplan Generation via a Diffusion Model with Discrete and Continuous Denoising, Nov. 2022. arXiv:2211.13287 [cs].
- [19] Divya Sharma and Chiranjoy Chattopadhyay. High-level feature aggregation for fine-grained architectural floor plan retrieval. IET Computer Vision, 12(5):702–709, 2018. _eprint: https://onlinelibrary.wiley.com/doi/pdf/10.1049/iet-cvi.2017.0581.
- [20] Divya Sharma, Chiranjoy Chattopadhyay, and Gaurav Harit. A unified framework for semantic matching of architectural floorplans. In 2016 23rd International Conference on Pattern Recognition (ICPR), pages 2422–2427, Dec. 2016.
- [21] Divya Sharma, Nitin Gupta, Chiranjoy Chattopadhyay, and Sameep Mehta. DANIEL: A Deep Architecture for Automatic Analysis and Retrieval of Building Floor Plans. In 2017 14th IAPR International Conference on Document Analysis and Recognition (ICDAR), volume 01, pages 420–425, Nov. 2017. ISSN: 2379-2140.
- [22] Chia-Ying Shih and Chi-Han Peng. Floor Plan Exploration Framework Based on Similarity Distances, Nov. 2022. arXiv:2211.07331 [cs].
- [23] Yuki Takada, Naoto Inoue, Toshihiko Yamasaki, and Kiyoharu Aizawa. Similar floor plan retrieval featuring multi-task learning of layout type classification and room presence prediction. In 2018 IEEE International Conference on Consumer Electronics (ICCE), pages 1–6, Jan. 2018. ISSN: 2158-4001.
- [24] Hao Tang, Zhenyu Zhang, Humphrey Shi, Bo Li, Ling Shao, Nicu Sebe, Radu Timofte, and Luc Van Gool. Graph Transformer GANs for Graph-Constrained House Generation, Mar. 2023. arXiv:2303.08225 [cs].
- [25] Markus Weber, Christoph Langenhan, Thomas Roth-Berghofer, Marcus Liwicki, Andreas Dengel, and Frank Petzold. a.SCatch: Semantic Structure for Architectural Floor Plan Retrieval. In Isabelle Bichindaritz and Stefania Montani, editors, Case-Based Reasoning. Research and Development, Lecture Notes in Computer Science, pages 510–524, Berlin, Heidelberg, 2010. Springer.
- [26] Wenming Wu, Xiao-Ming Fu, Rui Tang, Yuhan Wang, Yu-Hao Qi, and Ligang Liu. Data-driven interior plan generation for residential buildings. ACM Transactions on Graphics, 38(6):234:1–234:12, Nov. 2019.
- [27] Mantaro Yamada, Xueting Wang, and Toshihiko Yamasaki. Graph Structure Extraction from Floor Plan Images and Its Application to Similar Property Retrieval. In 2021 IEEE International Conference on Consumer Electronics (ICCE), pages 1–5, Jan. 2021. ISSN: 2158-4001.
- [28] Xu Zhong, Jianbin Tang, and Antonio Jimeno Yepes. PubLayNet: largest dataset ever for document layout analysis, Aug. 2019. arXiv:1908.07836 [cs].