Leveraging Model Fusion for
Improved License Plate Recognition††thanks: Supported by the Coordination for the Improvement of Higher Education Personnel (CAPES) (# 88881.516265/2020-01), and by the National Council for Scientific and Technological Development (CNPq) (# 309953/2019-7 and # 308879/2020-1).
Abstract
License Plate Recognition (LPR) plays a critical role in various applications, such as toll collection, parking management, and traffic law enforcement. Although LPR has witnessed significant advancements through the development of deep learning, there has been a noticeable lack of studies exploring the potential improvements in results by fusing the outputs from multiple recognition models. This research aims to fill this gap by investigating the combination of up to 12 different models using straightforward approaches, such as selecting the most confident prediction or employing majority vote-based strategies. Our experiments encompass a wide range of datasets, revealing substantial benefits of fusion approaches in both intra- and cross-dataset setups. Essentially, fusing multiple models reduces considerably the likelihood of obtaining subpar performance on a particular dataset/scenario. We also found that combining models based on their speed is an appealing approach. Specifically, for applications where the recognition task can tolerate some additional time, though not excessively, an effective strategy is to combine – models. These models may not be the most accurate individually, but their fusion strikes an optimal balance between speed and accuracy.
Keywords:
License Plate Recognition Model Fusion Ensemble.1 Introduction
Automatic License Plate Recognition (ALPR) has garnered substantial interest in recent years due to its many practical applications, which include toll collection, parking management, border control, and road traffic monitoring [22, 43, 18].
In the deep learning era, ALPR systems customarily comprise two key components: license plate detection (LPD) and license plate recognition (LPR). LPD entails locating regions containing license plates (LPs) within an image, while LPR involves identifying the characters within these LPs. Recent research has predominantly concentrated on advancing LPR [27, 47, 30], given that widely adopted object detectors such as Faster-RCNN and YOLO have consistently delivered impressive results in LPD for some years now [14, 21, 48].
This study also focuses on LPR but provides a unique perspective compared to recent research. Although deep learning techniques have enabled significant advancements in this field over the past years, multiple studies have shown that different models exhibit varying levels of robustness across different datasets [46, 29, 19]. Each dataset poses distinct challenges, such as diverse LP layouts and varying tilt ranges. As a result, a method that performs optimally on one dataset may yield poor results on another. This raises an important question: “Can we substantially enhance LPR results by fusing the outputs of diverse recognition models?” If so, two additional questions arise: “To what extent can this improvement be attained?” and “How many and which models should be employed?” As of now, such questions remain unanswered in the existing literature.
We acknowledge that some ALPR applications impose stringent time constraints on their execution. This is particularly true for embedded systems engaged in tasks such as access control and parking management in high-traffic areas. However, in other contexts, such as systems used for issuing traffic tickets and conducting forensic investigations, there is often a preference to prioritize the recognition rate, even if it sacrifices efficiency [16, 30, 33]. These scenarios can greatly benefit from the fusion of multiple recognition models.
Taking this into account, in this study, we thoroughly examine the potential of enhancing LPR results through the fusion of outputs from multiple recognition models. Remarkably, we assess the combination of up to 12 well-known models across 12 different datasets, setting our investigation apart from earlier studies.
In summary, this paper has two main contributions:
-
We present empirical evidence showcasing the benefits offered by fusion approaches in both intra- and cross-dataset setups. In the intra-dataset setup, the mean recognition rate across the datasets experiences a substantial boost, rising from % achieved by the best model individually to % when leveraging the best fusion approach. Similarly, in the cross-dataset setup, the mean recognition rate increases from % to levels exceeding %. Notably, in both setups, the sequence-level majority vote fusion approach outperform both character-level majority vote and selecting the prediction made with the highest confidence approaches.
-
We draw attention to the effectiveness of fusing models based on their speed. This approach is particularly useful for applications where the recognition task can accommodate a moderate increase in processing time. In such cases, the recommended strategy is to combine – fast models. Although these models may not achieve the highest accuracy individually, their fusion results in an optimal trade-off between speed and accuracy.
The rest of this paper is structured as follows. Section 2 provides a concise overview of the recognition models explored in this work. The experimental setup adopted in our research is detailed in Section 3. The results obtained are presented and analyzed in Section 4. Lastly, Section 5 summarizes our findings.
2 Related Work
LPR is widely recognized as a specific application within the field of scene text recognition [50, 26, 7]. LPR sets itself apart primarily due to the limited presence of strong linguistic context information and the minimal variation observed between characters. The following paragraphs briefly describe well-known models originally proposed for general scene text recognition, LPR, and related tasks. These models will be explored in this study.
Baek et al. [2] introduced a four-stage framework (depicted in Fig. 1) that models the design patterns of most modern methods for scene text recognition. The Transformation stage removes the distortion from the input image so that the text is horizontal or normalized. This task is generally done through spatial transformer networks with a thin-plate splines (TPS) transformation, which models the distortion by finding and correcting fiducial points. The second stage, Feature Extraction, maps the input image to a representation that focuses on the attributes relevant to character recognition while suppressing irrelevant features such as font, color, size and background. This task is usually performed by a module composed of Convolutional Neural Networks (CNNs), such as VGG, ResNet, and RCNN. The Sequence Modeling stage converts visual features to contextual features that capture the context in the sequence of characters. Bi-directional Long Short-Term Memory (Bi-LSTM) is generally employed for this task. Finally, the Prediction stage produces the character sequence from the identified features. This task is typically done by a Connectionist Temporal Classification (CTC) decoder or through an attention mechanism. As can be seen in Table 1, while most methods can fit within this framework, they do not necessarily incorporate all four modules.

Atienza [1] drew inspiration from the accomplishments of the Vision Transformer (ViT) and put forward a single-stage model named ViTSTR for scene text recognition. It operates by initially dividing the input image into non-overlapping patches. These patches are then converted into –D vector embeddings (i.e., flattened –D patches). To feed the encoder, each embedding is supplemented with a learnable patch embedding and a corresponding position encoding.
Recent works on LPR have focused on developing multi-task CNNs that can process the entire LP image holistically, eliminating the need for character segmentation [39, 11, 6]. Two such models are Holistic-CNN [39] and Multi-Task-LR [11]. In these models, the LP image undergoes initial processing via convolutional layers, followed by branches of fully connected layers. Each branch is responsible for predicting a single character class (including a ‘blank’ character) at a specific position on the LP, enabling the branches to collectively predict up to characters. Both models are often used as baselines due to their remarkable balance between speed and accuracy [27, 12, 19, 20, 30].
The great speed/accuracy trade-off provided by YOLO networks [41] has inspired many authors to explore similar architectures targeting real-time performance for LPR and similar tasks. Silva & Jung [37] proposed CR-NET, a YOLO-based model that effectively detects and recognizes all characters within a cropped LP [22, 19, 38]. Another noteworthy model is Fast-OCR [23], which incorporates features from several object detectors that prioritize the trade-off between speed and accuracy. In the domain of automatic meter reading [23], Fast-OCR achieved considerably better results than multiple baselines that perform recognition holistically, including CRNN [34], Multi-Task-LR [11] and TRBA [2].
While we found a few works leveraging model fusion to improve LPR results, we observed that they explored a limited range of models and datasets in the experiments. For example, Izidio et al. [16] employed multiple instances of the same model (i.e., Tiny-YOLOv3) rather than different models with varying architectures. Their experiments were conducted exclusively on a private dataset. Another example is the very recent work by Schirrmacher et al. [33], where they examined deep ensembles, BatchEnsemble, and Monte Carlo dropout using multiple instances of two backbone architectures. The authors’ primary focus was on recognizing severely degraded images, leading them to perform nearly all of their experiments on a synthetic dataset containing artificially degraded images.
In summary, although the field of LPR has witnessed significant advancements through the development and application of deep learning-based models, there has been a noticeable lack of studies thoroughly examining the potential improvements in results by fusing the outputs from multiple recognition models.
3 Experimental Setup
This section provides an overview of the setup adopted in our experiments. We first enumerate the recognition models implemented for this study, providing specific information about the framework used for training and testing each of them, as well as the corresponding hyperparameters. Subsequently, we compile a list of the datasets employed in our assessments, showcasing sample LP images from each dataset to highlight their diversity. Afterward, we elaborate on the strategies examined for fusing the outputs of the different models. Finally, we describe how the performance evaluation is carried out.
The experiments were conducted on a PC with an AMD Ryzen Threadripper X GHz CPU, GB of RAM operating at MHz, an SSD (read: MB/s; write: MB/s), and an NVIDIA Quadro RTX GPU ( GB).
3.1 Recognition Models
We explore recognition models in our experiments: RARE [35], R2AM [25], STAR-Net [28], CRNN [34], GRCNN [42], Holistic-CNN [39], Multi-Task-LR [11], Rosetta [4], TRBA [2], CR-NET [37], Fast-OCR [23] and ViTSTR-Base [1]. As discussed in Section 2, these models were chosen because they rely on design patterns shared by many renowned models for scene text recognition, as well as for their frequent roles as baselines in recent LPR research [12, 19, 17, 20].
We implemented each model using the original framework or well-known public repositories associated with it. Specifically, we used Darknet111https://github.com/AlexeyAB/darknet for the YOLO-based models (CR-NET and Fast-OCR). The multi-task models, Holistic-CNN and Multi-Task-LR, were trained and evaluated using Keras. As for the remaining models, which were originally proposed for general scene text recognition, we used a fork222https://github.com/roatienza/deep-text-recognition-benchmark/ of the open source repository of Clova AI Research (PyTorch).
Here we list the hyperparameters employed in each framework for training the recognition models. These hyperparameters were determined based on existing research [2, 1, 19] and were further validated through experiments on the validation set. In Darknet, the parameters include: Stochastic Gradient Descent (SGD) optimizer, K iterations, a batch size of , and a learning rate of [-, -, -] with decay steps at K and K iterations. In Keras, we employed the Adam optimizer with an initial learning rate of - (ReduceLROnPlateau’s patience of and factor of -), a batch size of , and a patience value of (patience indicates the number of epochs without improvement before training is stopped). In PyTorch, we used the following parameters: Adadelta optimizer with a decay rate of , K iterations, and a batch size of . The only modification we made to the models’ architectures was adjusting the respective input layers to accommodate images with a width-to-height ratio of .
3.2 Datasets
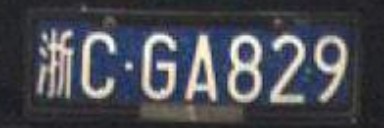
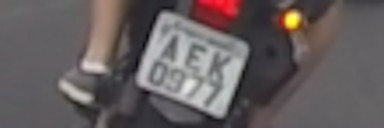
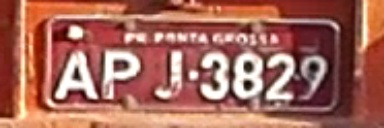
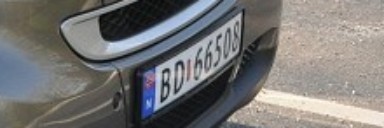
Researchers have conducted experiments on various datasets to showcase the effectiveness of their systems in recognizing LPs from different regions [36, 13, 22, 26]. As shown in Table 2, we perform experiments using images from 12 public datasets commonly used to benchmark ALPR systems [46, 38, 19, 24, 18]. Each dataset was divided using standard splits, defined by the datasets’ authors, or following previous works [22, 43, 18] (when there is no standard split)333Detailed information on which images were used to train, validate and test the models can be accessed at https://raysonlaroca.github.io/supp/lpr-model-fusion/. Specifically, eight datasets were used both for training and evaluating the recognition models, while four were used exclusively for testing. The selected datasets exhibit substantial diversity in terms of image quantity, acquisition settings, image resolution, and LP layouts. As far as we know, no other work in ALPR research has conducted experiments using images from such a wide range of public datasets.
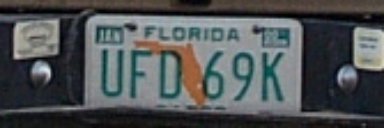
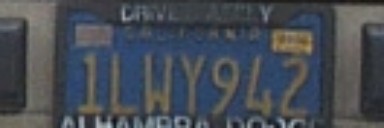
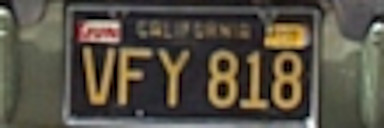
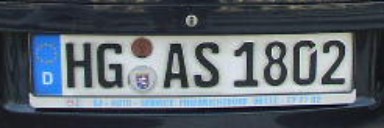
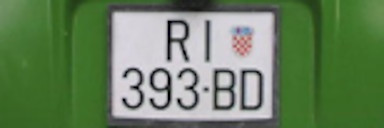
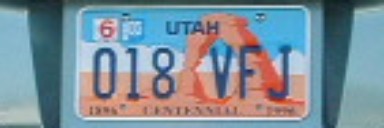
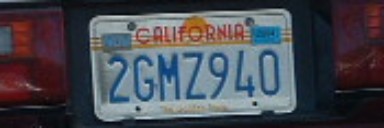
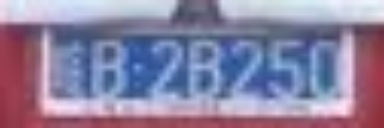
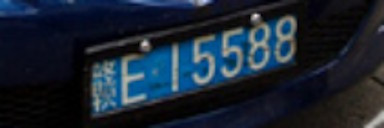
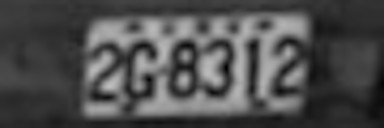
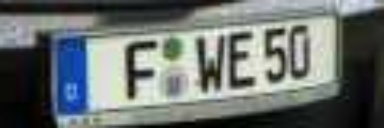
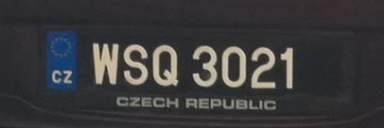
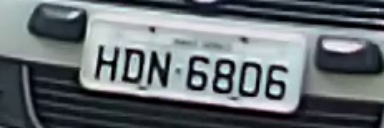
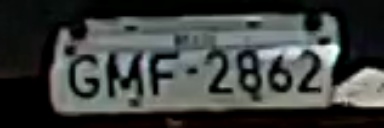
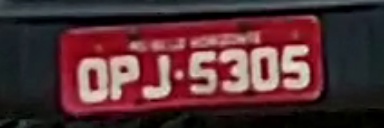
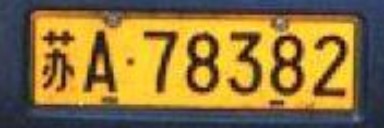
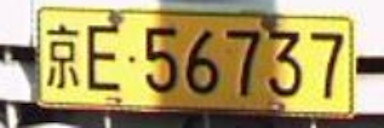
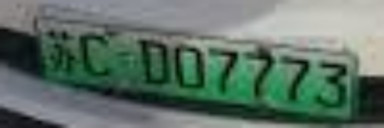
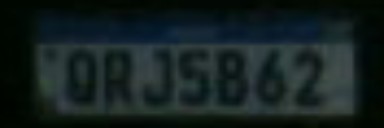
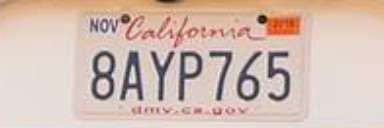
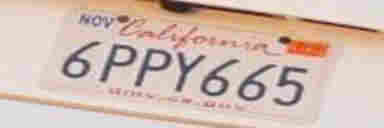
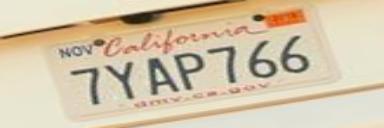
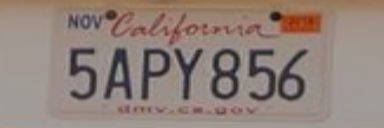
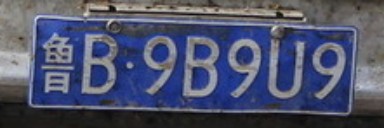
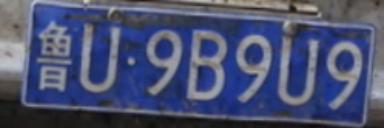
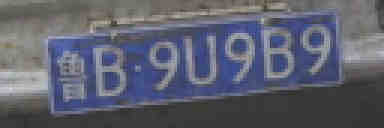
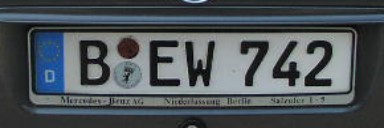
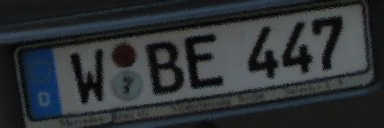
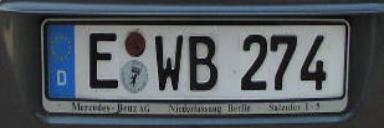
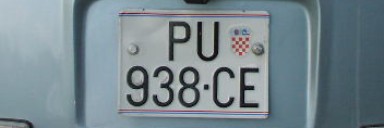
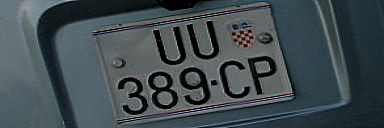
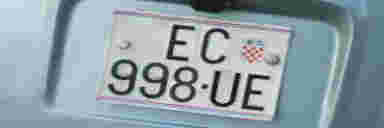
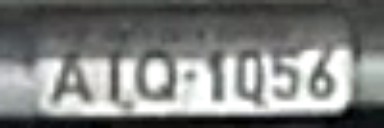
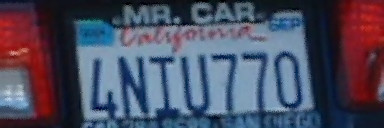
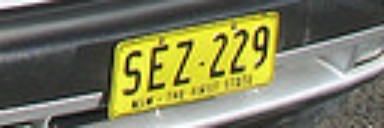
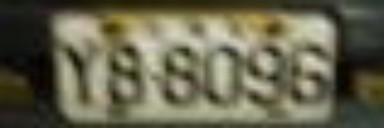
The diversity of LP layouts across the selected datasets is depicted in Fig. 2, revealing considerable variations even among LPs from the same region. For instance, the EnglishLP and OpenALPR-EU datasets, both collected in Europe, include images of LPs with notable distinctions in colors, aspect ratios, symbols (e.g., coats of arms), and the number of characters. Furthermore, certain datasets encompass LPs with two rows of characters, shadows, tilted orientations, and at relatively low spatial resolutions.


We explored various data augmentation techniques to ensure a balanced distribution of training images across different datasets. These techniques include random cropping, the introduction of random shadows, grayscale conversion, and random perturbations of hue, saturation, and brightness. Additionally, to counteract the propensity of recognition models to memorize sequence patterns encountered during training [10, 46, 8], we generated many synthetic LP images by shuffling the character positions on each LP (using the labels provided in [22]). Examples of these generated images are shown in Fig. 3.


3.3 Fusion Approaches
This study examines three primary approaches to combine the outputs of multiple recognition models. The first approach involves selecting the sequence predicted with the Highest Confidence (HC) value as the final prediction, even if only one model predicts it. The second approach employs the Majority Vote (MV) rule to aggregate the sequences predicted by the different models. In other words, the final prediction is the sequence predicted by the largest number of models, disregarding the confidence values associated with each prediction. Lastly, the third approach follows a similar Majority Vote rule but performs individual aggregation for each Character Position (MVCP). To illustrate, the characters predicted in the first position are analyzed separately, and the character predicted the most times is selected. The same process is then applied to each subsequent character position until the last one. Ultimately, the selected characters are concatenated to form the final string.
One concern that arises when employing majority vote-based strategies is the potential occurrence of a tie. Let’s consider a scenario where an LP image is processed by five recognition models. Two models predict “ABC-123,” two models predict “ABC-124,” and the remaining model predicts “ABC-125.” In this case, a tie occurs between “ABC-123” and “ABC-124.” To address this, we assess two tie-breaking approaches for each majority vote strategy: (i) selecting the prediction made with the highest confidence among the tied predictions as the final one, and (ii) selecting the prediction made by the “best model” as the final prediction. In this study, for simplicity, we consider the best model the one that performs best individually across all datasets. However, in a more practical scenario, the chosen model could be the one known to perform best in the specific implementation scenario (e.g., one model may be the most robust for recognizing tilted LPs while another model may excel at handling low-resolution or noisy images). We use the acronym MV–HC to refer to the majority vote approach in which ties are broken by selecting the prediction made with the highest confidence value. Similarly, MV–BM refers to the majority vote approach in which ties are resolved by choosing the prediction made by the best model. The MVCP approaches follow a similar naming convention (MVCP–HC and MVCP–BM).
It is important to mention that when conducting fusion based on the highest confidence, we consider the confidence values derived directly from the models’ outputs, even though some of them tend to make overconfident predictions. We carried out several experiments in which we normalized the confidence values of different models before fusing them, using various strategies such as weighted normalization based on the average confidence of each classifier’s predictions. Somewhat surprisingly, these attempts did not yield improved results.
3.4 Performance Evaluation
In line with the standard practice in the literature, we report the performance of each experiment by calculating the ratio of correctly recognized LPs to the total number of LPs in the test set. An LP is considered correctly recognized only if all the characters on the LP are accurately identified, as even a single incorrectly recognized character can lead to the misidentification of the vehicle.
It is important to note that, although this work focuses on the LPR stage, the LP images used as input for the recognition models were not directly cropped from the ground truth. Instead, the YOLOv4 model [3] was employed to detect the LPs. This approach allows for a more accurate simulation of real-world scenarios, considering the imperfect nature of LP detection and the reduced robustness of certain recognition models when faced with imprecisely detected LP regions [10, 26]. As in [19], the results obtained using YOLOv4 were highly satisfactory. Considering detections with an Intersection over Union (IoU) as correct, YOLOv4 achieved an average recall rate exceeding % in the test sets of the datasets used for training and validation, and % in the cross-dataset experiments. In both cases, the precision rates obtained were greater than %.
4 Results
Table 3 shows the recognition rates obtained on the disjoint test sets of the eight datasets used for training and validating the models. It presents the results reached by each model individually, as well as the outcomes achieved through the fusion strategies outlined in Section 3.3. To improve clarity, Table 3 only includes the best results attained through model fusion. For a detailed breakdown of the results achieved by combining the outputs from the top to the top recognition models, refer to Table 4. The ranking of the models was determined based on their mean performance across the datasets (the ranking on the validation set was essentially the same, with only two models swapping positions).
|
|
|
|
|
|
|
|
Average | |||||||||||||||||
| CR-NET [37] | 97.8% | % | 100.0% | 97.5% | % | 97.5% | % | %† | % | ||||||||||||||||
| CRNN [34] | % | % | % | % | % | % | % | % | % | ||||||||||||||||
| Fast-OCR [23] | % | 97.1% | 100.0% | 97.5% | % | % | % | %† | % | ||||||||||||||||
| GRCNN [42] | % | % | % | % | % | % | % | % | % | ||||||||||||||||
| Holistic-CNN [39] | % | % | % | % | % | % | % | % | % | ||||||||||||||||
| Multi-Task-LR [11] | % | % | % | % | % | % | % | % | % | ||||||||||||||||
| R2AM [25] | % | % | % | % | % | % | % | % | % | ||||||||||||||||
| RARE [35] | % | % | % | % | % | % | % | % | % | ||||||||||||||||
| Rosetta [4] | % | % | % | % | % | % | % | % | % | ||||||||||||||||
| STAR-Net [28] | % | % | % | % | % | % | % | % | % | ||||||||||||||||
| TRBA [2] | % | % | % | % | % | % | % | % | % | ||||||||||||||||
| ViTSTR-Base [1] | % | % | % | % | 99.4% | % | 89.7% | 95.6% | 92.4% | ||||||||||||||||
| \cdashline1-10 | |||||||||||||||||||||||||
| \cdashline1-10 | |||||||||||||||||||||||||
| Fusion HC (top 6) | 97.8% | % | % | 98.1% | % | % | % | % | % | ||||||||||||||||
| Fusion MV–BM (top 8) | 97.8% | 97.1% | 100.0% | 98.1% | 99.7% | % | % | % | % | ||||||||||||||||
| Fusion MV–HC (top 8) | 97.8% | 97.1% | 100.0% | 98.1% | 99.7% | % | % | 96.5% | 97.6% | ||||||||||||||||
| Fusion MVCP–BM (top 9) | % | % | 100.0% | 98.1% | % | % | 92.8% | % | % | ||||||||||||||||
| Fusion MVCP–HC (top 9) | 97.8% | % | 100.0% | 98.1% | % | 99.3% | % | % | % | ||||||||||||||||
|
† Images from the RodoSol-ALPR dataset were not used for training the CR-NET and Fast-OCR models, as each character’s bounding box needs to be labeled for training them. |
|||||||||||||||||||||||||
| Models | HC | MV–BM | MV–HC | MVCP–BM | MVCP–HC |
|---|---|---|---|---|---|
| Top (ViTSTR-Base) | 92.4% | % | % | % | % |
| Top (+ STAR-Net) | % | % | % | % | % |
| Top (+ TRBA) | % | % | % | % | % |
| Top (+ CR-NET) | % | % | % | % | % |
| Top (+ RARE) | % | % | % | % | % |
| Top (+ Fast-OCR) | 96.0% | % | % | % | % |
| Top (+ Rosetta) | % | % | % | % | % |
| Top (+ Holistic-CNN) | % | 97.5% | 97.6% | % | % |
| Top (+ GRCNN) | % | % | % | 97.2% | 97.5% |
| Top (+ R2AM) | % | % | % | % | % |
| Top (+ CRNN) | % | % | % | % | % |
| Top (+ Multi-Task-LR) | % | % | % | % | % |
Upon analyzing the results presented in Table 3, it becomes evident that model fusion has yielded substantial improvements. Specifically, the highest average recognition rate increased from % (ViTSTR-Base) to % by combining the outputs of multiple recognition models (MV–HC). While each model individually obtained recognition rates below % for at least two datasets (three on average), all fusion strategies surpassed the % threshold across all datasets. Remarkably, in most cases, fusion led to recognition rates exceeding %.
The significance of conducting experiments on multiple datasets becomes apparent as we observe that the best overall model (ViTSTR-Base) did not achieve the top result in five of the eight datasets. Notably, it exhibited relatively poor performance on the Caltech Cars, EnglishLP, and UCSD-Stills datasets. We attribute this to two primary reasons: (i) these datasets are older, containing fewer training images, which seems to impact certain models more than others (as explained in Section 3.2, we exploited data augmentation techniques to mitigate this issue); and (ii) these datasets were collected in the United States and Europe, regions known for having a higher degree of variability in LP layouts compared to the regions where the other datasets were collected (specifically, Brazil, mainland China, and Taiwan). It is worth noting that we included these datasets in our experimental setup, despite their limited number of images, precisely because they provide an opportunity to uncover such valuable insights.
Basically, by analyzing the results reported for each dataset individually, we observe that combining the outputs of multiple models does not necessarily lead to significantly improved performance compared to the best model in the ensemble. Instead, it reduces the likelihood of obtaining poor performance. This phenomenon arises because diverse models tend to make different errors for each sample, but generally concur on correct classifications [32]. Illustrated in Fig. 4 are predictions made by multiple models and the MV–HC fusion strategy on various LP images. It is remarkable that model fusion can produce accurate predictions even in cases where most models exhibit prediction errors. To clarify, with the MV–HC approach, this occurs when each incorrect sequence is predicted fewer times than the correct one, or in the case of a tie, the correct sequence is predicted with higher confidence.


Shifting our attention back to Table 4, we note that the majority vote-based strategies yielded comparable results, with the sequence-level approach (MV) performing marginally better for a given number of combined models. Our analysis indicates that this difference arises in cases where a model predicts one character more or one character less, impacting the majority vote by character position (MVCP) approach relatively more. Conversely, selecting the prediction with the highest confidence (HC) consistently led to inferior results. This can be attributed to the general tendency of all models to make incorrect predictions also with high confidence, as demonstrated in Fig. 4.
A growing number of authors [46, 24, 19, 43] have stressed the importance of also evaluating LPR models in a cross-dataset fashion, as it more accurately simulates real-world scenarios where new cameras are regularly being deployed in new locations without existing systems being retrained as often. Taking this into account, we present in Section 4 the results obtained on four distinct datasets, none of which were used during the training of the models444To train the models, we excluded the few images from the ChineseLP dataset that are also found in CLPD (both datasets include internet-sourced images [20]).. These particular datasets are commonly employed for this purpose [50, 22, 6, 38, 18].
|
|
|
|
Average | |||||||||
|---|---|---|---|---|---|---|---|---|---|---|---|---|---|
| CR-NET [37] | % | % | % | % | % | ||||||||
| CRNN [34] | % | % | % | % | % | ||||||||
| Fast-OCR [23] | 97.2% | 99.2% | 59.6% | 94.4% | 87.6% | ||||||||
| GRCNN [42] | % | % | % | % | % | ||||||||
| Holistic-CNN [39] | % | % | % | % | % | ||||||||
| Multi-Task-LR [11] | % | % | % | % | % | ||||||||
| R2AM [25] | % | % | % | % | % | ||||||||
| RARE [35] | % | % | % | % | % | ||||||||
| Rosetta [4] | % | % | % | % | % | ||||||||
| STAR-Net [28] | 97.2% | % | % | % | % | ||||||||
| TRBA [2] | % | % | % | % | % | ||||||||
| ViTSTR-Base [1] | % | % | % | % | % | ||||||||
| \cdashline1-6 | |||||||||||||
| \cdashline1-6 | |||||||||||||
| Fusion HC (top 6) | % | % | % | % | % | ||||||||
| Fusion MV–BM (top 8) | 99.1% | 99.7% | 65.4% | 97.0% | 90.3% | ||||||||
| Fusion MV–HC (top 8) | 99.1% | 99.7% | 65.4% | % | % | ||||||||
| Fusion MVCP–BM (top 9) | % | 99.7% | % | % | % | ||||||||
| Fusion MVCP–HC (top 9) | % | 99.7% | % | % | % |
These experiments provide further support for the findings presented earlier in this section. Specifically, both strategies that rely on a majority vote at the sequence level (MV–BM and MV–HC) outperformed the others significantly; the most notable performance gap was observed in the CD-HARD dataset, known for its challenges due to the predominance of heavily tilted LPs and the wide variety of LP layouts (as shown in Fig. 2). Interestingly, in this cross-dataset scenario, the MV–BM strategy exhibited slightly superior performance compared to MV–HC. Surprisingly, the HC approach failed to yield any improvements in results on any dataset, indicating that the models made errors with high confidence even on LP images extracted from datasets that were not part of their training.
While our primary focus lies on investigating the improvements in recognition rates achieved through model fusion, it is also pertinent to examine its impact on runtime. Naturally, certain applications might favor combining fewer models to attain a moderate improvement in recognition while minimizing the increase in the system’s running time. With this in mind, Table 6 presents the number of frames per second (FPS) processed by each model independently and when incorporated into the ensemble. In addition to combining the models based on their average recognition rate across the datasets, as done in the rest of this section, we also explore combining them based on their processing speed.
| Models (ranked by accuracy) | MV–HC | Individual | Fusion | |||||||
|---|---|---|---|---|---|---|---|---|---|---|
| Time | FPS | Time | FPS | |||||||
| Top (ViTSTR-Base) | % | |||||||||
| Top (+ STAR-Net) | % | |||||||||
| Top (+ TRBA) | % | |||||||||
| Top (+ CR-NET) | % | |||||||||
| Top (+ RARE) | % | |||||||||
| Top (+ Fast-OCR) | % | |||||||||
| Top (+ Rosetta) | % | |||||||||
| Top (+ Holistic-CNN) | % | |||||||||
| Top (+ GRCNN) | % | |||||||||
| Top (+ R2AM) | % | |||||||||
| Top (+ CRNN) | % | |||||||||
| Top (+ Multi-Task-LR) | % | |||||||||
| Models (ranked by speed) | MV–HC | Individual | Fusion | |||||||
|---|---|---|---|---|---|---|---|---|---|---|
| Time | FPS | Time | FPS | |||||||
| Top (Multi-Task-LR) | % | |||||||||
| Top (+ Holistic-CNN) | % | |||||||||
| Top (+ CRNN) | % | |||||||||
| Top (+ Fast-OCR) | % | |||||||||
| Top (+ Rosetta) | % | |||||||||
| Top (+ CR-NET) | % | |||||||||
| Top (+ STAR-Net) | % | |||||||||
| Top (+ ViTSTR-Base) | % | |||||||||
| Top (+ GRCNN) | % | |||||||||
| Top (+ RARE) | % | |||||||||
| Top (+ R2AM) | % | |||||||||
| Top (+ TRBA) | % | |||||||||
Remarkably, fusing the outputs of the three fastest models results in a lower recognition rate (%) than using the best model alone (%). Nevertheless, as more methods are included in the ensemble, the gap reduces considerably. From this observation, we can infer that if attaining the utmost recognition rate across various scenarios is not imperative, it becomes more advantageous to combine fewer but faster models, as long as they perform satisfactorily individually. According to Table 6, combining – fast models appears to be the optimal choice for striking a better balance between speed and accuracy.
5 Conclusions
This paper examined the potential improvements in LPR results by fusing the outputs from multiple recognition models. Distinguishing itself from prior studies, our research explored a wide range of models and datasets in the experiments. We combined the outputs of different models through straightforward approaches such as selecting the most confident prediction or through majority vote (both at sequence and character levels), demonstrating the substantial benefits of fusion approaches in both intra- and cross-dataset experimental setups.
In the traditional intra-dataset setup, where we explored eight datasets, the mean recognition rate experienced a significant boost, rising from % achieved by the best model individually to % when leveraging model fusion. Essentially, we demonstrate that fusing multiple models reduces considerably the likelihood of obtaining subpar performance on a particular dataset. In the more challenging cross-dataset setup, where we explored four datasets, the mean recognition rate increased from % to rates surpassing %. Notably, the optimal fusion approach in both setups was via a majority vote at the sequence level.
We also conducted an evaluation to analyze the speed/accuracy trade-off in the final approach by varying the number of models included in the ensemble. For this assessment, we ranked the models in two distinct ways: one based on their recognition results and the other based on their efficiency. The findings led us to conclude that for applications where the recognition task can tolerate some additional time, though not excessively, an effective strategy is to combine – fast models. Employing this approach significantly enhances the recognition results while maintaining the system’s efficiency at an acceptable level.
ACKNOWLEDGMENTS
We thank the support of NVIDIA Corporation with the donation of the Quadro RTX GPU used for this research.
References
- [1] Atienza, R.: Vision transformer for fast and efficient scene text recognition. In: International Conference on Document Analysis and Recognition. pp. 319–334 (2021)
- [2] Baek, J., et al.: What is wrong with scene text recognition model comparisons? Dataset and model analysis. In: IEEE/CVF International Conference on Computer Vision (ICCV). pp. 4714–4722 (2019)
- [3] Bochkovskiy, A., Wang, C.Y., Liao, H.Y.M.: YOLOv4: Optimal speed and accuracy of object detection. arXiv preprint arXiv:2004.10934. pp. 1–14 (2020)
- [4] Borisyuk, F., Gordo, A., Sivakumar, V.: Rosetta: Large scale system for text detection and recognition in images. In: ACM SIGKDD International Conference on Knowledge Discovery & Data Mining. p. 71–79 (2018)
- [5] Dlagnekov, L.: UCSD/Calit2 car license plate, make and model database. https://www.belongielab.org/car_data.html (2005)
- [6] Fan, X., Zhao, W.: Improving robustness of license plates automatic recognition in natural scenes. IEEE Transactions on Intelligent Transportation Systems. 23(10), 18845–18854 (2022)
- [7] Gao, Y., et al.: GroupPlate: Toward multi-category license plate recognition. IEEE Transactions on Intelligent Transportation Systems. 24(5), 5586–5599 (2023)
- [8] Garcia-Bordils, S., et al.: Out-of-vocabulary challenge report. In: European Conference on Computer Vision, TiE: Text in Everything Workshop. pp. 1–17 (2022)
- [9] Gonçalves, G.R., Silva, S.P.G., Menotti, D., Schwartz, W.R.: Benchmark for license plate character segmentation. Journal of Electronic Imaging. 25(5), 053034 (2016)
- [10] Gonçalves, G.R., et al.: Real-time automatic license plate recognition through deep multi-task networks. In: Conference on Graphics, Patterns and Images (SIBGRAPI). pp. 110–117 (Oct 2018)
- [11] Gonçalves, G.R., et al.: Multi-task learning for low-resolution license plate recognition. In: Iberoamerican Congress on Pattern Recognition. pp. 251–261 (Oct 2019)
- [12] Gong, Y., Deng, L., Tao, S., Lu, X., Wu, P., Xie, Z., Ma, Z., Xie, M.: Unified Chinese license plate detection and recognition with high efficiency. Journal of Visual Communication and Image Representation. 86, 103541 (2022)
- [13] Henry, C., Ahn, S.Y., Lee, S.: Multinational license plate recognition using generalized character sequence detection. IEEE Access. 8, 35185–35199 (2020)
- [14] Hsu, G.S., Ambikapathi, A., Chung, S.L., Su, C.P.: Robust license plate detection in the wild. In: IEEE International Conference on Advanced Video and Signal Based Surveillance (AVSS). pp. 1–6 (Aug 2017)
- [15] Hsu, G.S., Chen, J.C., Chung, Y.Z.: Application-oriented license plate recognition. IEEE Transactions on Vehicular Technology. 62(2), 552–561 (2013)
- [16] Izidio, D.M.F., et al.: An embedded automatic license plate recognition system using deep learning. Design Automation for Embedded Systems. 24(1), 23–43 (2020)
- [17] Kabiraj, A., Pal, D., Ganguly, D., Chatterjee, K., Roy, S.: Number plate recognition from enhanced super-resolution using generative adversarial network. Multimedia Tools and Applications. 82(9), 13837–13853 (2023)
- [18] Ke, X., Zeng, G., Guo, W.: An ultra-fast automatic license plate recognition approach for unconstrained scenarios. IEEE Transactions on Intelligent Transportation Systems. 24(5), 5172–5185 (2023)
- [19] Laroca, R., Cardoso, E.V., Lucio, D.R., Estevam, V., Menotti, D.: On the cross-dataset generalization in license plate recognition. In: International Conference on Computer Vision Theory and Applications (VISAPP). pp. 166–178 (Feb 2022)
- [20] Laroca, R., Estevam, V., Britto Jr., A.S., Minetto, R., Menotti, D.: Do we train on test data? The impact of near-duplicates on license plate recognition. In: International Joint Conference on Neural Networks (IJCNN). pp. 1–8 (June 2023)
- [21] Laroca, R., Severo, E., Zanlorensi, L.A., Oliveira, L.S., et al.: A robust real-time automatic license plate recognition based on the YOLO detector. In: International Joint Conference on Neural Networks (IJCNN). pp. 1–10 (July 2018)
- [22] Laroca, R., Zanlorensi, L., Gonçalves, G., Todt, E., Schwartz, W., Menotti, D.: An efficient and layout-independent automatic license plate recognition system based on the YOLO detector. IET Intelligent Transport Systems. 15(4), 483–503 (2021)
- [23] Laroca, R., et al.: Towards image-based automatic meter reading in unconstrained scenarios: A robust and efficient approach. IEEE Access. 9, 67569–67584 (2021)
- [24] Laroca, R., et al.: A first look at dataset bias in license plate recognition. In: Conference on Graphics, Patterns and Images (SIBGRAPI). pp. 234–239 (2022)
- [25] Lee, C., Osindero, S.: Recursive recurrent nets with attention modeling for OCR in the wild. In: IEEE/CVF Conference on Computer Vision and Pattern Recognition (CVPR). pp. 2231–2239 (June 2016)
- [26] Lee, Y., et al.: License plate detection via information maximization. IEEE Transactions on Intelligent Transportation Systems. 23(9), 14908–14921 (2022)
- [27] Liu, Q., Chen, S.L., Li, Z.J., Yang, C., Chen, F., Yin, X.C.: Fast recognition for multidirectional and multi-type license plates with 2D spatial attention. In: Intl. Conference on Document Analysis and Recognition (ICDAR). pp. 125–139 (2021)
- [28] Liu, W., Chen, C., Kwan-Yee K. Wong, Z.S., Han, J.: STAR-Net: A spatial attention residue network for scene text recognition. In: British Machine Vision Conference (BMVC). pp. 1–13 (Sept 2016)
- [29] Mokayed, H., Shivakumara, P., Woon, H.H., Kankanhalli, M., Lu, T., Pal, U.: A new DCT-PCM method for license plate number detection in drone images. Pattern Recognition Letters. 148, 45–53 (2021)
- [30] Nascimento, V., et al.: Super-resolution of license plate images using attention modules and sub-pixel convolution layers. Computers & Graphics. 113, 69–76 (2023)
- [31] OpenALPR: OpenALPR-EU dataset. https://github.com/openalpr/benchmarks/tree/master/endtoend/eu (2016)
- [32] Polikar, R.: Ensemble learning. Ensemble Machine Learning: Methods and Applications. Springer New York. pp. 1–34 (2012)
- [33] Schirrmacher, F., Lorch, B., Maier, A., Riess, C.: Benchmarking probabilistic deep learning methods for license plate recognition. IEEE Transactions on Intelligent Transportation Systems. 24(9), 9203–9216 (2023)
- [34] Shi, B., Bai, X., Yao, C.: An end-to-end trainable neural network for image-based sequence recognition and its application to scene text recognition. IEEE Transactions on Pattern Analysis and Machine Intelligence. 39(11), 2298–2304 (2017)
- [35] Shi, B., Wang, X., Lyu, P., Yao, C., Bai, X.: Robust scene text recognition with automatic rectification. In: IEEE/CVF Conference on Computer Vision and Pattern Recognition (CVPR). pp. 4168–4176 (June 2016)
- [36] Silva, S.M., Jung, C.R.: License plate detection and recognition in unconstrained scenarios. In: European Conf. on Computer Vision (ECCV). pp. 593–609 (2018)
- [37] Silva, S.M., Jung, C.R.: Real-time license plate detection and recognition using deep convolutional neural networks. Journal of Visual Communication and Image Representation. p. 102773 (2020)
- [38] Silva, S.M., Jung, C.R.: A flexible approach for automatic license plate recognition in unconstrained scenarios. IEEE Transactions on Intelligent Transportation Systems. 23(6), 5693–5703 (2022)
- [39] Špaňhel, J., et al.: Holistic recognition of low quality license plates by CNN using track annotated data. In: IEEE International Conference on Advanced Video and Signal Based Surveillance (AVSS). pp. 1–6 (Aug 2017)
- [40] Srebrić, V.: EnglishLP database. https://www.zemris.fer.hr/projects/LicensePlates/english/baza_slika.zip (2003)
- [41] Terven, J., Cordova-Esparza, D.: A comprehensive review of YOLO: From YOLOv1 and beyond. arXiv preprint arXiv:2304.00501. pp. 1–33 (2023)
- [42] Wang, J., Hu, X.: Gated recurrent convolution neural network for OCR. In: Intl. Conf. on Neural Information Processing Systems (NeurIPS). p. 334–343 (2017)
- [43] Wang, Y., Bian, Z.P., Zhou, Y., Chau, L.P.: Rethinking and designing a high-performing automatic license plate recognition approach. IEEE Transactions on Intelligent Transportation Systems. 23(7), 8868–8880 (2022)
- [44] Weber, M.: Caltech Cars. https://data.caltech.edu/records/20084 (1999)
- [45] Yuan, Y., Zou, W., Zhao, Y., Wang, X., Hu, X., Komodakis, N.: A robust and efficient approach to license plate detection. IEEE Transactions on Image Processing. 26(3), 1102–1114 (2017)
- [46] Zeni, L.F., Jung, C.R.: Weakly supervised character detection for license plate recognition. In: Conference on Graphics, Patterns and Images. pp. 218–225 (2020)
- [47] Zhang, L., Wang, P., Li, H., Li, Z., Shen, C., Zhang, Y.: A robust attentional framework for license plate recognition in the wild. IEEE Transactions on Intelligent Transportation Systems. 22(11), 6967–6976 (2021)
- [48] Zhang, M., Liu, W., Ma, H.: Joint license plate super-resolution and recognition in one multi-task GAN framework. In: IEEE International Conference on Acoustics, Speech and Signal Processing (ICASSP). pp. 1443–1447 (April 2018)
- [49] Zhou, W., et al.: Principal visual word discovery for automatic license plate detection. IEEE Transactions on Image Processing. 21(9), 4269–4279 (2012)
- [50] Zou, Y., Zhang, Y., Yan, J., Jiang, X., Huang, T., Fan, H., Cui, Z.: A robust license plate recognition model based on Bi-LSTM. IEEE Access. 8, 211630–211641 (2020)