Past the outer rim, into the unknown: structures beyond the Kuiper Cliff
Abstract
Although the present-day orbital distribution of minor bodies that go around the Sun between the orbit of Neptune and the Kuiper Cliff is well understood, past 50 au from the Sun, our vision gets blurred as objects become fainter and fainter and their orbital periods span several centuries. Deep imaging using the largest telescopes can overcome the first issue but the problems derived from the second one are better addressed using data analysis techniques. Here, we make use of the heliocentric range and range-rate of the known Kuiper belt objects and their uncertainties to identify structures in orbital parameter space beyond the Kuiper Cliff. The distribution in heliocentric range there closely resembles that of the outer main asteroid belt with a gap at 70 au that may signal the existence of a dynamical analogue of the Jupiter family comets. Outliers in the distribution of mutual nodal distances suggest that a massive perturber is present beyond the heliopause.
keywords:
methods: data analysis – celestial mechanics – minor planets, asteroids: general – Kuiper belt: general.1 Introduction
The Solar system beyond Neptune was a great unknown when (134340) Pluto 1930 BM was discovered by C. W. Tombaugh (Aitken, 1930). It was soon suggested that a population of bodies in Pluto-like orbits existed beyond Neptune (Leonard, 1930) and this hypothesis was independently explored by several authors (see e.g. Edgeworth 1943, 1949; Kuiper 1951; Cameron 1962, 1978; Whipple 1964, 1972; Fernandez 1980). The credibility of this conjecture was confirmed numerically by Duncan, Quinn, & Tremaine (1988), but the observational proof had to wait until 1992 when the second member of this population, (15760) Albion 1992 QB1 was found (Jewitt, Luu, & Marsden, 1992; Jewitt & Luu, 1993).
Three decades and thousands of discoveries later, our understanding of the organization of the Solar system beyond the orbit of Neptune is satisfactory when we consider the classical Edgeworth-Kuiper belt (see e.g. Morbidelli & Nesvorný 2020). But beyond 50 au from the Sun, there is a statistically significant decrease in the number density of observed objects (see e.g. Chiang & Brown 1999), the so-called Kuiper Cliff, whose origin remains elusive, although its reality is supported by the data (see e.g. Gladman & Volk 2021). Here, we present an alternative approach for identifying structures beyond the Kuiper Cliff that instead of orbits uses the heliocentric range, , and range-rate, , of the known Kuiper belt objects together with their respective uncertainties, and , from a given epoch. This Letter is organized as follows. In Section 2, we present the data and data analysis tools used. The latest data available on the edge of the known Solar system are reviewed in Section 3. The convenience of the analysis of heliocentric range and range-rate data is discussed and assessed in Section 4. Section 5 focuses on what can be learned from the best sample. Our results are discussed in Section 6 and our conclusions are summarized in Section 7.
2 Data and tools
In this work, we use ephemerides computed by Jet Propulsion Laboratory’s (JPL) Horizons on-line solar system data and ephemeris computation service111https://ssd.jpl.nasa.gov/?horizons (Giorgini, 2015) that utilises the new DE440/441 general-purpose planetary solution (Park et al., 2021). Data queries were made via the Python package Astroquery (Ginsburg et al., 2019). Our input data sample was retrieved from JPL’s Small-Body Database (SBDB).222https://ssd.jpl.nasa.gov/sbdb.cgi It includes all the 4474 objects (as of 30-Aug-2023) in the trans-Neptunian object orbit class (semimajor axis, au). The data collected are referred to the standard epoch JD 2460200.5 (2023-Sep-13.0) TDB (Barycentric Dynamical Time, J2000.0 ecliptic and equinox). Statistical analyses were carried out using NumPy (van der Walt, Colbert & Varoquaux, 2011; Harris et al., 2020) and Astropy (Astropy Collaboration et al., 2013, 2018), and visualized using the Matplotlib library (Hunter, 2007). Histograms use a bin width computed by applying the Freedman-Diaconis rule (Freedman & Diaconis, 1981), i.e. , where IQR is the interquartile range and is the number of data points. The distant nature of relevant objects was confirmed statistically using the software discussed by Bernstein & Khushalani (2000).
3 The edge of the known Solar system
The local interstellar medium starts at the heliopause, 120 au from the Sun (see e.g. Kurth et al. 2023), where there is a sharp transition from a hot and tenuous solar wind to a colder, denser interstellar plasma. Until recently, the Solar system beyond 100 au from the Sun was exclusively studied using data provided by interplanetary probes like Voyager 1 and 2 (see e.g. Kurth & Gurnett 2020; Burlaga et al. 2021; Gurnett et al. 2021; Meyer-Vernet et al. 2022). The 100 au barrier was finally broken in 2018 and four minor bodies have so far been found around the heliopause and beyond (see Table 1). Distant Solar system bodies are identified through their motion against the background sky. Objects detected at nearly 100 au from the Sun show a maximum observable apparent motion of about 33″ d-1 and those located farther away have progressively lower apparent rates of motion (all due to parallax, see e.g. Jewitt 1999).
| Object | 3 | 3 | ||||
|---|---|---|---|---|---|---|
| (au) | (au) | (km s-1) | (km s-1) | (au) | (au) | |
| 2018 AG37 | 132 | 8 | 0.1 | 9.1 | 80 | 4 |
| 2018 VG18 | 123.73 | 0.05 | 0.28 | 0.02 | 81.96 | 0.03 |
| 2020 BE102 | 110.7 | 0.9 | 0.7 | 1.7 | 75 | 5 |
| 2020 MK53 | 160 | 66917 | 0.04 | 105589 | 111 | 21051 |
The current record holder is 2020 MK53 found by New Horizons KBO Search-Subaru (Peltier et al., 2022). For this object, the software discussed in Bernstein & Khushalani (2000) applied to the available data (six observations spanning three days at =26 mag) gives a barycentric distance of 1564 au and the latest JPL’s Horizons ephemerides give 16022306 au (2460200.5 JD TDB) as the uncertainty grows exponentially over time for short data arcs. In general and for distant objects, the few observations in the short arc constrain the distance from the observer (topocentric range) and the radial velocity (topocentric range-rate) but for objects as distant as the heliopause, topocentric, geocentric, heliocentric and barycentric ranges and range-rates are affected by very similar uncertainties.
Oldroyd & Trujillo (2021) studied the orbital distribution of the objects that populate the outer Solar system and argued that there is a gap in perihelion distance that separates two populations, the extreme trans-Neptunian objects (ETNOs, Trujillo & Sheppard 2014) and the inner Oort Cloud objects (IOCOs, Hills 1981; Levison, Dones & Duncan 2001). These authors predict that such a gap may be located at 50–65 au but their conclusions are based on a very small sample and numerical simulations. This is consistent with early results discussed by Fraser et al. (2023), see their fig. 2.
4 Orbit versus range and range-rate
The orbit determinations of distant objects based on data arcs shorter than about a year are very unreliable and their associated uncertainties could be very large (often per cent). However, their geocentric, heliocentric or barycentric distances estimated for an epoch chosen between the dates of their first and last observation could be uncertain by a few percent as pointed out above for the extreme case of 2020 MK53. This relatively small uncertainty grows rapidly for predictions outside the timeframe defined by the available data arc.
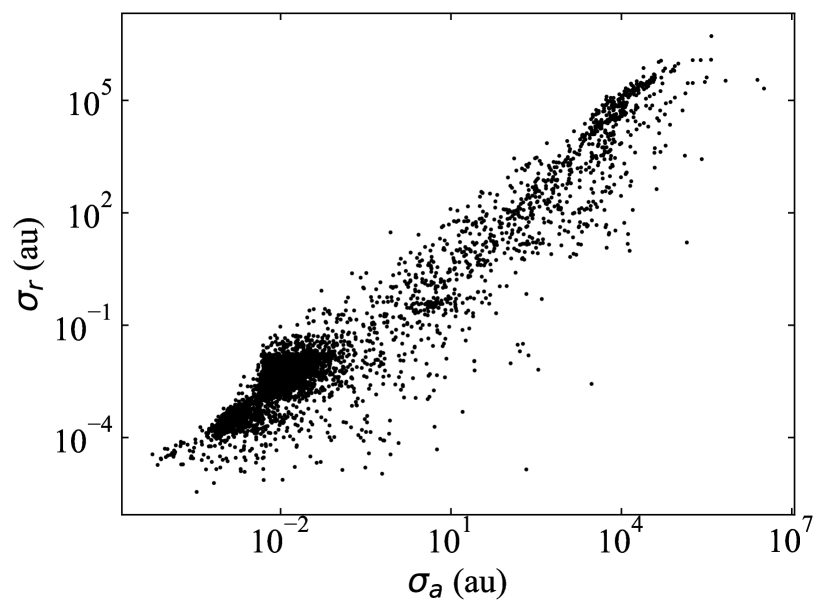
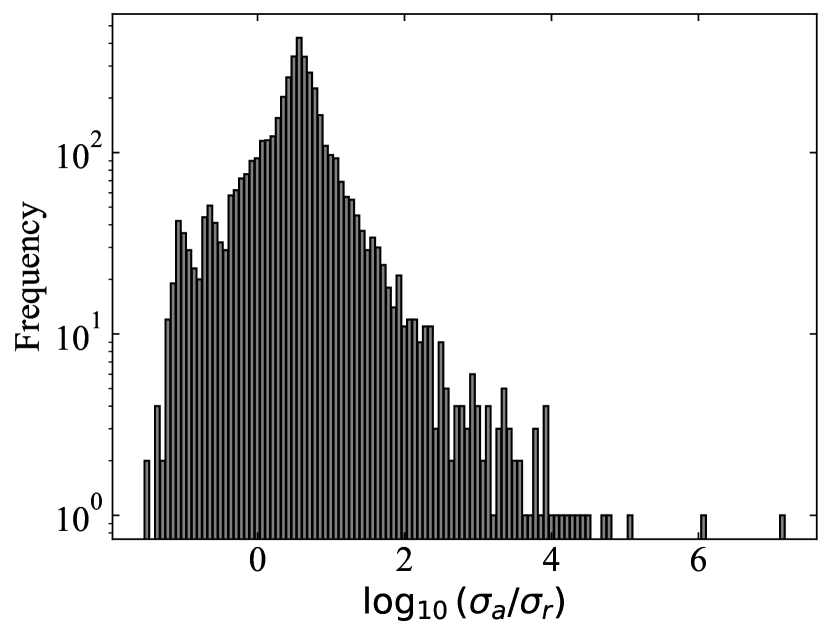
An object located at 100 au from the Sun moving with radial velocity under 1 km s-1 can travel au in three years, although the nominal uncertainty of could be in the hundreds or thousands of au. This means that the predicted nominal heliocentric range is probably not too far from the real value even for objects with relatively short data arcs. Our working hypothesis, that heliocentric range and range-rate can provide usable information when orbit determinations cannot, can be tested using the available data. Figure 1 shows an example for the particular case of the semimajor axis, , and its uncertainty, , and confirms that our hypothesis is correct as , even for an epoch (JD 2460200.5 TDB) some years outside the available data arc. Therefore, and can be used with confidence to investigate the presence of structures beyond the Kuiper Cliff.
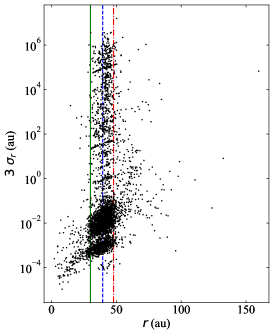
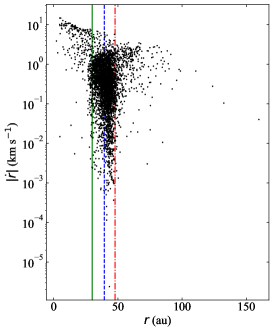
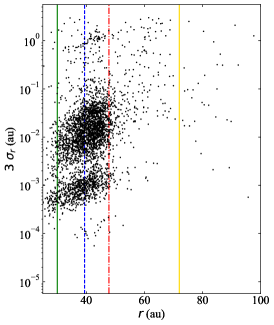
The relevant ephemerides of the input sample are plotted in Fig. 2. The left-hand side panel shows how the uncertainty in heliocentric range changes as a function of the range. In addition to the conspicuous Kuiper Cliff (the 1:2 mean-motion resonance with Neptune at 47.8 au, see Trujillo & Brown 2001), we observe bands of objects (somewhat inclined with respect to the -axis) with different levels of predicted nominal uncertainty for those minor bodies that revolve around the Sun between the orbit of Neptune and the Cliff. Beyond this region, we observe less data points with larger uncertainties.
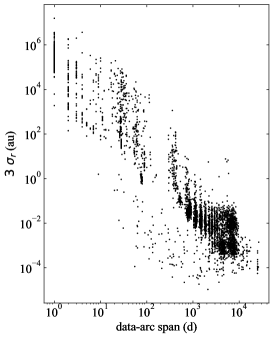
The origin of the uncertainty bands for radial distances in the range 30–50 au in the left-hand side panel becomes apparent in the central panel, where the uncertainty in heliocentric range is plotted as a function of the data-arc span. Objects with orbit determinations based on short data arcs have larger uncertainties in range. The bands (vertical in the central panel and slightly inclined in the left-hand side panel) are likely the result of the different observing cadences and recovery strategies of the various surveys contributing data.
Considering our previous arguments on the relatively small errors associated to range and range-rate for times close or within the data arc, the figure suggests that objects with very uncertain radial distances (top of the left-hand side panel) tend to keep their nominal values within the boundaries 30.0 au to 47.8 au as their observational data arcs grow longer and the uncertainties decrease. For a new discovery, the usual trend, derived from the left-hand side and the central panels of Fig. 2, is to move vertically downwards in the diagram that shows the uncertainty in heliocentric range as a function of the value of the range. If this strictly observational tendency is valid in the interval (30, 50) au, there are no reasons to believe that for heliocentric distances au the evolution has to be different.
The right-hand side panel of Fig. 2 shows the absolute values of the associated radial velocities as a function of the radial distance. Such values get close to zero at aphelion and perihelion. In a Keplerian disc of particles, a gap is expected to appear at a radial distance if a significant number of particles reaches apocentre at and another significant fraction reaches pericentre at . Gaps also appear linked to peculiar populations in eccentric orbits like that of asteroids dynamically similar to Jupiter Family Comets (JFCs, see e.g. Gundlach & Blum 2016).
5 Results based on the best sample
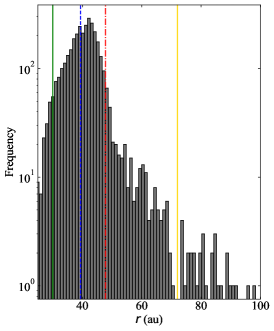
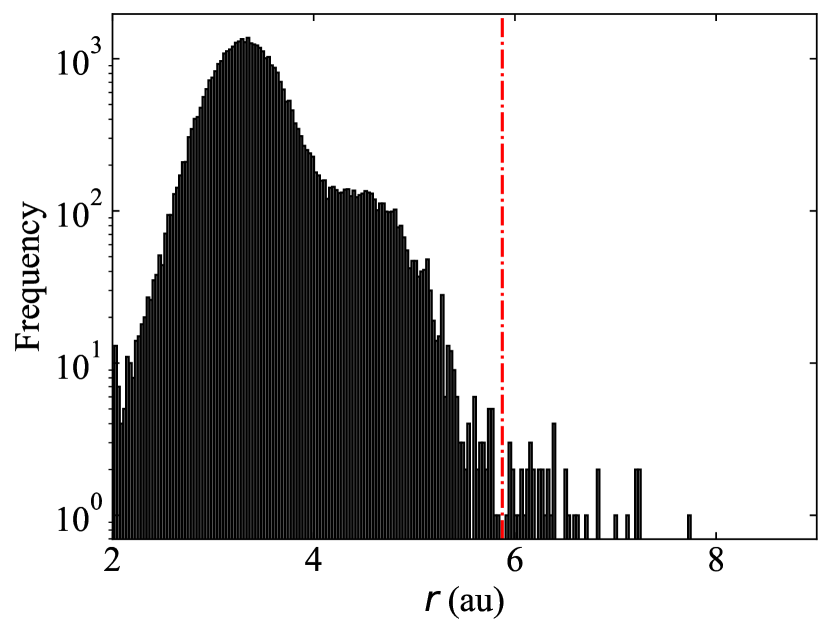
If we consider the subsample with au that includes 3595 objects and repeat the analysis carried out in Section 4, we obtain Fig. 3. It shows a conspicuous gap around 70 au (golden vertical line at 72 au). Considering Poisson statistics (=) to compute uncertainties — applying the approximation given by Gehrels (1986) when 21, — we obtain a statistical significance close to 2 for this gap. The significance is similar for the full sample. Figure 3, central panel, shows that at both sides of the gap there is a trend for the absolute value of the heliocentric range-rate to decrease (orange dashed vertical lines at 66 au and 76 au). Although the statistical effect is only marginally significant, its overall properties are consistent with those of a real gap.
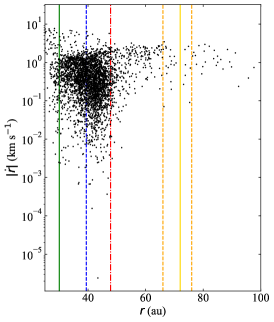
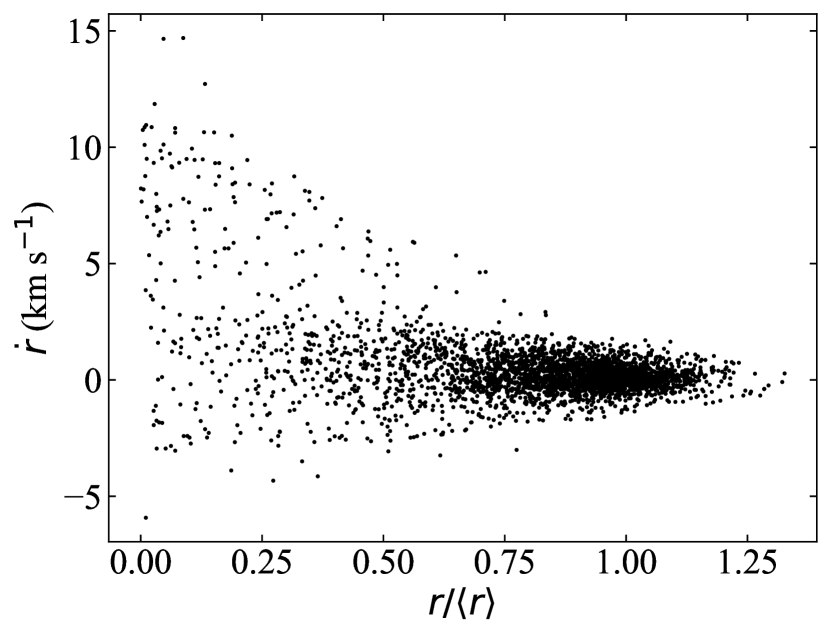
For an elliptic orbit, the averaged distance over an orbital period is given by . If we represent the heliocentric range-rate of the best sample as a function of the range divided by (see Fig. 4), we observe that most objects are currently located at although a certain fraction is probably close to aphelion as their heliocentric range-rates are small. In other words, the sample is not entirely biased towards objects at perihelion and probes the entire range under study. Unfortunately, nearly all these objects at aphelion are relatively recent discoveries (2016 onwards) with short data arcs. The group with range-rate above 3 km s-1 is made of objects in eccentric orbits observed near perihelion.
6 Discussion
The radial distribution of trans-Neptunian objects was studied before; for example, Trujillo & Brown (2001) found an outer edge for the belt at 471 au but the data they analysed could not reject the presence of a second belt beyond 76 au. In general terms, our results confirm theirs. The tail of the distribution in Fig. 3, right-hand side panel, shows signs of orbital substructure that, in principle, may also be attributed to observational biases and/or lack of completeness. The only other well-studied structure that may help in understanding the nature of the apparent gap at 70 au is the outer main asteroid belt that is shaped by Jupiter via close encounters, mean-motion and secular resonances, and by secular resonances with Saturn.
Figure 5 shows that the tails of the heliocentric range distributions of trans-Neptunian objects and outer main-belt asteroids are not too dissimilar. Objects beyond the gap observed in Fig. 5 close to 6 au — red dot-dashed vertical line signalling the 5:6 mean-motion resonance with Jupiter at 5.875 au, see panel c in fig. 7 of Gallardo (2006) — are asteroids with comet-like orbits333https://physics.ucf.edu/yfernandez/lowtj.html analogues to those of JFCs. Figure 5 shows that the Kuiper Cliff is not dramatically different from the feature observed in the outer main-belt. A separate issue is the mechanism responsible for the observed tail of the distribution. As Jupiter is the main perturber of the JFCs, Neptune might be responsible for the gap at 70 au, but panel f in fig. 7 of Gallardo (2006) suggests otherwise. In addition, both 90377 Sedna (2003 VB12) and 2012 VP113, two widely regarded IOCOs, have perihelia beyond the gap. Two additional objects with rather poor orbit determinations also have nominal perihelia beyond the gap: 2019 EE6, a retrograde ETNO, and 2020 MJ53, a nominal low-eccentricity, low-inclination object. Only these four have au.
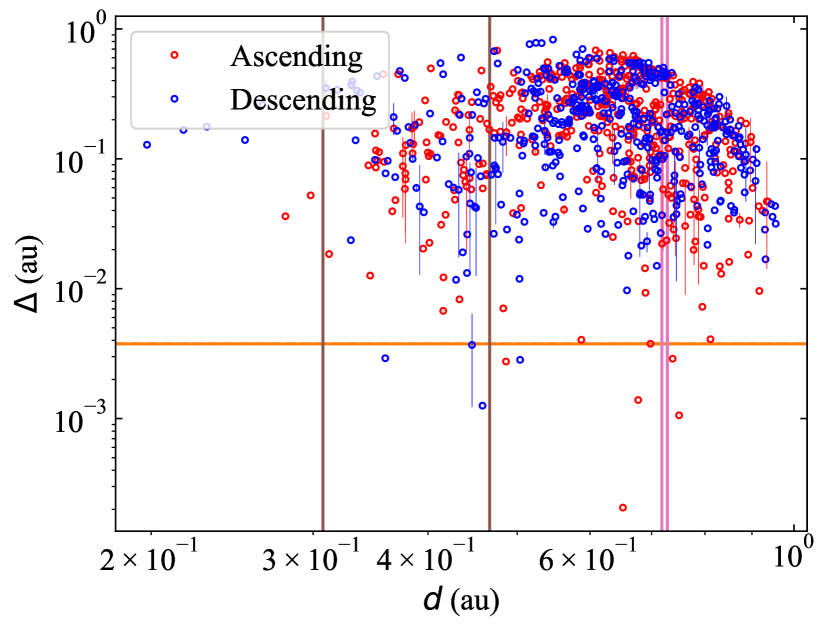
Gaps can also be induced by a massive perturber located beyond the gap. Our result is somewhat consistent with the conclusions in Oldroyd & Trujillo (2021). The existence of a moderately massive planet in the neighbourhood of, but beyond, the feature identified by our analysis has been proposed multiple times (see e.g. Brunini & Melita 2002; Gladman et al. 2002; Lykawka & Mukai 2008; Whitmire 2016; Volk & Malhotra 2017; Lykawka & Ito 2023). But how strong is the evidence for the presence of such a perturber? An unexpected supporting argument comes from the analysis of the distribution of mutual nodal distances of the Atiras, a population of asteroids with aphelia inside the orbit of Earth. The mutual nodal distances of two objects can be computed using eqs. 16 and 17 in Saillenfest et al. (2017). A small mutual nodal distance may signal a pair of fragments of a larger body or the components of a disrupted binary. Close encounters with planets may lead to fragmentation events and binary disruptions. Figure 6 shows the distribution of mutual nodal distances for the 465 pairs defined by the 31 known Atiras. The shortest nodal distances are strongly correlated with the regions occupied by Venus (pink vertical bars) and Mercury (in brown).
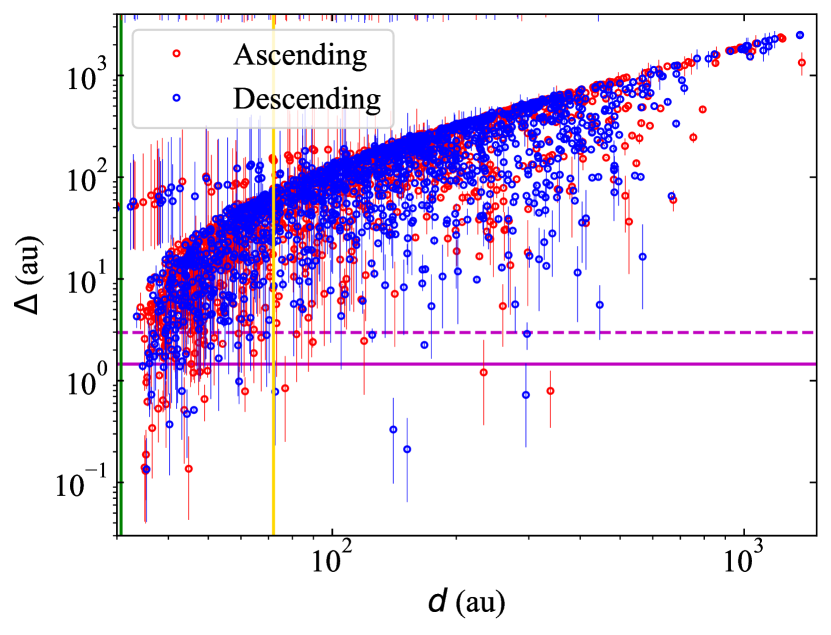
Performing the same analysis for the ETNOs — with perihelion distances, au and au as defined by Trujillo & Sheppard (2014) — we obtain Fig. 7, which is an updated version of the ones in de la Fuente Marcos & de la Fuente Marcos (2021) and de la Fuente Marcos & de la Fuente Marcos (2022), and includes 56 objects and 1540 pairs. Neglecting the short nodal distances close to perihelion, the shortest set of distances is found in the interval of barycentric distances (100, 400) au. Binaries are likely dominant beyond Neptune (Fraser et al., 2017) and wide binaries can be disrupted following encounters with a massive perturber (de la Fuente Marcos, de la Fuente Marcos & Aarseth, 2017). Observational evidence of this process may have already been uncovered by de León, de la Fuente Marcos & de la Fuente Marcos (2017). If the pairs with unusually short mutual nodal distances are the result of a planetary encounter, Fig. 7 signals the likely region inhabited by the perturber.
7 Conclusions
In this Letter, we applied a methodology that uses the heliocentric range and range-rate of the known Kuiper belt objects and their uncertainties to identify structures beyond the Kuiper Cliff. This approach is more reliable than those based on the orbital elements because the uncertainties in heliocentric range and range-rate are smaller than those of orbital parameters like the semimajor axis. We show that the distribution in heliocentric range beyond the Kuiper Cliff resembles that of the outer main asteroid belt and exhibits a gap at 70 au that might be caused by Neptune but also by the combined action of external perturbers. The analysis of the outliers in the distribution of mutual nodal distances of the ETNOs suggests that a massive perturber is present beyond the heliopause.
Acknowledgements
We thank the anonymous referee for a constructive, helpful and timely report, S. J. Aarseth, J. de León, J. Licandro, A. Cabrera-Lavers, J.-M. Petit, M. T. Bannister, D. P. Whitmire, G. Carraro, E. Costa, D. Fabrycky, A. V. Tutukov, S. Mashchenko, S. Deen, and J. Higley for comments on ETNOs, and A. I. Gómez de Castro for providing access to computing facilities. This work was partially supported by the Spanish ‘Agencia Estatal de Investigación (Ministerio de Ciencia e Innovación)’ under grant PID2020-116726RB-I00 /AEI/10.13039/501100011033. In preparation of this Letter, we made use of the NASA Astrophysics Data System, the ASTRO-PH e-print server, and the MPC data server.
Data Availability
The data underlying this paper were accessed from JPL’s Horizons (https://ssd.jpl.nasa.gov/?horizons). The derived data generated in this research will be shared on reasonable request to the corresponding author.
References
- Aitken (1930) Aitken R. G., 1930, PASP, 42, 105
- Astropy Collaboration et al. (2013) Astropy Collaboration et al., 2013, A&A, 558, A33
- Astropy Collaboration et al. (2018) Astropy Collaboration et al., 2018, AJ, 156, 123
- Bernstein & Khushalani (2000) Bernstein G., Khushalani B., 2000, AJ, 120, 3323
- Brunini & Melita (2002) Brunini A., Melita M. D., 2002, Icarus, 160, 32
- Burlaga et al. (2021) Burlaga L. F., Kurth W. S., Gurnett D. A., Berdichevsky D. B., Jian L. K., Ness N. F., Park J., et al., 2021, ApJ, 911, 61
- Cameron (1962) Cameron A. G. W., 1962, Icarus, 1, 13
- Cameron (1978) Cameron A. G. W., 1978, M&P, 18, 5
- Chiang & Brown (1999) Chiang E. I., Brown M. E., 1999, AJ, 118, 1411
- de la Fuente Marcos & de la Fuente Marcos (2021) de la Fuente Marcos C., de la Fuente Marcos R., 2021, MNRAS, 506, 633
- de la Fuente Marcos & de la Fuente Marcos (2022) de la Fuente Marcos C., de la Fuente Marcos R., 2022, MNRAS, 512, L6
- de la Fuente Marcos, de la Fuente Marcos & Aarseth (2017) de la Fuente Marcos C., de la Fuente Marcos R., Aarseth S. J., 2017, Ap&SS, 362
- de León, de la Fuente Marcos & de la Fuente Marcos (2017) de León J., de la Fuente Marcos C., de la Fuente Marcos R., 2017, MNRAS, 467, L66
- Duncan, Quinn, & Tremaine (1988) Duncan M., Quinn T., Tremaine S., 1988, ApJ, 328, L69
- Edgeworth (1943) Edgeworth K. E., 1943, JBAA, 53, 181
- Edgeworth (1949) Edgeworth K. E., 1949, MNRAS, 109, 600
- Fernandez (1980) Fernandez J. A., 1980, MNRAS, 192, 481
- Fraser et al. (2017) Fraser W. C., Bannister M. T., Pike R. E., Marsset M., Schwamb M. E., Kavelaars J. J., Lacerda P., et al., 2017, NatAs, 1, 0088
- Fraser et al. (2023) Fraser W. C., Porter S. B., Lin H. W., Napier K., Spencer R. J., Kavelaars J., Verbiscer A. J., et al., 2023, LPICo, 2806, 2361
- Freedman & Diaconis (1981) Freedman D., Diaconis P., 1981, Z. Wahrscheinlichkeitstheor. verwandte Geb., 57, 453
- Gallardo (2006) Gallardo T., 2006, Icarus, 184, 29
- Gehrels (1986) Gehrels N., 1986, ApJ, 303, 336
- Ginsburg et al. (2019) Ginsburg A. et al., 2019, AJ, 157, 98
- Giorgini (2015) Giorgini J. D., 2015, IAU General Assembly, Meeting #29, 22, 2256293
- Gladman et al. (2002) Gladman B., Holman M., Grav T., Kavelaars J., Nicholson P., Aksnes K., Petit J.-M., 2002, Icarus, 157, 269
- Gladman & Volk (2021) Gladman B., Volk K., 2021, ARA&A, 59, 203
- Gundlach & Blum (2016) Gundlach B., Blum J., 2016, A&A, 589, A111
- Gurnett et al. (2021) Gurnett D. A., Kurth W. S., Burlaga L. F., Berdichevsky D. B., Pogorelov N. V., Pulupa M., Bale S. D., 2021, ApJ, 921, 62
- Harris et al. (2020) Harris C. R. et al., 2020, Nature, 585, 357
- Hills (1981) Hills J. G., 1981, AJ, 86, 1730
- Hunter (2007) Hunter J. D., 2007, CSE, 9, 90
- Jewitt (1999) Jewitt D., 1999, AREPS, 27, 287
- Jewitt & Luu (1993) Jewitt D., Luu J., 1993, Nature, 362, 73
- Jewitt, Luu, & Marsden (1992) Jewitt D., Luu J., Marsden B. G., 1992, IAUC, 5611
- Kuiper (1951) Kuiper G. P., 1951, in Hynek J. A., ed., Proceedings of a topical symposium, commemorating the 50th anniversary of the Yerkes Observatory and half a century of progress in astrophysics, McGraw-Hill, New York, p. 357
- Kurth & Gurnett (2020) Kurth W. S., Gurnett D. A., 2020, ApJ, 900, L1
- Kurth et al. (2023) Kurth W. S., Burlaga L. F., Kim T., Pogorelov N. V., Granroth L. J., 2023, ApJ, 951, 71
- Leonard (1930) Leonard F. C., 1930, ASPL, 1, 121
- Levison, Dones & Duncan (2001) Levison H. F., Dones L., Duncan M. J., 2001, AJ, 121, 2253
- Lykawka & Mukai (2008) Lykawka P. S., Mukai T., 2008, AJ, 135, 1161
- Lykawka & Ito (2023) Lykawka P. S., Ito T., 2023, AJ, 166, 118
- Meyer-Vernet et al. (2022) Meyer-Vernet N., Lecacheux A., Issautier K., Moncuquet M., 2022, A&A, 658, L12
- Morbidelli & Nesvorný (2020) Morbidelli A., Nesvorný D., 2020, in Prialnik D., Barucci M. A., Young L., eds, The Trans-Neptunian Solar System. Elsevier, Amsterdam, Netherlands, pp 25–59
- Oldroyd & Trujillo (2021) Oldroyd W. J., Trujillo C. A., 2021, AJ, 162, 39
- Park et al. (2021) Park R. S., Folkner W. M., Williams J. G., Boggs D. H., 2021, AJ, 161, 105
- Peltier et al. (2022) Peltier L., Kavelaars J., Fraser W., Porter S., Lawler S., The New Horizons Team, 2022, DPS, 54, 501.09
- Saillenfest et al. (2017) Saillenfest M., Fouchard M., Tommei G., Valsecchi G. B., 2017, Celest. Mech. Dyn. Astron., 129, 329
- Sheppard et al. (2018) Sheppard S. S., Trujillo C. A., Oldroyd W. J., Tholen D. J., Williams G. V., 2018, MPEC, 2018-Y14
- Sheppard, Tholen & Trujillo (2020) Sheppard S. S., Tholen D. J., Trujillo C. A., 2020, MPEC, 2020-A128
- Sheppard et al. (2021) Sheppard S. S., Tholen D. J., Trujillo C. A., 2021, MPEC, 2021-C187
- Sheppard et al. (2022) Sheppard S. S., Trujillo C. A., Oldroyd W. J., Chandler C., Tholen D. J., 2022, MPEC, 2022-K172
- Trujillo & Brown (2001) Trujillo C. A., Brown M. E., 2001, ApJ, 554, L95
- Trujillo & Sheppard (2014) Trujillo C. A., Sheppard S. S., 2014, Nature, 507, 471
- van der Walt, Colbert & Varoquaux (2011) van der Walt S., Colbert S. C., Varoquaux G., 2011, CSE, 13, 22
- Volk & Malhotra (2017) Volk K., Malhotra R., 2017, AJ, 154, 62
- Whipple (1964) Whipple F. L., 1964, PNAS, 51, 711
- Whipple (1972) Whipple F. L., 1972, IAUS, 45, 401
- Whitmire (2016) Whitmire D. P., 2016, MNRAS, 455, L114