Neutrinos and gamma-rays from Galaxy Clusters constrained by the upper limits of IceCube
Abstract
Clusters of galaxies possess the capability to accelerate cosmic rays (CRs) to very high energy up to eV due to their large size and magnetic field strength which favor CR confinement for cosmological times. During their confinement, they can produce neutrinos and rays out of interactions with the background gas and photon fields. In recent work, Hussain et al. (2021, 2023) have conducted three-dimensional cosmological magnetohydrodynamical (MHD) simulations of the turbulent intracluster medium (ICM) combined with multi-dimensional Monte Carlo simulations of CR propagation for redshifts ranging from to to study the multi-messenger emission from these sources. They found that when CRs with a spectral index in the range and cutoff energy eV are injected into the system, they make significant contributions to the diffuse background emission of both neutrinos and gamma-rays. In this work, we have revisited this model and undertaken further constraints on the parametric space. This was achieved by incorporating the recently established upper limits on neutrino emission from galaxy clusters, as obtained by the IceCube experiment. We find that for CRs injected with spectral indices in the range , cutoff energy eV, and power corresponding to of the cluster luminosity, our neutrino flux aligns with the upper limits estimated by IceCube. Additionally, the resulting contribution from clusters to the diffuse -ray background (DGRB) remains significant with values of the order of at energies above GeV.
1 Introduction
The diffuse neutrino (Aartsen et al., 2015a) and gamma ray (Ackermann et al., 2015) backgrounds provide a unique prospective of the high-energy Universe but their origin is still debated. It is closely related with ultra-high-energy cosmic rays (UHECRs) (Abu-Zayyad et al., 2013; Aab et al., 2017). The most plausible scenario is that the neutrino and gamma-rays are produced by interactions of UHECRs with the background gas and photon fields in astrophysical environments. Several sources embedded in galaxy clusters arise as candidates for the production of very high energy CRs including active galactic nuclei and starburst galaxies. The turbulent intracluster medium (ICM) is also believed to be particularly suitable to accelerate and confine CRs up to energies eV (Inoue et al., 2007; Wiener & Zweibel, 2019; Alves Batista et al., 2019).
Recently, the IceCube collaboration (Abbasi et al., 2022) performed a stacking analysis for galaxy clusters of masses and up to redshift taken from the PLANCK survey (Ade et al., 2016). To complete the catalogue, they calculated the distribution of galaxy clusters by drawing samples with mass range extending to redshift , using the Tinker halo mass function (Tinker et al., 2010). Based on these samples, they estimated upper limits according to which the contribution from the clusters to the observed diffuse neutrino background is at most at 100 TeV for the most realistic scenario (see for details Raghunathan et al., 2022).
Several recent studies (see e.g., Murase et al., 2013; Fang & Olinto, 2016; Fang & Murase, 2018; Hussain et al., 2021, 2023) have predicted that clusters of galaxies can contribute to a sizeable percentage to the diffuse neutrino and ray background. In particular, Hussain et al. (2021, 2023) used the most detailed numerical approach to date combining three-dimensional (3D) cosmological magneto-hydro-dynamic (MHD) simulations with Monte-Carlo simulations of CR propagation and cascading and predicted that clusters can potentially contribute to a fairly large fraction to the diffuse neutrino and gamma-ray background observed by IceCube (Aartsen et al., 2015a) and Fermi-LAT (Ackermann et al., 2015), respectively. However, the aforementioned upper limit reported by the IceCube (Abbasi et al., 2022) excludes part of the parametric space they considered in their analysis of the neutrino flux.
In this work, we constrain the parametric space considered in Hussain et al. (2021, 2023) employing the latest upper limits reported by the IceCube for the neutrino flux of galaxy clusters and derive new limits to the diffuse ray flux. We find that these new constraints eliminate the harder CR spectral indices , but still predict a substantial contribution from the clusters to the very high energy range of the ray flux.
2 Methodology
We have employed here the same set of simulations as in Hussain et al. (2021, 2023). The ICM was modeled with 3D-MHD cosmological simulations (Dolag et al., 2005) up to redshift taking into account the non-uniform distribution evolution of the magnetic field, gas density, and temperature. CRs were proppagated in the ICM and intergalactic medium (IGM) to produce neutrinos and rays, employing the Monte Carlo code CRpropa (Batista et al., 2016). To calculate the neutrino flux CRs were injected in the energy range because we are interested in neutrino energies above TeV. On the other hand, for rays, since we are interested in energies above GeV, CRs were injected with energies . However, in order to normalize the total energy to the luminosity of the clusters, it was considered the whole energy range starting from GeV. Also, in order to account for different sources of acceleration, CRs were injected at different locations within the clusters: in the center, at a radius kpc, and in the outskirt Mpc. Obviously, the dominant contribution to ray and neutrino fluxes come from CRs sources located in the center (see Hussain et al., 2021, 2023, for details). In these previous studies, it has been considered that of the cluster luminosity () goes to the CRs.
The simulations have two steps. In the first step, CRs are propagated inside the clusters and rays and neutrinos are collected at the edge of them. All relevant CR interactions were considered during their propagation inside clusters, namely, proton-proton (pp) interactions, photopion production, Bethe-Heitler pair production, pair production, and inverse Compton scattering (ICS). Energy losses due to the expansion of the universe and the synchrotron emission were also considered, but the photons produced in these processes are below the energy range of interest of this work. In the second step, the rays collected at the boundary of the clusters were propagated through the intergalactic medium (IGM) across the redshift interval. During this propagation, the electromagnetic cascade processes including (single, double, and triplet) pair production and ICS were also accounted for. The effect of the IGM magnetic field was neglected in this propagation step since it does not significantly affect the ray flux above GeV (Hussain et al., 2023).
As in Hussain et al. (2021) and Hussain et al. (2023), the integrated neutrino and ray fluxes () from all clusters in the mass range and , are obtained from:
| (1) |
where is the number of clusters per mass interval calculated from the MHD simulation, accounts for the interactions of gamma rays in the ICM and the IGM, is a function that describes the cosmological evolution of the emissivity of the CR sources (see e.g., Alves Batista et al., 2019), the quantity denotes the neutrino or ray power spectrum obtained from the simulations, is the luminosity distance, and is a factor that accounts for stellar and AGN feedback (Planelles et al., 2014). For detailed calculations, we refer to Hussain et al. (2023) and Hussain et al. (2021).
3 Results
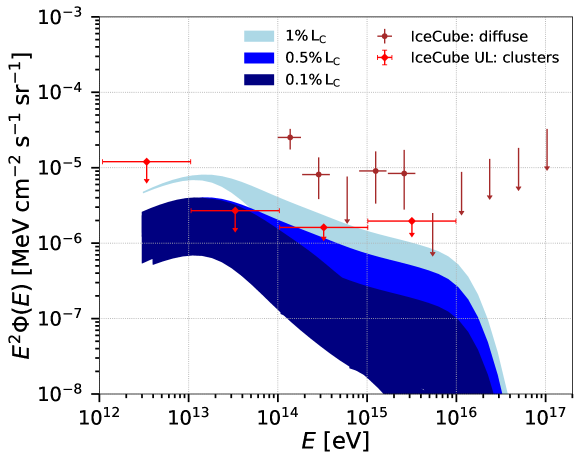
In Fig. 1, we show the flux of neutrinos from clusters of galaxies, considering that their contribution is constrained by the upper limits recently reported by the IceCube (Abbasi et al., 2022). As stressed, in the previous works Hussain et al. (2021, 2023) had assumed that of each cluster luminosity () goes to CRs, and considered a range for the CR spectral index and maximum energy . Here, we find that the CR parameters which are more suitable to fulfill the new IceCube limits are the following: , eV, and luminosities in the range . The figure shows three bands all constrained by this interval of values, but with three different luminosities , and , from light to dark-blue, respectively. Also, while the light-blue and blue bands have eV, the dark-blue band shows the flux for in the range eV. In each of these bands, the larger the value of the index , the smaller the flux is. We see that the band with is the most constrained one by the IceCube limits. In particular, for , this band falls entirely below the IceCube limits. Also, decreasing the value of results in larger flux at smaller neutrino energies. This explains why the light-blue and blue bands produce fluxes around or below the IceCube limits only for eV. For eV, the peak of the flux in the figure increases by almost an order of magnitude at neutrino energies eV.
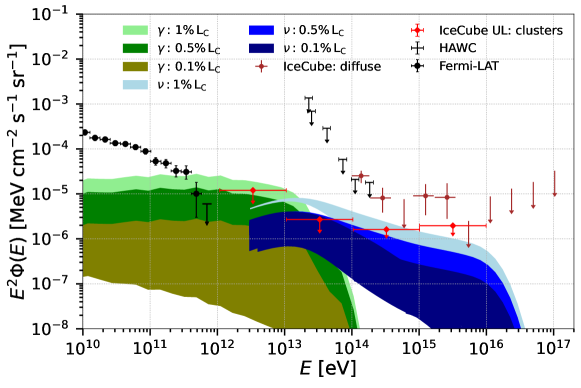
Fig. 2 summarizes our results showing both the ray and the neutrino fluxes for the same parameters of Fig. 1. Besides the IceCube upper limits for clusters and diffuse neutrino background, it also depicts the diffuse ray background (DGRB) data from Fermi-LAT (Ackermann et al., 2015) and the upper limits from HAWC (Albert et al., 2022). The ray flux is given by the light-green, dark-green and olive-green bands, which are the counterparts of the light-blue, blue and dark-blue neutrino bands, respectively. We see that the olive-green, which is the most constrained band by the upper limits of the IceCube, falls below the Fermi data for rays.
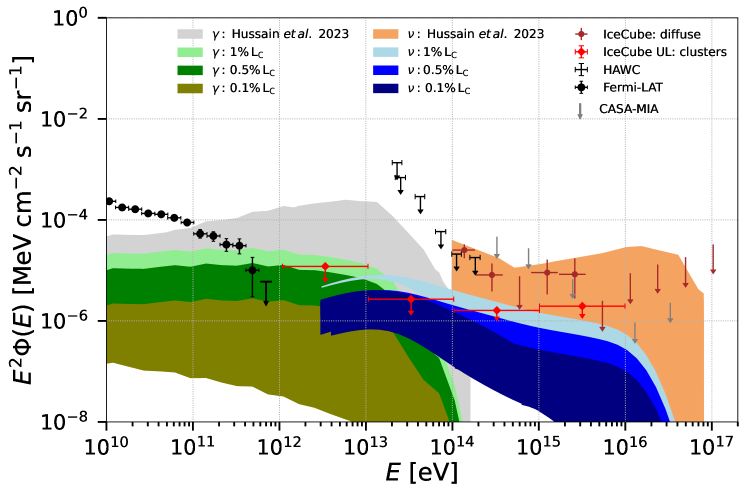
In Figure 3 we compare the results obtained in Fig. 2 with the earlier results of (Hussain et al., 2021) and (Hussain et al., 2023). We note that the parametric space considered in these works cannot be excluded entirely by the upper limits of the IceCube (Abbasi et al., 2022).
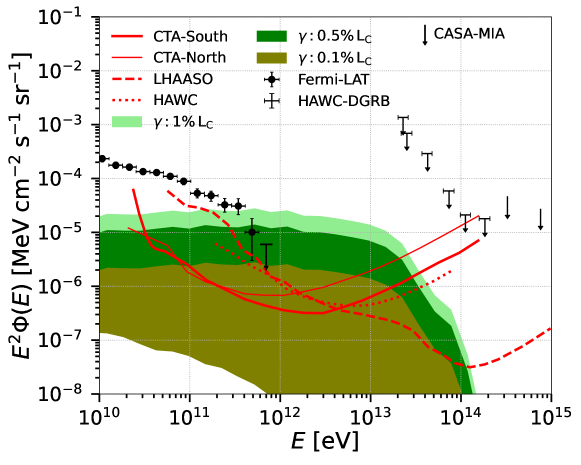
In Fig. 4, we show the constrained ray flux obtained in figure 2 for the entire population of clusters compared with sensitivity curves of different experiments. It includes the sensitivity curves for point-like sources from the High Altitude Water Cherenkov Observatory (HAWC) (Abeysekara et al., 2013), Large High Altitude Air Shower Observatory (LHASSO) (Lhaaso Collaboration et al., 2016), and the forthcoming Cherenkov Telescope Array (CTA) (CTA Consortium et al., 2018), as well as the upper limits for the DGRB from HAWC (Albert et al., 2022) and CASA-MIA (Chantell et al., 1997b) experiments (see also Hussain et al., 2023). Clearly, these observatories can potentially observe very high energy rays from the clusters.
4 Discussion and Conclusions
We have computed the flux of neutrinos and rays from the entire population of galaxy clusters using the most detailed numerical simulations to date, considering 3D-MHD cosmological simulations of galaxy clusters up to redshift , as in Hussain et al. (2021, 2023). According to these authors, clusters can contribute to a sizeable percentage of up to to diffuse neutrino background, depending on the parameters adopted for the CR spectrum. However, the IceCube collaboration (Abbasi et al., 2022) has reported that this contribution cannot exceed . Evaluating upper limits for the neutrino flux of the clusters, this collaboration concluded that these new constraints would exclude the Hussain et al. (2021) models for hard CR spectral indices . Our present results indicate that, in fact, the new Icecube limits point to harder spectral indices . Nevertheless, these new results are entirely compatible with the parametric space explored in Hussain et al. (2021), which also included values of (see Figure 3).
In particular, for and eV the neutrino flux obtained in (Hussain et al., 2021) is below the upper-limits of the IceCube and decreases approximately by an order of magnitude if we assume CR luminosity instead of .
We have also computed the ray flux constrained by these IceCube upper limits and found that it decreases by roughly an order of magnitude in comparison with Hussain et al. (2023), for CR luminosity . Despite that, the contribution of clusters to the DGRB is still substantial above GeV (Figure 3). Moreover, the flux falls within the sensitivity ranges of the HAWC, LHAASO, and the upcoming CTA observatories, suggesting the possibility for direct detections of rays from clusters of galaxies (Figure 4). As in the case of the neutrinos, the ray flux goes for values lower than the Fermi-LAT observations (Ackermann et al., 2015) for , and reduces even more, if we consider a CR luminosity , rather than . While discrete source categories such as AGNs (Di Mauro et al., 2013; Ajello et al., 2015) and star-forming galaxies (Roth et al., 2021) can make an important contribution to the DGRB for energy levels below the TeV range, our results highlight that the combined gamma-ray flux originating from clusters can surpass the combined impact of individual classes of unresolved sources for energies exceeding GeV. This aligns with the findings of Hussain et al. (2023).
We should emphasize that our aim here was not to fit either IceCube upper limits (Abbasi et al., 2022) or Fermi-LAT data (Ackermann et al., 2015). Instead, we have only compared our evaluation of the integrated flux of neutrinos and rays for the entire population of clusters with those observations. Our estimations are dependent on the parametric space and so does the IceCube results. To obtain their upper-limits, Abbasi et al. (2022) considered sources with masses in the range up to redshift . Our analysis, on the other hand, has considered the entire mass range of clusters , and redshifts . Though major contribution to neutrino and ray background comes from the nearby sources (), and more massive clusters are more frequent, the contribution from clusters in the mass range is not negligible (Hussain et al., 2021, 2023). Therefore, including this mass interval might change the upper limits estimated by IceCube (Abbasi et al., 2022).
Finally, we would like to stress that some specific parameters may have the potential to influence our simulations. For instance, a mixed composition of cosmic rays (CRs) and the distribution of CR sources within the clusters could lead to variations in our results. If we were to consider a CR composition involving heavy elements like iron (Fe), it could potentially alter our conclusions. Similarly, slight adjustments in the assumed distributions of CR sources within the structures (see Section 2) might also have an impact on our outcomes. Exploring further these effects is a direction we plan to pursue in the future. Furthermore, it is worth noting that we have not accounted for the influence of the uncertain diffuse magnetic field outside the clusters, which could introduce further minor variations in the gamma-ray observations.
References
- Aab et al. (2017) Aab, A., Abreu, P., Aglietta, M., et al. 2017, Journal of Cosmology and Astroparticle Physics, 2017, 038
- Aartsen et al. (2015a) Aartsen, M., Ackermann, M., Adams, J., et al. 2015a, Astroparticle physics, 66, 39
- Aartsen et al. (2015b) Aartsen, M. G., Abraham, K., Ackermann, M., et al. 2015b, Physical review letters, 115, 081102
- Abbasi et al. (2022) Abbasi, R., Ackermann, M., Adams, J., et al. 2022, Astrophysical Journal Letters, 938, L11
- Abeysekara et al. (2013) Abeysekara, A., Alfaro, R., Alvarez, C., et al. 2013, Astroparticle Physics, 50, 26
- Abu-Zayyad et al. (2013) Abu-Zayyad, T., Aida, R., Allen, M., et al. 2013, The Astrophysical Journal Letters, 768, L1
- Ackermann et al. (2015) Ackermann, M., Ajello, M., Albert, A., et al. 2015, Astrophysical Journal, 799, 86
- Ade et al. (2016) Ade, P., Aghanim, N., Arnaud, M., et al. 2016, Astronomy & Astrophysics, 594, A24
- Ajello et al. (2015) Ajello, M., Gasparrini, D., Sánchez-Conde, M., et al. 2015, Astrophysical Journal Letters, 800, L27
- Albert et al. (2022) Albert, A., Alfaro, R., Alvarez, C., et al. 2022, arXiv preprint arXiv:2209.08106
- Alves Batista et al. (2019) Alves Batista, R., De Almeida, R. M., Lago, B., & Kotera, K. 2019, Journal of Cosmology and Astroparticle Physics, 2019, 002
- Batista et al. (2016) Batista, R. A., Dundovic, A., Erdmann, M., et al. 2016, Journal of Cosmology and Astroparticle Physics, 2016, 038
- Chantell et al. (1997a) Chantell, M., Covault, C., Cronin, J., et al. 1997a, Physical Review Letters, 79, 1805
- Chantell et al. (1997b) —. 1997b, Physical review letters, 79, 1805
- CTA Consortium et al. (2018) CTA Consortium, et al. 2018, Science with the Cherenkov Telescope Array (World Scientific)
- Di Mauro et al. (2013) Di Mauro, M., Calore, F., Donato, F., Ajello, M., & Latronico, L. 2013, Astrophysical Journal, 780, 161
- Dolag et al. (2005) Dolag, K., Grasso, D., Springel, V., & Tkachev, I. 2005, Journal of Cosmology and Astroparticle Physics, 0501, 009
- Fang & Murase (2018) Fang, K., & Murase, K. 2018, Nature Physics, 14, 396
- Fang & Olinto (2016) Fang, K., & Olinto, A. V. 2016, Astrophysical Journal, 828, 37
- Hussain et al. (2023) Hussain, S., Alves Batista, R., de Gouveia Dal Pino, E. M., & Dolag, K. 2023, Nature Communications, 14, 2486
- Hussain et al. (2021) Hussain, S., Alves Batista, R., Pino, E. M., & Dolag, K. 2021, Monthly Not. of the R. Astronomical Society, 507, 1762
- Inoue et al. (2007) Inoue, S., Sigl, G., Miniati, F., & Armengaud, E. 2007, arXiv preprint astro-ph/0701167
- Lhaaso Collaboration et al. (2016) Lhaaso Collaboration, et al. 2016, Nuclear and Particle Physics Proceedings, 279, 166
- Murase et al. (2013) Murase, K., Ahlers, M., & Lacki, B. C. 2013, Physical Review D, 88, 121301
- Planelles et al. (2014) Planelles, S., Borgani, S., Fabjan, D., et al. 2014, Monthly Not. of the R. Astronomical Society, 438, 195
- Raghunathan et al. (2022) Raghunathan, S., Whitehorn, N., Alvarez, M. A., et al. 2022, The Astrophysical Journal, 926, 172
- Roth et al. (2021) Roth, M. A., Krumholz, M. R., Crocker, R. M., & Celli, S. 2021, Nature, 597, 341
- Tinker et al. (2010) Tinker, J. L., Robertson, B. E., Kravtsov, A. V., et al. 2010, The Astrophysical Journal, 724, 878
- Wiener & Zweibel (2019) Wiener, J., & Zweibel, E. G. 2019, Monthly Notices of the Royal Astronomical Society, 488, 280