MEGANet: Multi-Scale Edge-Guided Attention Network
for Weak Boundary Polyp Segmentation
(Supplementary Material)
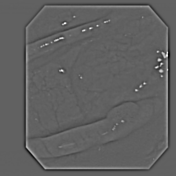
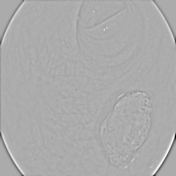
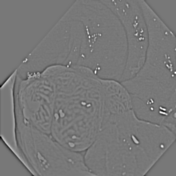
1 Visualization of the level-1 Laplacian pyramid
| Image |
|
|
|
|
|
|
|
|
|
|
|
| GT |
|
|
|
|
|
| Image |
|
|
|
|
|
|
|
|
|
| GT |
|
|
|
|
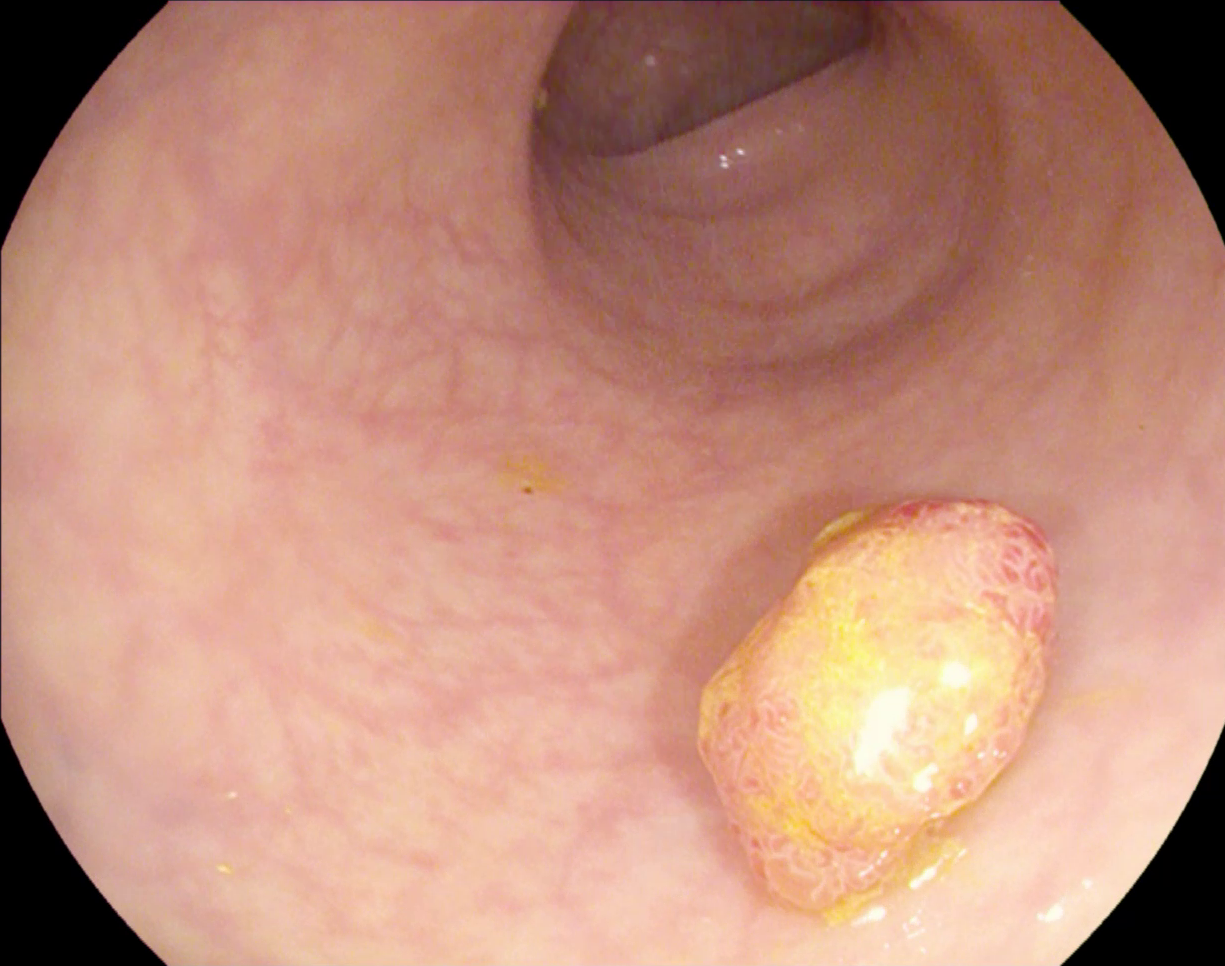
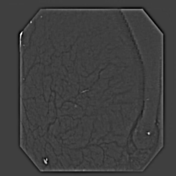
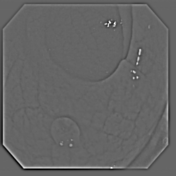
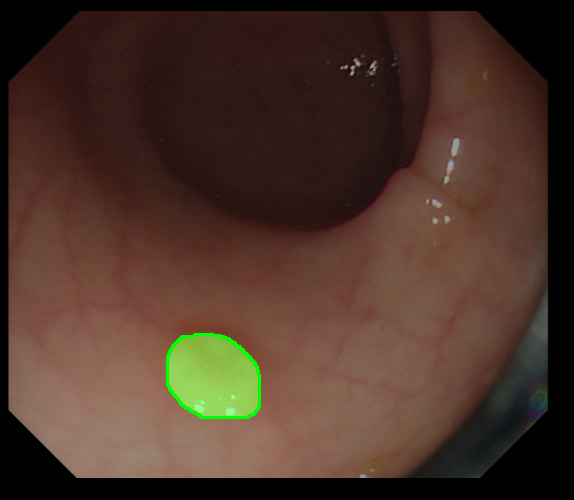
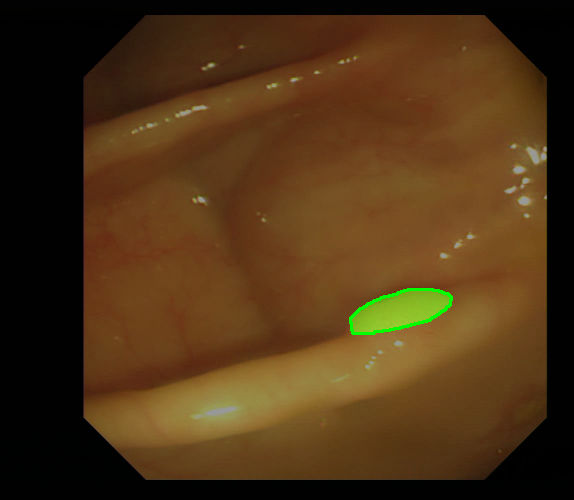
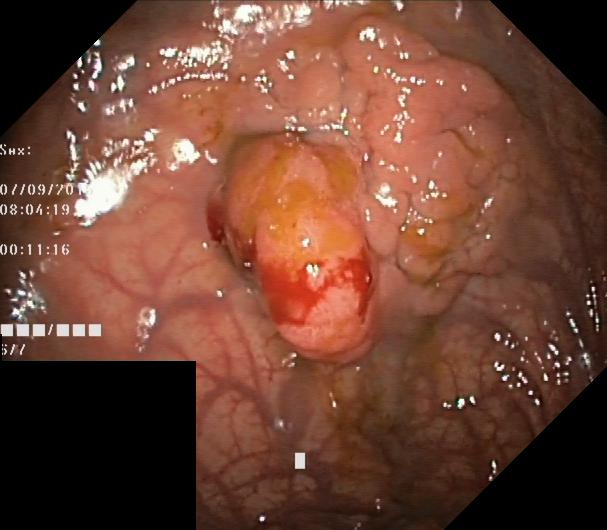
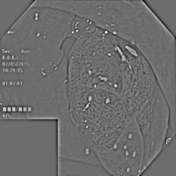
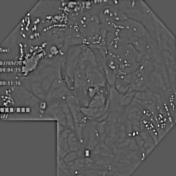
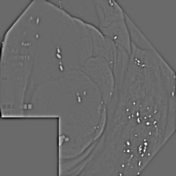
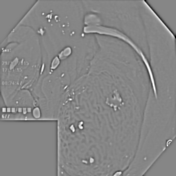
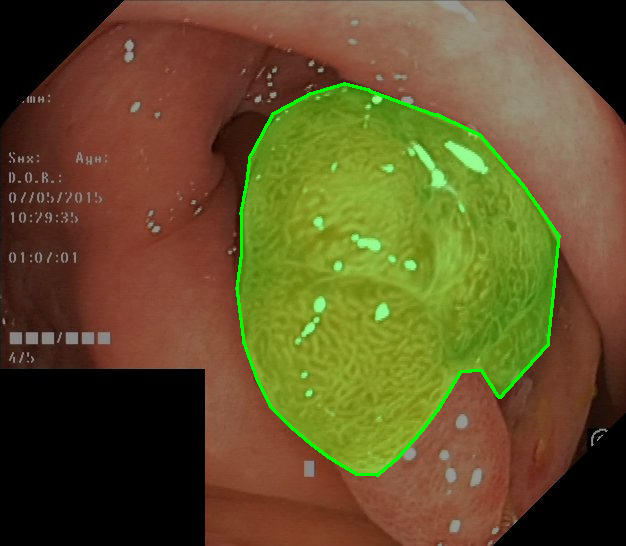
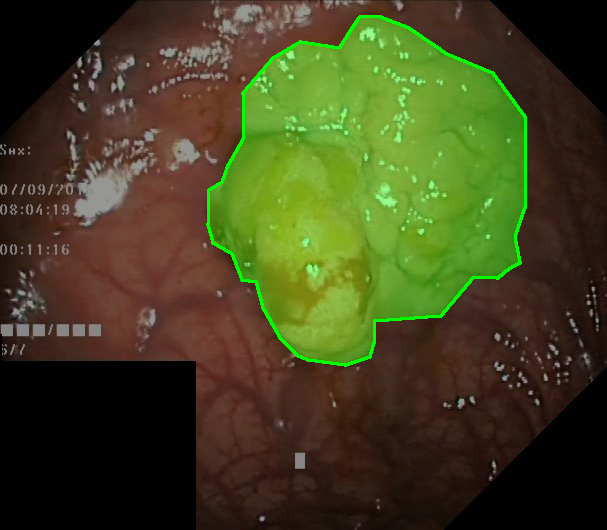
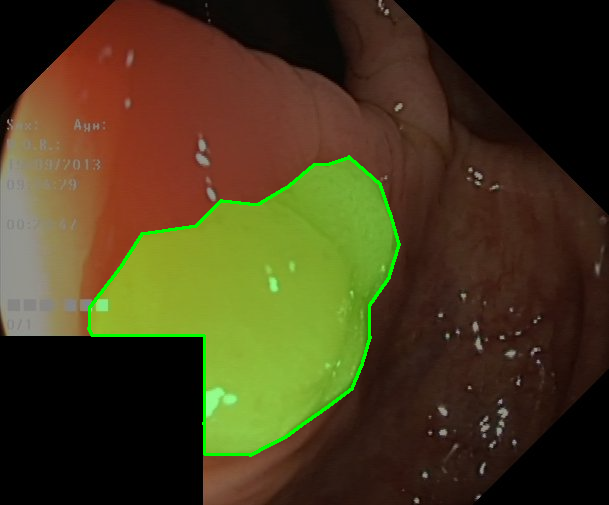
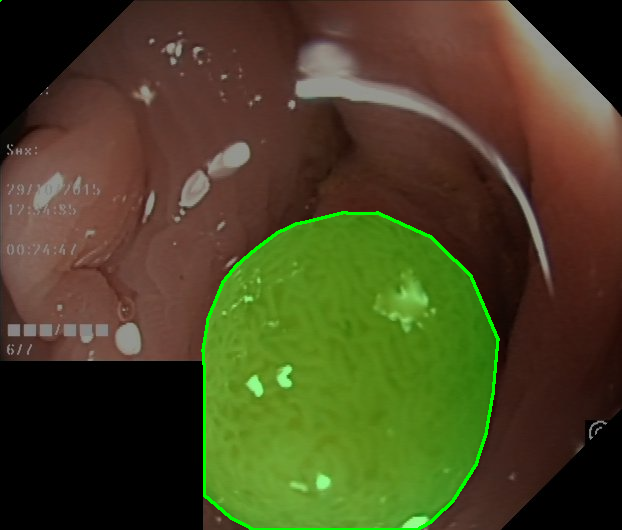
As previously mentioned, our Edge-Guided Attention (EGA) module takes three inputs, with one of them being the high-frequency feature denoted as . In most cases, corresponds to , where represents the first-level image of the Laplacian pyramid, and is the input image. The visual representation of can be seen in Figure 1.
Obviously, the boundaries between different elements in the image are highlighted. The nuances of the texture are also exposed, highlighting its ability to preserve the high-frequency information inherent in the Laplacian pyramid. Leveraging this capability, the high-frequency feature effectively guides the model’s attention towards edges relevant to polyps, thus enhancing predictions at each decoder level.
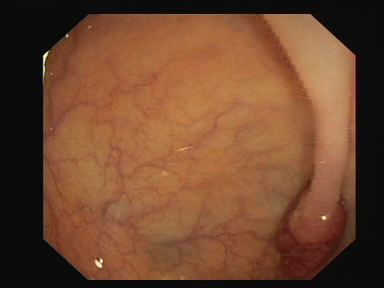
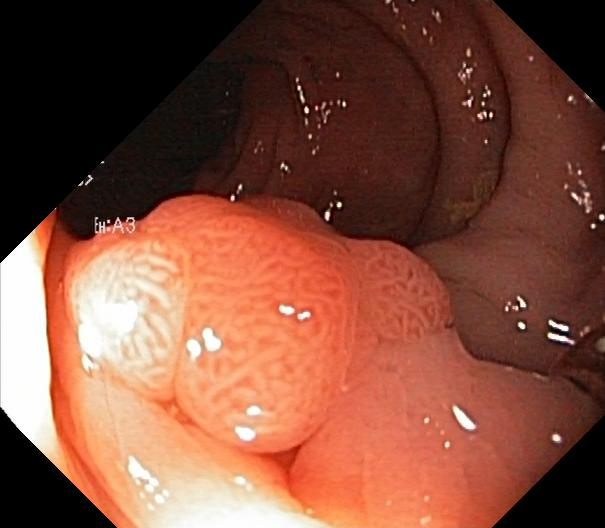
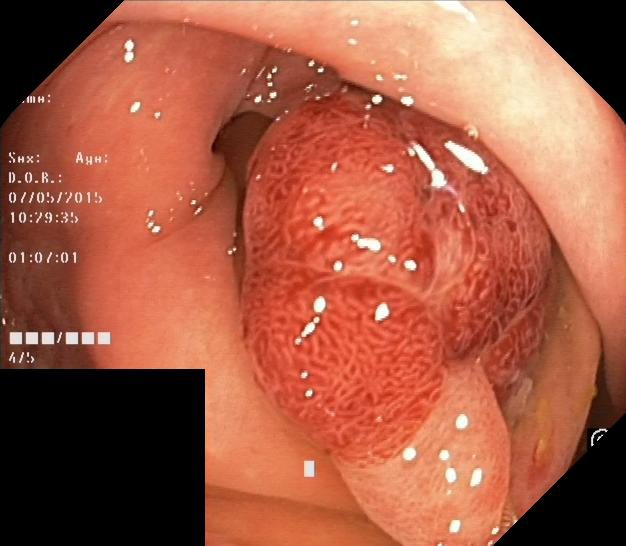
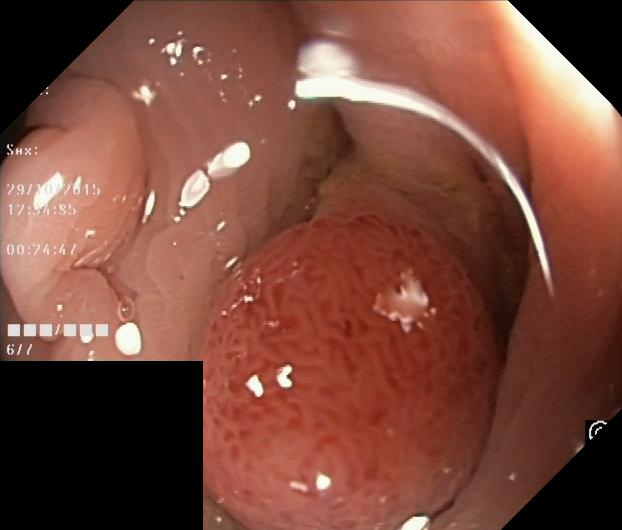
Upon examining polyp images from the Kvasir dataset, we’ve come to realize that the mucous membrane (background) of this dataset is considerably intricate. Consider the final image in Figure 1 and Figure 2 as examples; distinguishing between the appearance of polyps and the surrounding colonic mucosa proves to be quite challenging, even for human observers. This complexity is why the high-frequency feature extracted from the Kvasir dataset might contain noise, as it encompasses a significant amount of edge information from the mucous membrane. Consequently, this noise contributes to the scenario where our method, without the incorporation of , achieves the highest score within the Kvasir dataset.
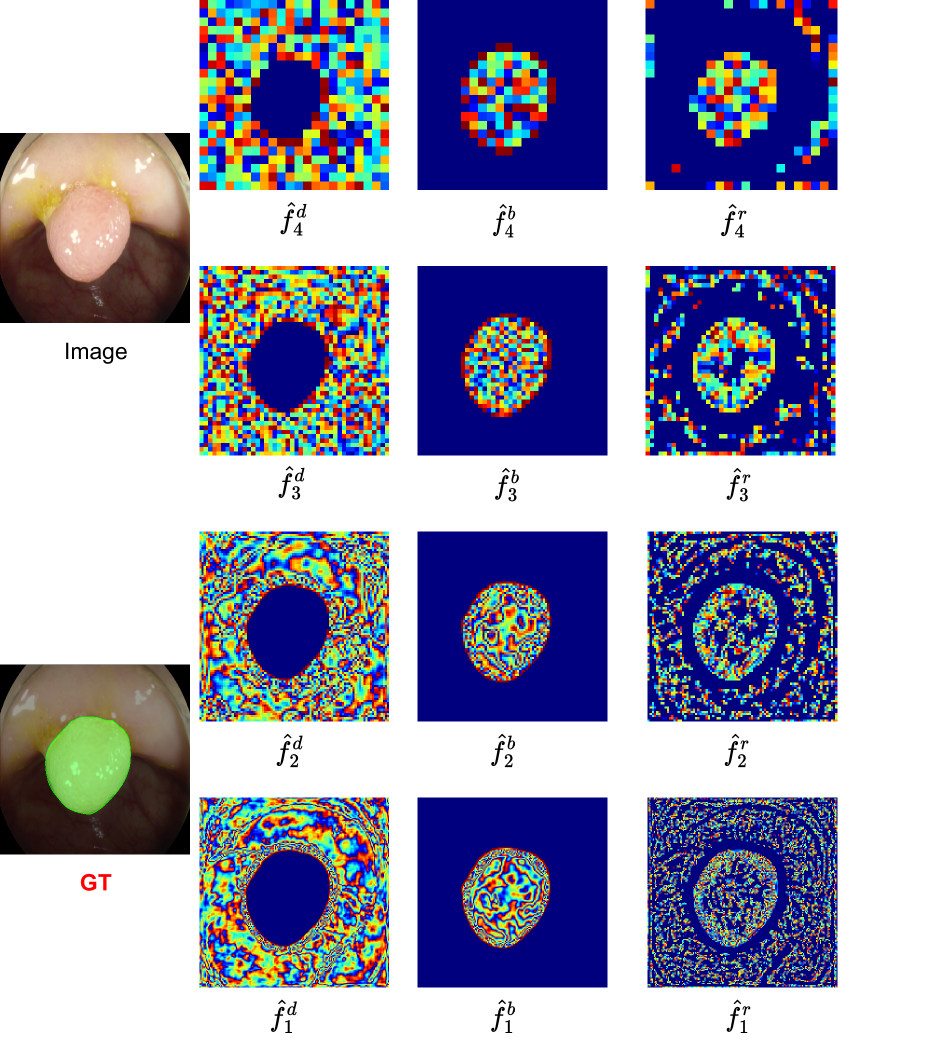
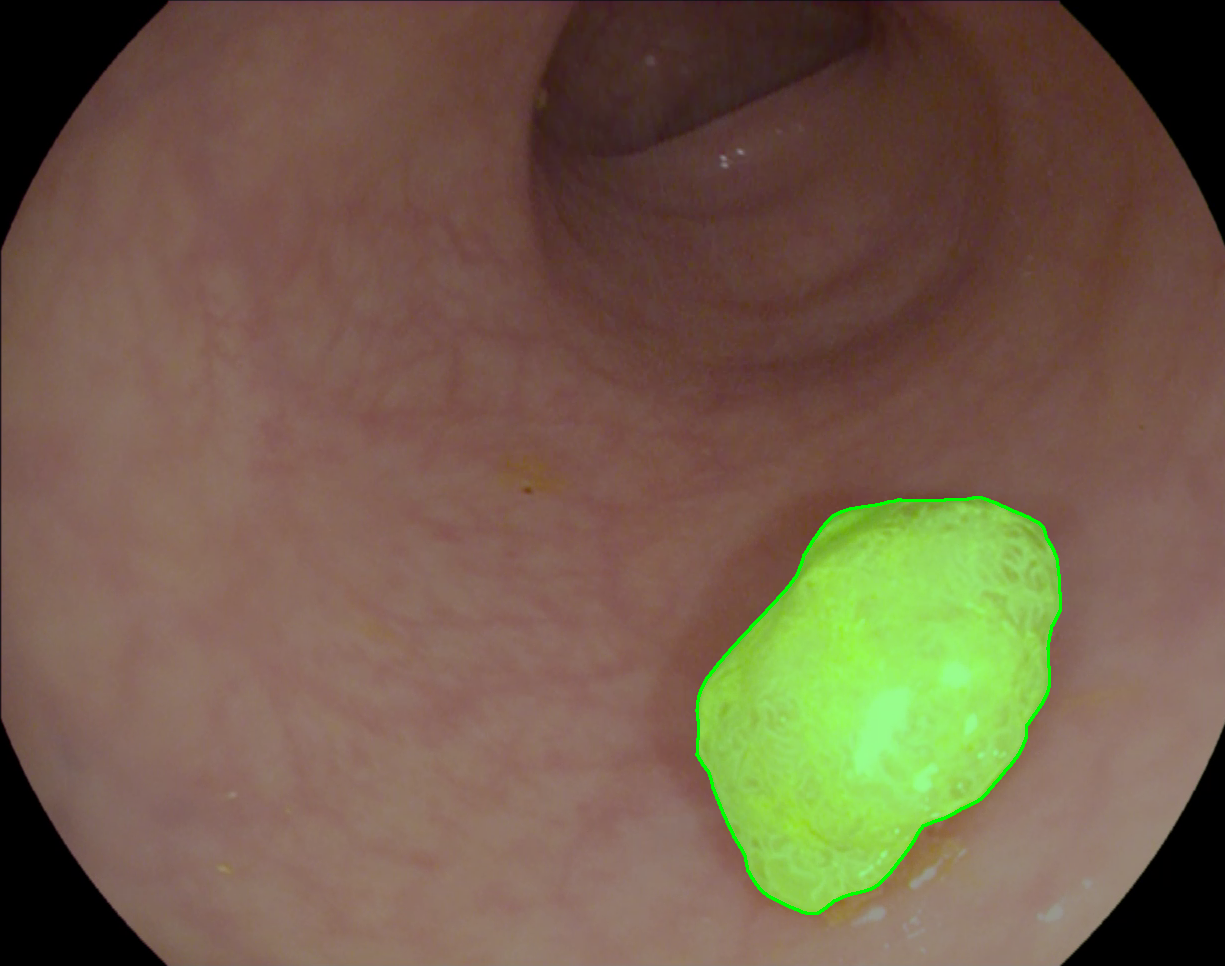
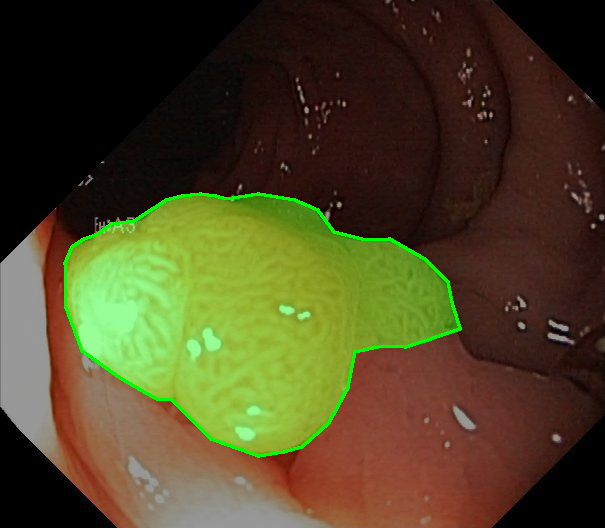
2 Visualization of the decoded predicted feature
Another input of our Edge-Guided Attention (EGA) module at certain layer is the predicted feature map at a higher layer , denoted as . The is then decomposed into the reverse attention map and the boundary attention map . Figure 3 depicts the heatmap of an example for , and during the decoding phase where . As we can see, the boundary attention , which is attained from the Laplacian operator, efficiently concentrates on the boundary between the polyp object and the surrounding mucous membrane. This feature map can force the lower decoder layer to focus on the boundary of the prediction map from the higher layer better. The reverse attention , also shown in Figure 3, guides the model to separate the polyp and mucous membranes by removing and refining the imprecise prediction map from the higher layer. By combining and , the model can have the ability to recognize the whole object regions and better distinguish polyp from the background by accurate boundary.