somespace \floatsetuprowpostcode =somespace, margins = centering
X-ray eruptions every 22 days from the nucleus of a nearby galaxy
Galactic nuclei showing recurrent phases of activity and quiescence have recently been discovered, with recurrence times as short as a few hours to a day – known as quasi-periodic X-ray eruption (QPE) sources – to as long as hundreds to a thousand days for repeating nuclear transients (RNTs). Here we present a multi-wavelength overview of Swift J023017.0+283603 (hereafter Swift J0230+28), a source that exhibits repeating and quasi-periodic X-ray flares from the nucleus of a previously unremarkable galaxy at 165 Mpc, with a recurrence time of approximately 22 days, an intermediary timescale between known RNTs and QPE sources. The source also shows transient radio emission, likely associated with the X-ray emission. Such recurrent soft X-ray eruptions, with no accompanying UV/optical emission, are strikingly similar to QPE sources. However, in addition to having a recurrence time that is times longer than the longest-known QPE source, Swift J0230+28’s eruptions exhibit somewhat distinct shapes and temperature evolution than the known QPE sources. Scenarios involving extreme mass ratio inspirals are favored over disk instability models. The source reveals an unexplored timescale for repeating extragalactic transients and highlights the need for a wide-field, time-domain X-ray mission to explore the parameter space of recurring X-ray transients.
–––
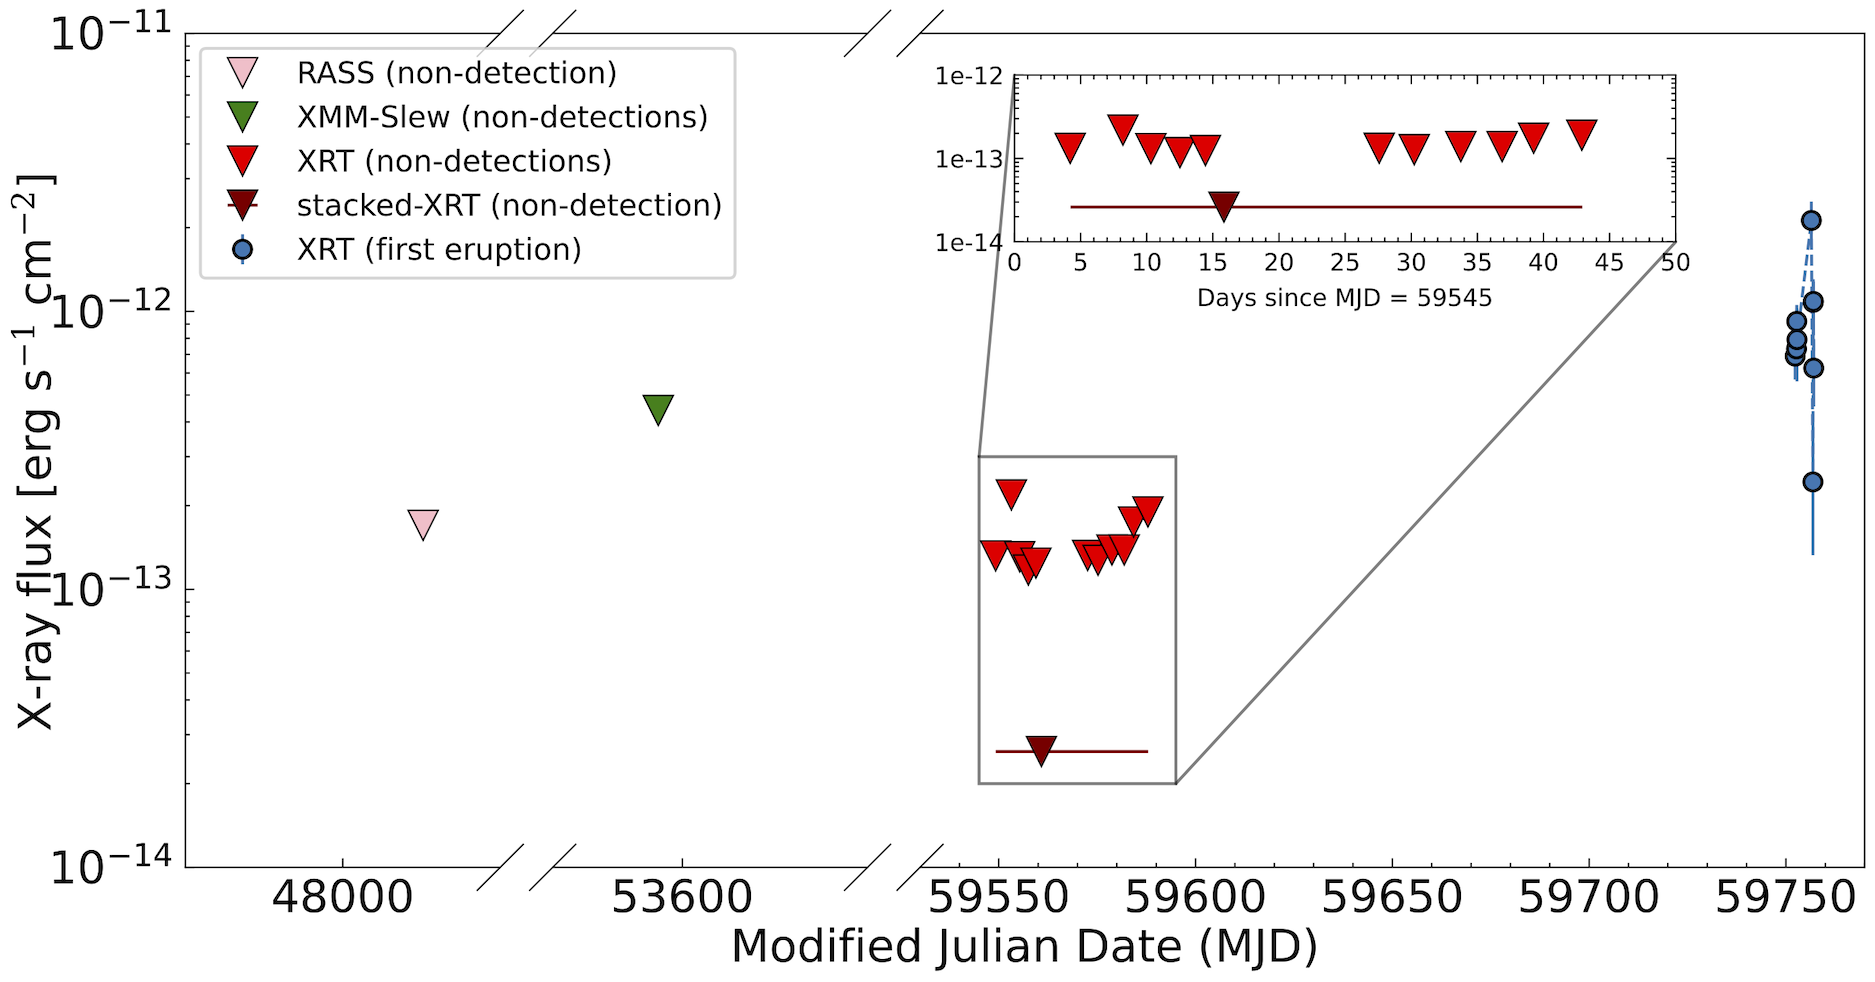
The field of view of Swift J023017.0+283603 (hereafter Swift J0230+28) was first observed by Neil Gehrels Swift Observatory X-Ray Telescope (XRT) between December 2021 and January 2022 following the discovery of the supernova SN2021afkk (?) – located 4′ from Swift J0230+28 – during which no X-ray emission was detected from the position of Swift J0230+28 (stacked upper-limit 0.3-2.0 keV flux of erg s-1 cm-2). However, an observation taken on 22 June 2022, processed by Swift live catalog of transients (?, ?), revealed an X-ray source with a 0.3-2.0 keV flux of erg s-1 cm-2, suggesting an enhancement of more than a factor of 35 (?). The X-ray spectrum was soft and thermal with a temperature of eV (). Based on the spatial coincidence of the source with the center of a nearby galaxy, the soft/thermal X-ray spectrum, and the lack of any previous X-ray detection – see “Constraints on the start of the eruptions” and Extended Data Figure (EDF) 1 in Methods – it was initially reported (?, ?) to be a flare resulting from the tidal disruption of a star by a massive black hole (MBH).
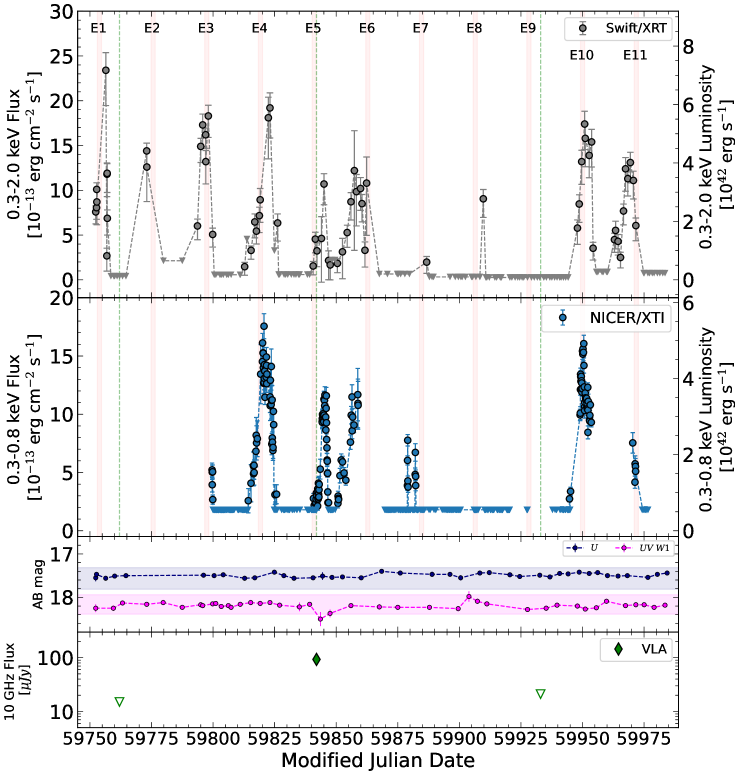
Monitoring of Swift J0230+28 with Swift/XRT between June and August of 2022 (MJD 59752-59798) revealed X-ray eruptions (increases in the 0.3–2.0 keV X-ray flux from non-detection to peaks of a factor of up to 100 higher than the upper limits) that lasted several days and were separated by longer periods ( days) of non-detections (see top panel of Fig. 1). The X-ray eruptions had no accompanying changes in the optical and the UV bands (upper-limit in the host-subtracted UV luminosity erg s-1, see “UV/optical and radio counterparts”, in Methods). These properties exclude the interpretation of a classical tidal disruption event (TDE, (e.g., (?, ?, ?, ?)). Following the indication of these recurrent X-ray eruptions, we initiated a high-cadence monitoring program with the Neutron Star Interior Composition Explorer (NICER) starting on MJD 59798 as well as multi-wavelength follow-up with several other facilities (see “Observations and Data Analysis” in Methods).
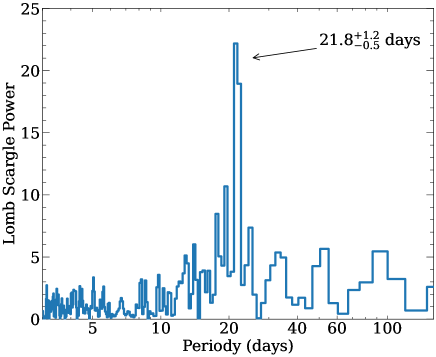
In the eight months following Swift J0230+28’s discovery, Swift/XRT observed the source with daily cadence for a total of ks, while NICER observed the source multiple times per day – albeit with some gaps – for a total of ks. The monitoring campaign confirmed the recurrence of several X-ray eruptions, that were apparently repeating every 3 weeks, as shown in Fig. 1. The Lomb-Scargle periodogram (LSP, (?, ?)) of the resulting light curve, as shown in Fig. 2, shows a strong peak at days, which indicates that the eruptions are quasi-periodic in nature. The pink shaded regions in Fig. 1 mark time intervals separated by the day period, which are referred to as epochs (E), from E1, E2, …, E11, during the days of monitoring.
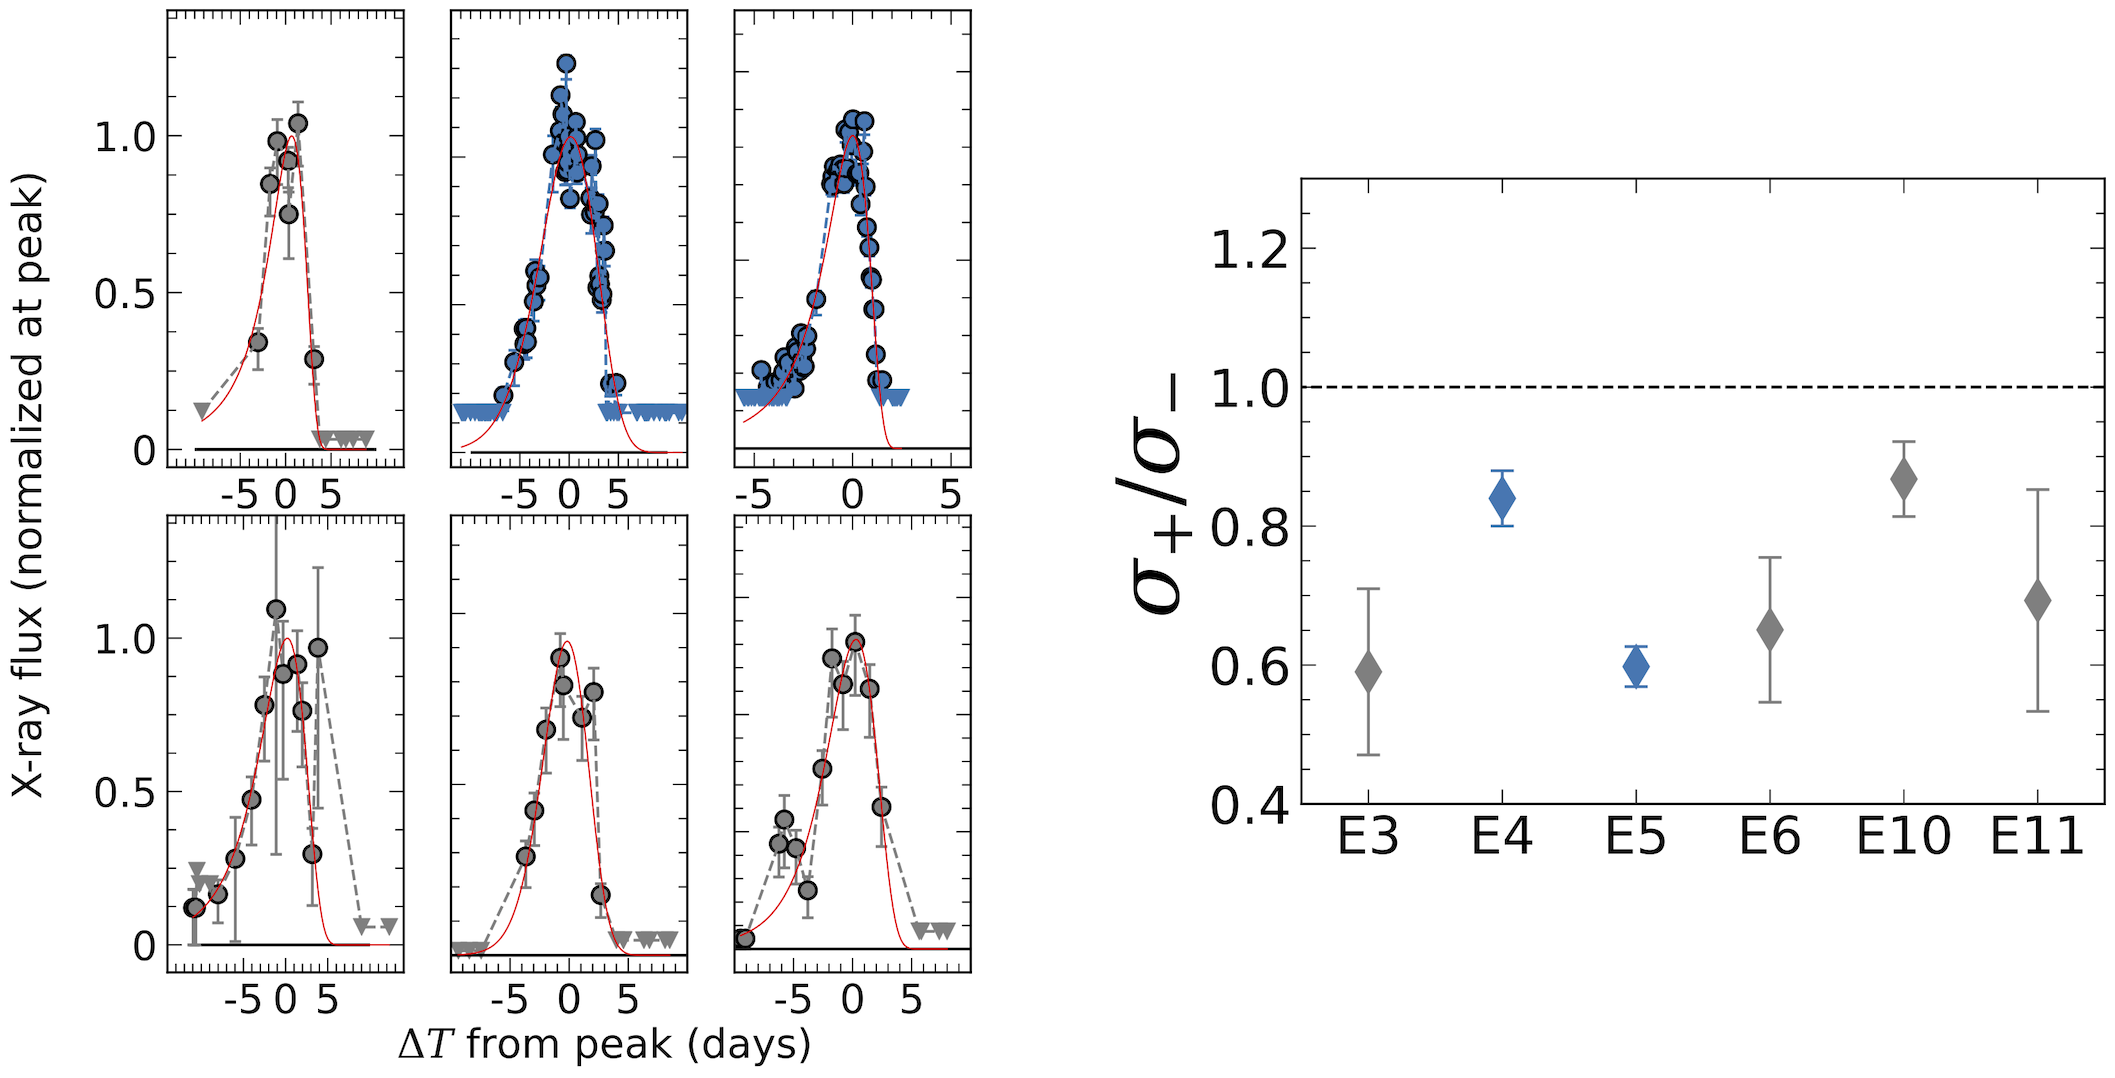
Around most of the marked epochs, namely E1-E6 and E10-E11, Swift J0230+28 showed high amplitude eruptions with a mean full-width at half maximum duration of 4.5 days (see Supplementary Information Table 1). However, around E7 and E8 instead of the few-days-long eruptions, short-lived ( day) and lower-amplitude eruptions were observed. Furthermore, no X-ray detections were observed around E9, though extremely short-lived eruptions cannot be excluded given the lack of high cadence NICER observations at the time. This indicates that, although the eruptions in Swift J0230+28 are quasi-periodic, a certain degree of irregularity in the system’s periodicity and amplitude is present. The eruptions in Swift J0230+28 are slightly asymmetric; an asymmetric Gaussian profile fitting to the shape of the well-sampled and days-long eruptions shows that the rises are longer than the decays, see “X-ray light curve”, in Methods, and EDF 2.
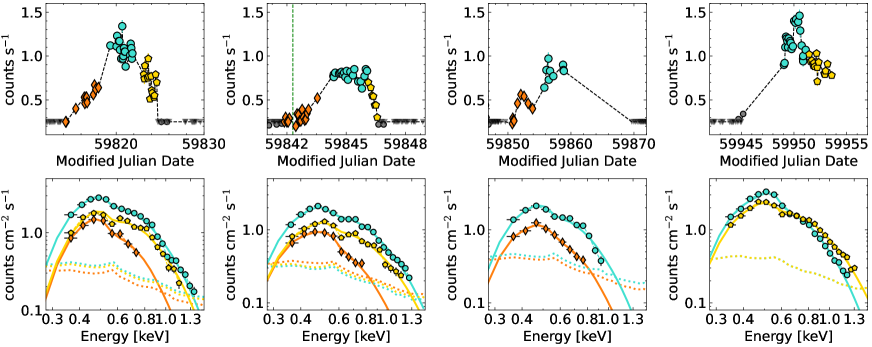
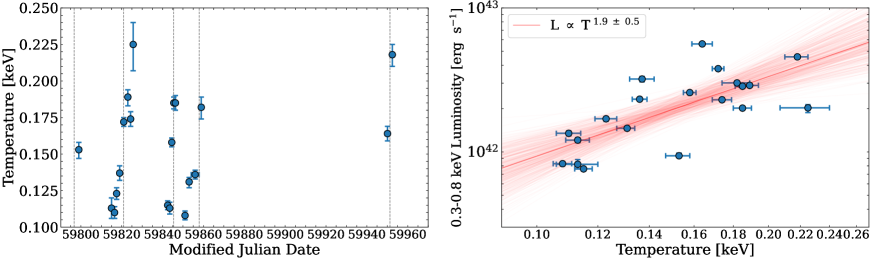
The high count rate obtained by NICER allows us to perform time-resolved spectral analyses during the eruptions (see “Time-resolved X-ray analyses” in Methods). The X-ray spectra are soft with no photons detected at energies greater than 1.5 keV over all eruptions, and a thermal model modified by absorption – both Galactic and intrinsic (column density ) – fits the spectra reasonably well – /degrees of freedom – as shown by Fig. 3 and EDF 3. The best-fitted temperature varies (see Fig. 4, and Extended Data Table 1) with time, and has a mean (standard deviation) value of 160 eV (50 eV). The variations in temperature correlate with the evolution of the eruptions: a simple regression between temperature and 0.3-0.8 keV X-ray luminosity shows a correlation in the form . However, it should be noted that the large spread is driven by the fact that Swift J0230+28 does not show a cool warm cool temperature evolution in each eruption. The temperature increases from the rise ( 100 eV) to the peak ( 150 eV) of the eruptions, but instead of decreasing during the decay – as one would expect for a direct correlation between temperature and luminosity – it continuous to increase, up to 200 eV, hence it shows a cool warm temperature evolution.
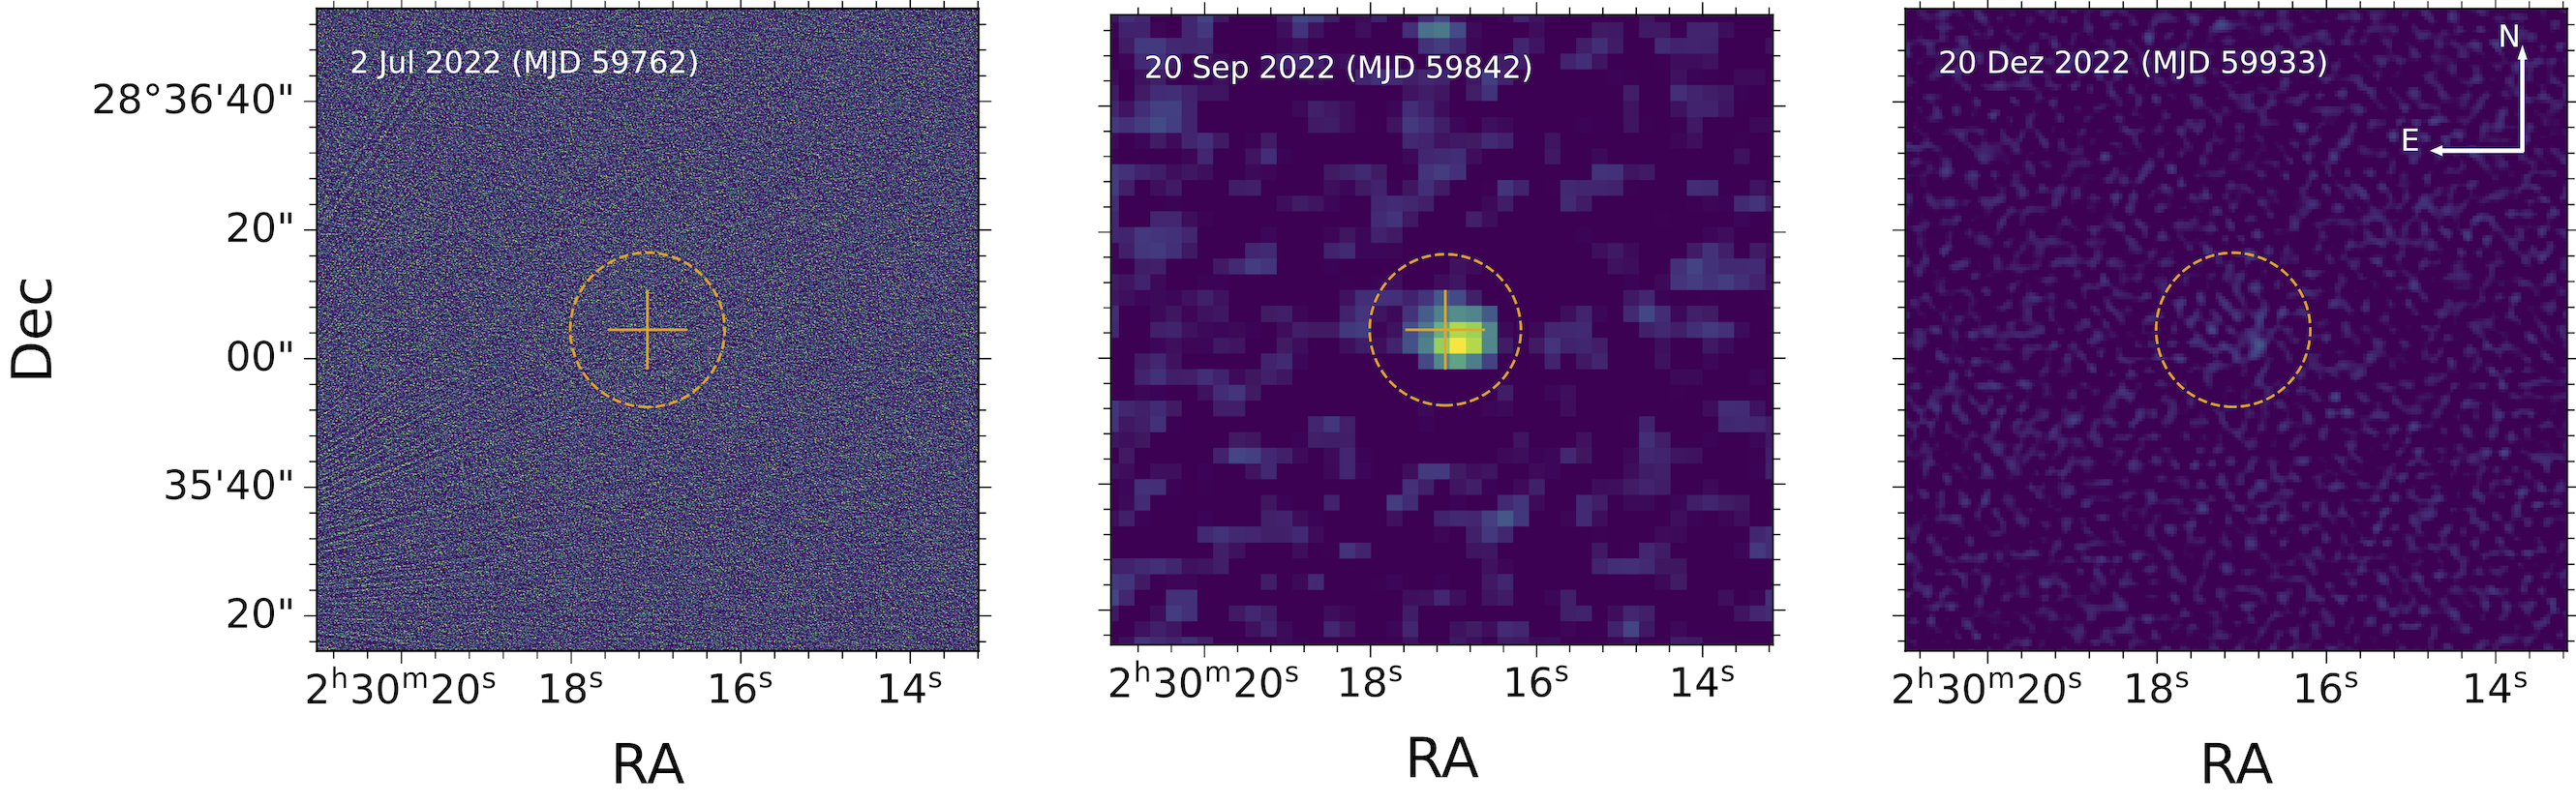
Our radio monitoring (see “Very Large Array (VLA)” and EDF 4, in Methods) shows a transient point-like source at Swift J0230+28’s position. While the first and third observations (MJD 59762 and MJD 59933) showed no detections with 3 upper limits of 15 and 25 Jy, respectively, our second visit on MJD 59842 shows a detection with a flux of 937 Jy. This radio detection coincides with one of the X-ray eruptions, while the two radio non-detections coincide with X-ray quiescent phases suggesting that the X-ray eruptions may be accompanied by radio emission (Fig. 1).
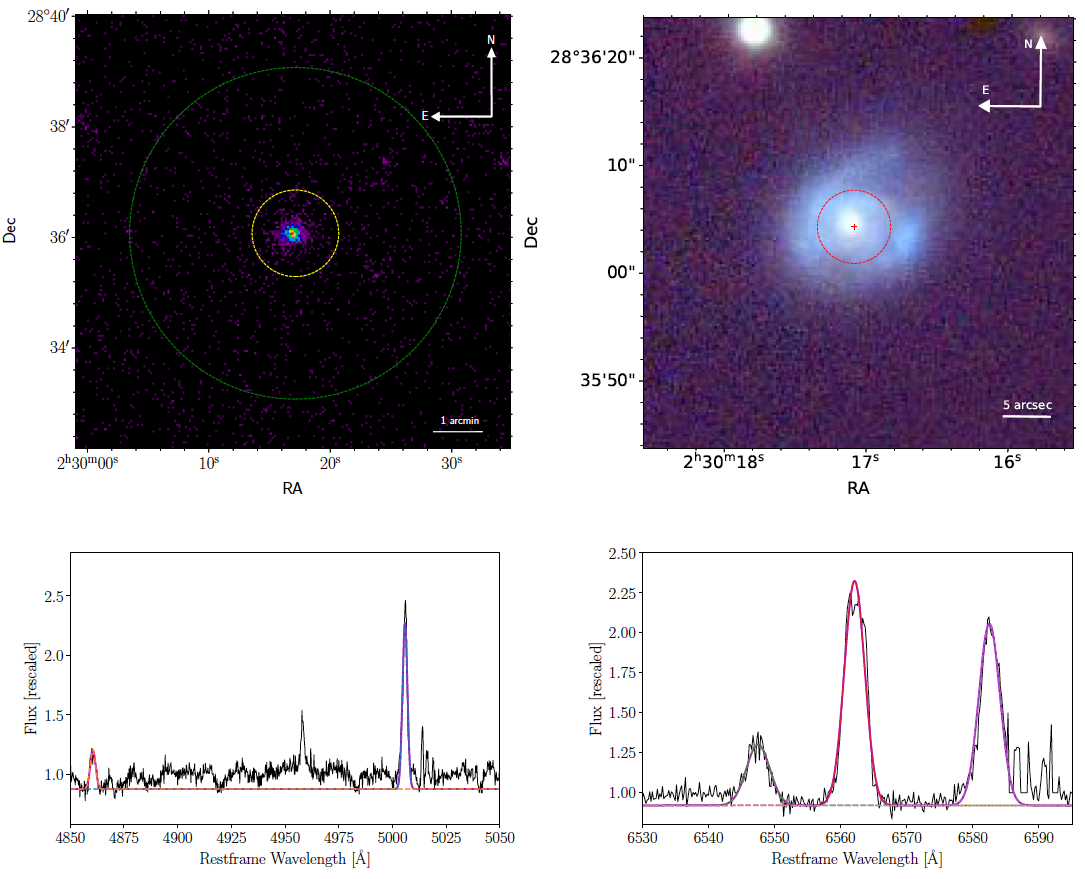
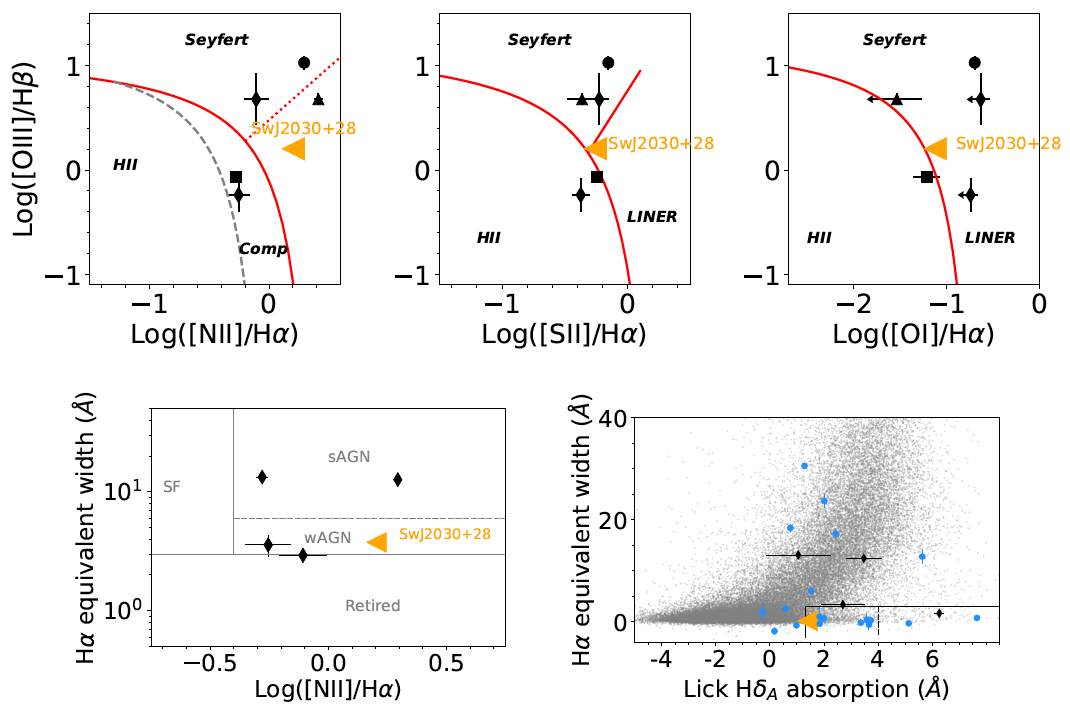
The position derived from XRT for Swift J0230+28 is consistent with the nucleus (0.2′′ 3.6′′, 90% uncertainty, from the photometric center) of a spiral galaxy (see EDF 5) at 165 Mpc (z = 0.036). The host galaxy is not in any active galactic nuclei (AGN) catalog; there is no archival detection in the X-rays, nor in the radio, prior to the start of the eruptions. The host also shows no infrared (IR) photometric excess, nor any variability in the IR bands, that would indicate the presence of a hot dust component (i.e., a “torus”). However, optical emission line diagnostic diagrams (see EDF 6) based on nuclear spectra indicate the presence of a weak AGN (or low-luminosity AGN, LLAGN). The high-resolution optical spectrum of the nuclear region also allowed us to measure the stellar population velocity dispersion () and estimate a black hole mass () of log (/) = , using the standard - relation (?), which is in agreement with the derived from the host galaxy mass (, see EDF 7) assuming the - relation of (?) . Based on the [O iii] emission line and the 2 – 10 keV luminosity upper limit, we estimate the upper limit for the bolometric luminosity of the AGN (prior to the start of eruptions) to be erg s-1, which for the estimated black hole mass translates into an Eddington ratio () 0.002, supporting the LLAGN classification by line ratio diagnostic diagrams (see “The host galaxy” in Methods). At such a low accretion rate, a standard thin accretion disc should not be present in Swift J0230+28’s host, instead, any accretion flow, if present, is more likely an Advection Dominated Accretion Flow (ADAF).
The recurrent phases of high activity followed by phases of quiescence, could, in principle, classify Swift J0230+28 as a repeating nuclear transient (RNTs). Three clear cases of RNTs are known: ASASSN-14ko (?), eRASStJ045650.3-203750 (hereafter eRA J0456-20, (?)) and AT2018fyk (?). These sources show repeated flares, with recurrence times varying from 114-1200 days (see “Repeating Nuclear Transients and Swift J0230+28”, Supplementary Information, for detailed properties of these sources), and are interpreted by most studies as the result of a star being repeatedly partially disrupted by the central MBH (?, ?, ?, ?, ?). However, Swift J0230+28 differs significantly from RNTs in the following ways: i) RNTs exhibit much brighter X-ray luminosities compared to Swift J0230+28; ii) RNTs are even brighter in the UV/optical bands than in X-rays, while Swift J0230+28 does not exhibit any detected UV/optical emission; with rapid rises and much slower decays, while Swift J0230+28’s eruptions have a slightly slower rise than decay; iii) none of the RNTs show a purely soft/thermal X-ray spectrum, like in Swift J0230+28.
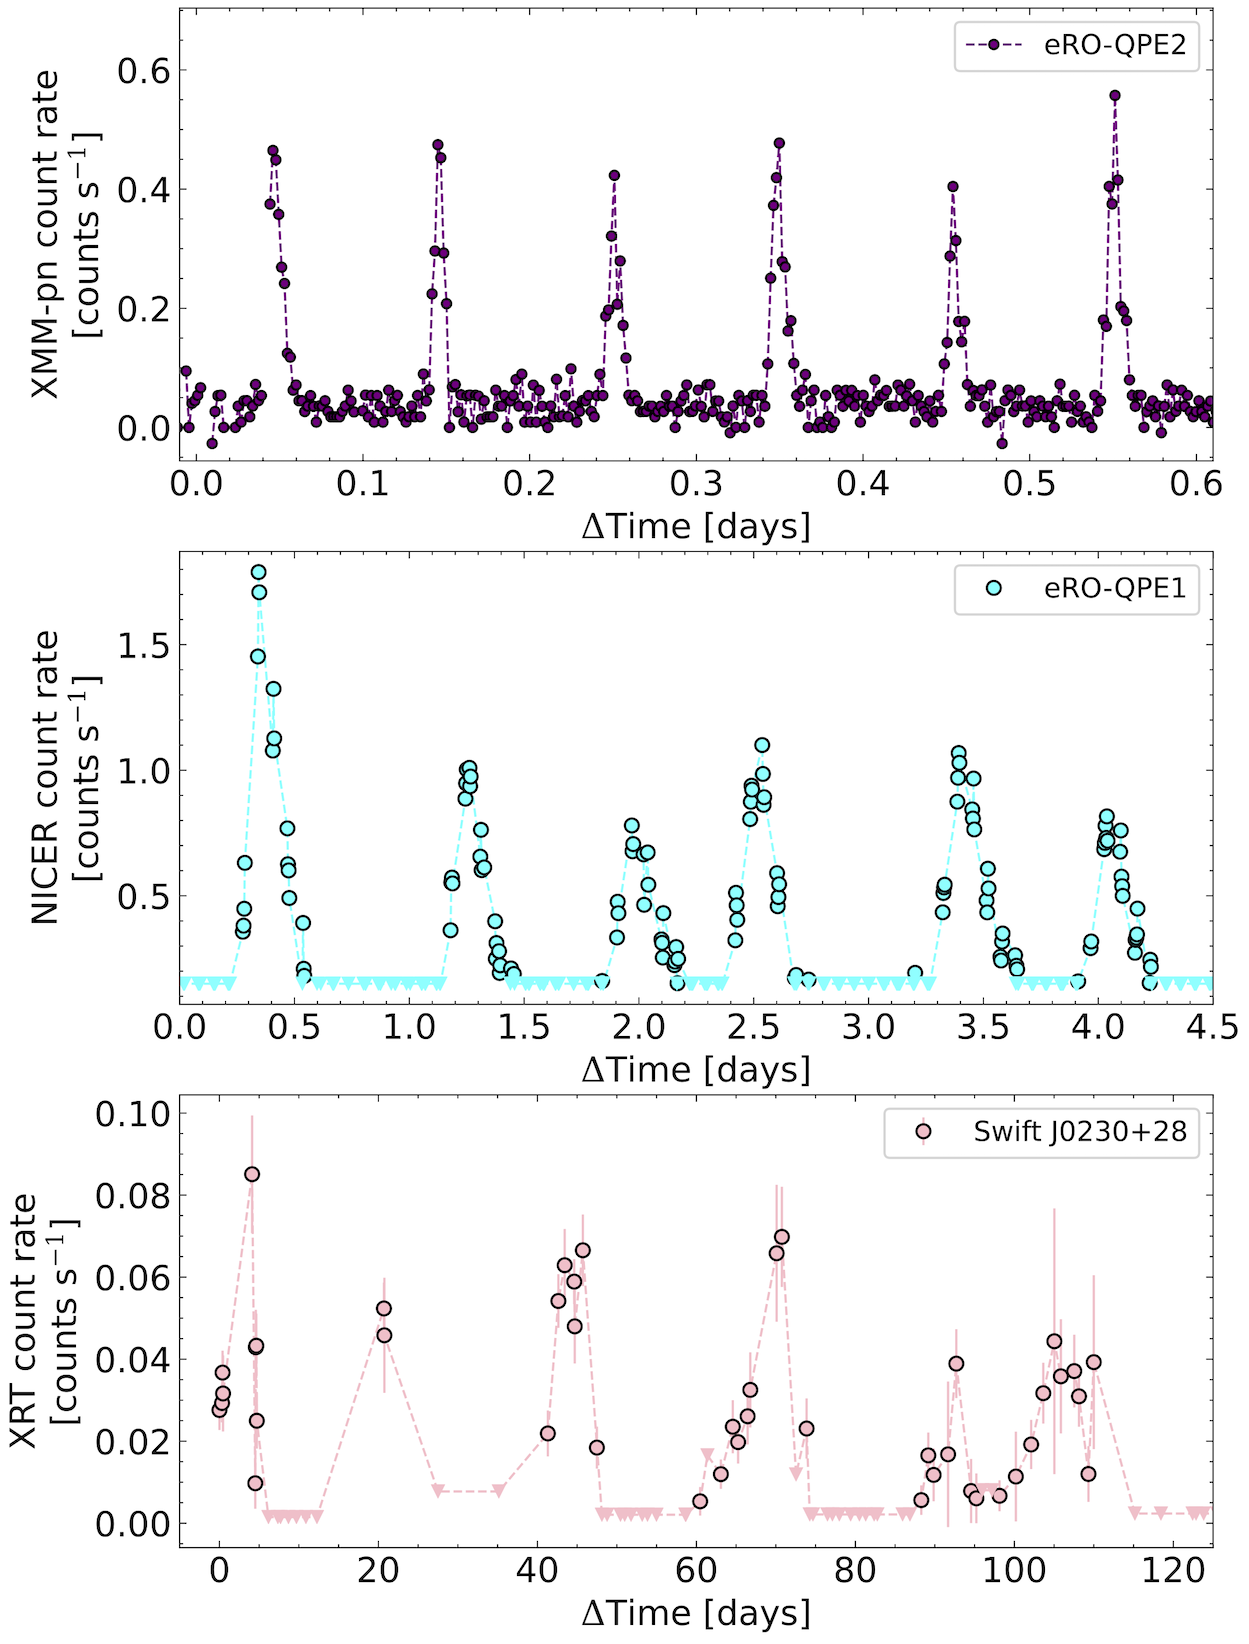
Swift J0230+28’s recurrent soft X-ray eruptions with no accompanying UV/optical emission from the nucleus of a galaxy hosting a relatively small black hole ( ), are characteristics of the recently discovered class of quasi-periodic X-ray eruption (QPE) sources. Four confirmed QPE sources are known: GSN 069 (?), RX J1301 (?), eRO-QPE1 and eRO-QPE2 (?), and a detailed description of their properties are presented in “Quasi-periodic erupters and Swift J0230+28” in Methods. However, the known QPE sources show much shorter mean recurrence times than Swift J0230+28, from a few hours to one day (see Extended Data Table 2 for exact values, and EDF 8 for light curve comparison). This could indicate that Swift J0230+28 may be a longer time-scale ( times longer than eRO-QPE1) QPE source. However, as discussed in detail in “Quasi-periodic erupters and Swift J0230+28” in the Supplementary Information, Swift J0230+28 possesses some properties that differentiate it from, and makes it unique compared to, the four known sources of QPEs: i) the four QPE sources show a cool warm cool temperature evolution in each of the eruptions, while Swift J0230+28 does not present any cooling at the decays of its eruptions, instead the temperature continuously increase until the source fades below the level of detectability; ii) the shapes of the eruptions in these four QPE sources are either nearly symmetric, or slightly asymmetric with longer decays than rises, while the rises in Swift J0230+28 are longer than the decays.
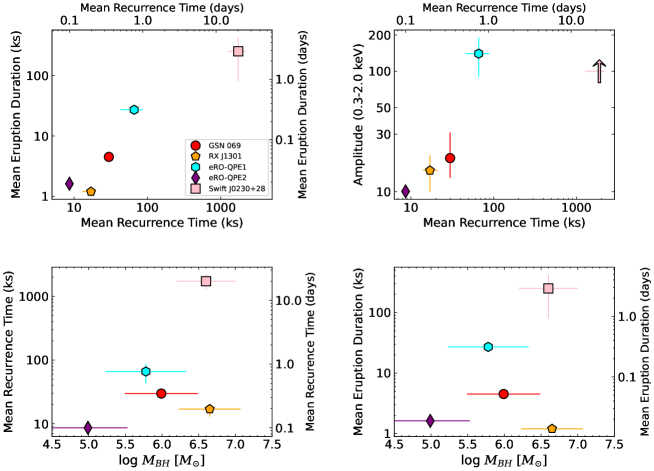
A comparison between the general properties of Swift J0230+28, RNTs and QPEs is shown in Table 1. In summary, Swift J0230+28 shows more similarities with QPEs sources than with RNTs. It shares many, but not all, of the properties of known QPE sources, and operates on an order-of-magnitude longer time-scale. Observationally, it resembles either a long time-scale QPE source, with slightly distinct properties, or the first example of a completely new class of transient with other members yet to be discovered. If the former case is assumed, one can investigate how Swift J0230+28’s properties relate to those of the four known QPE sources. Fig. 5 shows that the recurrence time and the duration of the X-ray eruptions seem to be correlated, with a duty-cycle (duration/recurrence time) equal to . A positive correlation also appears to be present between the recurrence time and amplitude of the eruptions, although only lower-limits on Swift J0230+28’s amplitudes are known. However, the timing properties (duration and recurrence time) do not seem to be correlated with , perhaps indicating that the timescales of quasi-periodic, soft X-ray eruptions do not depend on .
Several models have been proposed to explain the repeating/recurrent phases of nuclear activity in RNTs and QPE sources, and those models can be roughly divided into two classes: those involving accretion-disc instabilities and those with smaller-mass bodies orbiting a MBH (i.e., extreme mass ratio inspirals; EMRIs). A more detailed discussion of each of these classes of models, and their strengths and weaknesses in explaining Swift J0230+28’s properties, are presented in “Physical models for Swift J0230+28” in Supplementary Information, but in the following we summarize some of their aspects.
As for the accretion-disc driven models, some studies have proposed that instabilities associated with the inner accretion flow, from precession (?, ?, ?, ?) to distinct types of pressure/ionization instabilities (?, ?, ?, ?, ?), could produce quasi-periodic phases of high and low activity. However, the strong constraint on Swift J0230+28’s host emission before the beginning of the eruptions as well as between eruptions () makes it extremely unlikely that a pre-existent standard thin disk is present, and the lack of any UV/optical variability makes accretion-disk instabilities an unfavorable interpretation for Swift J0230+28’s eruptions, given that these models require either one or both of these to be observed (see “Accretion disc instabilities” in Supplementary Information for details).
The repeated partial tidal disruption (pTDE) of a star on a bound orbit about a MBH was proposed to explain both RNTs and QPEs. The repeated partial disruption of a main sequence star can explain the properties of RNTs (?, ?, ?, ?, ?). In the case of Swift J0230+28, if the X-ray eruptions arise from accretion and the accretion efficiency is of the order , the mass accreted per eruption is (see “Eruptions Energetics”, in Methods). This implies that the mass lost by the star per orbit is a very small fraction of the total stellar mass, which would suggest that the pericenter distance of the star is extremely fine-tuned to coincide with the partial tidal disruption radius (?). This raises the question of how the star achieved such a fine-tuned distance, given our constraints on the beginning of the eruptions (see “Constraints on the start of the eruptions” in Methods). Furthermore, the shape of Swift J0230+28’s eruptions is the opposite of the fast rise and longer decay expected from fallback accretion. A repeating pTDE of a white dwarf (WD), as proposed to explain the hour-long time-scale eruptions in QPE sources (?, ?), can likely be excluded for Swift J0230+28 given that a standard WD mass and corresponding radius (?) yields a tidal disruption radius that is close to a factor of 10 smaller than the direct capture radius of a non-spinning black hole (see “Repeating partial tidal disruption event” in Supplementary Information for details).
After the discovery of the first QPE source, a series of alternative models related to distinct types of EMRIs have been proposed to explain the few-hours to a day, X-ray-only eruptions, which could, in principle, be extended to explain Swift J0230+28. These include collisions between a compact object or star and a pre-existing accretion disk/ADAF (?, ?, ?) (see “Accretion disc – perturber interaction” in Supplementary Information), the mass transfer from a single orbiting star undergoing Roche-lobe overflow around the MBH (?, ?) (see “Stellar mass-transfer” in Supplementary Information), or a pair of interaction stellar EMRIs (?)(see “Interacting stellar EMRIs” in Supplementary Information), or alternatively the compression of stream clumps from a past TDE (?, ?)(see “Compressed reformed clumps from a past TDE” in methods). Several of these models can reproduce Swift J0230+28’s features, while simultaneously suffering from inherent modeling uncertainties, degeneracies, or finely tuned parameters, as we discuss in detail in “Extreme mass ratio inspirals (EMRIs)” in Supplementary Information. Accurately constraining the characteristics of the physical system operating in Swift J0230+28 thus remains a challenge.
Although the physical origin of QPEs, RNTs, and now Swift J0230+28 are still the subject of debate, their discovery inaugurates a novel and exciting perspective on the study of transient events associated with MBHs, and Swift J0230+28 has demonstrated the existence of a new timescale associated with these phenomena. In particular, if Swift J0230+28 is a member of the same family as the four known QPE sources – despite their slightly distinct properties – and those originate from the same type of physical system, then the physical system’s period needs to be scalable from a few hours to several days, i.e., more than two orders of magnitude, which would pose a strong constraint on potential theoretical models. Furthermore, there is a growing body of literature pointing toward these quasi-periodic X-ray eruptions being electromagnetic counterparts of EMRIs, with significant implications for the future of multi-messenger astrophysics.
The serendipitous discovery of Swift J0230+28 also highlights exciting astrophysics that we are currently missing due to the lack of wide-field and time-domain X-ray surveys. The eROSITA instrument (?) on the Spectrum-Roentgen-Gamma (SRG, (?)) space observatory has made significant progress in the field; however, its multiple visits of a field separated by four hours that are only revisited every six months makes it extremely unlikely to discover transients that vary on day timescales, such as Swift J0230+28. In the near future, the combination of the wide field of view and high cadence of Einstein Probe (?) should in principle be able to discover more events similar to Swift J0230+28, although its shallow sensitivity combined with the likely very low rate of such event may result in no such discovery. In the future, only a deep and wide-field time-domain X-ray mission will be able to systematically discover a population of Swift J0230+28-like objects.
[] Properties Swift J0230+28 QPEs RNTs Recurrent soft X-ray eruptions Yes Yes No***The outbursts in eRA J0456-20 evolve much smoothly than the eruptions in QPEs and Swift J0230+28. The periodic behavior of ASASSN-14ko is mostly found in the UV/optical bands, not so much in the X-rays. The X-ray spectra in all three RNT, are not soft, instead show hard X-ray emission from a corona. Mean recurrence time 22 days 2.4–18.5 hours 114–1200 days X-ray spectra soft/thermal soft/thermal soft/thermal + corona or corona only X-ray luminosity at peak†††In the 0.3-2 band for Swift J0230+28 and QPEs, and in the 0.3-10 keV band for RNTs. at peak (erg s-1) UV/optical emission x x ✓ UV/optical luminosity at peak (erg s-1) ‡‡‡Based on the lack of variability in Swift/UVOT bands, see “UV/optical and radio counterparts”, in methods. §§§Based on the lack of variability in Swift/UVOT and/or XMM-Newton/OM instruments from the host level. Light curve shape slight asymmetric (rises 30 longer than decays) symmetric or slight asymmetric (longer decays than rises) complex and varied ¶¶¶ASASNN-14ko and AT2018fyk have TDE-like (rapid rise, decay longer). eRA J0456-20 show much longer rises than decay. – –
Methods.
1 Observations and Data Analysis
This work is based on novel data acquired by 5 different telescopes/instruments, as well as in archived data, across the entire electromagnetic spectrum (namely Radio, Infrared, optical, UV and X-rays). Below, we describe the data and their relevant reduction and analysis procedures. Throughout this paper, we adopt a standard CDM cosmology with H0 = 67.4 km s-1 Mpc-1, = 0.315 and = 1 - = 0.685 (?). Using the Cosmology Calculator (?) Swift J0230+28’s redshift (z) of 0.036 corresponds to a luminosity distance of 165 Mpcs.
1.1 Swift/X-Ray Telescope (XRT)
The field containing the position of Swift J0230+28 was observed by Swift between December 2021 and January 2022 following the discovery of the supernova SN2021afkk located 4.25 arcmin from the position of Swift J0230+28. During that time X-rays were not detected from the position of Swift J0230+28 with a 0.3-2 keV flux upper limit of erg s-1 cm-2. After a gap of 164 days Swift started again monitoring the field of view on 22 June 2022, making the first detection of the new X-ray source at the position RA, Dec: 37.57140o, 28.60124o, with an uncertainty of 3.4′′ (radius, 90% confidence). While the monitoring continues at the time of writing of this manuscript we include all data taken until 8 February 2023 (MJD 59983).
We started XRT data analysis by downloading the data from the HEASARC public archive. We extracted the cleaned event files by running the xrtpipeline on each observation ID (obsID). For each obsID we run a detection pipeline (?), using a circular extraction region centered on (02:30:17.1,+28:36:04.5) (J2000.0 epoch) with a radius of 47′′ and a background using an annulus centered on the source position with an inner and an outer radii of 80′′ and 250′′, respectively. To consider a detection, we require that the source was detected above the background at a confidence of at least , in a Bayesian framework (?), below that we consider as a non-detection.
1.1.1 XRT count rate to flux and luminosity conversion
We followed the procedure below to covert from observed 0.3-2.0 keV background-subtracted count rate to observed 0.3-2.0 keV flux and luminosity.
-
1.
First, we extracted a combined source spectrum using obsIDs where the source was detected above .
-
2.
Then we combined the corresponding individual exposure maps and used it to compute a combined ancillary response file by following the steps outlined on XRT’s data analysis webpages here: https://www.swift.ac.uk/analysis/xrt/exposuremaps.php and https://www.swift.ac.uk/analysis/xrt/arfs.php.
-
3.
Using ftool ftgroupha we grouped the spectrum using the optimal binning scheme of (?) with the additional requirement to have at least 20 counts per spectral bin
-
4.
The resulting combined spectrum was then fit with a thermal model, i.e., tbabs*zashift*diskbb in XSPEC. tbabs’s column was fixed at the MilkyWay value (7.2 cm-2) using HEASARC calculator: https://heasarc.gsfc.nasa.gov/cgi-bin/Tools/w3nh/w3nh.pl. This gave an acceptable /degrees of freedom (d.o.f) of 12/11. The mean 0.3-2.0 keV background-subtracted count rate in this combined spectrum was 1.7310-2. The observed flux and luminosity were 4.310-13 erg s-1 cm-2 and 1.51042 erg s-1, respectively. Based on this we derive a background-subtracted 0.3-2.0 keV count rate to flux (luminosity) scale factor of 2.510-11 erg s-1 cm-2/count s-1 (91043 erg s-1/counts s-1).
1.1.2 Estimating the XRT X-ray upper limit
The source is not detected in several observations taken during the low-flux state between the eruptions. We estimate the flux upper limit as follows:
-
1.
For given consecutive non-detections (source less than above background) we extract a combined 0.3-2.0 keV image for the OBS ID’s.
-
2.
Using ximage’s sosta functionality we estimated the count rate upper limit for each of groups of non-detections and obtained the flux upper-limit using the scaling factor determined in section §1.1.1. We attribute the combined upper-limit of the grouped observations, for each of the OBS ID.
-
3.
We estimated the 0.3-2.0 keV flux upper limit for the combined image of all non-detections, which of 710-4 counts/s which translated to roughly 210-14 erg s-1 cm-2.
-
4.
We performed a similar procedure in the 2-10 keV band to estimate an upper limit for a AGN/corona emission. We obtained 510-4 counts/s which translate (assuming a power-law spectrum with = 2) to a 2-10 keV flux upper limit of 310-14 erg s-1 cm-2.
The resulting XRT light curve showing flux (luminosity) versus time is shown in upper panel of Fig. 1, detections are shown in solid circles with error-bars representing 1 uncertainty, while non-detections are shown as inverse triangles.
1.2 Swift/UVOT
All the data were processed with heasoft v6.29c. We use the uvotsource package to extract the UVOT photometry measurements, using an aperture of 5′′. We include observations prior and during the X-ray transient. Given that most observations were performed in the ‘filter of the day’ configuration not all the UVOT filters are available for all epochs. Photometry was corrected for Galactic extinction E(B-V) = 0.086 (?). There is no statistically significant variability in any of the UVOT filters. We show the well sampled UV W1 and U filter light curves in the bottom panel of Fig. 1.
1.3 NICER
Following Swift/XRT’s detection of highly variable X-ray emission from Swift J0230+28 NICER started a monitoring program as part of Director’s Discretionary Time (DDT). NICER observations started on 23 June 2022 (MJD 59753) and continue at the time of writing of this paper. Here we include data taken until 1 February 2023 (MJD 59976). NICER’s observing cadence varied during this time with 1-2 exposures per day in the epochs between the eruptions and several exposures per day during the eruptions. The individual exposures varied in length between 200 and 1000 seconds. Stacked image from the XRT ( 160 ks, see top left panel EDF 5) show that only Swift J0230+28 is detected within the NICER field of view, enabling detailed analyses of NICER spectra with no concerns for contamination by other sources.
We started our data analysis by downloading the data from public HEASARC archive (https://heasarc.gsfc.nasa.gov/docs/archive.html). We essentially followed the same reduction procedures as outlined in-detail in (?, ?). The cleaned events lists were extracted using the standard NICER Data Analysis Software (HEASoft 6.29) tasks nicercal, nimpumerge, and nicerclean The latest NICER calibration release xti20221001 (01 October 2022) was used. The cleaned event files were barycenter-corrected using the barycorr ftools task. Swift J0230+28 ’s coordinates (J2000.0): (02:30:17.1, +28:36:04.) were used along with refframe=ICRS and ephem=JPLEPH.430. The Good Time Intervals (GTIs) were extracted with the nimaketime tool using the default filters: nicersaafilt=YES, saafilt=NO, trackfilt=YES, ang dist=0.015, st valid=YES, cor range=“*-*”, min fpm=38, underonly range=0-200, overonly range=“0.0-1.0”, overonly expr=“1.52*COR SAX**(-0.633)”, Conservative elv=30 and br earth=40 were used to avoid optical loading by reflected light.
1.3.1 Converting from NICER count rate to luminosity
We computed the fluxes on a per GTI basis using the following procedure:
-
1.
First, we extracted time-resolved NICER spectra of the source and estimated background spectra using the 3c50 model (?). Corresponding response files (arf and rmfs) were extracted using the nicerarf and nicerrmf tools.
-
2.
Because the 0.8-1.3 keV bandpass is occasionally dominated by the systematic residuals we fit each of the above spectra in the 0.3-0.8 keV with a thermal model (tbabs* zashift*diskbb) in XSPEC (?). Following the recommendation by (?) we only consider spectra where the background-subtracted source count rate was greater than 0.25 counts/s had a signal-to-noise ratio (source background-subtracted over background) higher than three.
-
3.
Using the above spectral fitting we estimated an epoch-dependent background subtracted 0.3-0.8 keV count rate–to–observed luminosity conversion factor which was used to compute the observed luminosities for each GTI. All GTIs with a background subtracted 0.3-0.8 keV count rate of less than 0.25 count/sec or signal-to-noise ratio was less than 3 were assigned an 0.3-0.8 keV flux upper limit of erg s-1 cm-2 (triangles in the panel middle panel of Fig. 1).
For all NICER spectral fitting in this work, we have used optimal spectral binning scheme (?), statistics, as well as an additional 1.5% systematic uncertainty. Similarly to the Swift/XRT fitting we always assume Galactic absorption value following HEASARC’s calculator.
1.4 Very Large Array (VLA)
We observed Swift J0230+28 with NSF’s Karl G. Jansky Very Large Array (VLA) on 2022 July 2 (MJD 59762), 2022 September 20 (MJD 59842), and 2022 December 20 (MJD MJD 59933). The VLA was in its highest-resolution A configuration during the first observation, its lowest-resolution D configuration during the second, and the intermediate C configuration during the third. All observations had one hour of exposure time and were conducted at a mean frequency of 10 GHz. The data were reduced in CASA (?) using standard procedures. We additionally performed amplitude and phase self-calibration on the September data. There was no detection at the position of the source in the first and third observations, with 3 upper limits, of 15 Jy and 25 Jy, respectively. However, in our second observation on 2022 September 20, we detect an unresolved radio source, with a flux density of Jy (13 detection).
1.5 Optical Spectra
1.5.1 Keck-II/ESI
On 2022 October 24.3, we obtained a medium resolution spectrum of the host galaxy nucleus using the Echellette Spectrograph and Imager (ESI; (?)) on the Keck II telescope. We used the Echelle mode and a slit width of 0.5′′, which gives an instrumental broadening of . The exposure time was 15 min. The median signal-to-noise ratio (S/N) from 4500 Å to 5600 Å is 9.
1.5.2 VLT/X-shooter
The host galaxy was also observed under DDT programme 110.2599 on 2022 November 17 with X-shooter (?) mounted on the Very Large Telescope (VLT) Unit Telescope 3 (Melipal). Slit widths of 1/0.9/0.9 arcsec were used for the UVB/VIS/NIR arms, providing a spectral resolution R = 5400/8900/5600, respectively, covering the spectral range 3500–24800 Å. Exposure times were 21497/1411/1200 seconds in the UVB/VIS/NIR arms, with an on-slit nod to facilitate sky line subtraction in the NIR arm. We reduce the data using the standard pipeline recipes within esoreflex. For the UVB and VIS arms, we use recipes for stare observations to increase the S/N. Strong, extended nebular emission from the host galaxy complicates the sky subtraction, leaving strong residuals and oversubtractions, especially in the Balmer lines. To measure the line profiles and fluxes for the diagnostic diagrams, we therefore use extractions without subtracting the skylines. In order to measure the velocity dispersion, where the emission lines are masked, we use sky-subtracted extractions. The continuum normalized spectrum in the H+[O iii] and H+[N ii] bands are shown in the bottom panel of EDF 5.
1.5.3 Continuum and emission line fitting
We measured the velocity dispersion with the penalized pixel-fitting (pPXF) software (?, ?), which fits the absorption line spectrum by convolving a template stellar spectral library with Gauss-Hermite functions. We used the ELODIE v3.1 high resolution () library (?, ?), and masked wavelength ranges of common galaxy emission lines, hydrogen Balmer lines, telluric regions, and an instrument artifact feature at an observer-frame wavelength of Å. Following previous works (?, ?, ?, ?), we performed 1000 Monte Carlo (MC) simulations to robustly determine .
The Keck spectrum has a relatively low signal-to-noise ratio (a factor of 2 smaller than that of the X-shooter data), as well as covering a limited wavelength range (4500 – 5600 Å compared to 3500–9000 Å for X-shooter). Both of these factors can introduce significant systematic uncertainties related to template mismatching and spurious results in the MCMC step. For these reasons, we use the X-shooter data to measure the velocity dispersion and estimate the black hole mass.
We measure a velocity dispersion of 87 2 km s-1 which along with the - relation (?) allowed us to estimate a black hole mass of log = .
Emission/absorption line fluxes and equivalent widths (EW) were measured using continuum-normalized versions of the ESI and X-shooter spectra. We include a low order polynomial for the continuum, and single Gaussian components for each emission line, including H, H, [O iii], [O i], and the [N ii] and [S ii] doublets. No broad emission line components are evident. Typical line widths for the narrow components are 150–200 km s-1, and some lines show weak asymmetries (where the lines are skewed to the blue wing). The line measurements and their ratios are used to locate the host galaxy nucleus on diagnostic BPT and WHAN diagrams, as shown in the top and middle panels of EDF 6. From the X-shooter spectrum we also measure the H Lick absorption index (?), which can be used to identify quiescent Balmer strong and E+A (post-merger) galaxies. We plot Swift J0230+28 among the SDSS population (grey background points), and also include measurements from the ZTF TDE sample (?) and QPE host galaxies (?) in the bottom right panel of EDF 6. Swift J0230+28 is classified as a QBS galaxy, which comprises less than 2.3% of the total galaxy population. This is consistent with the over-representation observed in the QPE host population (?).
2 Time-resolved X-ray analyses
2.1 X-ray light curve
Swift J0230+28 showed phases of high (detection) and low (non-detections) activity over the course of our Swift/XRT monitoring (Fig. 1). A quick visual inspection suggests that these eruptions repeat roughly in the order of weeks. To test for a quasi-periodicity we extracted a Lomb-Scargle Periodogram (LSP) of the Swift/XRT 0.3-2.0 keV light curve following the description in (?, ?), which is shown in Fig. 2. Not surprisingly, the LSP shows two consecutive bin peaks around 21-23 days, with the bin with highest power at 21.8 days. The combined two bins their FWHM result in a peak period of days. Therefore, the LSP confirms the quasi-periodic nature of Swift J0230+28’s eruptions.
The eruptions in Swift J0230+28 are apparently asymmetric, with slower rises than decays. In order to quantify such asymmetries, we fit the six best-sampled eruptions, namely around E3, E4, E5, E6, E10, E11, with an asymmetric Gaussian function ) (?), where are the equivalent positive/negative . We use either the NICER or the Swift light curve depending on which had a better sampling of the eruption’s shape at the given epoch. In the left panel of EDF 5 we show the best-fitted asymmetric Gaussian to the six eruptions. In the right panel, we quantify the asymmetry in the eruptions by plotting the ratios: which vary between to , and show a median value of , confirming that the eruptions are asymmetric, with slight slower rises than decays. The best-fitted parameters for the profile fitting are shown in Supplementary Information Table 1.
2.2 X-ray spectra
The high count rate resulting from the high effective area of NICER, allows for detailed time-resolved spectral analyses, not possible with Swift/XRT. First, we stack NICER data of detected epochs in bins of 1 day, each spectra/bin having between 300 and 9000 counts. The energy range in which the source is detected above the background varies depending on the phase of the eruption; however, at all epochs, it is detected at least up to 0.8 keV; hence to measure luminosities and temperatures, we perform the fitting procedures described in 1.3.1 in the 0.3-0.8 keV band. The temperature varies by a factor of two, while the luminosity (in the 0.3-0.8 keV band) varies by a factor of 10 between erg s-1 and erg s-1.
The resulting values are shown in Extended Data Table 2. The evolution of the temperature as a function of time is shown in the left panel of Fig. 4; the vertical dashed line shows the peak of each eruption (as fitted in 2.1), in the left panel, shows luminosity as a function of temperature. At each eruption, the temperature starts 100 eV and continuously increases up to 200 eV at the decays; interestingly, the temperature does not peak at the luminosity peak but instead peaks at the decay phases. Despite the absence of a clear “hotter when brighter” trend in the temperature evolution, we employed the linmix package (?) to fit the relationship between the two parameters and still found a positive correlation in the form of , although the large scatter is likely driven by the hotter temperatures at the decay phases.
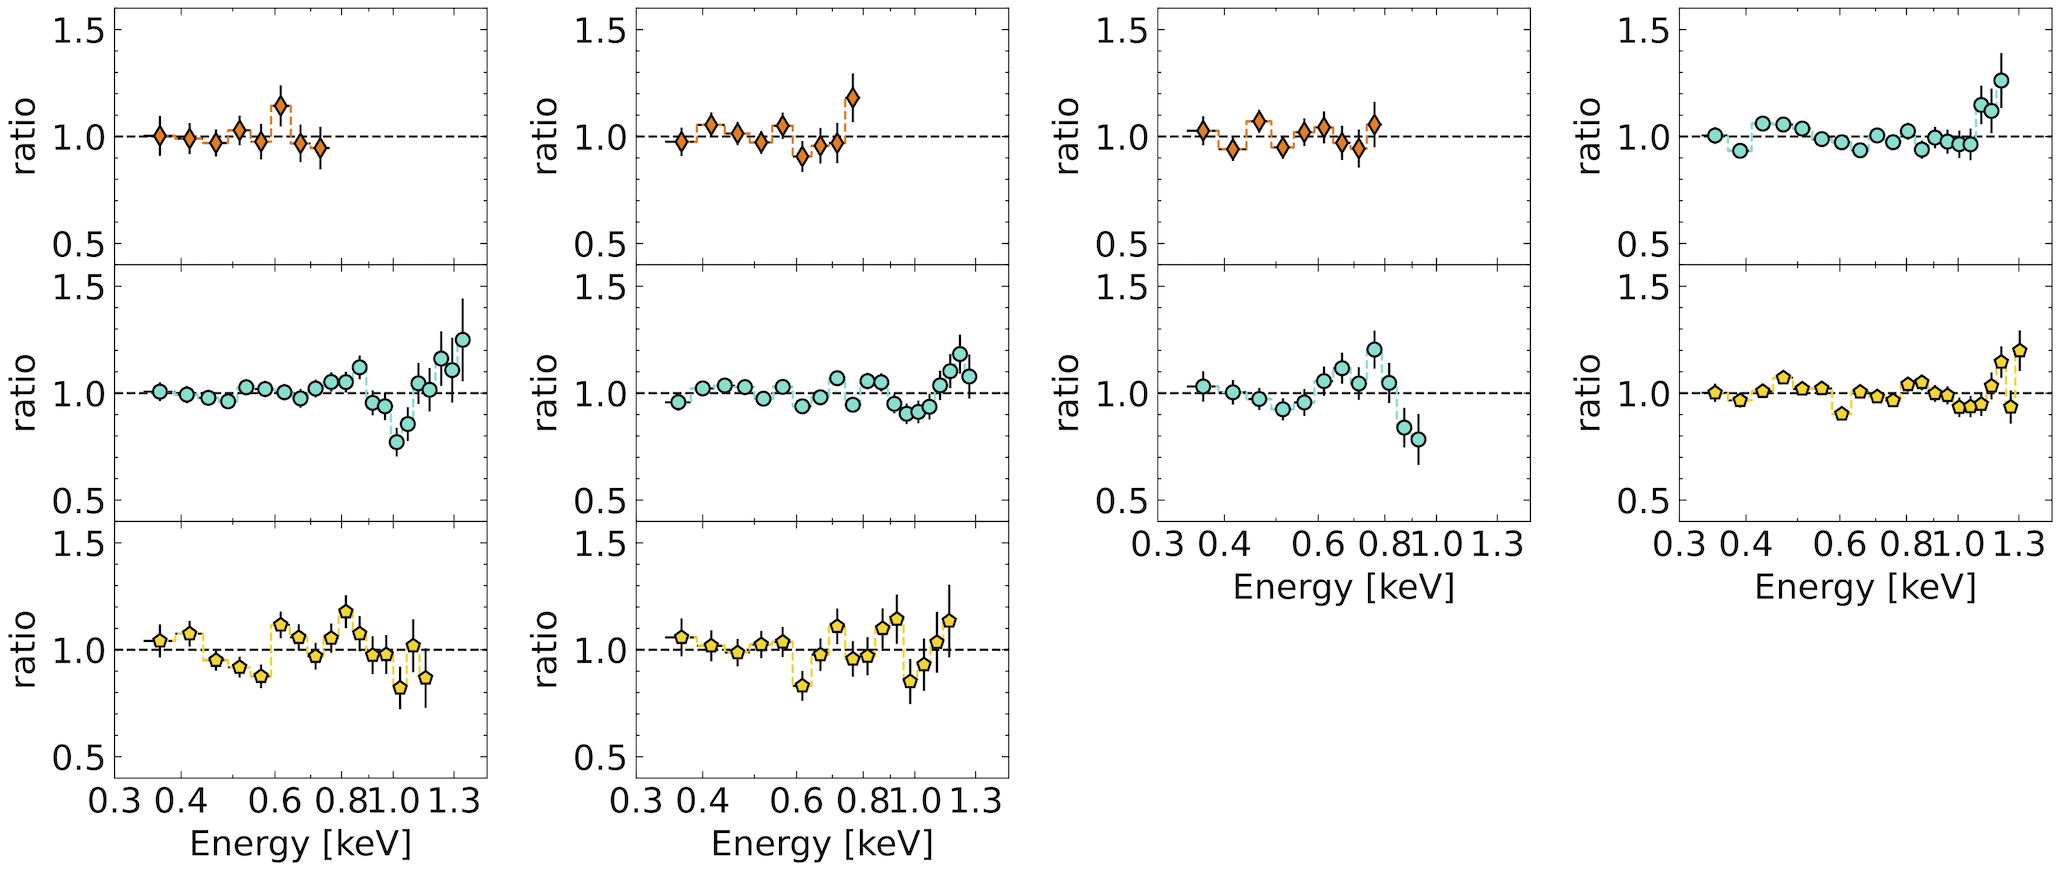
To increase the signal-to-noise ratio and probe the spectra shape at energies higher than 0.8 keV we divided each of the four eruptions probed by NICER (namely, those around E4, E5, E6 and E10) in three phases, rise, peak and decay, and produce one stacked spectra for each of the phases of the eruptions, the resulting spectra have between 2000 and 20000 background-free counts, an are detected above background at higher energies, up to 1.4 keV for some peak and decay spectra. We fit the resulting high signal-to-noise ratio spectra assuming the same model as before (i.e., TBabszashiftdiskbb) which results in / varying between and , with residuals present both at the softest end of the spectra and around 1.0 keV for some peak and rise spectra. We then added an intrinsic absorption component component at the redshift of the source (i.e. TBabszTBabszashift(diskbb)), such absorption takes care of the residuals at the softer energies, and results in better fitting for all spectra, with / between and , the best-fitted intrinsic column density was cm-2 in all spectra.
We show the stacked spectra and best fit model in Fig. 3, while the respective residuals are shown in EDF 3. In a few of the spectra, e.g. some of the peak phases show an absorption-like residuals around 1.0 keV while in others, e.g. some of the decay spectra, the residuals are randomly distributed. A detailed study on whether such residuals are intrinsic to the source, e.g. an absorption line like the one detected in TDE ASASSN-14li (?) or merely an instrumental/systematic residual from the NICER instrument is beyond the scope of this study, and will be presented in a separated study in the case the former is confirmed.
We also tested alternative models to the continuum, changing dikbb for a phenomenological power-law (powerlaw) or a single temperature blackbody (blackbody) results in a worse fit. A thermal bremsstrahlung model (bremss), however, results in just a slightly worse fit as compared to diskbb, in terms, /, in some of the spectra, and has similar fitting statistics in others. The ratio between the best-fitted bremsstrahlung’s plasma temperature () and the inner disk temperature () is consistently , i.e. varied between 200 eV and 400 eV, while the same relation with the luminosity is observed. We also attempt to fit a model with two continuum components, by adding a powerlaw to the thermal emission (i.e., TBabszTBabszashift(diskbb +powerlaw)), however, this does not improve the fit quality and the best-fit powerlaw normalization is in most cases negligible. Given that the better overall fit is achieved with TBabszTBabs zashiftdiskbb which is the final model for Swift J0230+28, and report in Extended Data Table 1 the best fitted parameters of the stacked spectra.
2.3 Eruptions Energetics
We estimated the energy released by individual eruptions by integrating their Swift/XRT light curves, an order-of-magnitude estimate resulting in few erg per eruption depending on the duration/amplitude of the eruption. Assuming a 10% efficiency ( = 0.1) in the mass to energy conversion and assuming that the eruptions are powered by accretion, results in few accreted per eruption . If the eruptions started somewhere after 8 January 2022 (MJD 59587, see “Constraints on the start of the eruptions”) then the maximum total mass accreted is .
3 UV/optical and radio counterparts
Our three VLA observations, show two non-detections and one detection, the radio detection coincides with the rise of E5 eruption, while the non-detections coincide with the X-ray quiescent epochs, one between E1 and E2 and the other between E9 and E10 as can be seen by Fig. 1. The three radio images are shown in EDF 4.
The Swift/UVOT shows no variability that is more significant the from the pre-eruption host galaxy level, as can be seen in Fig. 1. From the observations we can compute an upper limit on the UV/optical variability, the UV W1 in particularly allows for the deepest constraint. The derived observed upper limit of erg s-1. In TDE studies the UV/optical integrated emission () is estimated from the fit of a blackbody function to the UV/optical broad-band SED, and the UV/optical to X-ray luminosity ratio () is the parameter of interest, to study the SED shape. Assuming a typical temperature found in UV/optical component of TDEs, around 20,000 Kelvin (?), the UV W1 upper limit translates into a . This means, that at the peak of the X-ray eruptions . In the stacked spectra fitting (see §2) we found evidence for a very small intrinsic column density at the maximum cm-2, assuming a standard gas-to-dust ratio (, (?)), which translates to a maximum dust extinction of , assuming a standard extinction law (?), the intrinsic extinction-corrected emission in the band can be at maximum a factor of higher. This just slightly increases the upper limits on the and integrated UV/optical emission to erg s-1 and , respectively, meaning that extinction cannot be the cause of UV/optical faintness, such faintness is an intrinsic characteristic of Swift J0230+28 eruptions.
4 The host galaxy
The position derived from XRT for Swift J0230+28 is 0.2′′ away from the photometric center of the nearby spiral galaxy 2MASX J02301709+2836050 located at 165 Mpcs. The galaxy shows prominent blue spiral arms and a redder bright nuclear core (see the top right panel in EDF 5).
The host galaxy does not appear in large AGN catalogs (?, ?). There is no previous X-ray detection at the position of this galaxy: the X-ray upper limit server (?) returns only upper limits, from XMM-Newton Slew Survey, ROSAT all-sky survey (RASS) and previous observations by Swift/XRT (see exact values in section §5). The galaxy shows no excess in the infrared bands that could indicate the presence of a hot dust emitting ‘torus’: the Wide-field Infrared Survey Explorer (WISE, (?)) infrared W1 - W2 color 0.1 does not pass standard AGN selection criteria (?), instead is consistent with pure stellar population emission. The NeoWISE (?) light curves from 2014 to 2021 show no significant variability (). Our recently obtained optical spectra show no signs of broad emission lines. Together, these multi-wavelength properties exclude the existence of a bright AGN (e.g., Seyfert-I or Quasar-like) in Swift J0230+28’s host.
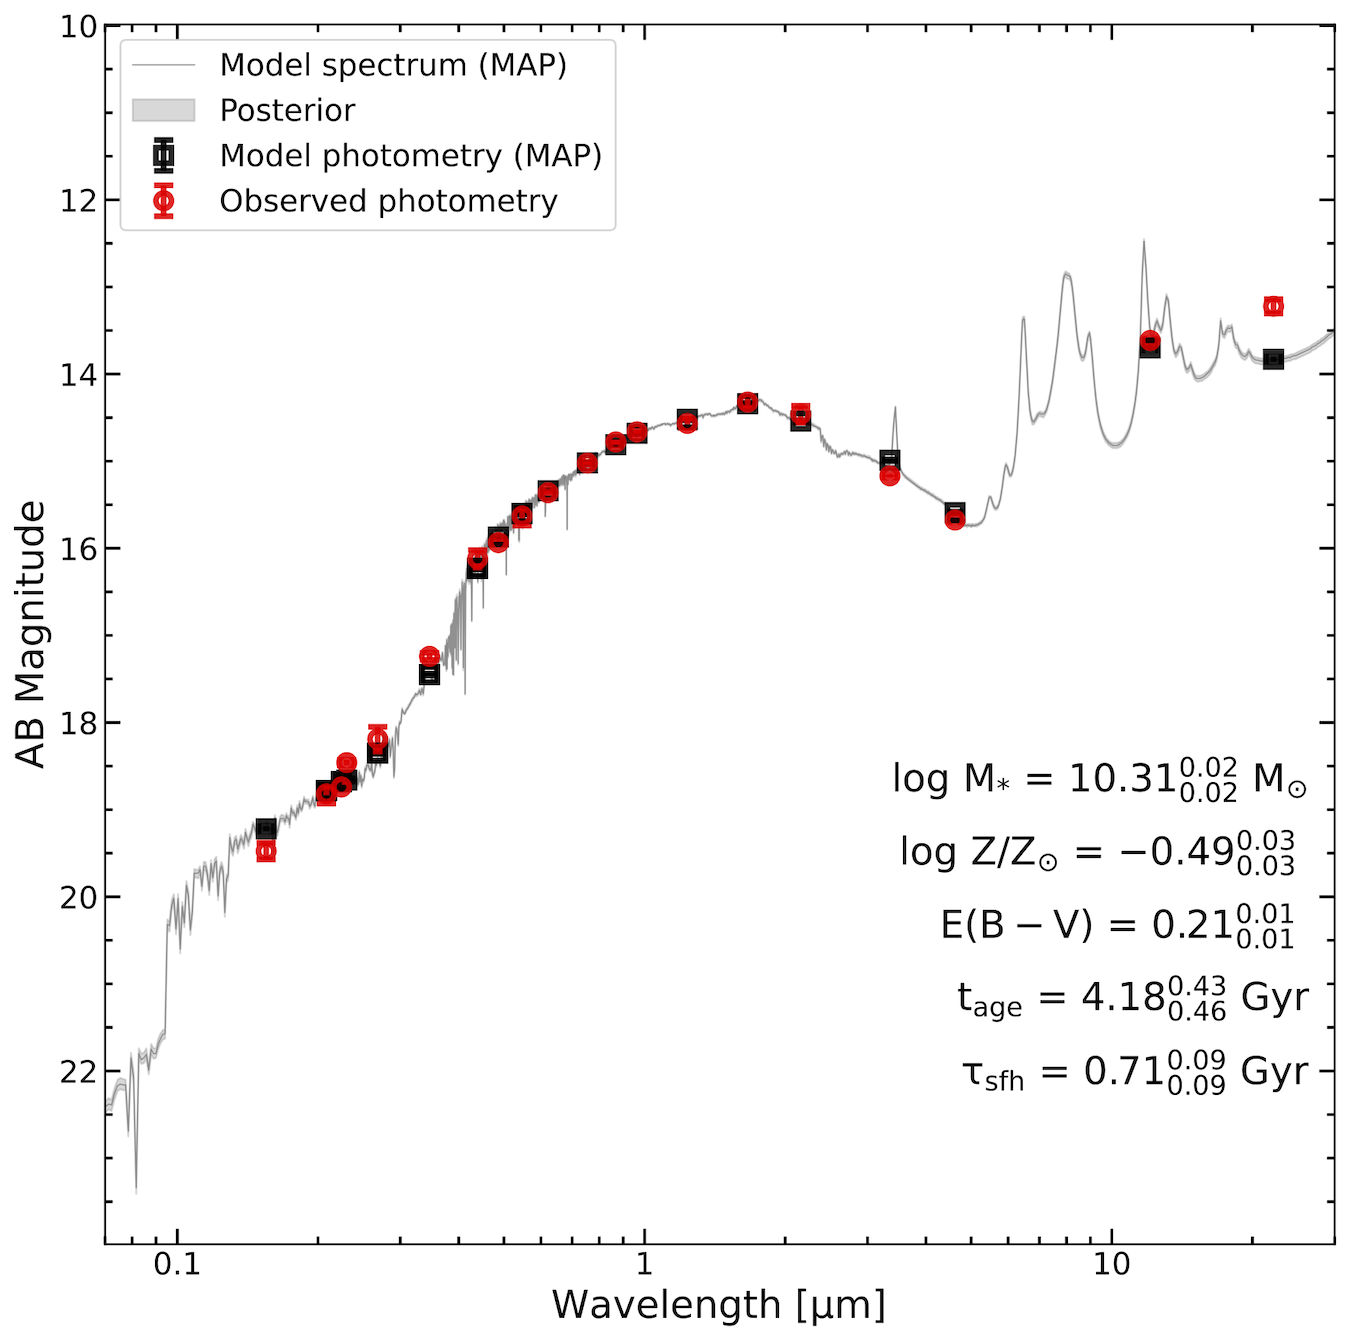
The narrow emission lines measured on the ESI and X-shooter spectra can be used to locate the host galaxy nucleus on diagnostic BPT (?) and WHAN (?) diagrams to investigate the ionization mechanism producing the lines, shown in the top and bottom panels of EDF 6. Swift J0230+28’s host is located above the theoretical upper limit for pure star-forming galaxies (?) – meaning an additional ionizing mechanism is necessary to produce these line ratios – and around the empirical separation between Seyfert and low-ionization nuclear emission-line region (LINER) (?, ?) on both [N ii] and [S ii] diagrams. The WHAN diagram (?) can be used to classify the nucleus further: the low EW H results in a weak-AGN (wAGN) classification. In general, the multi-wavelength properties agree that Swift J0230+28’s may host (or have hosted) a low-luminosity AGN (LLAGN). We gathered archival photometric data on the host galaxy: in the UV and optical from the UVOT (see 1.2), in the optical and near IR (, , , and bands) from the PAN-STARRS survey (?), near IR (, , and bands) from the 2MASS survey (?) and in the mid-IR (, , , and bands) from the WISE survey (?). While gathering all the photometric data, we use the values extracted from aperture sizes as close to the Kron radius (12”) as possible for all the surveys. To estimate the host galaxy properties, we model the resulting spectral energy distribution (SED) using the flexible stellar population synthesis (FSPS, (?)) module. We use the Prospector (?) software to run a Markov Chain Monte Carlo (MCMC) sampler (?). We assume an exponentially decaying star formation history (SFH), and a flat prior on the five free model parameters: stellar mass (), stellar metallicity (), extinction (assuming the extinction law from (?)), the stellar population age () and the e-folding time of the exponential decay of the SFH ().
The observed and modeled SEDs are shown in EDF 7, alongside the best-fitted parameters and their uncertainties. Of a particular interest is the total stellar mass ( ) that can be used to obtain an order of magnitude estimate of using (?) - relation, we obtain (/), where the uncertainty accounts for both the statistical and the spread of the scaling relation, but it is dominated by the former. The resulting value is consistent, within the error bar, with the one obtained from the - relation. We adopt the value obtained from , given the smaller spread and systematically more consistent values obtained by the - (?, ?).
Using a bolometric correction (?) and the measured extinction corrected [O iii]5007Å luminosity of erg s-1 we estimate the upper limit for bolometric luminosity of this LLAGN to be erg s-1. From the 2.0-10.0 keV luminosity upper limit (erg s-1, see Estimating the XRT X-ray upper limit”) and (?) bolometric correction we also estimated an upper limit of erg s-1. Given that the [O iii] derived value represents the mean accretion rate in the last few Myr (which represents the time to ionize the entire Narrow Line Region, NLR) and that star-formation likely contributes to a considerable fraction of its luminosity, while the hard X-ray (2.0-10.0 keV) is a more precise estimate of the current accretion state, we adopt erg s-1 as our estimate of the upper limit for the bolometric luminosity of the LLAGN in Swift J0230+28’s host. Combined, the measured and result in an Eddington ratio 0.002, confirming the extremely low accretion rate of Swift J0230+28’s host galaxy previous to the eruptions.
5 Constraints on the start of the eruptions
We searched for archival X-ray observations at the Swift J0230+28’s position in order to constrain the start of the eruptions: there is no previous X-ray detection at this position. The X-ray upper limit server (?) returns a 0.2-2.0 KeV flux from a 1990 330s observation of ROSAT all-sky survey (RASS, (?)), and erg s-1 cm-2 from a 2005 9s exposure of the XMM-Newton Slew Survey (?). The field containing the position of Swift J0230+28 was observed by XRT between 1-11 December 2021 with a three-day cadence and between 24 December 2021 and 8 January 2022, also at a three-day cadence. There were no detections during this early monitoring, and all the upper limits were below the flux level of the first detection. The non-detections during this early XRT monitoring put a hard constraint on the start of the QPEs, it is unlikely that no eruption would be detected during high-cadence month-long monitoring if they had already started. In order to quantify this likelihood, we perform the following series of simulations:
-
•
We shifted the exactly known XRT light curve (shown in Fig. 1, MJD 59752-59983) to the epochs of the early XRT monitoring (shown in red in EDF 1), maintaining its cadence and gaps.
-
•
We checked if at least one of the early time observations matched a detection of the simulated light curve, given a day range.
-
•
Repeated the process 10000 times but randomly changed the relative shift between the simulated light curve and the early monitoring observations in each iteration, ensuring the epochs of simulated light curves included the epochs of the early monitoring.
-
•
Checked how many of these 10000 simulations have at least one detection.
From the simulations, we found that 88% of the time, we would have made at least one detection if the known light curve (series of eruptions) were present during the early monitoring; this means that the probability of not observing such eruptions in the early monitoring is only 12%. However, we note that this is driven mainly by the large period without long-lived (several days long) eruptions between MJD 59880 and MJD 59940. If the simulated light curve had only the six first consecutive long-eruptions (from discovery up to MJD 59880), then the probability of making no detections during the early monitoring would drop to 0.1%. Therefore, we can conclude that the eruptions in Swift J0230+28 have, most likely, started between the end of early monitoring campaign and the date of the first detection (i.e. between 8 January and 22 June 2022). In EDF 1, we show the long-term light curve with all the archived non-detections as a function of time.
[] Phase Start End /d.o.f (MJD) (MJD) [erg s-1 ] [ cm [eV] Rise-E4 59814.2 59818 42.80 0.11 3 124 5.1/6 Peak–E4 59819.3 59821.9 42.96 0.03 2 177 28.5/19 Decay-E4 59823.1 59824.6 42.87 0.05 3 172 24.7/14 Rise-E5 59841.9 59844.2 42.33 0.06 1 140 6.4/6 Peak–E5 59844.4 59846.1 42.74 0.02 1 202 29.6/17 Decay-E5 59846.1 59846.6 42.53 0.02 1 209 14.4/13 Rise-E6 59850.7 59853.9 42.52 0.09 2 131 5.9/6 Peak-E6 59855.8 59858.9 42.86 0.07 3 149 17.2/9 Peak-E10 59949 59951.2 42.93 0.03 1 165 25.7/16 Decay-E10 59951.4 59953.5 42.84 0.02 1 214 27.9/18
[] Source eRO-QPE2 GSN 069 RX J1301 eRO-QPE1 Swift J0230+28 Mean recurrence time 2.4h 9h 4.7h 18.5h 22d Deviation from periodicity Pattern ‘long-short’ irregular Absolute 2.3h-2.7h 8.5h-9.5h 3.5h-5.5h 12h-24ha 18d-25db Fraction 10% 20% 30%-50%a 30%b X-ray luminosity at peakc (erg s-1) Amplitudec,d (count rate) 10 20 15 100-200 100 Temperature evolution per eruption cool warm cool cool warm Eruption shape symmetric symmetric symmetric asymmetric (longer decay than rise) slight asymmetric (longer rise than decay) log () 5.0 0.5 6.0 0.5 6.6 0.4 5.8 0.5 6.6 0.4
Acknowledgments.
During the refereeing process of this manuscript, Evans et al. 2023
(?), published a paper presenting a focused investigation of Swift J0230+28. The author’s data set does not include our NICER and radio (VLA) data, but their science case and physical interpretation are similar to ours.
MG and SG are supported in part by NASA grants 80NSS23K0621 and 80NSSC22K0571. DRP was supported by NASA grant 80NSSC22K0961 for this work. DRP and RR acknowledge support from NASA grant 80NSSC19K1287. MZ was supported by the GACR Junior Star grant no. GM24-10599M. TW warmly thanks the Space Telescope Science Institute for its hospitality during part of this work. PS has been supported by the fellowship Lumina Quaeruntur No. LQ100032102 of the Czech Academy of Sciences. This work was supported by the Ministry of Education, Youth and Sports of the Czech Republic through the e-INFRA CZ (ID:90140) and LM2023047 (VK). VW was supported by the Charles U. research programme PRIMUS 23/SCI/019. R.A acknowledges support by NASA through the NASA Einstein Fellowship grant No HF2-51499 awarded by the Space Telescope Science Institute, which is operated by the Association of Universities for Research in Astronomy, Inc., for NASA, under contract NAS5-26555. This work was supported by the Australian government through the Australian Research Council’s Discovery Projects funding scheme (DP200102471). ERC acknowledges support from the National Science Foundation through grant AST-2006684, and from the Oakridge Associated Universities through a Ralph E. Powe Junior Faculty Enhancement award. ECF is supported by NASA under award number 80GSFC21M0002. KDA acknowledges support from the National Science Foundation under Grant No. AST-2307668.
The authors wish to recognize and acknowledge the very significant cultural role and reverence that the summit of Mauna Kea has always had within the indigenous Hawaiian community. We are most fortunate to have the opportunity to conduct observations from this mountain. NICER is a 0.2-12 keV X-ray telescope operating on the International Space Station. The NICER mission and portions of the NICER science team activities are funded by NASA. Based on observations made with ESO Telescopes at the La Silla Paranal Observatory under programme ID 110.2599. The National Radio Astronomy Observatory is a facility of the National Science Foundation operated under cooperative agreement by Associated Universities, Inc.
Author contributions: MG led the overall project, wrote a large portion of the paper, performed part of the data analyses, and was the PI of the NICER DDT proposals. DRP reduced the NICER data and performed part of the X-ray analyses. MZ and ERC led the theoretical/modeling portion of the project and wrote parts of the paper. VJ, PS, and VK contributed to the modeling/theory portion of the paper. TW was the PI of the VLT DDT program, and wrote part of the paper. SVV, KDA (PI), and JMJ are the team leads of the VLA program; SVV performed the radio data reduction and analyses. RR, KG, and ECF performed the NICER observations. SG, FT, YY, and RA contributed to the data gathering, analyses, and interpretation, as well as paper writing and discussion.
Competing interests: The authors declare that there are no competing interests.
Data and materials availability: All the NICER and Swift data presented here are public and can be found in the NASA archives at the following URL: https://heasarc.gsfc.nasa.gov/cgi-bin/W3Browse/w3browse.pl. The VLA data are available from the NRAO archives, at https://data.nrao.edu/portal/#/. X-shooter spectra will be avalible at ESO archive after the 12 months proprietary is passed. Keck/ESI will be shared under request to the corresponding authors. The GRMHD simulation described as part of the “Accretion disc – perturber interaction” section in Supplementary Section, is available upon request to the corresponding author. The data underlying the multi-wavelength light curves presented in Fig. 1 are available at https://zenodo.org/records/10238766.
Supplementary Information
Quasi-periodic erupters and Swift J0230+28
In the last few years, quasi-periodic X-ray eruptions (QPEs) were discovered from the nuclei of some nearby galaxies (?, ?, ?). Their emission is characterized by soft X-ray ( keV) recurrent eruptions with amplitudes in 0.3-2.0 keV count-rate as high as (?, ?) compared to their quiescent level. These QPE sources show no accompanying variability in the optical and UV bands, and their host galaxies show no clear signs of recent nuclear activity (e.g., hard X-ray emission or IR colors and variability), including the absence of optical broad emission lines in their optical spectra. Furthermore, all QPEs are hosted by black holes with masses . Four QPE sources are now confirmed: GSN 069 (?), RX J1301.9+2747 (hereafter RX J1301, (?)), eRO-QPE1 and eRO-QPE2 (?). Here we do not include XMMSL1 J024916.6-041244 (?), because only 1.5 eruptions were detected; hence it is only a QPE candidate. The mean recurrence time between eruptions varies from 2.4 hours ( 9 ks) for eRO-QPE2 up to 18.5 hours ( 70 ks) for eRO-QPE1. The duration of the eruptions varies between 0.3 hours (1.2 ks), for RX J1301 and 7.5h (27ks), for eRO-QPE1. The amplitudes (in the 0.3-2.0 keV band) of the eruptions vary between 10 for eRO-QPE2 and 100-200 for eRO-QPE1. At their peak, their 0.3-2.0 keV luminosity varies between erg s-1 to erg s-1.
Although their eruptions are recurrent and quasi-periodic, they show a significant deviation from a strictly periodic signal. GSN 069 and eRO-QPE2 exhibit an oscillating ‘long/short’ behavior of the recurrence time between eruptions, where the long and short recurrence time vary by from the mean value, with the short/long recurrence time of 8.5h/9.5h for GSN 069 and 2.35h-2.75h for eRO-QPE2. In the case of RX J1301, it is still not clear whether such ‘long/short’ alternating behavior is present; however, the deviation from the mean period is even larger with recurrence time as long as 5.5h (20ks), and as short as 3.5h (13ks) observed (?), which implies a deviation from the mean recurrence time that can be as large as 25%. In the case of the longest and brightest of the QPE sources, eRO-QPE1, the instability in the recurrence times is even more extreme (?); it can be as short as 12h and as long 24h, with chaotic variability in the recurrence times and no clear ‘long/short’ alternating behavior pattern. This implies a deviation from the mean recurrence time that can be as large as 50% (see, e.g., Extended Data Figure 8 and the bottom panel of Figure 1 in (?)). This case is even more extreme, given that some of the eRO-QPE1’s eruptions are not isolated, but instead show multiple overlapping eruptions with different amplitudes (?). A common characteristic of all the QPEs is that the rise is harder than decay (?, ?); the four sources show an increase in their temperature from about 50-70 eV up to 100-250 eV at the peak of the eruptions, which evolves back to the low temperatures during their decay, i.e, a cool warm cool temperature evolution in each eruption.
Swift J0230+28 shares several defining characteristics of QPE sources: i) recurrent quasi-periodic soft X-ray eruptions (see ‘X-ray light curve’ in Methods); ii) no UV/optical variability counterpart to the X-rays is observed (see ‘UV/optical and radio counterparts’ in Methods); iii) it originates from the nucleus of a galaxy with no clear sign of strong multi-wavelength AGN emission (see ‘Host galaxy’ in Methods); iv) it is hosted by a low mass black hole, ; v) the luminosities at the peak of the eruptions are between erg s-1.
The most obvious difference between Swift J0230+28 and the four known QPE sources is the recurrence time. The peak-to-peak separation between the eruptions in Swift J0230+28 varies between 18-25 days (1300-2160 ks), with a mean recurrence time of 22 days, which is a factor of 25 longer than the longest QPE source. However, it should be noted that all four known QPE sources were discovered either in the light curve of a long XMM-Newton stare observation (within a single OBS ID, which are at most 120ks long (?, ?)) or by consecutive 4h separated observations from one of SRG/eROSITA all-sky surveys (?). Both methods are biased to discover sources with recurrence times that are shorter than a days. Therefore, it is not obvious that the longer time-scale of Swift J0230+28 signals an intrinsic difference between Swift J0230+28 and the known QPE population.
Unlike most of the other QPE sources, Swift J0230+28 is not (yet, given the lack of XMM-Newton observation) detected in the quiescent phase (between eruptions), and the derived upper limit on the quiescent luminosity leads to a lower limit on the amplitude to be for the strongest eruptions. Given the upper limit on the flux of the quiescent state, only XMM-Newton may be able to detect it or derive a deeper limit; however, at the time of this publication Swift J0230+28 was not yet observed by XMM-Newton.
To highlight the similarities in behavior and differences in time-scales between previous known QPE sources and Swift J0230+28, in Extended Data Figure 8 we show the light curves containing six consecutive eruptions for the source with the shortest recurrence time (eRO-QPE2), the one with the longest recurrence time (eRO-QPE1), and Swift J0230+28. While six eruptions occurred in a period of less than one day in eRO-QPE2 and less than one week in eRO-QPE1, four months of observations were necessary to sample six eruptions in Swift J0230+28.
Another distinction between Swift J0230+28 and the four known QPE sources is the spectral evolution. Swift J0230+28 is softer during the rise and harder during the decay, which runs contrary to the behavior of the four known QPE sources. The temperature evolution in each of Swift J0230+28’s eruptions shows an increase from 100 eV at the rise to 200 eV at the decays, but with no decrease in the temperature in a single eruption (see ‘X-ray spectra’ in Methods), i.e. a cool warm temperature evolution in each eruption; while all the four known QPEs sources show a decreasing temperature during their decays.
Another difference between known QPEs sources and Swift J0230+28 is the shape of the eruptions. While QPE sources show either a quasi-symmetric eruption (?) or a faster rise and a slower decay (?, ?), Swift J0230+28 shows the opposite behavior: the rise phase is longer than the decay phase (see ‘X-ray light curves’ in Methods).
To date, no systematic and simultaneous radio and X-ray monitoring campaign of QPE sources was performed, however GSN 069 (?) appears to show weak but steady radio emission. The same appears to be the case for eRO-QPE2, while eRO-QPE1 is currently undetected in radio (Arcodia et al., in prep.). RX J1301, however, shows radio emission that is variable by more than a factor of 2.5 over a few days (?). Radio variability of the same amplitude as in Swift J0230+28– transient and by a factor of at least 6 – was not yet observed for the known QPE sources. However, the lack of extensive homogeneous monitoring and the different time scales involved do not allow us to confirm whether the radio variability is an intrinsic difference between Swift J0230+28 and the QPE population. In summary, although some differences in the spectral evolution and eruption shape are present, Swift J0230+28 shows most of the defining characteristics of QPE sources; it shares many more similarities than differences with QPE sources, as well as much more similarities with QPE sources than any other known class of transient sources, including the repeating nuclear transient (RNTs) or also called repeating partial TDEs (repeating pTDEs), as we will discuss in ‘Repeating Nuclear Transients and Swift J0230+28’. In Extended Data Table 2 we compare the properties of Swift J0230+28 with those of individuals QPE sources. If we consider Swift J0230+28 to be a QPE source, some tentative correlations seem to be present in the overall population, as shown by Extended Data Figure 8. The recurrence time and the duration of the eruptions seem to correlate positively, with a duty-cycle (duration/recurrence time) equal to . A positive correlation also appears to be present between the recurrence time and amplitude of the eruptions. However, the mean recurrence time does not seem to be correlated with black hole mass.
Repeating Nuclear Transients and Swift J0230+28
A distinct category of nuclear transients exhibiting a non-terminal evolution are known as repeating nuclear transients (RNTs), alternatively referred to as repeating partial tidal disruption events (Repeating pTDEs) based on the leading theoretical interpretation (?, ?, ?). Three clear cases of RNTs are known: ASASSN-14ko (?), AT2018fyk (?), and eRASSt J045650.3-203750 (hereafter eRA J0456-20, (?)). These transients exhibit recurrent outbursts that each individually resembles a TDE, occurring at varying intervals of 114 days up to 1200 days. All three sources display strong UV/optical emission ( erg s-1), and their X-ray spectra are distinct from the soft spectra. Furthermore, their individual outbursts are characterized by significant asymmetry, with decay times much longer than their rise, typical of all X-ray and optically selected TDEs (?, ?). The black hole masses of these RNTs lie in the range of .
ASASSN-14ko, initially discovered at optical wavelengths, exhibits recurring TDE-like UV/optical flares separated by an average period of approximately 114 days, with a peak integrated UV/optical luminosity of erg s-1. These repeating flares have been observed since at least 2014 with minor variations in the observed period (?, ?, ?). The X-ray flares are much fainter at their maximum, reaching erg s-1, while their periodicity differs from that of the optical/UV flares. Moreover, they seem to be delayed in relation to the optical/UV peaks. The X-ray spectra exhibit both a thermal and a coronal component.
AT2018fyk, another optically discovered nuclear transient (?), was initially identified as a regular TDE with a peak of approximately erg s-1 and a peak 0.3-10 keV X-ray luminosity of a erg s-1. Initially, it displayed a thermal X-ray spectrum, but around 200 days after the optical peak, it underwent a spectral transition to a corona-dominated state (?). The transient followed the expected decay characteristic of a TDE and was not detected by XMM-Newton and Chandra around 700 days after the peak. However, at approximately 1200 days after the first peak, it exhibited a second TDE-like outburst with a dramatic brightening in both UV/optical and X-rays (?).
eRA J0456-20, discovered by SRG/eROSITA as an X-ray nuclear transient accompanied by UV emission, exhibits a repeating pattern at approximately 220-day intervals. The 0.3-10.0 keV luminosity during its first flare was a erg s-1, but it displayed a much stronger variation in both the period and luminosity compared to ASASSN-14ko. Similar to the other RNTs, its X-ray spectra comprise both thermal and corona components (?).
The only shared feature between RNTs and Swift J0230+28 is their repetitive phases of activity followed by periods of quiescence. However, they differ significantly in every other aspects, namely: i) RNTs exhibit much brighter 0.3-10.0 keV X-ray luminosities ( erg s-1) compared to Swift J0230+28 and most QPEs at peak; ii) While RNTs show more prominent brightness in the UV/optical range than in X-rays, Swift J0230+28 does not exhibit any detected UV/optical emission; iii) RNT’s s demonstrate highly asymmetric time evolution (except for eRA J0456-20), resembling TDEs with rapid rises and much slower decays, while Swift J0230+28’s eruptions have a slightly slower rise than decay; iv) Unlike Swift J0230+28 and most QPEs, RNTs do not display a purely soft/thermal X-ray spectrum.
The much higher luminosities of RNTs, both in the UV/optical bands and in the X-rays, as compared to Swift J0230+28, has also a great impact on possible physical interpretations, given that, assuming that the periods of high activity are accretion-driven, the large difference in luminosity means a large difference in the accreted mass per eruption/outburst/flare. While in RNTs a standard 0.1 efficiency on the conversion between mass and luminosity results in a considerable fraction of a solar mass ( ) accreted in each RNT’s outburst (?), an estimated accreted mass is only per eruption in Swift J0230+28. This favors a repeating pTDE interpretation for RNTs and disfavors such a model for Swift J0230+28, as will be discussed in length below.
Physical models for Swift J0230+28
Since the discovery of the first QPE source (?) and the first RNT (?) several models have been proposed to explain these phenomena. These models can be roughly divided into two classes: those involving accretion-disc instabilities and those involving bodies orbiting a massive black hole (i.e., extreme mass ratio inspirals; EMRIs). For the EMRI-related models a large diversity of possibilities for the nature of the orbiting body and the mechanism responsible emission have been presented. In the following sections we will explore each of the proposed (class of) models and their strengths and weaknesses as an explanation for Swift J0230+28’s observed properties.
Accretion disc instabilities
The analysis of the alpha-disc theory predicts regions of thermal and viscous instabilities in the configuration space of accretion disks (?, ?, ?) (it is not clear if these appear in first-principle simulations of turbulent disks, see (?)), typically parameterized by the ratio of accretion rate with respect to the Eddington rate , black hole mass and viscosity parameter . The so-called ionization instability (?) occurs in the outer regions of the accretion disc with temperature , or typical radiation wavelengths . Since we observe no variability at these wavelengths, we rule out this instability in Swift J0230+28.
The case is more subtle for the so-called radiation-pressure instability (?, ?). This can be triggered for (?) and manifests itself as an overheating and overfilling of the inner edge of the accretion disc that propagates outwards and leads to a drop in density and temperature of the accretion disc until it becomes extinct at some . Consequently, the disc is gradually refilled by the external accretion rate until the instability is triggered again. The bolometric luminosity curve has two essential components, the slow rise of the luminosity and temperature of the refilling disk, and a peak or a set of close peaks corresponding to the triggering of the instability (?, ?). Both the rise and decay of the instability peaks are roughly symmetric with the width given by the viscous time at some characteristic radius where the instability is triggered, , where is the height of the disc in the unstable region before the instability is triggered. On the other hand, the refilling timescale (the duty cycle) is governed by the viscous time at the extinction radius , where is the height of the disc at the extinction radius.
The radiation-pressure instability scenario was used to model the QPEs in GSN 069 (?, ?, ?). The models generally predicted a much longer cycle than the day QPEs, even though (?) were able to tune a number of free parameters of the disc to obtain correct light curves. Another semi-analytical disk-instability model aimed at the QPE phenomenon was recently proposed in (?). There the support by a strong toroidal magnetic field corresponding approximately to the saturation point of the magneto-rotational instability was invoked to push the radiation-pressure instability towards the inner edge of the disk and shorter time-scales. For high magnetization values, the authors were also able to roughly reproduce the phenomenology of GSN 069 and other QPEs. Generally, all of these models require either a thin radiatively efficient disk or a combination of an outer thin disk and an inner ADAF (?).
In Swift J0230+28 the timescale is longer, which makes the case of these models somewhat more favorable. However, the lack of correlated UV/optical variability in Swift J0230+28 is difficult to reconcile with the radiation-pressure-instability scenario, since one would generally expect the X-rays to be reprocessed by the outer parts of the disk. At the very least it suggests that the instability should be confined to the very inner parts of the accretion disc and that in this scenario. As a result, we can compare the rise/decay time in Swift J0230+28 days with the typical recovery time between the first 6 peaks days. This would suggest (assuming a constant ). This is in accord with standard accretion disc theory, which suggests the unstable parts of the disc are hotter and geometrically thicker. Exploring the assumption that the instability is triggered only near the inner edge and leads to a prediction of
| (1) |
The prediction of standard accretion theory in the radiation-pressure dominated region and is that . This means that the time-scales of Swift J0230+28 are in principle consistent with a radiation-pressure instability triggered at and . Nevertheless, we cannot reconcile the luminosity with the strong constraint of Swift J0230+28’s host emission before the beginning of the eruptions as well as between the eruptions. In general, for the unstable, radiation-pressure dominated inner disk to exist, the relative accretion-rate should be larger than (?), where and are the viscosity parameter and the MBH mass scaled to 0.1 and , respectively. This is already in tension with the Eddington ratio upper limit of 0.002 before the eruptions. For the radiation-pressure instability to operate, the relative accretion rate needs to be even larger, (?), which is not met even during the eruptions.
The relatively long time-scale of the eruptions suggests that the phenomenon may also be related to Lense-Thirring precession and the warping of an accretion disc misaligned with the black-hole spin (?). Recent magneto-hydrodynamics simulations by (?) and (?) suggest that the warping creates an inner sub-disk that cyclically tears off and depletes, causing a burst on the time-scale and a duty cycle of . These time-scales are an order or two too short to be consistent with the variability of Swift J0230+28 and the mass range . Furthermore, the few broad irregular peaks seen in the limited number of simulations so far do not seem to correspond well to the features of Swift J0230+28. In addition, the disk-tearing instability is associated with low-viscosity thin disks that are highly inclined () with respect to the equatorial plane (?), which is in tension with low accretion rates associated with Swift J0230+28 that are associated with geometrically thick advection-dominated accretion flows. The classical Lense-Thirring precession and nutation of accretion flows and jets (see e.g. (?)) should also reveal itself by rather mild and symmetric eruption due to the changing viewing angle (), again being in tension with sharp and asymmetric eruptions of Swift J0230+28.
Extreme mass ratio inspirals (EMRIs)
Repeating partial tidal disruption event
One proposed explanation for the origin of quasi-periodic eruptions (QPEs) is a white dwarf orbiting about a massive black hole, such that the pericenter distance of the star coincides with its partial tidal disruption radius – where a fraction of the envelope mass is removed by tides (?) (see also (?) in the context of extreme mass ratio inspirals, and (?) in the context of high-energy transients). The stripped mass then accretes onto the MBH, fueling the episodic eruptions.
In the context of Swift J0230+28, this model has a number of difficulties explaining the observations. For one, the mass of the black hole in the host galaxy has been inferred to be on the order of . Adopting a white dwarf mass of and a corresponding radius of (?) yields a tidal disruption radius of , i.e., close to a factor of 10 smaller than the direct capture radius of a non-spinning black hole. As noted by (?) (see also Table 1 of (?) for specific values in the context of known QPE systems), the partial tidal disruption radius is a factor of larger for a 5/3-polytropic star (?, ?), which is a good approximation for the density profile of a low-mass white dwarf. Relativistic effects (?) and the induced stellar rotation (?) also can both serve to increase the tidal disruption radius, but it is difficult to see how such a system could produce an observable signature (i.e., the white dwarf partially disrupted outside the horizon of the black hole; e.g., (?)) unless the MBH mass is substantially smaller (e.g., (?) in the context of QPEs and the mass constraint on the black hole) than the one that follows from the - relation.
Second, if the X-ray eruptions arise from accretion and the accretion efficiency is of the order , the mass accreted per eruption is (see ‘Eruptions Energetics’ in Methods), implying that the mass lost by the star per orbit is a very small fraction of the total stellar mass. This suggests that the pericenter distance of the star is extremely fine tuned to coincide with the partial tidal disruption radius (there is a steep gradient in the amount of mass lost as a function of the pericenter distance near the partial disruption radius; (?)), and begs the question of how the star achieved this necessary distance, because tidal dissipation and gravitational-wave emission effectively do not change the pericenter distance if the orbit is highly eccentric. A near-unity eccentricity is necessary in this case because the pericenter distance must be comparable to the horizon distance of the black hole (see the preceding paragraph), where the orbital time is comparable to seconds, while the recurrence time is on the order of days.
Third, the return time of the debris stripped from a star in a tidal disruption event is (?, ?), where is the dynamical time of the star, which is seconds for a disrupted by a MBH (assuming such a scenario is possible, given the first shortcoming of this model noted above). While this timescale is in good agreement with the hour-long duration of QPEs, it is a factor of smaller than the few-day duration of most of the eruptions observed in Swift J0230+28. While the return time of the material stripped from the star in a partial TDE can be a factor of a few longer than the canonical timescale quoted above (?), it is difficult to see how one could achieve this large of a discrepancy in timescales with this model.
Fourth, there is the question of the stability of the mass transfer and the orbit itself in a white dwarf-SMBH system. As noted by (?) and as discussed above, the highly relativistic nature of the encounter between the white dwarf and the SMBH means that, on orbital grounds alone, the black hole must be of lower mass and/or rapidly rotating (and prograde in the sense of the orbital angular momentum of the star) to ensure that the white dwarf is outside of the direct capture radius. Additionally, in order to explain the fairly regular amplitude of the eruptions in Swift J0230+28, one would require the mass transfer process to be stable, i.e., to not result in a rapid runaway in which more mass is stripped on each subsequent pericenter passage. A number of authors (e.g., (?, ?, ?, ?)) have noted that this is particularly difficult to achieve in the case of a white dwarf star because of the polytropic mass-radius relationship , i.e., a reduction in the mass of the star results in an increase in its radius, rendering the star more susceptible to tidal stripping. Why this runaway process – with stronger outbursts occurring with time as more mass is stripped on each subsequent pericenter passage – is not occurring in Swift J0230+28 is difficult to explain in the context of this model (as pointed out by (?), the high eccentricity required for such a scenario implies that the star is moving at a super-Keplerian speed near pericenter where the mass loss is taking place, which inhibits the otherwise-stabilizing influence of the transfer of angular momentum between the stellar orbit and the gaseous disc generated through the tidal stripping; however, this could be alleviated if the disc itself is also elliptical (?)).
Fifth (and final), although the eruptions in Swift J0230+28 are quasi-periodic (see ‘X-ray light curve’), some of the high-activity periods were much fainter or much shorter in duration, or both, see, for example, epochs E7 to E9 in Fig. 1, but return to have its average behavior later, see epochs E10 to E11 in Fig. 1. This means that the mechanism responsible for the X-ray emission must have some associated instability/irregularity. While there are distinct timescales in a repeating partial TDE scenario, such as the orbital time of the star vs. the fallback time of the debris (which are, in some cases, able to be individually determined from observations; (?)), it is difficult to see what would provide such ‘eruptions holidays’ where the eruptions are either much fainter or much shorter.
A similar interpretation is that Swift J0230+28 is powered by the repeated partial disruption of a star, but in this case, the orbiter is a main sequence star, as was suggested by (?, ?, ?) for the sources ASASSN-14ko, AT2018fyk, and eRASSt J0456-20, respectively. If the star is solar-like and of relatively low mass (), then the recurrence time of days is in good agreement with the canonical fallback time from a TDE if the MBH mass is , and the similarity between the fallback time and the orbital time would likely yield enhanced variability in the properties of the eruptions. With an MBH mass of , a star with radius and mass of , the tidal radius would be , and the pericenter would therefore be relativistic (potentially explaining the lack of UV/optical emission). However, since the amount of stripped mass would be of the stellar mass to explain the accretion-induced emission, the pericenter distance would have to be very fine-tuned. Similarly to the white dwarf case, those ‘eruption holidays’ are also a problem for repeated partial disruption of a main sequence star.
Accretion disc – perturber interaction
Here we investigate the possibility that the series of X-ray eruptions are due to star-disc interactions, in which passages of inclined stars through the accretion flow induce density waves and shocks that modulate the inflow and the outflow rate (see e.g. (?) for a detailed analysis). Our constraint for the past activity of Swift J0230+28 (see “The host galaxy” in Methods), i.e. 0.002, leads to the fact that MBH is fed from a hot and diluted advection-dominated accretion flow (ADAF). During the eruptions, the X-ray luminosity reaches , which corresponds to the Eddington ratio when the thermal, optically thick disc can in principle exist. Hence, Swift J0230+28 could transition from the low/hard state to the high/soft state on the timescale of 18-25 days and the soft X-ray spectrum is detected for days, which corresponds to the duration.
The quasi-periodic accretion rate outbursts of at least two orders of magnitude were reported in GRMHD simulations of (?), where the outburst recurrence timescale was clearly modulated by the orbital timescale of an orbiting stellar or black-hole perturber. In particular, for a nearly circular orbit, it is expected that the outbursts occur twice per orbital period, , since the perturber crosses the disc twice for a non-zero inclination with respect to the disc midplane. (?) simulated the perturber characterized by its influence radius which defines the interaction cross-section with the background hot ADAF flow.
When we consider days, then the orbital period of a perturber on a nearly circular orbit is days, which results in the semi-major axis of
| (2) |
which is too far to produce order-of-magnitude changes in the accretion rate given that the orbital velocity is .
When we assume that the stellar perturber is instead on an eccentric orbit and the X-ray eruptions is produced and detected during its pericenter passage, the orbital period is days, which according to Eq. (2) results in . To generate a density perturbation propagating at , the stellar pericenter velocity should be of a comparable order of magnitude, i.e. , which implies or the pericenter distance should be . To ensure that the star can complete several 22-day orbits, it cannot be tidally disrupted, hence a Solar-type star must have the pericenter distance larger than the tidal disruption radius,
| (3) |
i.e. its eccentricity must be smaller than . Hydrodynamic processes (stellar winds) or the sufficiently massive perturber (a stellar-mass or intermediate-mass black hole) can ensure that the influence radius of an orbiting body is large enough to perturb the hot diluted flow. For an ADAF, this is achievable for the influence radius for the pericenter distances , see (?).
To support the feasibility of this scenario, we have simulated the transit of the star through the ADAF in the same way as in (?). The details of the numerical scheme are provided in (?). We have used the modified version of the HARMPI code (?, ?, ?). The transit of the perturber through the flow is modeled via its influence radius , within which the motion of the gas is fully synchronized with the motion of the object.
We have chosen representative orbital parameters of this scenario, i.e. the pericenter distance , the inclination and the influence radius . The 22-day eruptions period corresponds to a very long orbital period of , therefore we have simulated only one perturber passage through the pericenter in a 2D simulation. The resulting run is shown in Supplementary Figure 1, where we have chosen four different time instances illustrating the details of the transit. For each time instant, we show the density in a logarithmic scale and the corresponding map of the quantity called fast-outflowing rate density for gas with Lorentz factor and vanishing otherwise. In the bottom panel, we show the time profile of the accretion rate and the fast-outflowing rate integrated through the upper and the lower funnel with the opening angle at a chosen diagnostic radius .
The four time instances were chosen so that the main features of the transit are visible, in particular the strong density wave emerging directly during the passage (); the launched big blob of matter which is immediately accelerated away along the funnel-disc boundary with a mildly relativistic speed, while the density perturbation has not yet propagated towards the horizon (); the smaller blob pushed to the other direction, when the star is going back through the disc, while the accretion rate is still on the original level (); and finally the abrupt rise of the accretion rate ().
The main strength of the perturber-disc interaction model is that for an eccentric orbit with with the pericenter distance in the range , which is sufficiently inclined with respect to the flow midplane (), the interaction can generate a sufficient accretion rate perturbation as well as launch a fast outflow with the velocity of , which may be relevant for some sources similar to Swift J0230+28. In addition, for the magnetically arrested disc, the perturber triggers reconnection events in a quasi-periodic way, which can temporally increase the inflow rate by several orders of magnitude as shown by GRMHD simulations of (?). The quasiperiodic behaviour of eruptions can be followed by a longer period of quiescence, hence the perturbed MAD flow can reproduce irregularities seen for the Swift J0230+28 X-ray light curve.
The main weakness of the model is that the soft X-ray spectrum with the black-body temperature of – is not achievable in the star-ADAF interaction regime due to the presence of high-temperature electron-proton plasma.
Hence, an additional influx of stellar material at the pericenter due to the tidal Roche-lobe overflow is eventually required to provide a gas of lower temperature. Such a setup should eventually be studied in detail using GRMHD simulations with the appropriate heating/cooling terms included as well as the detailed treatment of shocks in stream-stream collisions.
Recently, (?) proposed an alternative accretion disk-perturber interaction model, where instead of driving a short-lived increase in the accretion rate, the perturber collides with the disk driving a shock and ejecting optically-thick gas clouds above and below the midplane, which produces the soft thermal X-ray emission. This model should be able to produce the correct temperature corresponding to the thermal X-ray emission, which is in contrast to the purely ADAF model. However, the lack of any evidence for the presence of a standard thin accretion disk in the Swift J0230+28’s host prior and between the eruptions is hard to reconcile with the model. The same applies to other proposed interaction models involving thin disks (?). In comparison with (?), who study star-disk collisions, (?) prefer secondary black holes of crossing the disk. Nevertheless, the thermal X-ray emission is produced similarly in adiabatically expanding, optically thick clouds pulled out from the accretion disk. The calculated eruption profiles of (?) are inconsistent with Swift J0230+28 since they exhibit a faster rise-slower decay. In a similar setup to (?), (?) studied star-disk crossings and the soft X-ray eruptions can be produced due to stellar bow-shock breakout emission. The main drawbacks of their model are fine-tuned parameters of the stellar orbit that needs to be low-inclination and retrograde in combination with the required short recurrence QPE timescale of hours, clearly inconsistent with Swift J0230+28. In addition, the radiatively efficient AGN disk is assumed in their model.
Stellar mass-transfer
A matter overflow from the star into the close vicinity of the MBH has been suggested to explain quasi-periodic X-ray eruptions. The overflow via an L1 point of the MBH-star binary system is expected to occur when the Roche-lobe of an orbiting star shrinks at its periapse so that a fraction of the stellar envelope is prone to tidal stripping. In the following estimates, we adopt the theoretical considerations analogous to e.g., (?), using the quantities inferred for Swift J0230+28 X-ray eruptions: peak luminosity , inferred thermal temperature at the eruptions peak (), the mean eruption periodicity days, and the approximate duty cycle of the eruptions .
Considering that X-ray spectra of the eruptions are consistent with being thermal, the eruption luminosity and the temperature constrain the geometric mean of the orthogonal length scales of an emitting area (?),
| (4) |
which is comparable to the Solar radius and much smaller than the gravitational radius of MBH. This strengthens the case for the association of the eruption with, e.g., the narrow circularization shock taking place close to the innermost stable circular orbit (ISCO), while the much smaller length-scale in comparison with the gravitational radius makes the accretion origin less likely.
As in the previous subsection, we consider a star on an eccentric orbit and assume that the X-ray eruption is triggered when the star approaches the pericenter of its orbit, hence , which again constrains the semi-major axis of the star in ,
| (5) |
In comparison with other QPE sources whose period was of the order of hours and the duty cycle of 0.1 (see (?, ?)), Swift J0230+28 is in this regard a particular source with days and the duty cycle of , i.e., the recurrence timescale is longer by a factor of and the duty cycle by a factor of . This suggests different properties of a putative star in comparison with the stellar EMRI model of (?). To transfer the mass onto the MBH, the stellar pericenter distance needs to be comparable to the tidal radius, , from which the stellar radius can be estimated as follows,
| (6) |
where the relation assumes an orbit with a small eccentricity of . Hence, a single star triggering the eruptions is expected to be significantly larger than a Solar-type star. From Eq. (6) it is evident that for a given periodicity , , which is significantly flatter than the relation for main-sequence stars, , see e.g. (?). For Swift J0230+28, both relations cross at , which is an unrealistically large mass. Therefore, a single star orbiting the MBH must be an evolved star – a red giant. A similar scenario where a star on an eccentric orbit evolves from the main sequence, fills its Roche lobe, and “spoon feeds” the SMBH at every pericenter was analyzed by (?), although for generally larger semi-major axes/periods.
To constrain the stellar orbit, we consider different orbital eccentricities and their relation to the Roche-lobe refilling timescale and the stellar mass loss. Using the Roche-lobe radius estimate at the given distance from the MBH, , we infer the effective stellar radius for which the duty cycle of the X-ray eruptions is 0.3. This is done by approximating the duty cycle as the ratio between the time when the stellar radius exceeds the corresponding Roche-lobe radius (and hence the stellar mass transfer can take place) and the total orbital period. The actual eruption duration may differ from this simplified estimate related to dynamics. However, we still expect a correlation between the Roche-lobe overflow timescale and the duty cycle. The non-zero eccentricity is clearly required to achieve the duty cycle less than unity. The emptied Roche lobe is expected to be refilled on the sound-crossing timescale . The sound speed for the stellar gas temperature typical of stellar interior is . To ensure sufficient time for refilling the Roche lobe for a new duty cycle, i.e., at most days, , which is met even for the case when the majority of the star is exposed to tidal stripping, i.e., for , days. However, the formation of stellar EMRIs that are not tidally disrupted can be explained by the combined two-body relaxation gravitational-wave emission or the Hills mechanism gravitational-wave emission (?), which limit the eccentricity, typically to values smaller than 0.5, though also an order of magnitude smaller semi-major axes. However, in the analysis by (?), only main-sequence stars were considered, not evolved stars that also occupy nuclear star clusters. In the case of the Milky Way nuclear star cluster, late-type stars dominate the stellar composition (see (?)), which provides further motivation to consider them as the potential candidates for longer-period stellar EMRIs.
To estimate the orbital eccentricity, we use the X-ray eruption peak luminosity of Swift J0230+28, to calculate the necessarily detached stellar-mass per eruption whose free-fall energy is dissipated at the distance close to the ISCO of the MBH,
| (7) |
while the corresponding mass-loss rate averaged over the orbital period is,
| (8) |
The stellar lifetime under the assumption of the constant mass-loss rate is years, which is an upper limit due to unstable nature of the Roche-lobe overflow as we discuss further.
The red giant with the radius of and the mass has a mean density of . Using a simple model of the mass removal between and at the pericenter, we obtain needed for one eruption for the Roche-lobe overfilling length-scale of , which corresponds to , i.e. a nearly circular orbit. For a smaller mean density, i.e. typical of an AGB star with an initial radius of , the corresponding is reached for or . Depending on the stellar-envelope density, orbits with small eccentricities are sufficient to produce luminous eruptions as those for Swift J0230+28, which is consistent with the two-body relaxation in combination with the gravitational-wave emission that circularizes the orbit.
In addition to standard stellar evolution, one of the formation channels to produce inflated stars with close to the MBH are stellar collisions. Considering a relaxed stellar cusp with the number density (Bahcall-Wolf cusp), the collisional timescale is , where is a local velocity dispersion. For a Solar-type star, the collisional timescale is years, i.e. comparable to a TDE rate. The collisional stellar product stays heated and puffed up on the timescale comparable to or longer than , as is approximately given by the Kelvin-Helmholtz thermal timescale for an inflated star, . Hence, the innermost stars can in principle be collisionally inflated and in appearance similar to the Galactic center G objects (?). On the other hand, once the star is puffed up to several tens of Solar radii, the collisional timescale decreases significantly since , i.e. for , years, which can address the period irregularities, scarcity, and limited timescale of the stellar-transfer phenomenon in galactic nuclei.
Since the distance of the star for the Swift J0230+28 X-ray eruptions model is an order of magnitude further away than for the other QPE sources, the angular momentum of the detached stream needs to be effectively removed close to the pericenter. Magnetic stresses resulting from the turbulent dynamo (?) or a prominent gas-drag force between the detached stellar stream and the ambient ADAF at the pericenter (?) are candidates for the efficient angular momentum removal. Under this assumption,the lower limit on the infall timescale is given by the free-fall timescale from the distance ,
| (9) |
and hence , which ensures that the X-ray eruptions can be discrete.
In the model by (?), the X-ray emission is produced via stream-stream shocks due to apsidal precession close to the dissipation radius. The detached stellar material passes through L1 point and is subsequently tidally elongated and compressed, i.e., it undergoes spaghettification. The effective transverse size of the colliding streams needs to be sufficiently small to reach the eruptions peak temperature of ,
| (10) |
which corresponds to . The stream size in Eq. (10) is consistent with the thermal length-scale limit given by Eq. (4). The X-ray eruptions can either be produced in shocks via stream-stream collisions as advocated by (?) or by accretion. In the first case, the eruption duration is set by the timescale of the Roche-lobe overflow, which determines that the stream-stream collision can proceed for a sufficiently long time (cooling timescale of the shocked gas is much shorter than the eruption duration, , hence the arrival time of the incoming stream needs to be of the order of the eruption duration). For the accretion scenario, a narrow radiating ring positioned at needs to be thicker than the standard disk. For the scale-height/radius ratio of and the viscous parameter of , the viscous timescale is days, which is comparable with the eruption duration. However, the accretion origin of X-ray eruptions is inconsistent with the eruption shape. For a ring that is accreted, the eruption rise should be shorter than its decline, while for Swift J0230+28 the opposite is the case (see Extended Data Figure 2).
The observed eruptions’ periodicity, amplitude, as well as duration are variable. This is a general property of an unstable mass transfer (?, ?). As tidal forces peel off the upper stellar envelope, the star tends to puff up, which enhances the mass transfer initially. On the other hand, the stellar material inside the Roche lobe may also become temporarily depleted for the next few orbits, which can result in the “eruption holidays”. Stellar radial pulsations due to the kappa opacity mechanism typical of evolved supergiants (Cepheids) or low-mass stars (RR Lyrae) that are in the instability strip can also affect the amount of the transferred matter, and hence also the X-ray eruption detectability.
Interacting stellar EMRIs
Apart from the single EMRI and the associated Roche-lobe mass overflow onto the MBH, the model involving two co-planar EMRIs on nearly circular orbits was suggested (?). The model consists of two stars with different masses, and with , where the heavier star approaches the lighter one due to shorter gravitational-wave emission timescale.
In the further estimates, we set , for the inner star and and for the outer star, where the radius was inferred using applicable for main-sequence stars. In principle, both stars can be undergoing Roche-lobe overflow. However, the mass transfer from the heavier outer star is significantly enhanced when the small separation of semimajor axes is reached. The semimajor axis of Roche-lobe overflowing stars must be comparable, ,
| (11) |
The critical value for the orbital separation of both stars is (scaled to ),
| (12) |
where the factor is of the order of unity, the stellar atmosphere opacity is scaled to electron scattering opacity, and is the atmosphere effective temperature. Given the orbital separation , we can estimate the expected X-ray eruption recurrence timescale under the assumption . For the co-orbiting case, we obtain
| (13) |
which is approximately consistent with the mean 22-day separation of X-ray eruptions in Swift J0230+28 given the involved factors of the order of unity.
The recurrence timescale of the X-ray eruption can simply be associated with the pattern speed or a synodic period , i.e., the timescale on which stars approach each other. The required semimajor axis difference required for a significantly enhanced mass transfer implies the time difference between the orbital periods of stars 2 and 1, respectively. For the coorbiting case, we have , while for the counter-orbiting case we obtain . Subsequently, these simple geometrical relations constrain the semimajor axis (and periods) for the two stars. For days, we obtain ( days) and ( days) for co-orbiting stars, which is close to the Roche-lobe overflowing limit for Solar-type, main-sequence stars. For counter-orbiting stars, the possible solution is ( days) and ( days), i.e., the eruptions would occur twice per orbital period. However, such a large semimajor axis would imply a large, atypical star in order for the Roche-lobe overflow to take place. Also, the coorbiting case is more plausible for two stars that have comparable semimajor axes due to gravitational wave emission since the Lense-Thirring differential nodal precession brings them to the same orbital plane on the precession timescale of days (see the estimate below) for distances of from the MBH.
Under the assumption that the X-ray eruption is powered by the accretion of a narrow ring with the width of , see Eq. (4), its scale-height to radius ratio should be to reproduce the eruption duty cycle of ,
| (14) |
where represents the circularization radius of the flow. The duty cycle was estimated from the viscous timescale calculated for . In case the circularization radius is smaller than due to the removal of the specific angular momentum of the gas by e.g. an outflow, then the formed disc can be even thinner: for .
The expected mass transfer from the outer star onto the MBH during the critical separation (lasting about years) is,
| (15) |
which leads to the bolometric luminosity of
| (16) |
for the eruption duration of days and radiative efficiency. This is within the same order of magnitude as the X-ray eruptions of Swift J0230+28.
However, the compact accretion disc formed from the detached stellar material by circularization at is expected to have a low effective temperature of (6.5 eV), which is inconsistent with the soft X-ray spectra during the eruptions implying a much higher temperature. The X-ray eruptions therefore appear to be powered by narrow stream-stream-collisions as discussed before for a single EMRI case (see Subsection ‘Stellar mass-transfer’). The removal of the specific angular momentum of the stellar stream is easier for coorbiting interacting EMRIs since the Roche-lobe overflowing star is an order of magnitude closer to the innermost stable circular orbit.
The enhanced mass transfer powering quasiperiodic X-ray eruptions will cease or restart due to the nodal orbital precession, which is driven mainly by the Lense-Thirring differential precession. The nodal precession is present for any initially coplanar stellar orbits that are inclined by with respect to the equatorial plane of the MBH. The precession timescale can be estimated as,
| (17) |
where the factor is estimated for a small MBH spin of and the inclination of interacting stellar EMRIs of with respect to the MBH equatorial plane.
Compressed reformed clumps from a past TDE
It has been proposed that the debris streams from TDEs are gravitationally unstable (?) or thermo-dynamically unstable to Kelvin-Helmholtz (KH) interactions and line cooling (?) and fragment into small-scale, localized knots. The instability becomes nonlinear (resulting in the knot formation) long after the disruption, because the shear along the stream inhibits the influence of self-gravity (?, ?), or because the KH instability growth rate requires the stream density to be comparable to the ambient density (?). Therefore, the X-ray eruptions could be caused by the return of low-mass and low-density “blobs” of gas to the supermassive black hole (see (?) for a similar interpretation in the context of GSN069; (?)) following a TDE, the TDE itself being undetectable because of, e.g., inefficient circularization (e.g., (?)). The return of the blobs to pericenter is expected to be quasi-periodic if the blobs form out of a gravitational instability (see Equation 25 of (?)).
If the clump formation process is approximately adiabatic and the stream remains self-gravitating (radiative recombination can raise the gas entropy, but not enough to destroy self-gravity; (?)), the effective of each clump is much greater than one; here , where is the pericenter distance of the blob ( equal to that of the original star) and is the tidal radius of the blob. If we let the mass of each clump be with , then we can show (?)
| (18) |
Here is the clump radius, is the average clump density, is the clump tidal radius, and is the corresponding of the clump encounter with the black hole. The same variables but with subscript- refer to the properties of the originally disrupted star.
A plausible value for is (?), implying for . For such high values of , the clump is elongated in the direction of the MBH to a length (?)
| (19) |
and compressed within the plane by the factor . Each clump is therefore transformed into a crescent of length that has an in-plane width comparable to the radius of the original star (e.g., Figure 1 of (?), or Figure 19 of (?)).
Each clump is also compressed by the vertical component of the tidal field of the MBH, reaching maximal compression near pericenter (e.g., (?, ?)). For these very high values of , a weak shock forms during the compressive phase that propagates toward the orbital plane (?), which then reflects off the midplane and propagates into the overlying and compressing material. Post-maximum-compression, the gas beneath the shock expands upward at a maximum velocity of (?)
| (20) |
which is comparable to the escape speed of the original star if . As the gas rebounds, a contact discontinuity forms that separates the forward shock from a reverse shock, all of which moves at a speed that is initially comparable to .
The temperature at the center of each reformed clump, still assuming that the entire process occurs adiabatically, is given by .
For and K, this gives a temperature of K, but the photoionizing background of the galactic nucleus likely limits this to K (?). The shock heats the gas and raises the density to (?)
| (21) |
For , K, , and g cm-3, this gives K and g cm-3. Equation (21) shows that , each compressed clump reaches a temperature of a few K, and the density and temperature are large enough to render the gas optically thick. As the gas rebounds, the forward shock is accelerated by the contact discontinuity until it reaches the edge of the collapsing material in front of it, at which point it accelerates (?). The nature of the acceleration depends on the properties of the envelope (?), but it seems plausible that mildly relativistic velocities (characteristic of the UFO) could be reached.
The gas temperature associated with Swift J0230+28 is K and the peak luminosity is erg s-1, and hence the size of the emitting region can be approximated as
| (22) |
This is consistent with the fact that the majority of the high-temperature emission is coming from the region of high compression, which is concentrated spatially near the pericenter of the returning clump. The duration of the eruption is set by the amount of time taken for the stretched clump to traverse the region of maximum compression; since this region occurs very near pericenter, this timescale is effectively the difference between the time it takes for the most-bound and least-bound fluid elements to reach pericenter, which is also the length of the clump divided by the velocity at pericenter. From Equation (19) above, we therefore have
| (23) |
Putting into this expression the canonical values , , , , and gives hr, which is close to the duration of the eruptions from some QPEs (e.g., Extended Data Figure 8) and perhaps some of the very short-duration eruptions from Swift J0230+28, but is too short to explain the few-day-long eruptions. There are a few possibilities that can reconcile this discrepancy: If 1) The originally disrupted star was a massive star with mass (e.g.) and , then Equation (23) gives days; 2) The pericenter distance of the original star was larger than the canonical tidal radius (i.e., it was a partial disruption; this would be consistent with the lack of detection of the original TDE due to inefficient circularization, as the relativistic advance of periapsis angle declines linearly with pericenter distance); 3) The long-duration eruptions are actually many smaller eruptions temporally blended together; 4) The thermodynamic evolution of these clumps is not well-approximated as adiabatic, then the clump size could conceivably be much larger than the estimate given in Equation (18), especially if the equation of state is close to isothermal; 5) The clump mass is much smaller than our fiducial choice of ; 6) The pericenter distance of the returning clump is larger than the pericenter distance of the original star, which could occur if there are significant dynamical interactions between the stream material and a Keplerian flow (as presumably the latter has more angular momentum than the former).
[]
| Epoch | Instrument | Peak X-ray flux∥∥∥In the 0.3-0.8 keV band for NICER/XTI, and in 0.3-2.0 keV band for Swift/XRT | MJD Peak | FWHM | ||
|---|---|---|---|---|---|---|
| [ erg s-1 ] | [days] | [days] | [days] | |||
| E3 | Swift | |||||
| E4 | NICER | |||||
| E5 | NICER | |||||
| E6 | Swift | |||||
| E10 | Swift | |||||
| E11 | Swift |
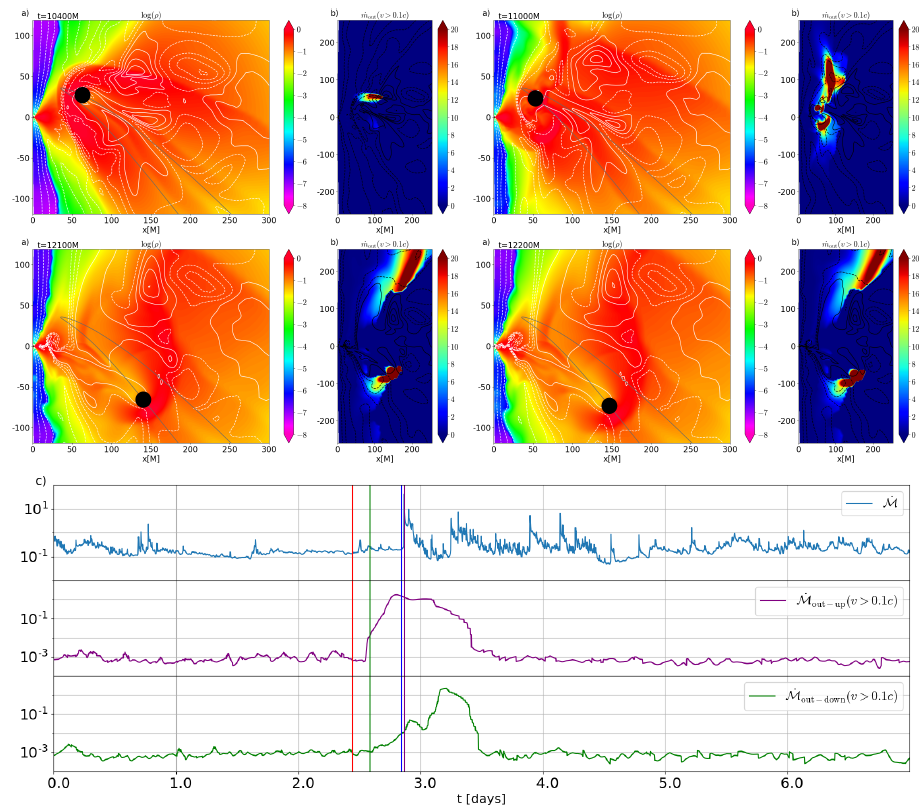
[] Start End (MJD) (MJD) [erg s-1] [eV] 59798.0 59800.0 41.97 0.02 153 59802.4 59802.5 42.78 0.01 196 59814.0 59816.0 41.91 0.03 113 59816.0 59817.0 42.13 0.02 110 59817.0 59818.0 42.23 0.02 123 59818.0 59820.0 42.51 0.02 137 59820.0 59822.0 42.58 0.01 172 59822.0 59824.0 42.46 0.01 189 59824.0 59824.7 42.36 0.01 174 59825.5 59825.7 42.31 0.03 225 59841.0 59842.0 41.74 0.01 115 59842.0 59843.0 41.88 0.01 115 59843.0 59844.0 42.08 0.02 113 59844.0 59845.0 42.41 0.01 158 59845.0 59846.0 42.46 0.01 185 59846.0 59846.6 42.30 0.01 185 59850.0 59852.0 41.92 0.01 108 59852.0 59854.0 42.16 0.01 131 59854.0 59857.9 42.37 0.01 136 59857.9 59860 42.48 0.01 182 59878.8 59879.2 42.13 0.01 136 59882.0 59882.4 42.14 0.01 137 59949 59951.2 42.75 0.01 164 59951.4 59953.5 42.66 0.01 218
References
- 1. Chen, T. W. et al. ATLAS21bmvp (AT 2021afkk): discovery of a fast rising candidate supernova in UGC01971 (60 Mpc). Transient Name Server AstroNote 300, 1–300 (2021).
- 2. Evans, P. A. et al. A real-time transient detector and the living Swift-XRT point source catalogue. Mon. Not. R. Astron. Soc. 518, 174–184 (2023).
- 3. Evans, P. A. et al. Monthly quasi-periodic eruptions from repeated stellar disruption by a massive black hole. Nature Astronomy (2023).
- 4. Evans, P. A., Campana, S. & Page, K. L. Swift J023017.0+283603: A possible tidal disruption event. The Astronomer’s Telegram 15454, 1 (2022).
- 5. Evans, P. A., Breeveld, A. A. & Oates, S. R. Further Swift observations of the TDE candidate Swift J023017.0+283603. The Astronomer’s Telegram 15461, 1 (2022).
- 6. Rees, M. J. Tidal disruption of stars by black holes of 106-108 solar masses in nearby galaxies. Nature 333, 523–528 (1988).
- 7. van Velzen, S. et al. Seventeen Tidal Disruption Events from the First Half of ZTF Survey Observations: Entering a New Era of Population Studies. Astrophys. J. 908, 4 (2021).
- 8. Hammerstein, E. et al. The Final Season Reimagined: 30 Tidal Disruption Events from the ZTF-I Survey. Astrophys. J. 942, 9 (2023).
- 9. Guolo, M. et al. A systematic analysis of the X-ray emission in optically selected tidal disruption events: observational evidence for the unification of the optically and X-ray selected populations. arXiv e-prints arXiv:2308.13019 (2023).
- 10. Scargle, J. D. Studies in astronomical time series analysis. II. Statistical aspects of spectral analysis of unevenly spaced data. Astrophys. J. 263, 835–853 (1982).
- 11. Horne, J. H. & Baliunas, S. L. A Prescription for Period Analysis of Unevenly Sampled Time Series. Astrophys. J. 302, 757 (1986).
- 12. Gültekin, K. et al. The M- and M-L Relations in Galactic Bulges, and Determinations of Their Intrinsic Scatter. Astrophys. J. 698, 198–221 (2009).
- 13. Greene, J. E., Strader, J. & Ho, L. C. Intermediate-Mass Black Holes. ARA&A 58, 257–312 (2020).
- 14. Payne, A. V. et al. ASASSN-14ko is a Periodic Nuclear Transient in ESO 253-G003. Astrophys. J. 910, 125 (2021).
- 15. Liu, Z. et al. Deciphering the extreme X-ray variability of the nuclear transient eRASSt J045650.3203750. A likely repeating partial tidal disruption event. Astron. Astrophys. 669, A75 (2023).
- 16. Wevers, T. et al. Live to Die Another Day: The Rebrightening of AT 2018fyk as a Repeating Partial Tidal Disruption Event. Astrophys. J. 942, L33 (2023).
- 17. Cufari, M., Coughlin, E. R. & Nixon, C. J. Using the Hills Mechanism to Generate Repeating Partial Tidal Disruption Events and ASASSN-14ko. Astrophys. J. 929, L20 (2022).
- 18. Liu, C. et al. Tidal Disruption Events from Eccentric Orbits and Lessons Learned from the Noteworthy ASASSN-14ko. Astrophys. J. 944, 184 (2023).
- 19. Miniutti, G. et al. Nine-hour X-ray quasi-periodic eruptions from a low-mass black hole galactic nucleus. Nature 573, 381–384 (2019).
- 20. Giustini, M., Miniutti, G. & Saxton, R. D. X-ray quasi-periodic eruptions from the galactic nucleus of RX J1301.9+2747. Astron. Astrophys. 636, L2 (2020).
- 21. Arcodia, R. et al. X-ray quasi-periodic eruptions from two previously quiescent galaxies. Nature 592, 704–707 (2021).
- 22. Bardeen, J. M. & Petterson, J. A. The Lense-Thirring Effect and Accretion Disks around Kerr Black Holes. Astrophys. J. 195, L65 (1975).
- 23. Nixon, C., King, A., Price, D. & Frank, J. Tearing up the Disk: How Black Holes Accrete. Astrophys. J. 757, L24 (2012).
- 24. Musoke, G., Liska, M., Porth, O., van der Klis, M. & Ingram, A. Disc tearing leads to low and high frequency quasi-periodic oscillations in a GRMHD simulation of a thin accretion disc. Mon. Not. R. Astron. Soc. 518, 1656–1671 (2023).
- 25. Liska, M. T. P., Kaaz, N., Musoke, G., Tchekhovskoy, A. & Porth, O. Radiation Transport Two-Temperature GRMHD Simulations of Warped Accretion Disks. arXiv e-prints arXiv:2210.10198 (2022).
- 26. Meyer, F. & Meyer-Hofmeister, E. On the elusive cause of cataclysmic variable outbursts. Astron. Astrophys. 104, L10–L12 (1981).
- 27. Sniegowska, M., Czerny, B., Bon, E. & Bon, N. Possible mechanism for multiple changing-look phenomena in active galactic nuclei. Astron. Astrophys. 641, A167 (2020).
- 28. Śniegowska, M., Grzkedzielski, M., Czerny, B. & Janiuk, A. Modified models of radiation pressure instability in application to 10, 105, and 107 accreting black holes. arXiv e-prints arXiv:2204.10067 (2022).
- 29. Pan, X., Li, S.-L., Cao, X., Miniutti, G. & Gu, M. A Disk Instability Model for the Quasi-periodic Eruptions of GSN 069. Astrophys. J. 928, L18 (2022).
- 30. Kaur, K., Stone, N. C. & Gilbaum, S. Magnetically dominated discs in tidal disruption events and quasi-periodic eruptions. Mon. Not. R. Astron. Soc. 524, 1269–1290 (2023).
- 31. Guillochon, J. & Ramirez-Ruiz, E. Hydrodynamical Simulations to Determine the Feeding Rate of Black Holes by the Tidal Disruption of Stars: The Importance of the Impact Parameter and Stellar Structure. Astrophys. J. 767, 25 (2013).
- 32. Zalamea, I., Menou, K. & Beloborodov, A. M. White dwarfs stripped by massive black holes: sources of coincident gravitational and electromagnetic radiation. Mon. Not. R. Astron. Soc. 409, L25–L29 (2010).
- 33. King, A. GSN 069 - A tidal disruption near miss. Mon. Not. R. Astron. Soc. 493, L120–L123 (2020).
- 34. Suková, P., Zajaček, M., Witzany, V. & Karas, V. Stellar Transits across a Magnetized Accretion Torus as a Mechanism for Plasmoid Ejection. Astrophys. J. 917, 43 (2021).
- 35. Linial, I. & Metzger, B. D. EMRI + TDE = QPE: Periodic X-ray Flares from Star-Disk Collisions in Galactic Nuclei. arXiv e-prints arXiv:2303.16231 (2023).
- 36. Krolik, J. H. & Linial, I. Quasiperiodic Erupters: A Stellar Mass-transfer Model for the Radiation. Astrophys. J. 941, 24 (2022).
- 37. Linial, I. & Sari, R. Unstable Mass Transfer from a Main-sequence Star to a Supermassive Black Hole and Quasiperiodic Eruptions. Astrophys. J. 945, 86 (2023).
- 38. Metzger, B. D., Stone, N. C. & Gilbaum, S. Interacting Stellar EMRIs as Sources of Quasi-periodic Eruptions in Galactic Nuclei. Astrophys. J. 926, 101 (2022).
- 39. Guillochon, J. & Ramirez-Ruiz, E. A Dark Year for Tidal Disruption Events. Astrophys. J. 809, 166 (2015).
- 40. Coughlin, E. R. & Nixon, C. J. The Gravitational Instability of Adiabatic Filaments. Astrophys. J. Suppl. 247, 51 (2020).
- 41. Predehl, P. et al. The eROSITA X-ray telescope on SRG. Astron. Astrophys. 647, A1 (2021).
- 42. Sunyaev, R. et al. SRG X-ray orbital observatory. Its telescopes and first scientific results. Astron. Astrophys. 656, A132 (2021).
- 43. Yuan, W., Zhang, C., Chen, Y. & Ling, Z. The Einstein Probe Mission (Springer, 2022).
- 44. Planck Collaboration et al. Planck 2018 results. VI. Cosmological parameters. Astron. Astrophys. 641, A6 (2020).
- 45. Wright, E. L. A Cosmology Calculator for the World Wide Web. Publ. Astron. Soc. Pac. 118, 1711–1715 (2006).
- 46. Evans, P. A. et al. 1SXPS: A Deep Swift X-Ray Telescope Point Source Catalog with Light Curves and Spectra. Astrophys. J. Suppl. 210, 8 (2014).
- 47. Kraft, R. P., Burrows, D. N. & Nousek, J. A. Determination of Confidence Limits for Experiments with Low Numbers of Counts. Astrophys. J. 374, 344 (1991).
- 48. Kaastra, J. S. & Bleeker, J. A. M. Optimal binning of X-ray spectra and response matrix design. Astron. Astrophys. 587, A151 (2016).
- 49. Schlafly, E. F. & Finkbeiner, D. P. Measuring Reddening with Sloan Digital Sky Survey Stellar Spectra and Recalibrating SFD. Astrophys. J. 737, 103 (2011).
- 50. Pasham, D. R. et al. The Birth of a Relativistic Jet Following the Disruption of a Star by a Cosmological Black Hole. Nature Astronomy 7, 88–104 (2022).
- 51. Pasham, D. R. et al. Evidence for a compact object in the aftermath of the extragalactic transient AT2018cow. Nature Astronomy 6, 249–258 (2022).
- 52. Remillard, R. A. et al. An Empirical Background Model for the NICER X-Ray Timing Instrument. Astron. J. 163, 130 (2022).
- 53. Arnaud, K. A. Jacoby, G. H. & Barnes, J. (eds) XSPEC: The First Ten Years. (eds Jacoby, G. H. & Barnes, J.) Astronomical Data Analysis Software and Systems V, Vol. 101 of Astronomical Society of the Pacific Conference Series, 17 (1996).
- 54. McMullin, J. P., Waters, B., Schiebel, D., Young, W. & Golap, K. Shaw, R. A., Hill, F. & Bell, D. J. (eds) CASA Architecture and Applications. (eds Shaw, R. A., Hill, F. & Bell, D. J.) Astronomical Data Analysis Software and Systems XVI, Vol. 376 of Astronomical Society of the Pacific Conference Series, 127 (2007).
- 55. Sheinis, A. I. et al. ESI, a New Keck Observatory Echellette Spectrograph and Imager. Publ. Astron. Soc. Pac. 114, 851–865 (2002).
- 56. Vernet, J. et al. X-shooter, the new wide band intermediate resolution spectrograph at the ESO Very Large Telescope. Astron. Astrophys. 536, A105 (2011).
- 57. Cappellari, M. & Emsellem, E. Parametric Recovery of Line-of-Sight Velocity Distributions from Absorption-Line Spectra of Galaxies via Penalized Likelihood. Publ. Astron. Soc. Pac. 116, 138–147 (2004).
- 58. Cappellari, M. Improving the full spectrum fitting method: accurate convolution with Gauss-Hermite functions. Mon. Not. R. Astron. Soc. 466, 798–811 (2017).
- 59. Prugniel, P. & Soubiran, C. A database of high and medium-resolution stellar spectra. Astron. Astrophys. 369, 1048–1057 (2001).
- 60. Prugniel, P., Soubiran, C., Koleva, M. & Le Borgne, D. New release of the ELODIE library: Version 3.1. arXiv e-prints astro–ph/0703658 (2007).
- 61. Wevers, T. et al. Black hole masses of tidal disruption event host galaxies. Mon. Not. R. Astron. Soc. 471, 1694–1708 (2017).
- 62. Wevers, T. et al. Black hole masses of tidal disruption event host galaxies II. Mon. Not. R. Astron. Soc. 487, 4136–4152 (2019).
- 63. French, K. D., Wevers, T., Law-Smith, J., Graur, O. & Zabludoff, A. I. The Host Galaxies of Tidal Disruption Events. Space Sci. Rev. 216, 32 (2020).
- 64. Yao, Y. et al. The Tidal Disruption Event AT2021ehb: Evidence of Relativistic Disk Reflection, and Rapid Evolution of the Disk-Corona System. arXiv e-prints arXiv:2206.12713 (2022).
- 65. Worthey, G., Faber, S. M., Gonzalez, J. J. & Burstein, D. Old Stellar Populations. V. Absorption Feature Indices for the Complete Lick/IDS Sample of Stars. Astrophys. J. Suppl. 94, 687 (1994).
- 66. Hammerstein, E. et al. Tidal Disruption Event Hosts Are Green and Centrally Concentrated: Signatures of a Post-merger System. Astrophys. J. 908, L20 (2021).
- 67. Wevers, T., Pasham, D. R., Jalan, P., Rakshit, S. & Arcodia, R. Host galaxy properties of quasi-periodically erupting X-ray sources. Astron. Astrophys. 659, L2 (2022).
- 68. Barlow, R. Asymmetric Statistical Errors. arXiv e-prints physics/0406120 (2004).
- 69. Kelly, B. C. Some Aspects of Measurement Error in Linear Regression of Astronomical Data. Astrophys. J. 665, 1489–1506 (2007).
- 70. Kara, E., Dai, L., Reynolds, C. S. & Kallman, T. Ultrafast outflow in tidal disruption event ASASSN-14li. Mon. Not. R. Astron. Soc. 474, 3593–3598 (2018).
- 71. Predehl, P. & Schmitt, J. H. M. M. X-raying the interstellar medium: ROSAT observations of dust scattering halos. Astron. Astrophys. 293, 889–905 (1995).
- 72. Calzetti, D. et al. The Dust Content and Opacity of Actively Star-forming Galaxies. Astrophys. J. 533, 682–695 (2000).
- 73. Véron-Cetty, M. P. & Véron, P. A catalogue of quasars and active nuclei: 13th edition. Astron. Astrophys. 518, A10 (2010).
- 74. Flesch, E. W. The Million Quasars (Milliquas) v7.2 Catalogue, now with VLASS associations. The inclusion of SDSS-DR16Q quasars is detailed. arXiv e-prints arXiv:2105.12985 (2021).
- 75. Saxton, R. D. et al. HILIGT, upper limit servers I-Overview. Astronomy and Computing 38, 100531 (2022).
- 76. Wright, E. L. et al. The Wide-field Infrared Survey Explorer (WISE): Mission Description and Initial On-orbit Performance. Astron. J. 140, 1868–1881 (2010).
- 77. Stern, D. et al. Mid-infrared Selection of Active Galactic Nuclei with the Wide-Field Infrared Survey Explorer. I. Characterizing WISE-selected Active Galactic Nuclei in COSMOS. Astrophys. J. 753, 30 (2012).
- 78. Mainzer, A. et al. NEOWISE Observations of Near-Earth Objects: Preliminary Results. Astrophys. J. 743, 156 (2011).
- 79. Baldwin, J. A., Phillips, M. M. & Terlevich, R. Classification parameters for the emission-line spectra of extragalactic objects. Publ. Astron. Soc. Pac. 93, 5–19 (1981).
- 80. Cid Fernandes, R., Stasińska, G., Mateus, A. & Vale Asari, N. A comprehensive classification of galaxies in the Sloan Digital Sky Survey: how to tell true from fake AGN? Mon. Not. R. Astron. Soc. 413, 1687–1699 (2011).
- 81. Kewley, L. J., Dopita, M. A., Sutherland, R. S., Heisler, C. A. & Trevena, J. Theoretical Modeling of Starburst Galaxies. Astrophys. J. 556, 121–140 (2001).
- 82. Cid Fernandes, R. et al. Alternative diagnostic diagrams and the ‘forgotten’ population of weak line galaxies in the SDSS. Mon. Not. R. Astron. Soc. 403, 1036–1053 (2010).
- 83. Kewley, L. J., Groves, B., Kauffmann, G. & Heckman, T. The host galaxies and classification of active galactic nuclei. Mon. Not. R. Astron. Soc. 372, 961–976 (2006).
- 84. Kaiser, N. et al. Tyson, J. A. & Wolff, S. (eds) Pan-STARRS: A Large Synoptic Survey Telescope Array. (eds Tyson, J. A. & Wolff, S.) Survey and Other Telescope Technologies and Discoveries, Vol. 4836 of Society of Photo-Optical Instrumentation Engineers (SPIE) Conference Series, 154–164 (2002).
- 85. Cutri, R. M. et al. VizieR Online Data Catalog: 2MASS All-Sky Catalog of Point Sources (Cutri+ 2003). VizieR Online Data Catalog II/246 (2003).
- 86. Cutri, R. M. et al. VizieR Online Data Catalog: AllWISE Data Release (Cutri+ 2013). VizieR Online Data Catalog II/328 (2013).
- 87. Conroy, C., Gunn, J. E. & White, M. The Propagation of Uncertainties in Stellar Population Synthesis Modeling. I. The Relevance of Uncertain Aspects of Stellar Evolution and the Initial Mass Function to the Derived Physical Properties of Galaxies. Astrophys. J. 699, 486–506 (2009).
- 88. Johnson, B. D., Leja, J., Conroy, C. & Speagle, J. S. Stellar Population Inference with Prospector. Astrophys. J. Suppl. 254, 22 (2021).
- 89. Foreman-Mackey, D., Hogg, D. W., Lang, D. & Goodman, J. emcee: The MCMC Hammer. Publ. Astron. Soc. Pac. 125, 306 (2013).
- 90. Kormendy, J. & Ho, L. C. Coevolution (Or Not) of Supermassive Black Holes and Host Galaxies. ARA&A 51, 511–653 (2013).
- 91. Pennell, A., Runnoe, J. C. & Brotherton, M. S. Updating quasar bolometric luminosity corrections - III. [O III] bolometric corrections. Mon. Not. R. Astron. Soc. 468, 1433–1441 (2017).
- 92. Duras, F. et al. Universal bolometric corrections for active galactic nuclei over seven luminosity decades. Astron. Astrophys. 636, A73 (2020).
- 93. Voges, W. et al. The ROSAT all-sky survey bright source catalogue. Astron. Astrophys. 349, 389–405 (1999).
- 94. Saxton, R. D. et al. The first XMM-Newton slew survey catalogue: XMMSL1. Astron. Astrophys. 480, 611–622 (2008).
- 95. Chakraborty, J. et al. Possible X-Ray Quasi-periodic Eruptions in a Tidal Disruption Event Candidate. Astrophys. J. 921, L40 (2021).
- 96. Arcodia, R. et al. The complex time and energy evolution of quasi-periodic eruptions in eRO-QPE1. Astron. Astrophys. 662, A49 (2022).
- 97. Miniutti, G. et al. Repeating tidal disruptions in GSN 069: Long-term evolution and constraints on quasi-periodic eruptions’ models. Astron. Astrophys. 670, A93 (2023).
- 98. Yang, L. et al. Compact and Variable Radio Emission from an Active Galaxy with Supersoft X-Ray Emission. Astrophys. J. 935, 115 (2022).
- 99. Saxton, R., Komossa, S., Auchettl, K. & Jonker, P. G. X-Ray Properties of TDEs. Space Sci. Rev. 216, 85 (2020).
- 100. Payne, A. V. et al. The Rapid X-Ray and UV Evolution of ASASSN-14ko. Astrophys. J. 926, 142 (2022).
- 101. Payne, A. V. et al. Chandra, HST/STIS, NICER, Swift, and TESS Detail the Flare Evolution of the Repeating Nuclear Transient ASASSN -14ko. Astrophys. J. 951, 134 (2023).
- 102. Wevers, T. et al. Evidence for rapid disc formation and reprocessing in the X-ray bright tidal disruption event candidate AT 2018fyk. Mon. Not. R. Astron. Soc. 488, 4816–4830 (2019).
- 103. Wevers, T. et al. Rapid Accretion State Transitions following the Tidal Disruption Event AT2018fyk. Astrophys. J. 912, 151 (2021).
- 104. Shakura, N. I. & Sunyaev, R. A. Reprint of 1973A&A….24..337S. Black holes in binary systems. Observational appearance. Astron. Astrophys. 500, 33–51 (1973).
- 105. Lightman, A. P. & Eardley, D. M. Black Holes in Binary Systems: Instability of Disk Accretion. Astrophys. J. 187, L1 (1974).
- 106. Hameury, J. M. A review of the disc instability model for dwarf novae, soft X-ray transients and related objects. Advances in Space Research 66, 1004–1024 (2020).
- 107. Davis, S. W. & Tchekhovskoy, A. Magnetohydrodynamics Simulations of Active Galactic Nucleus Disks and Jets. ARA&A 58, 407–439 (2020).
- 108. Shakura, N. I. & Sunyaev, R. A. A theory of the instability of disk accretion on to black holes and the variability of binary X-ray sources, galactic nuclei and quasars. Mon. Not. R. Astron. Soc. 175, 613–632 (1976).
- 109. Janiuk, A., Czerny, B. & Siemiginowska, A. Radiation Pressure Instability Driven Variability in the Accreting Black Holes. Astrophys. J. 576, 908–922 (2002).
- 110. Merloni, A. & Nayakshin, S. On the limit-cycle instability in magnetized accretion discs. Mon. Not. R. Astron. Soc. 372, 728–734 (2006).
- 111. Kato, S., Fukue, J. & Mineshige, S. Black-Hole Accretion Disks — Towards a New Paradigm — (Kyoto University Press, 2008).
- 112. Nixon, C. J. & King, A. R. Broken discs: warp propagation in accretion discs. Mon. Not. R. Astron. Soc. 421, 1201–1208 (2012).
- 113. Britzen, S. et al. Precession-induced Variability in AGN Jets and OJ 287. Astrophys. J. 951, 106 (2023).
- 114. MacLeod, M., Goldstein, J., Ramirez-Ruiz, E., Guillochon, J. & Samsing, J. Illuminating Massive Black Holes with White Dwarfs: Orbital Dynamics and High-energy Transients from Tidal Interactions. Astrophys. J. 794, 9 (2014).
- 115. Nauenberg, M. Analytic Approximations to the Mass-Radius Relation and Energy of Zero-Temperature Stars. Astrophys. J. 175, 417 (1972).
- 116. King, A. Quasi-periodic eruptions from galaxy nuclei. Mon. Not. R. Astron. Soc. 515, 4344–4349 (2022).
- 117. Mainetti, D. et al. The fine line between total and partial tidal disruption events. Astron. Astrophys. 600, A124 (2017).
- 118. Beloborodov, A. M., Illarionov, A. F., Ivanov, P. B. & Polnarev, A. G. Angular momentum of a supermassive black hole in a dense star cluster. Mon. Not. R. Astron. Soc. 259, 209–217 (1992).
- 119. Golightly, E. C. A., Nixon, C. J. & Coughlin, E. R. On the Diversity of Fallback Rates from Tidal Disruption Events with Accurate Stellar Structure. Astrophys. J. 882, L26 (2019).
- 120. King, A. Why are quasi-periodic eruptions only found in low-mass galaxies? Mon. Not. R. Astron. Soc. 526, L31–L33 (2023).
- 121. Lacy, J. H., Townes, C. H. & Hollenbach, D. J. The nature of the central parsec of the Galaxy. Astrophys. J. 262, 120–134 (1982).
- 122. Metzger, B. D., Stone, N. C. & Gilbaum, S. Interacting Stellar EMRIs as Sources of Quasi-periodic Eruptions in Galactic Nuclei. Astrophys. J. 926, 101 (2022).
- 123. Lu, W. & Quataert, E. Quasi-periodic eruptions from mildly eccentric unstable mass transfer in galactic nuclei. Mon. Not. R. Astron. Soc. 524, 6247–6266 (2023).
- 124. King, A. Angular momentum transfer in QPEs from galaxy nuclei. Mon. Not. R. Astron. Soc. 520, L63–L67 (2023).
- 125. Noble, S. C., Gammie, C. F., McKinney, J. C. & Del Zanna, L. Primitive Variable Solvers for Conservative General Relativistic Magnetohydrodynamics. Astrophys. J. 641, 626–637 (2006).
- 126. Ressler, S. M., Tchekhovskoy, A., Quataert, E., Chandra, M. & Gammie, C. F. Electron thermodynamics in GRMHD simulations of low-luminosity black hole accretion. Mon. Not. R. Astron. Soc. 454, 1848–1870 (2015).
- 127. Tchekhovskoy, A., McKinney, J. C. & Narayan, R. WHAM: a WENO-based general relativistic numerical scheme - I. Hydrodynamics. Mon. Not. R. Astron. Soc. 379, 469–497 (2007).
- 128. Lu, W. & Quataert, E. Quasi-periodic eruptions from mildly eccentric unstable mass transfer in galactic nuclei. arXiv e-prints arXiv:2210.08023 (2022).
- 129. Franchini, A. et al. Quasi-periodic eruptions from impacts between the secondary and a rigidly precessing accretion disc in an extreme mass-ratio inspiral system. Astron. Astrophys. 675, A100 (2023).
- 130. Tagawa, H. & Haiman, Z. Flares from stars crossing active galactic nuclei disks on low-inclination orbits. arXiv e-prints arXiv:2304.03670 (2023).
- 131. MacLeod, M., Ramirez-Ruiz, E., Grady, S. & Guillochon, J. Spoon-feeding Giant Stars to Supermassive Black Holes: Episodic Mass Transfer from Evolving Stars and their Contribution to the Quiescent Activity of Galactic Nuclei. Astrophys. J. 777, 133 (2013).
- 132. Schödel, R. et al. The Milky Way’s nuclear star cluster: Old, metal-rich, and cuspy. Structure and star formation history from deep imaging. Astron. Astrophys. 641, A102 (2020).
- 133. Stephan, A. P. et al. The Fate of Binaries in the Galactic Center: The Mundane and the Exotic. Astrophys. J. 878, 58 (2019).
- 134. Zajaček, M., Karas, V. & Eckart, A. Dust-enshrouded star near supermassive black hole: predictions for high-eccentricity passages near low-luminosity galactic nuclei. Astron. Astrophys. 565, A17 (2014).
- 135. Coughlin, E. R. & Nixon, C. Variability in Tidal Disruption Events: Gravitationally Unstable Streams. Astrophys. J. 808, L11 (2015).
- 136. Guillochon, J., Loeb, A., MacLeod, M. & Ramirez-Ruiz, E. Possible Origin of the G2 Cloud from the Tidal Disruption of a Known Giant Star by Sgr A*. Astrophys. J. 786, L12 (2014).
- 137. Coughlin, E. R., Nixon, C., Begelman, M. C. & Armitage, P. J. On the structure of tidally disrupted stellar debris streams. Mon. Not. R. Astron. Soc. 459, 3089–3103 (2016).
- 138. Coughlin, E. R. The dynamics of debris streams from tidal disruption events: exact solutions, critical stream density, and hydrogen recombination. Mon. Not. R. Astron. Soc. 522, 5500–5516 (2023).
- 139. Chandrasekhar, S. Hydrodynamic and hydromagnetic stability (Dover Publications, 1961).
- 140. Coughlin, E. R., Nixon, C. J., Barnes, J., Metzger, B. D. & Margutti, R. Variability in Short Gamma-Ray Bursts: Gravitationally Unstable Tidal Tails. Astrophys. J. 896, L38 (2020).
- 141. Nixon, C. J. & Coughlin, E. R. Stellar Revival and Repeated Flares in Deeply Plunging Tidal Disruption Events. Astrophys. J. 927, L25 (2022).
- 142. Darbha, S., Coughlin, E. R., Kasen, D. & Nixon, C. Ultra-deep tidal disruption events: prompt self-intersections and observables. Mon. Not. R. Astron. Soc. 488, 5267–5278 (2019).
- 143. Bicknell, G. V. & Gingold, R. A. On tidal detonation of stars by massive black holes. Astrophys. J. 273, 749–760 (1983).
- 144. Coughlin, E. R. & Nixon, C. J. Stars Crushed by Black Holes. II. A Physical Model of Adiabatic Compression and Shock Formation in Tidal Disruption Events. Astrophys. J. 926, 47 (2022).
- 145. Stone, N., Sari, R. & Loeb, A. Consequences of strong compression in tidal disruption events. Mon. Not. R. Astron. Soc. 435, 1809–1824 (2013).
- 146. Sakurai, A. On the problem of a shock wave arriving at the edge of a gas. Comm. Pure Appl. Math. 13, 353–370 (1960).
- 147. Ro, S. & Matzner, C. D. Shock Emergence in Supernovae: Limiting Cases and Accurate Approximations. Astrophys. J. 773, 79 (2013).