Deployment of Real-Time Network Traffic Analysis
using GraphBLAS Hypersparse Matrices
and D4M Associative Arrays
††thanks:
This material is based upon work supported by the Assistant Secretary of Defense for Research and Engineering under Air Force Contract No. FA8702-15-D-0001. Any opinions, findings, conclusions or recommendations expressed in this material are those of the author(s) and do not necessarily reflect the views of the Assistant Secretary of Defense for Research and Engineering. Research was also sponsored by the United States Air Force Research Laboratory and the Department of the Air Force Artificial Intelligence Accelerator and was accomplished under Cooperative Agreement Number FA8750-19-2-1000. The views and conclusions contained in this document are those of the authors and should not be interpreted as representing the official policies, either expressed or implied, of the Department of the Air Force or the U.S. Government. The U.S. Government is authorized to reproduce and distribute reprints for Government purposes notwithstanding any copyright notation herein.
Abstract
Matrix/array analysis of networks can provide significant insight into their behavior and aid in their operation and protection. Prior work has demonstrated the analytic, performance, and compression capabilities of GraphBLAS (graphblas.org) hypersparse matrices and D4M (d4m.mit.edu) associative arrays (a mathematical superset of matrices). Obtaining the benefits of these capabilities requires integrating them into operational systems, which comes with its own unique challenges. This paper describes two examples of real-time operational implementations. First, is an operational GraphBLAS implementation that constructs anonymized hypersparse matrices on a high-bandwidth network tap. Second, is an operational D4M implementation that analyzes daily cloud gateway logs. The architectures of these implementations are presented. Detailed measurements of the resources and the performance are collected and analyzed. The implementations are capable of meeting their operational requirements using modest computational resources (a couple of processing cores). GraphBLAS is well-suited for low-level analysis of high-bandwidth connections with relatively structured network data. D4M is well-suited for higher-level analysis of more unstructured data. This work demonstrates that these technologies can be implemented in operational settings.
Index Terms:
network analysis, packet capture, streaming graphs, hypersparse matrices, associative arrays, real-time analysisI Introduction
Matrix/array-based analysis of graphs and networks can provide significant insight into their behavior and aid in their operation and protection [1, 2, 3, 4, 5, 6, 7, 8, 9, 10, 11, 12, 13, 14, 15, 16, 17, 18, 19]. Extensive prior work has demonstrated the analytic, performance, and compression capabilities of the open standard GraphBLAS – Graph Basic Linear Algebra Subprograms – (graphblas.org) hypersparse matrices and D4M – Dynamic Distributed Dimensional Data Model – (d4m.mit.edu) associative arrays (a mathematical superset of matrices)[20, 21, 22, 23, 24, 25, 26, 27, 28, 29, 30, 31, 32, 33, 34, 35, 36, 37].
Formulas for computing network quantities from traffic matrix/array at time in both summation and matrix notation. is a column vector of all 1’s, T is the transpose operation, and is the zero-norm that sets each nonzero value of its argument to 1[39]. These formulas are unaffected by permutations and will work on anonymized data. Table adapted from [40].
| Aggregate | Summation | Matrix/Array |
| Property | Notation | Notation |
| Valid packets | ||
| Unique links | ||
| Link packets from to | ||
| Max link packets | ||
| Unique sources | ||
| Packets from source | ||
| Max source packets | ||
| Source fan-out from | ||
| Max source fan-out | ||
| Unique destinations | ||
| Destination packets to | ||
| Max destination packets | ||
| Destination fan-in to | ||
| Max destination fan-in |
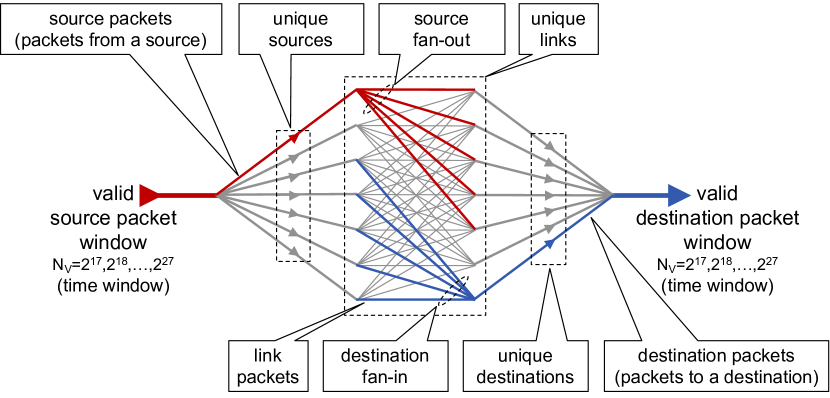
A primary benefit of matrix/array-based analysis of graphs and networks is the efficient computation of a wide range of analytics quantities via simple mathematical formulas. Figure 1 illustrates essential quantities found in all streaming dynamic networks. In real-world applications of streaming graph/network data, it is common to filter the events/packets to a valid set for any particular analysis. Such filters may limit particular sources, destinations, protocols, and time windows. At a given time , consecutive valid events/packets are aggregated from the traffic into a hypersparse matrix or associative array , where is the number of valid events/packets between the source and destination . The sum of all the entries in is equal to
All the network quantities depicted in Figure 1 can be readily computed from using the formulas listed in Table I. If the events/packets are mostly unique, an matrix with a given number of events/packets can be denoted as dense (), sparse (), or hypersparse () [41]. Associative arrays are a superset of matrices and extend the index and value sets of matrices to be any strict totally orderable set, which allows using unstructured data, such as strings, as either indices or values. By design, associative arrays are almost always hypersparse. Mathematically, both hypersparse matrices and associative arrays are defined as mappings from row keys and column keys to a value set
In this context, the hypersparse matrices have ; are real numbers approximated as double precision floating point values. Likewise, the associative arrays have that are all strict totally ordered sets approximated as strings.
The ability to handle hypersparse and/or unstructured data allows simple algebraic equations to be used to analyze streaming network data. Obtaining the benefits of these capabilities in real-world applications requires integrating them into operational systems, which comes with its own unique challenges. This paper describes two such instances of real-time operational implementations as follows. First, building on prior work [30], an operational GraphBLAS implementation that constructs anonymized hypersparse matrices on a high-bandwidth network tap. Second, an operational D4M implementation that analyzes daily cloud gateway logs. The architectures of these implementations are presented. Detailed measurements of the resources and the performance are collected and analyzed. The goal is to illustrate to others some effective architectures for deploying matrix/array-based analysis on streaming networks and to set the expectations on the potential rates and resources required.
II GraphBLAS Real-Time Deployment
The data volumes, processing requirements, and privacy concerns of analyzing a significant fraction of the Internet have been prohibitive. The North American Internet generates billions of non-video Internet packets each second [43, 44]. The GraphBLAS standard provides significant performance and compression capabilities which improve the feasibility of analyzing these volumes of data. Specifically, the GraphBLAS is ideally suited for both constructing and analyzing anonymized hypersparse traffic matrices. Prior work with the GraphBLAS has demonstrated rates of 200 billion hypersparse matrix entries per second on a supercomputer [45], while achieving compressions of 1 bit per packet [31], and enabling the analysis of the largest publicly available historical archives with over 40 trillion packets [46].
It should be noted, that GraphBLAS anonymized hypersparse traffic matrices represent only one set of design choices for analyzing network traffic. Specifically, the use case requiring some data on all packets (no down-sampling), high performance, high compression, matrix-based analysis, anonymization, and open standards. There are a wide range of alternative graph/network analysis technologies and many good implementations achieve performance close to the limits of the underlying computing hardware [47, 48, 49, 50, 51, 52, 53, 54, 55, 56, 57]. Likewise, there are many network analysis tools that focus on providing a rich interface to the full diversity of data found in network traffic [58, 59]. Each of these technologies has appropriate use cases in the broad field of Internet traffic analysis.
The operational implementation described here builds on prior work [30] that demonstrated the ability of GraphBLAS to construct anonymized hypersparse traffic matrices at rates consistent with terabit networks using a few processing cores. The mathematical functionality is briefly summarized as follows.
II-A Mathematics and Anonymization
An essential aspect of this implementation is the use of constant packet, variable time sample windows, each with the same number of events/packets (denoted ). Network traffic is dynamic and exhibits varying behavior on a wide range of time scales. A given packet window size will be sensitive to phenomena on its corresponding timescale. Determining how network quantities scale with provides insight into the temporal behavior of network traffic. Constant packet, variable time samples simplify the statistical analysis of the heavy-tail distributions commonly found in network traffic quantities [60]. The contiguous nature of these data allows the exploration of a wide range of packet windows typically from (sub-second) to (minutes), providing a unique view into how network quantities depend upon time. Efficient computation of network quantities on multiple time scales can be achieved by hierarchically aggregating data in different time windows [31].
Internet data must be handled with care requiring trusted data sharing best practices that combine anonymizing source and destinations with data sharing agreements. These data sharing best practices are the basis of the architecture presented here and include the following principles [61]
-
•
Data is made available in curated repositories
-
•
Using standard anonymization methods where needed: hashing, sampling, and/or simulation
-
•
Registration with a repository and demonstration of legitimate research need
-
•
Recipients legally agree to neither repost a corpus nor deanonymize data
-
•
Recipients can publish analysis and data examples necessary to review research
-
•
Recipients agree to cite the repository and provide publications back to the repository
-
•
Repositories can curate enriched products developed by researchers
Collection at the network source allows the data owner to construct and own the anonymization scheme and only share anonymized data under trusted data sharing agreements with the parties tasked with analyzing the data [62].
One of the important capabilities of the SuiteSparse GraphBLAS library is efficient support of hypersparse matrices where the number of nonzero entries is significantly less than either dimensions of the matrix. If the packet source and destination identifiers are drawn from a large numeric range, such as those used in the Internet protocol, then a hypersparse representation of eliminates the need to keep track of additional indices and can significantly accelerate the computations [31].
Because matrix operations are generally invariant to permutation (reordering of the rows and columns), these quantities can readily be computed from anonymized data. Furthermore, the anonymized data can be analyzed by subranges represented as subsets of IPs using simple matrix multiplication. For a given subrange represented by an anonymized hypersparse diagonal matrix , where implies source/destination is in the range, the traffic within the subrange can be computed via: . Likewise, for additional privacy guarantees that can be implemented at the edge, the same method can be used to exclude a range of data from the traffic matrix
II-B Implementation
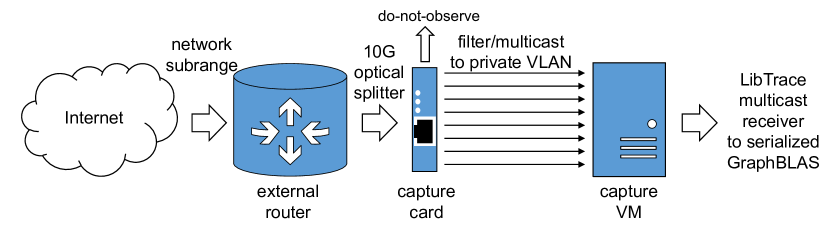
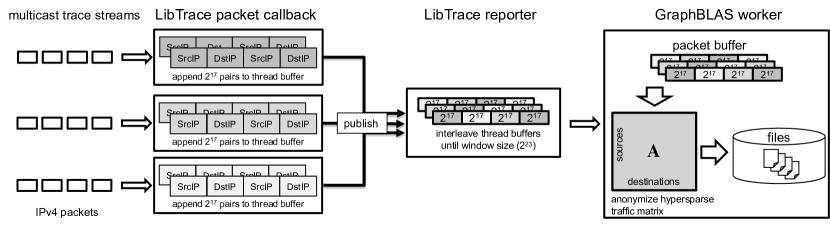
The operational implementation of the above functionality is depicted in Figure 2 and Figure 3. In this implementation an Internet subrange is announced by the operator, and routed to the operator, where an optical splitter routes traffic to a server containing an Endace DAG 10X2-P capture card which filters out do-not-observe traffic before multicasting it onto a private VLAN (virtual local area network). The LibTrace library [42] multicasts the stream to clients running on servers in VMs (virtual machines) that have interfaces on the private VLAN. These clients can subscribe to a multicast group and receive the raw feed round-robin split into 8 separate streams to maintain performance.
Inside the clients, the per-packet LibTraceAPI callback is used to extract the source and destination of 32-bit IPv4 addresses from each individually arriving packet and append them into a per-thread/per-stream packet buffer. When packets have been received by one of these per-packet stream processing threads, it publishes this block to a single reporter thread, which appends newly-arriving blocks of packets together in a larger buffer. After packets (64 published blocks) have been received by the reporter thread, it loops through each element of this larger block, anonymizing each IP address before building (row, col, packet count) vectors out of them. The anonymization of the source and destinations is performed using CryptoPAN [63] either directly or via a pre-populated element lookup table. This is a simple size-speed trade-off. If speed is important, and a lookup table can fit in memory, the lookup table is faster. If memory is important, CryptoPAN can be run directly on the data, resulting in an 100x less memory usage at the cost of a 10x slowdown. Other anonymization schemes can be chosen that offer different trade-offs [64]. The anonymized vectors for each set of packets is then used to build a anonymized hypersparse GraphBLAS matrix. The GraphBLAS matrices are serialized, compressed using Zstd level 1, and the result is saved to disk as 64 files inside a single UNIX TAR file representing packets. The TAR files are then transmitted to another system for archiving and more in-depth off-line analysis. The time to save compress and save to disk is negligible and not a factor in overall performance.
III D4M Real-Time Deployment
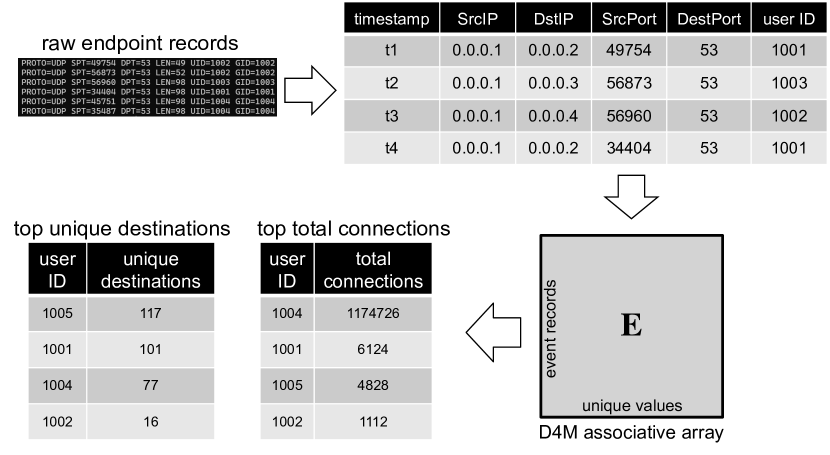
The D4M library (d4m.mit.edu) implements associative array mathematics in multiple languages (Python, Julia, Matlab, and Octave) [65, 66, 67, 32]. As described earlier, associative arrays are a generalization of matrices that allow unstructured data to be used as rows, columns, or values. D4M is particularly useful in analyzing log data or interfacing with databases. Many firewalls and cloud systems maintain raw connection logs to support operational capability and provide visibility into potentially unwanted behavior on or by the system. These connection logs often contain diverse unstructured data. Figure 4 shows an operational example of how D4M is used to analyze the daily connections logs of a cloud system. Internet-connected hosts on a compute cloud have netfilter rules that log the details of all newly originated sessions with external (Internet) destinations. The logs include the user ID of the connection’s owner. These connection details are forwarded to a central log server in near real-time where they are logged to disk, and a nightly cron job parses them into to tabular (TSV) format. A secondary process reads this tabular data into a D4M analysis environment, converts them to associative arrays, and performs analytics to produce a daily report
Mathematically, the tabular log data is transformed to a associative array where the rows are the event records and the columns are unique values of the record. Such an event array tends to be very sparse since each unique value has is a column. Tallying records can then be done easily with array multiplication. For example, creating a user ID by destination array is done be multiplying sub-arrays holding the appropriate fields of data
Top connection counts and destination counts by userID can be calculated by applying the appropriate formulas from Table I
Likewise, top connections and userID by destination can be calculated by multiplying by on the left instead of the right
IV Results
The goal of this work is to illustrate some effective architectures for deploying matrix/array-based analysis on streaming networks and to set the expectations on the potential rates and resources required. For both of the implementations measurements were taken of their rates of execution and resource consumption during operation.
IV-A GraphBLAS Real-Time Deployment
Performance measurements for the GraphBLAS real-time deployment were collected on a 8-core VM with 32 GB of RAM hosted on a research compute cloud. Measurements were collected at 1-second intervals for 30 minutes with psrecord, a small Python utility that uses the psutil library to record the CPU and memory activity of a process by polling statistics from the Linux /proc filesystem, using the command
psrecord --interval 1 --duration 1800
         --log psrecord-real.txt <PID>
In addition, the timestamps of each TAR file created were recorded. These data were collected on an instance of the program that had been running for many months without interruption and represent a good example of the sustained resource requirements for the capability.
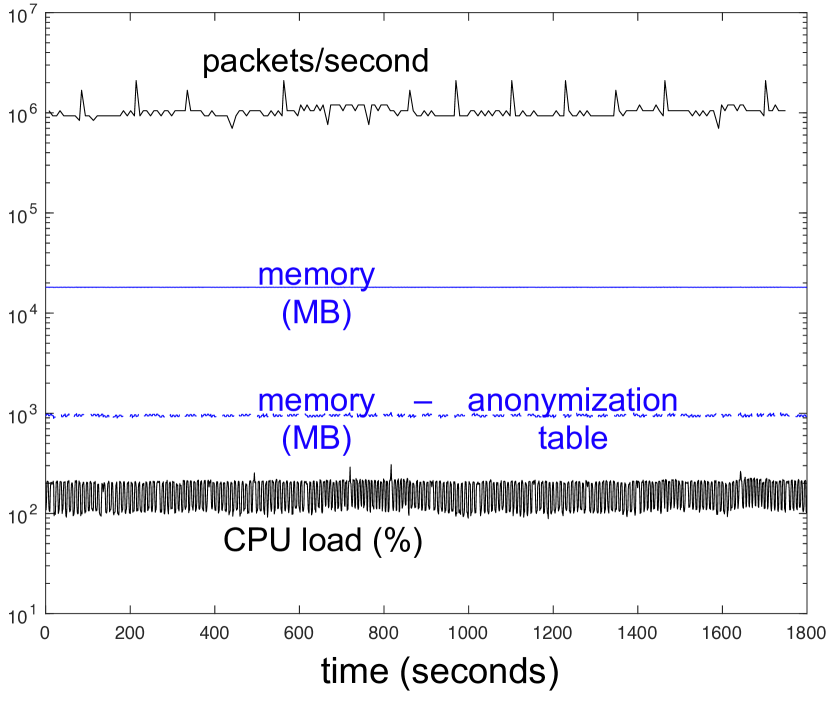
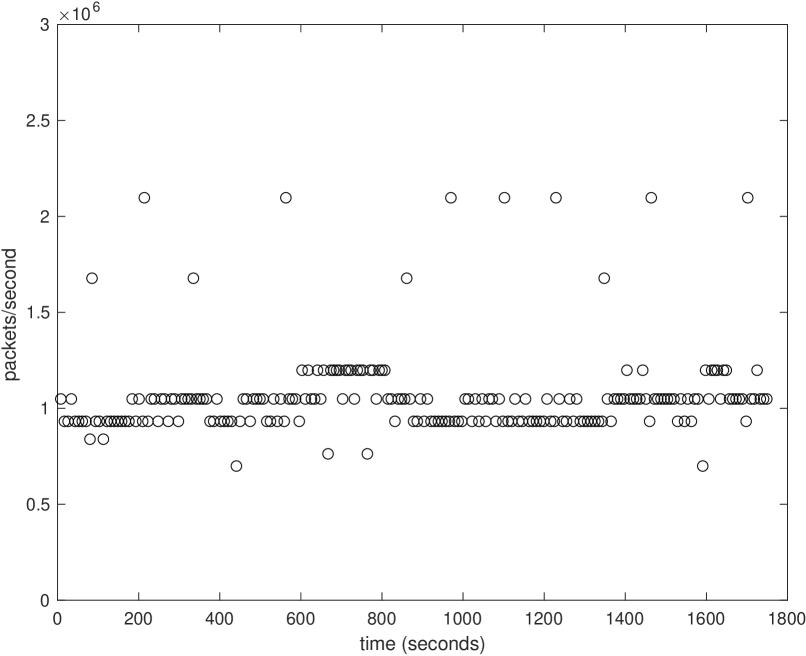
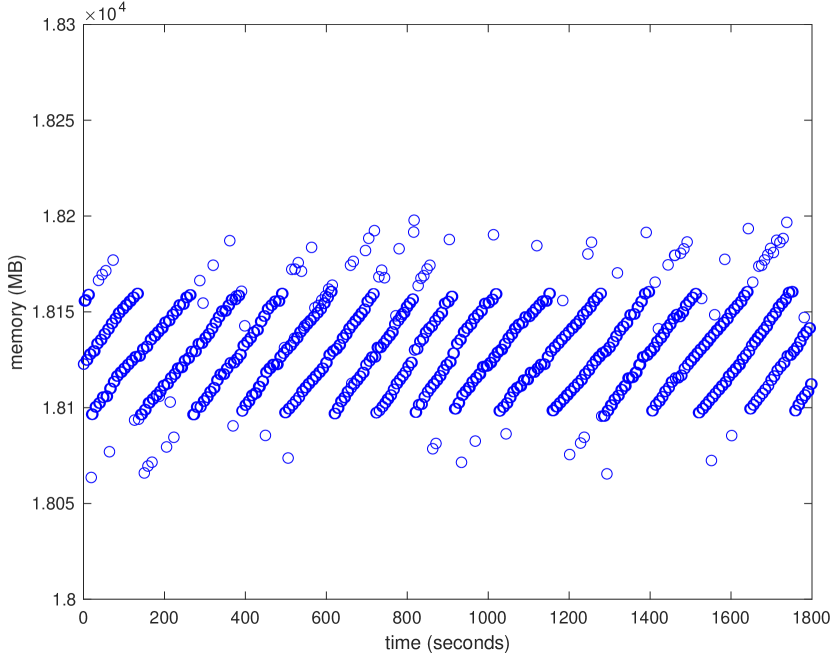
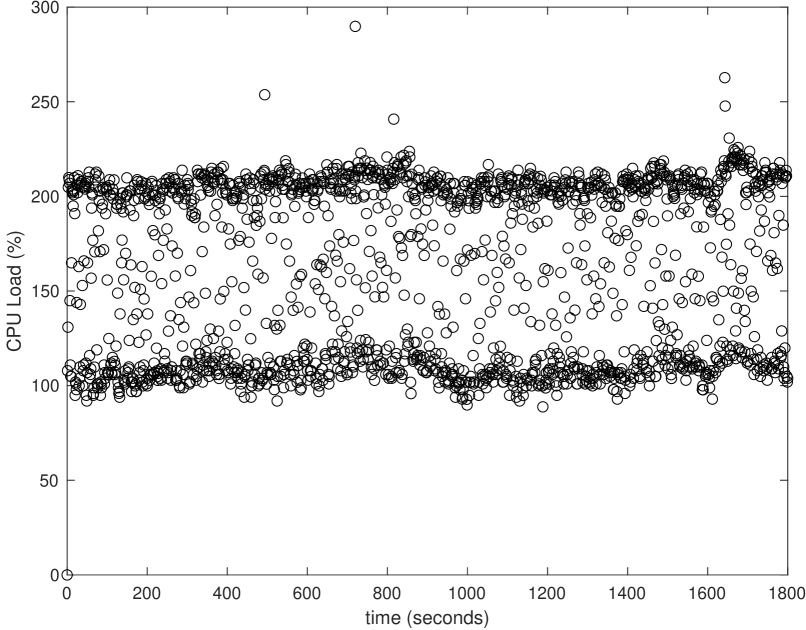
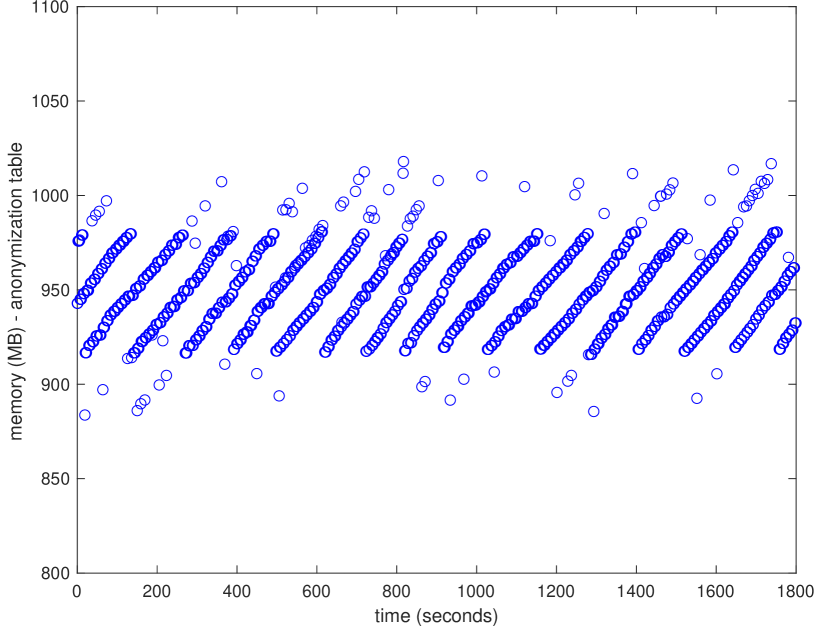
Figure 5 presents and overview of rates, total memory, active memory, and processing load over the time of the collection. The rates are computed by counting the number events/packets in a file and dividing that by the differences in the time stamps between successive files. The active memory is the total memory minus the 17 GB CrypoPAN lookup table. Each of the quantities is relatively stable over the collection period. Figure 6 provides more detailed looks at each of the measured quantities. Packets/second varies from to . The discrete levels are a result of the 1 second granularity of the timer. CPU load is shown as a percentage of core utilization. The CPU load varies distinctly from fully using one (100%) or two (200%) cores. Profiling indicates that the dominant operation is the GraphBLAS hypersparse matrix constructor. The observed load is consistent with 8 threads running on the 8 available cores with a maximum effective GraphBLAS hypersparse matrix constructor duty cycle of 25%. The memory fluctuations are consistent with memory allocation requirements of the packet buffers and the natural fluctuations of the underlying LibTrace buffers as it reacts to spikes in packet volume over time. These memory requests are 0.1% of the peak memory bandwidth and have a negligible impact on performance.
IV-B D4M Real-Time Deployment
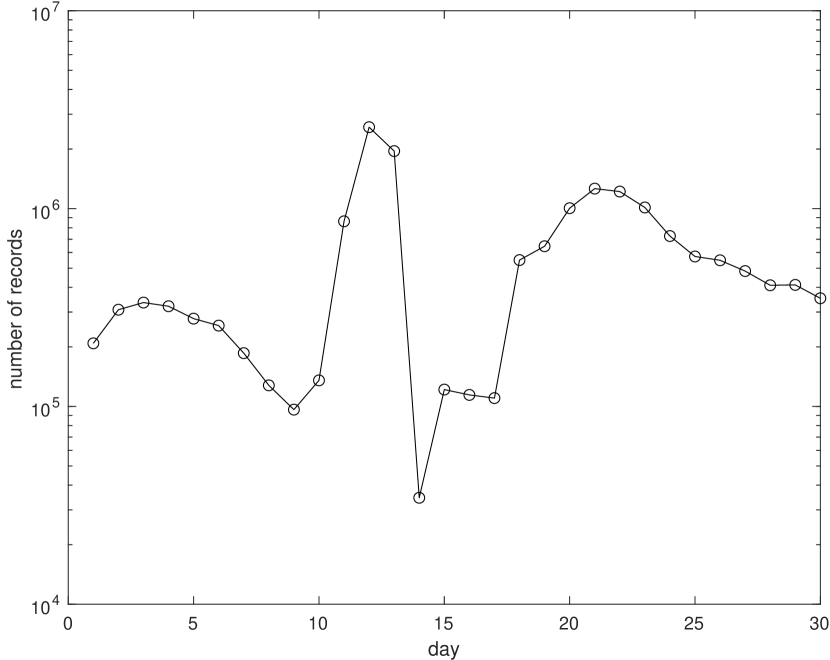
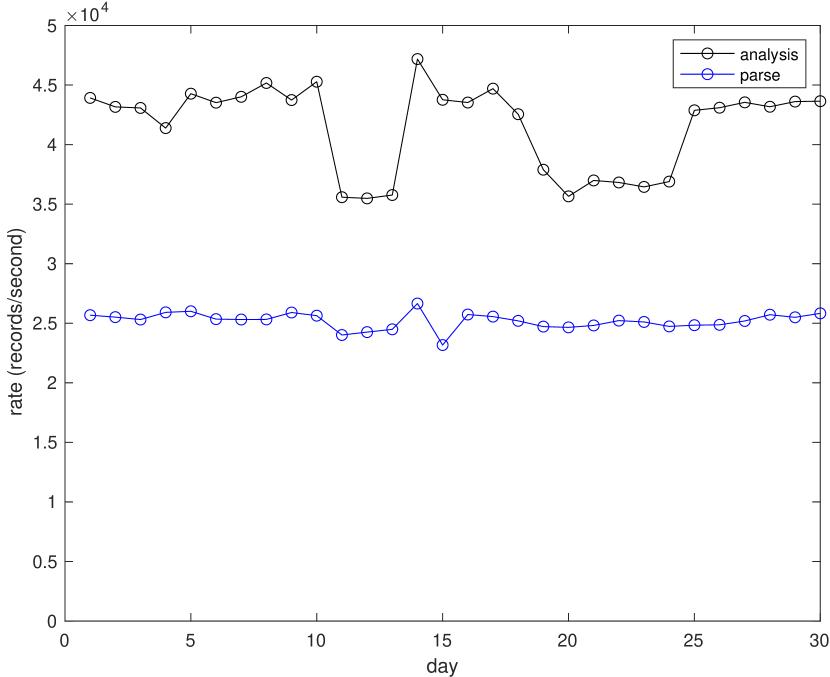
Performance measurements for the D4M analysis were taken using a dual Intel Xeon Platinum 8260 server with 192GB of RAM. A single-process single-threaded instance of D4M running GNU Octave version 6.3.0 was used. The execution of the parse and analysis steps were timed separately over 30 days of daily log analysis. Figure 7 shows the number of connection records that were logged each day, which varies significantly between and records per day. Figure 8 shows the parse and analysis rates in terms of records per second. These are consistent with benchmarked single-process single-thread performance rates for the D4M analysis framework [65, 67, 32] which are set by underlying performance of their language provided variable length string sorters.
V Conclusions and Future Work
Significant insight into the behavior, operation, and protection of networks can be gained via matrix/array-based analyses techniques. This paper builds on prior work on GraphBLAS (graphblas.org) hypersparse matrices and D4M (d4m.mit.edu) associative arrays (a mathematical superset of matrices) by integrating them into two operational systems. First, an operational GraphBLAS implementation that constructs anonymized hypersparse matrices on a high-bandwidth network tap. Second, an operational D4M implementation that analyzes daily cloud gateway logs. The architectures of these implementations can be viewed as starting points for others trying to deploy matrix/array-based network analyses techniques. Detailed measures of the resources and performance of these implementations indicate they are capable of keeping up with their operational requirements using modest computational resources (a couple of processing cores). GraphBLAS is well-suited for low-level analysis of high-bandwidth connections with relatively structured network data. D4M is well-suited for higher-level analysis of more unstructured data.
Future work in this area could expand the ecosystem for matrix/array-based network analyses by incorporating these methods into next generation cloud operating systems, programmable network technologies [68, 69], the hierarchical integration of low-level network with high-level network data, and privacy-preserving network protection strategies.
Acknowledgments
The authors wish to acknowledge the following individuals for their contributions and support: Daniel Andersen, Sean Atkins, Chris Birardi, Bob Bond, Andy Bowne, Stephen Buckley, K Claffy, Cary Conrad, Chris Demchak, Alan Edelman, Garry Floyd, Jeff Gottschalk, Dhruv Gupta, Chris Hill, Kurt Keville, Charles Leiserson, Chase Milner, Sanjeev Mohindra, Dave Martinez, Joseph McDonald, Sandy Pentland, Heidi Perry, Christian Prothmann, John Radovan, Steve Rejto, Josh Rountree, Daniela Rus, Scott Weed, Marc Zissman.
References
- [1] A. Soule, A. Nucci, R. Cruz, E. Leonardi, and N. Taft, “How to identify and estimate the largest traffic matrix elements in a dynamic environment,” in ACM SIGMETRICS Performance Evaluation Review, vol. 32, pp. 73–84, ACM, 2004.
- [2] Y. Zhang, M. Roughan, C. Lund, and D. L. Donoho, “Estimating point-to-point and point-to-multipoint traffic matrices: an information-theoretic approach,” IEEE/ACM Transactions on Networking (TON), vol. 13, no. 5, pp. 947–960, 2005.
- [3] P. J. Mucha, T. Richardson, K. Macon, M. A. Porter, and J.-P. Onnela, “Community structure in time-dependent, multiscale, and multiplex networks,” science, vol. 328, no. 5980, pp. 876–878, 2010.
- [4] P. Tune, M. Roughan, H. Haddadi, and O. Bonaventure, “Internet traffic matrices: A primer,” Recent Advances in Networking, vol. 1, pp. 1–56, 2013.
- [5] E. H. Do and V. N. Gadepally, “Classifying anomalies for network security,” in ICASSP 2020 - 2020 IEEE International Conference on Acoustics, Speech and Signal Processing (ICASSP), pp. 2907–2911, 2020.
- [6] S. Weed, “Beyond zero trust: Reclaiming blue cyberspace,” Master’s thesis, United States Army War College, 2022.
- [7] I. Kawaminami, A. Estrada, Y. Elsakkary, H. Jananthan, A. Buluç, T. Davis, D. Grant, M. Jones, C. Meiners, A. Morris, S. Pisharody, and J. Kepner, “Large scale enrichment and statistical cyber characterization of network traffic,” in 2022 IEEE High Performance Extreme Computing Conference (HPEC), pp. 1–7, 2022.
- [8] O. A. Rodriguez, Z. Du, J. Patchett, F. Li, and D. A. Bader, “Arachne: An arkouda package for large-scale graph analytics,” in 2022 IEEE High Performance Extreme Computing Conference (HPEC), pp. 1–7, 2022.
- [9] L. J. Durbeck and P. Athanas, “Kalman filter driven estimation of community structure in time varying graphs,” in 2022 IEEE High Performance Extreme Computing Conference (HPEC), pp. 1–7, 2022.
- [10] P. Sathre, A. Gondhalekar, and W.-c. Feng, “Edge-connected jaccard similarity for graph link prediction on fpga,” in 2022 IEEE High Performance Extreme Computing Conference (HPEC), pp. 1–10, 2022.
- [11] L. Zhao, Q. Wu, X. Wang, T. Tian, W. Wu, and X. Jin, “Hugraph: Acceleration of gcn training on heterogeneous fpga clusters with quantization,” in 2022 IEEE High Performance Extreme Computing Conference (HPEC), pp. 1–7, 2022.
- [12] P. Zhang, R. Kannan, X. Tong, A. V. Nori, and V. K. Prasanna, “Sharp: Software hint-assisted memory access prediction for graph analytics,” in 2022 IEEE High Performance Extreme Computing Conference (HPEC), pp. 1–8, 2022.
- [13] M. Mandulak, R. Hu, and G. Slota, “Explicit ordering refinement for accelerating irregular graph analysis,” in 2022 IEEE High Performance Extreme Computing Conference (HPEC), pp. 1–8, 2022.
- [14] S. Kang, J. Nke, and B. Rees, “Analyzing multi-trillion edge graphs on large gpu clusters: A case study with pagerank,” in 2022 IEEE High Performance Extreme Computing Conference (HPEC), pp. 1–7, 2022.
- [15] J. Moe, K. Pogorelov, D. T. Schroeder, and J. Langguth, “Implementing spatio-temporal graph convolutional networks on graphcore ipus,” in 2022 IEEE International Parallel and Distributed Processing Symposium Workshops (IPDPSW), pp. 45–54, 2022.
- [16] S. Singh and B. Uçar, “An efficient parallel implementation of a perfect hashing method for hypergraphs,” in 2022 IEEE International Parallel and Distributed Processing Symposium Workshops (IPDPSW), pp. 265–274, 2022.
- [17] X. T. Liu, J. Firoz, A. H. Gebremedhin, and A. Lumsdaine, “Nwhy: A framework for hypergraph analytics: Representations, data structures, and algorithms,” in 2022 IEEE International Parallel and Distributed Processing Symposium Workshops (IPDPSW), pp. 275–284, 2022.
- [18] J. A. Acosta, T. M. Low, and D. N. Parikh, “Families of butterfly counting algorithms for bipartite graphs,” in 2022 IEEE International Parallel and Distributed Processing Symposium Workshops (IPDPSW), pp. 304–313, 2022.
- [19] M. Osama, S. D. Porumbescu, and J. D. Owens, “Essentials of parallel graph analytics,” in 2022 IEEE International Parallel and Distributed Processing Symposium Workshops (IPDPSW), pp. 314–317, 2022.
- [20] A. Buluç, T. Mattson, S. McMillan, J. Moreira, and C. Yang, “Design of the graphblas api for c,” in 2017 IEEE International Parallel and Distributed Processing Symposium Workshops (IPDPSW), pp. 643–652, 2017.
- [21] C. Yang, A. Buluç, and J. D. Owens, “Implementing push-pull efficiently in graphblas,” in Proceedings of the 47th International Conference on Parallel Processing, pp. 1–11, 2018.
- [22] J. Kepner and H. Jananthan, Mathematics of big data: Spreadsheets, databases, matrices, and graphs. MIT Press, 2018.
- [23] T. A. Davis, “Algorithm 1000: Suitesparse: Graphblas: Graph algorithms in the language of sparse linear algebra,” ACM Transactions on Mathematical Software (TOMS), vol. 45, no. 4, pp. 1–25, 2019.
- [24] T. Mattson, T. A. Davis, M. Kumar, A. Buluc, S. McMillan, J. Moreira, and C. Yang, “Lagraph: A community effort to collect graph algorithms built on top of the graphblas,” in 2019 IEEE International Parallel and Distributed Processing Symposium Workshops (IPDPSW), pp. 276–284, IEEE, 2019.
- [25] T. A. Davis, M. Aznaveh, and S. Kolodziej, “Write quick, run fast: Sparse deep neural network in 20 minutes of development time via suitesparse: Graphblas,” in 2019 IEEE High Performance Extreme Computing Conference (HPEC), pp. 1–6, IEEE, 2019.
- [26] M. Aznaveh, J. Chen, T. A. Davis, B. Hegyi, S. P. Kolodziej, T. G. Mattson, and G. Szárnyas, “Parallel graphblas with openmp,” in 2020 Proceedings of the SIAM Workshop on Combinatorial Scientific Computing, pp. 138–148, SIAM, 2020.
- [27] B. Brock, A. Buluç, T. G. Mattson, S. McMillan, and J. E. Moreira, “Introduction to graphblas 2.0,” in 2021 IEEE International Parallel and Distributed Processing Symposium Workshops (IPDPSW), pp. 253–262, IEEE, 2021.
- [28] T. A. Davis, “Algorithm 10xx: Suitesparse: Graphblas: Parallel graph algorithms in the language of sparse linear algebra,” ACM Transactions on Mathematical Software, 2021.
- [29] M. Pelletier, W. Kimmerer, T. A. Davis, and T. G. Mattson, “The graphblas in julia and python: the pagerank and triangle centralities,” in 2021 IEEE High Performance Extreme Computing Conference (HPEC), pp. 1–7, 2021.
- [30] M. Jones, J. Kepner, D. Andersen, A. Buluç, C. Byun, K. Claffy, T. Davis, W. Arcand, J. Bernays, D. Bestor, W. Bergeron, V. Gadepally, M. Houle, M. Hubbell, H. Jananthan, A. Klein, C. Meiners, L. Milechin, J. Mullen, S. Pisharody, A. Prout, A. Reuther, A. Rosa, S. Samsi, J. Sreekanth, D. Stetson, C. Yee, and P. Michaleas, “Graphblas on the edge: Anonymized high performance streaming of network traffic,” in 2022 IEEE High Performance Extreme Computing Conference (HPEC), pp. 1–8, 2022.
- [31] T. Trigg, C. Meiners, S. Pisharody, H. Jananthan, M. Jones, A. Michaleas, T. Davis, E. Welch, W. Arcand, D. Bestor, W. Bergeron, C. Byun, V. Gadepally, M. Houle, M. Hubbell, A. Klein, P. Michaleas, L. Milechin, J. Mullen, A. Prout, A. Reuther, A. Rosa, S. Samsi, D. Stetson, C. Yee, and J. Kepner, “Hypersparse network flow analysis of packets with graphblas,” in 2022 IEEE High Performance Extreme Computing Conference (HPEC), pp. 1–7, 2022.
- [32] H. Jananthan, L. Milechin, M. Jones, W. Arcand, W. Bergeron, D. Bestor, C. Byun, M. Houle, M. Hubbell, V. Gadepally, A. Klein, P. Michnlons, G. Morales, J. Mullen, A. Prout, A. Reuther, A. Rosa, S. Samsi, C. Yee, and J. Kepner, “Python implementation of the dynamic distributed dimensional data model,” in 2022 IEEE High Performance Extreme Computing Conference (HPEC), pp. 1–8, 2022.
- [33] I. Afanasyev, K. Komatsu, D. Lichmanov, V. Voevodin, and H. Kobayashi, “High-performance graphblas backend prototype for nec sx-aurora tsubasa,” in 2022 IEEE International Parallel and Distributed Processing Symposium Workshops (IPDPSW), pp. 221–229, 2022.
- [34] A. Mastoras, S. Anagnostidis, and A. N. Yzelman, “Nonblocking execution in graphblas,” in 2022 IEEE International Parallel and Distributed Processing Symposium Workshops (IPDPSW), pp. 230–233, 2022.
- [35] P. Costanza, I. Hurt, and T. G. Mattson, “Towards a graphblas implementation for go,” in 2022 IEEE International Parallel and Distributed Processing Symposium Workshops (IPDPSW), pp. 01–04, 2022.
- [36] B. Brock, S. McMillan, A. Buluç, T. G. Mattson, and J. E. Moreira, “Graphblas: C++ iterators for sparse matrices,” in 2022 IEEE International Parallel and Distributed Processing Symposium Workshops (IPDPSW), pp. 238–246, 2022.
- [37] A. Scolari and A.-J. Yzelman, “Effective implementation of the high performance conjugate gradient benchmark on graphblas,” IPDPSW GrAPL, 2023.
- [38] J. Kepner, K. Cho, K. Claffy, V. Gadepally, P. Michaleas, and L. Milechin, “Hypersparse neural network analysis of large-scale internet traffic,” in 2019 IEEE High Performance Extreme Computing Conference (HPEC), pp. 1–11, 2019.
- [39] J. Karvanen and A. Cichocki, “Measuring sparseness of noisy signals,” in 4th International Symposium on Independent Component Analysis and Blind Signal Separation, pp. 125–130, 2003.
- [40] J. Kepner, C. Meiners, C. Byun, S. McGuire, T. Davis, W. Arcand, J. Bernays, D. Bestor, W. Bergeron, V. Gadepally, R. Harnasch, M. Hubbell, M. Houle, M. Jones, A. Kirby, A. Klein, L. Milechin, J. Mullen, A. Prout, A. Reuther, A. Rosa, S. Samsi, D. Stetson, A. Tse, C. Yee, and P. Michaleas, “Multi-temporal analysis and scaling relations of 100,000,000,000 network packets,” in 2020 IEEE High Performance Extreme Computing Conference (HPEC), pp. 1–6, 2020.
- [41] A. Buluç, J. T. Fineman, M. Frigo, J. R. Gilbert, and C. E. Leiserson, “Parallel sparse matrix-vector and matrix-transpose-vector multiplication using compressed sparse blocks,” in Proceedings of the twenty-first annual symposium on Parallelism in algorithms and architectures, pp. 233–244, 2009.
- [42] S. Alcock, P. Lorier, and R. Nelson, “Libtrace: A packet capture and analysis library,” SIGCOMM Comput. Commun. Rev., vol. 42, p. 42–48, mar 2012.
- [43] “Cisco Visual Networking Index: Forecast and Trends.” https://newsroom.cisco.com/press-release-content?articleId=1955935.
- [44] “Cisco Visual Networking Index: Forecast and Trends, 2018–2023.” https://www.cisco.com/c/en/us/solutions/collateral/executive-perspectives/annual-internet-report/white-paper-c11-741490.html.
- [45] J. Kepner, T. Davis, C. Byun, W. Arcand, D. Bestor, W. Bergeron, V. Gadepally, M. Houle, M. Hubbell, M. Jones, A. Klein, L. Milechin, J. Mullen, A. Prout, A. Reuther, A. Rosa, S. Samsi, C. Yee, and P. Michaleas, “Vertical, temporal, and horizontal scaling of hierarchical hypersparse graphblas matrices,” in 2021 IEEE High Performance Extreme Computing Conference (HPEC), pp. 1–6, 2021.
- [46] J. Kepner, M. Jones, D. Andersen, A. Buluç, C. Byun, K. Claffy, T. Davis, W. Arcand, J. Bernays, D. Bestor, W. Bergeron, V. Gadepally, M. Houle, M. Hubbell, A. Klein, C. Meiners, L. Milechin, J. Mullen, S. Pisharody, A. Prout, A. Reuther, A. Rosa, S. Samsi, D. Stetson, A. Tse, C. Yee, and P. Michaleas, “Spatial temporal analysis of 40,000,000,000,000 internet darkspace packets,” in 2021 IEEE High Performance Extreme Computing Conference (HPEC), pp. 1–8, 2021.
- [47] A. Tumeo, O. Villa, and D. Sciuto, “Efficient pattern matching on gpus for intrusion detection systems,” in Proceedings of the 7th ACM International Conference on Computing Frontiers, CF ’10, (New York, NY, USA), p. 87–88, Association for Computing Machinery, 2010.
- [48] M. Kumar, W. P. Horn, J. Kepner, J. E. Moreira, and P. Pattnaik, “Ibm power9 and cognitive computing,” IBM Journal of Research and Development, vol. 62, no. 4/5, pp. 10–1, 2018.
- [49] J. Ezick, T. Henretty, M. Baskaran, R. Lethin, J. Feo, T.-C. Tuan, C. Coley, L. Leonard, R. Agrawal, B. Parsons, and W. Glodek, “Combining tensor decompositions and graph analytics to provide cyber situational awareness at hpc scale,” in 2019 IEEE High Performance Extreme Computing Conference (HPEC), pp. 1–7, 2019.
- [50] P. Gera, H. Kim, P. Sao, H. Kim, and D. Bader, “Traversing large graphs on gpus with unified memory,” Proceedings of the VLDB Endowment, vol. 13, no. 7, pp. 1119–1133, 2020.
- [51] A. Azad, M. M. Aznaveh, S. Beamer, M. Blanco, J. Chen, L. D’Alessandro, R. Dathathri, T. Davis, K. Deweese, J. Firoz, H. A. Gabb, G. Gill, B. Hegyi, S. Kolodziej, T. M. Low, A. Lumsdaine, T. Manlaibaatar, T. G. Mattson, S. McMillan, R. Peri, K. Pingali, U. Sridhar, G. Szarnyas, Y. Zhang, and Y. Zhang, “Evaluation of graph analytics frameworks using the gap benchmark suite,” in 2020 IEEE International Symposium on Workload Characterization (IISWC), pp. 216–227, 2020.
- [52] Z. Du, O. A. Rodriguez, J. Patchett, and D. A. Bader, “Interactive graph stream analytics in arkouda,” Algorithms, vol. 14, no. 8, p. 221, 2021.
- [53] S. Acer, A. Azad, E. G. Boman, A. Buluç, K. D. Devine, S. Ferdous, N. Gawande, S. Ghosh, M. Halappanavar, A. Kalyanaraman, A. Khan, M. Minutoli, A. Pothen, S. Rajamanickam, O. Selvitopi, N. R. Tallent, and A. Tumeo, “Exagraph: Graph and combinatorial methods for enabling exascale applications,” The International Journal of High Performance Computing Applications, vol. 35, no. 6, pp. 553–571, 2021.
- [54] M. P. Blanco, S. McMillan, and T. M. Low, “Delayed asynchronous iterative graph algorithms,” in 2021 IEEE High Performance Extreme Computing Conference (HPEC), pp. 1–7, IEEE, 2021.
- [55] N. K. Ahmed, N. Duffield, and R. A. Rossi, “Online sampling of temporal networks,” ACM Transactions on Knowledge Discovery from Data (TKDD), vol. 15, no. 4, pp. 1–27, 2021.
- [56] A. Azad, O. Selvitopi, M. T. Hussain, J. R. Gilbert, and A. Buluç, “Combinatorial blas 2.0: Scaling combinatorial algorithms on distributed-memory systems,” IEEE Transactions on Parallel and Distributed Systems, vol. 33, no. 4, pp. 989–1001, 2021.
- [57] D. Koutra, “The power of summarization in graph mining and learning: smaller data, faster methods, more interpretability,” Proceedings of the VLDB Endowment, vol. 14, no. 13, pp. 3416–3416, 2021.
- [58] R. Hofstede, P. Čeleda, B. Trammell, I. Drago, R. Sadre, A. Sperotto, and A. Pras, “Flow monitoring explained: From packet capture to data analysis with netflow and ipfix,” IEEE Communications Surveys & Tutorials, vol. 16, no. 4, pp. 2037–2064, 2014.
- [59] R. Sommer, “Bro: An open source network intrusion detection system,” Security, E-learning, E-Services, 17. DFN-Arbeitstagung über Kommunikationsnetze, 2003.
- [60] J. Nair, A. Wierman, and B. Zwart, “The fundamentals of heavy tails: Properties, emergence, and estimation,” Preprint, California Institute of Technology, 2020.
- [61] J. Kepner, J. Bernays, S. Buckley, K. Cho, C. Conrad, L. Daigle, K. Erhardt, V. Gadepally, B. Greene, M. Jones, R. Knake, B. Maggs, P. Michaleas, C. Meiners, A. Morris, A. Pentland, S. Pisharody, S. Powazek, A. Prout, P. Reiner, K. Suzuki, K. Takhashi, T. Tauber, L. Walker, and D. Stetson, “Zero botnets: An observe-pursue-counter approach.” Belfer Center Reports, 6 2021.
- [62] S. Pisharody, J. Bernays, V. Gadepally, M. Jones, J. Kepner, C. Meiners, P. Michaleas, A. Tse, and D. Stetson, “Realizing forward defense in the cyber domain,” in 2021 IEEE High Performance Extreme Computing Conference (HPEC), pp. 1–7, IEEE, 2021.
- [63] J. Fan, J. Xu, M. H. Ammar, and S. B. Moon, “Prefix-preserving ip address anonymization: measurement-based security evaluation and a new cryptography-based scheme,” Computer Networks, vol. 46, no. 2, pp. 253–272, 2004.
- [64] S. Dandyan, Feistel network-based prefix-preserving network trace anonymization. PhD thesis, Faculty of Graduate Studies and Research, University of Regina, 2022.
- [65] A. Chen, A. Edelman, J. Kepner, V. Gadepally, and D. Hutchison, “Julia implementation of the dynamic distributed dimensional data model,” in 2016 IEEE High Performance Extreme Computing Conference (HPEC), pp. 1–7, 2016.
- [66] L. Milechin, V. Gadepally, and J. Kepner, “Database operations in d4m.jl,” in 2018 IEEE High Performance extreme Computing Conference (HPEC), pp. 1–5, 2018.
- [67] V. Gadepally, J. Kepner, L. Milechin, W. Arcand, D. Bestor, B. Bergeron, C. Byun, M. Hubbell, M. Houle, M. Jones, P. Michaleas, J. Mullen, A. Prout, A. Rosa, C. Yee, S. Samsi, and A. Reuther, “Hyperscaling internet graph analysis with d4m on the mit supercloud,” in 2018 IEEE High Performance extreme Computing Conference (HPEC), pp. 1–6, Sep. 2018.
- [68] I. Burstein, “Nvidia data center processing unit (dpu) architecture,” in 2021 IEEE Hot Chips 33 Symposium (HCS), pp. 1–20, IEEE, 2021.
- [69] B. Burres, D. Daly, M. Debbage, E. Louzoun, C. Severns-Williams, N. Sundar, N. Turbovich, B. Wolford, and Y. Li, “Intel’s hyperscale-ready infrastructure processing unit (ipu),” in 2021 IEEE Hot Chips 33 Symposium (HCS), pp. 1–16, 2021.