PyTomography: A Python Library for Quantitative Medical Image Reconstruction
Luke Polson1,2, Roberto Fedrigo1,2, Chenguang Li1,2, Maziar Sabouri1,2, Obed Dzikunu2,3, Shadab Ahamed1,2, Arman Rahmim1,2,3,4,∗, Carlos Uribe2,4,5,∗
1Department of Physics & Astronomy, University of British Columbia, Vancouver, Canada
2Department of Integrative Oncology, BC Cancer Research Institute, Vancouver, Canada
3School of Biomedical Engineering, University of British Columbia, Vancouver, BC, Canada
4Department of Radiology , University of British Columbia, Vancouver, Canada
5Molecular Imaging and Therapy Department, BC Cancer, Vancouver Canada
∗Contributed equally to this work (co-last authors)
Version typeset
L. Polson. email: lukepolson@outlook.com
Abstract
Background: There is a scarcity of open-source libraries in medical imaging dedicated to both (i) the development and deployment of novel reconstruction algorithms and (ii) support for clinical data.
Purpose: To create and evaluate a GPU-accelerated, open-source, and user-friendly image reconstruction library, designed to serve as a central platform for the development, validation, and deployment of novel tomographic reconstruction algorithms.
Methods: PyTomography was developed using Python and inherits the GPU-accelerated functionality of PyTorch for fast computations. The software uses a modular design that decouples the system matrix from reconstruction algorithms, simplifying the process of integrating new imaging modalities or developing novel reconstruction techniques. As example developments, SPECT reconstruction in PyTomography is validated against both vendor-specific software and alternative open-source libraries. Bayesian reconstruction algorithms are implemented and validated.
Results: PyTomography is consistent with both vendor-software and alternative open source libraries for standard SPECT clinical reconstruction, while providing significant computational advantages. As example applications, Bayesian reconstruction algorithms incorporating anatomical information are compared to the ordered subset expectation maximum (OSEM) algorithm.
Conclusions: We have developed and publicly shared PyTomography, a highly optimized and user-friendly software for quantitative image reconstruction of medical images, with a class hierarchy that fosters the development of novel imaging applications.
I. Introduction
Medical imaging forms a cornerstone in modern healthcare by providing visual and quantitative information about internal body structures and functions. It enables early detection1, accurate diagnosis, and precise treatment planning for a wide range of medical conditions2, 3, 4, contributing to improved patient outcomes and enhanced medical decision-making. Reconstruction algorithms are routinely used to generate 3D images that can be used for both research and clinical decision making 5.
While the development of new reconstruction techniques remains an active field of research6, 7, 8, 9, it can often be difficult to share and disseminate one’s findings. Additionally, while manufacturers of tomographic modalities such as Single Photon Emission Computed Tomography (SPECT) and Positron Emission Tomography (PET) cameras provide their own internal reconstruction algorithms, users cannot access all the implementation details; this limits reproducibility in scientific studies focused on assessing reconstruction algorithms. These issues could be solved by moving to an open source paradigm for medical image reconstruction. Here, the imaging community could easily contribute to the implementation of novel reconstruction and correction algorithms in a way that is open and transparent. Such a framework would allow for the standardization needed to produce comparable results, improving the reliability, validity, and reproducibility of findings. This could ultimately help accelerate the development and translation of new diagnostic imaging capabilities into clinical practice.
A few tools have already been developed to try and address some of these issues. STIR 10 and Castor 11 are examples of two open source image reconstruction frameworks written in C++. However, there are some considerations: (i) the C++ architectures may be difficult to understand for users and potential contributors who will likely be most familiar with Python, (ii) both libraries are limited to running on CPU only, and (iii) neither library appears to provide native support for the DICOM standard. While the Python-based library TomoPy 12 and the ASTRA toolbox 13 support a variety of GPU-accelerated image tomographic reconstruction algorithms, they lack extensive SPECT/PET system modeling. To address these limitations, the python library PyTomography was created as a collaborative medical imaging platform, designed to serve as a central hub for researchers to share, validate, and deploy novel reconstruction techniques. While the present focus of PyTomography is the development and validation of reconstruction algorithms for SPECT, other imaging modalities and reconstruction algorithms can be added using the building blocks provided.
Overall, the aim of this study is to show the capabilities of the developed software library PyTomography. To demonstrate the software, we will explore example applications in 177Lu-PSMA-617 dosimetry. In what follows, we elaborate on our methods and results for PyTomography, which is made publicly available to download; relevant links can be found in section VI..
II. Materials and Methods
II.A. Software Architecture
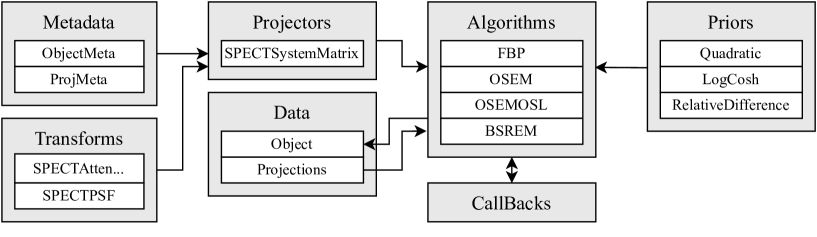
An overview of the main components of PyTomography are shown in Figure 1. The main submodules are summarized as follows.
-
1.
Metadata. Metadata classes contain all auxiliary information needed for image reconstruction such as voxel dimensions, angles of projections, and detector distance of measured projections.
-
2.
Transforms. Transform classes are used to model the various physical effects involved in the imaging process such as attenuation and image blurring. While they function as independent mathematical operators, they are most commonly used as components of a system matrix. Transforms are defined by the mathematical property that they are linear endomorphisms.
-
3.
Projectors. Unlike transforms, projectors are mathematical operators that map between different vector spaces. The system matrix, which maps from object space to projection space and represents a model of the imaging system, is an example of a projector.
-
4.
Priors. Prior functions define a relative likelihood for a particular object prediction. They are used in Bayesian reconstruction algorithms.
-
5.
Algorithms. Algorithms are used for image reconstruction. They require a set of measured projection data, a system matrix, and corresponding metadata.
-
6.
Callbacks. Callbacks are used to obtain and store statistics throughout iterative image reconstruction algorithms.
-
7.
Data. The standard data type used to represent 3D objects and projections is the torch.Tensor class of PyTorch.
Metadata and transforms are used to build the system matrix, which has functionality for forward and back projections (Equations 1 and 2). Reconstruction algorithms take as input the system matrix, measured projection data, and optional Bayesian Prior functions. The Callback class is used to compute statistics dependent on iteration number in iterative algorithms; it can be used to generate bias-variance curves in various regions of the body, for example.
PyTomography has native input/output functionality for interfile and DICOM data. One of the primary focuses of the library is reconstruction of clinical data, which requires processing data from DICOM files such that it can be used in reconstruction. In SPECT imaging, PyTomography offers functionality for the following required steps:
-
1.
Collimator properties of commercial scanner models are used to generate required parameters for the modeling of the point-spread function (PSF). PyTomography uses public data sheets from manufacturers to store collimator information in internal data files.
-
2.
Conversion and alignment of CT scans to create attenuation maps. PyTomography assumes a bilinear relationship between Hounsfield Units and linear attenuation coefficients, and uses the cortical bone peak from measured CT data to obtain an effective CT energy required for such a conversion.
II.B. Mathematical Description
The mathematical conventions used in this paper are as follows. Vectors are represented by lower case letters, while linear operators are represented by upper case letters. The product of two vectors and division of two vectors are inferred to be point-wise operations. Components of a vector are given by , and components of linear operators are given by .
II.B.1. Transforms and Projections
In the paradigm of tomographic medical imaging, there are two main vector spaces: the “projection” space consisting of measured projection data and the “object” space consisting of 3D objects . Since measured and reconstructed data is digitized, and here are finite dimensional vector spaces. In SPECT imaging, for example, consists of a set of 2D images acquired by counting photons emitted by radiopharmaceuticals, and represents the spatial distribution of radioactivity concentration.
A linear imaging system can be characterized by a system matrix , which maps from object space to projection space. It’s components represent the probability that a photon emitted from voxel is detected in a detector element . The imaging process can be succinctly expressed as
| (1) |
The transpose can be used to map from projection space to object space:
| (2) |
Equations 1 and 2 are typically referred to as Forward Projection (FP) and Back Projection (BP), respectively. In practice, is typically too large to store on the memory of a computer. FP is thus typically implemented using (i) rotations, (ii) a sequence of linear endomorphisms in given by , (iii) summation along a particular axis, and (iv) a sequence of linear endomorphisms in given by . BP is given by the transpose of this operation sequence. This sequence of operations, traditionally known as the “rotate and sum” technique, is able to directly model PET and parallel collimator SPECT, and can be used in fan/cone beam CT and diverging/converging/pinhole collimator SPECT provided either (i) rebinning in or (ii) spatial deformations in are employed. While this operation sequence permits a computationally efficient and simple implementation for GPU-based systems, it also has limitations; De Man et. al14 showed that alternative “distance-driven” approaches could be used to reduce artifacts and improve image resolution in CT imaging.
Linear endomorphisms and used in steps (ii) and (iv) of the operation sequence are implemented as standalone classes within the “transforms” submodule of PyTomography; operations are identified as object-to-object transforms, and operations are identified as projection-to-projection transforms. These operations are used to model phenomena such as attenuation correction and resolution recovery in SPECT/PET imaging. System matrices of various imaging systems are implemented as classes within the “projectors” submodule in PyTomography; they are instantiated using transforms that model all the necessary features of the imaging modality.
II.B.2. Reconstruction Algorithms
An image reconstruction algorithm uses measured data (i.e. projections) to estimate a corresponding object that would produce projections given a system matrix . This can be expressed as
| (3) |
where includes all additional hyperparameters required for the algorithm. All reconstruction algorithms are implemented as classes within the “algorithms” submodule of PyTomography.
The present focus of PyTomography is statistical, iterative reconstruction algorithms, such as the ordered-subset expectation maximum (OSEM) algorithm15. OSEM assumes that is a Poisson distributed random vector (this is the case in nuclear medicine imaging modalities) with mean , and is used to to reconstruct the maximum likelihood estimate of from measured projection data . To speed up computation, OSEM partitions into subsets of different projection angles (each with elements), and a modified system matrix considers forward projection for subset . The standard version of OSEM used in SPECT reconstruction can be expressed as
| (4) |
where is a partitioned subset of the projection data, is the estimated scatter contribution, is a vector containing all 1’s, and is defined such that is the iteration index and .
PyTomography also supports incorporation of Bayesian Priors in statistical reconstruction algorithms. Bayesian Priors are implemented as standalone classes within the “priors” submodule of PyTomography; they are used to compute . There are currently two implemented variations of OSEM that enable inclusion of Bayesian Priors: the one step late16 (OSL), implemented as
| (5) |
and the block sequential regularized expectation maximum17 (BSREM), implemented as
| (6) |
where is a constant used to scale the strength of the prior, is the scaling matrix, and represents the relaxation sequence. In this paper, no relaxation is used ( for all ). PyTomography also has support for the Kernelized Expectation Maximum (KEM) algorithm 18, given by
| (7) |
where is a kernel operator consisting of fixed basis functions, and are used as scaling factors for each basis function. The reconstructed image estimate is given by .
While PyTomography offers implementation of many priors, such the quadratic and log-cosh, the prior featured in this paper is the relative difference penalty (RDP)19, defined as
| (8) |
where is the set of voxels immediately neighbouring , and represents a weighting between voxels and . Usage of this prior tends to smooth an image and reduce noise, but it also tends to blur boundaries at the edges of organs. One way to mitigate this effect is to replace in Equation 8 with a reduced set of neighbours which lie in a similar anatomical region. Since anatomical information is used, this is commonly referred to as an anatomical prior (AP); variations of this technique have recently become popular in clinical practice due to enhanced lesion quantitation and detectability in bone SPECT/CT6. In this paper, use of an AP refers to using only the 8 most similar neighbours based on absolute differences of HU values in a CT scan or attenuation map; RDP with the use of AP is referred to as RDP-AP.
II.C. Examples
This section describes the multiple examples used to demonstrate the capabilities of PyTomography. Each example features the use of OSEM, BSREM, and KEM; relevant hyperparameters for each algorithm are shown in Table 1. Reconstruction is explored on both Monte Carlo simulated data (SIMIND) and clinical data (DICOM). Validation of PyTomography against other open-source software, and for each data type, is shown in the appendix.
| Algorithm | OSEM | BSREM | KEM |
|---|---|---|---|
| Subsets | 8 | 8 | 8 |
| Neighbourhood Size | - | ||
| Nearest Neighbours | - | 8 | 40 |
| Kernel | - | - | Eq. 5 of Vuohijoki et. al. 6 |
| Prior | - | RDP-AP | - |
The two examples are listed below:
-
1.
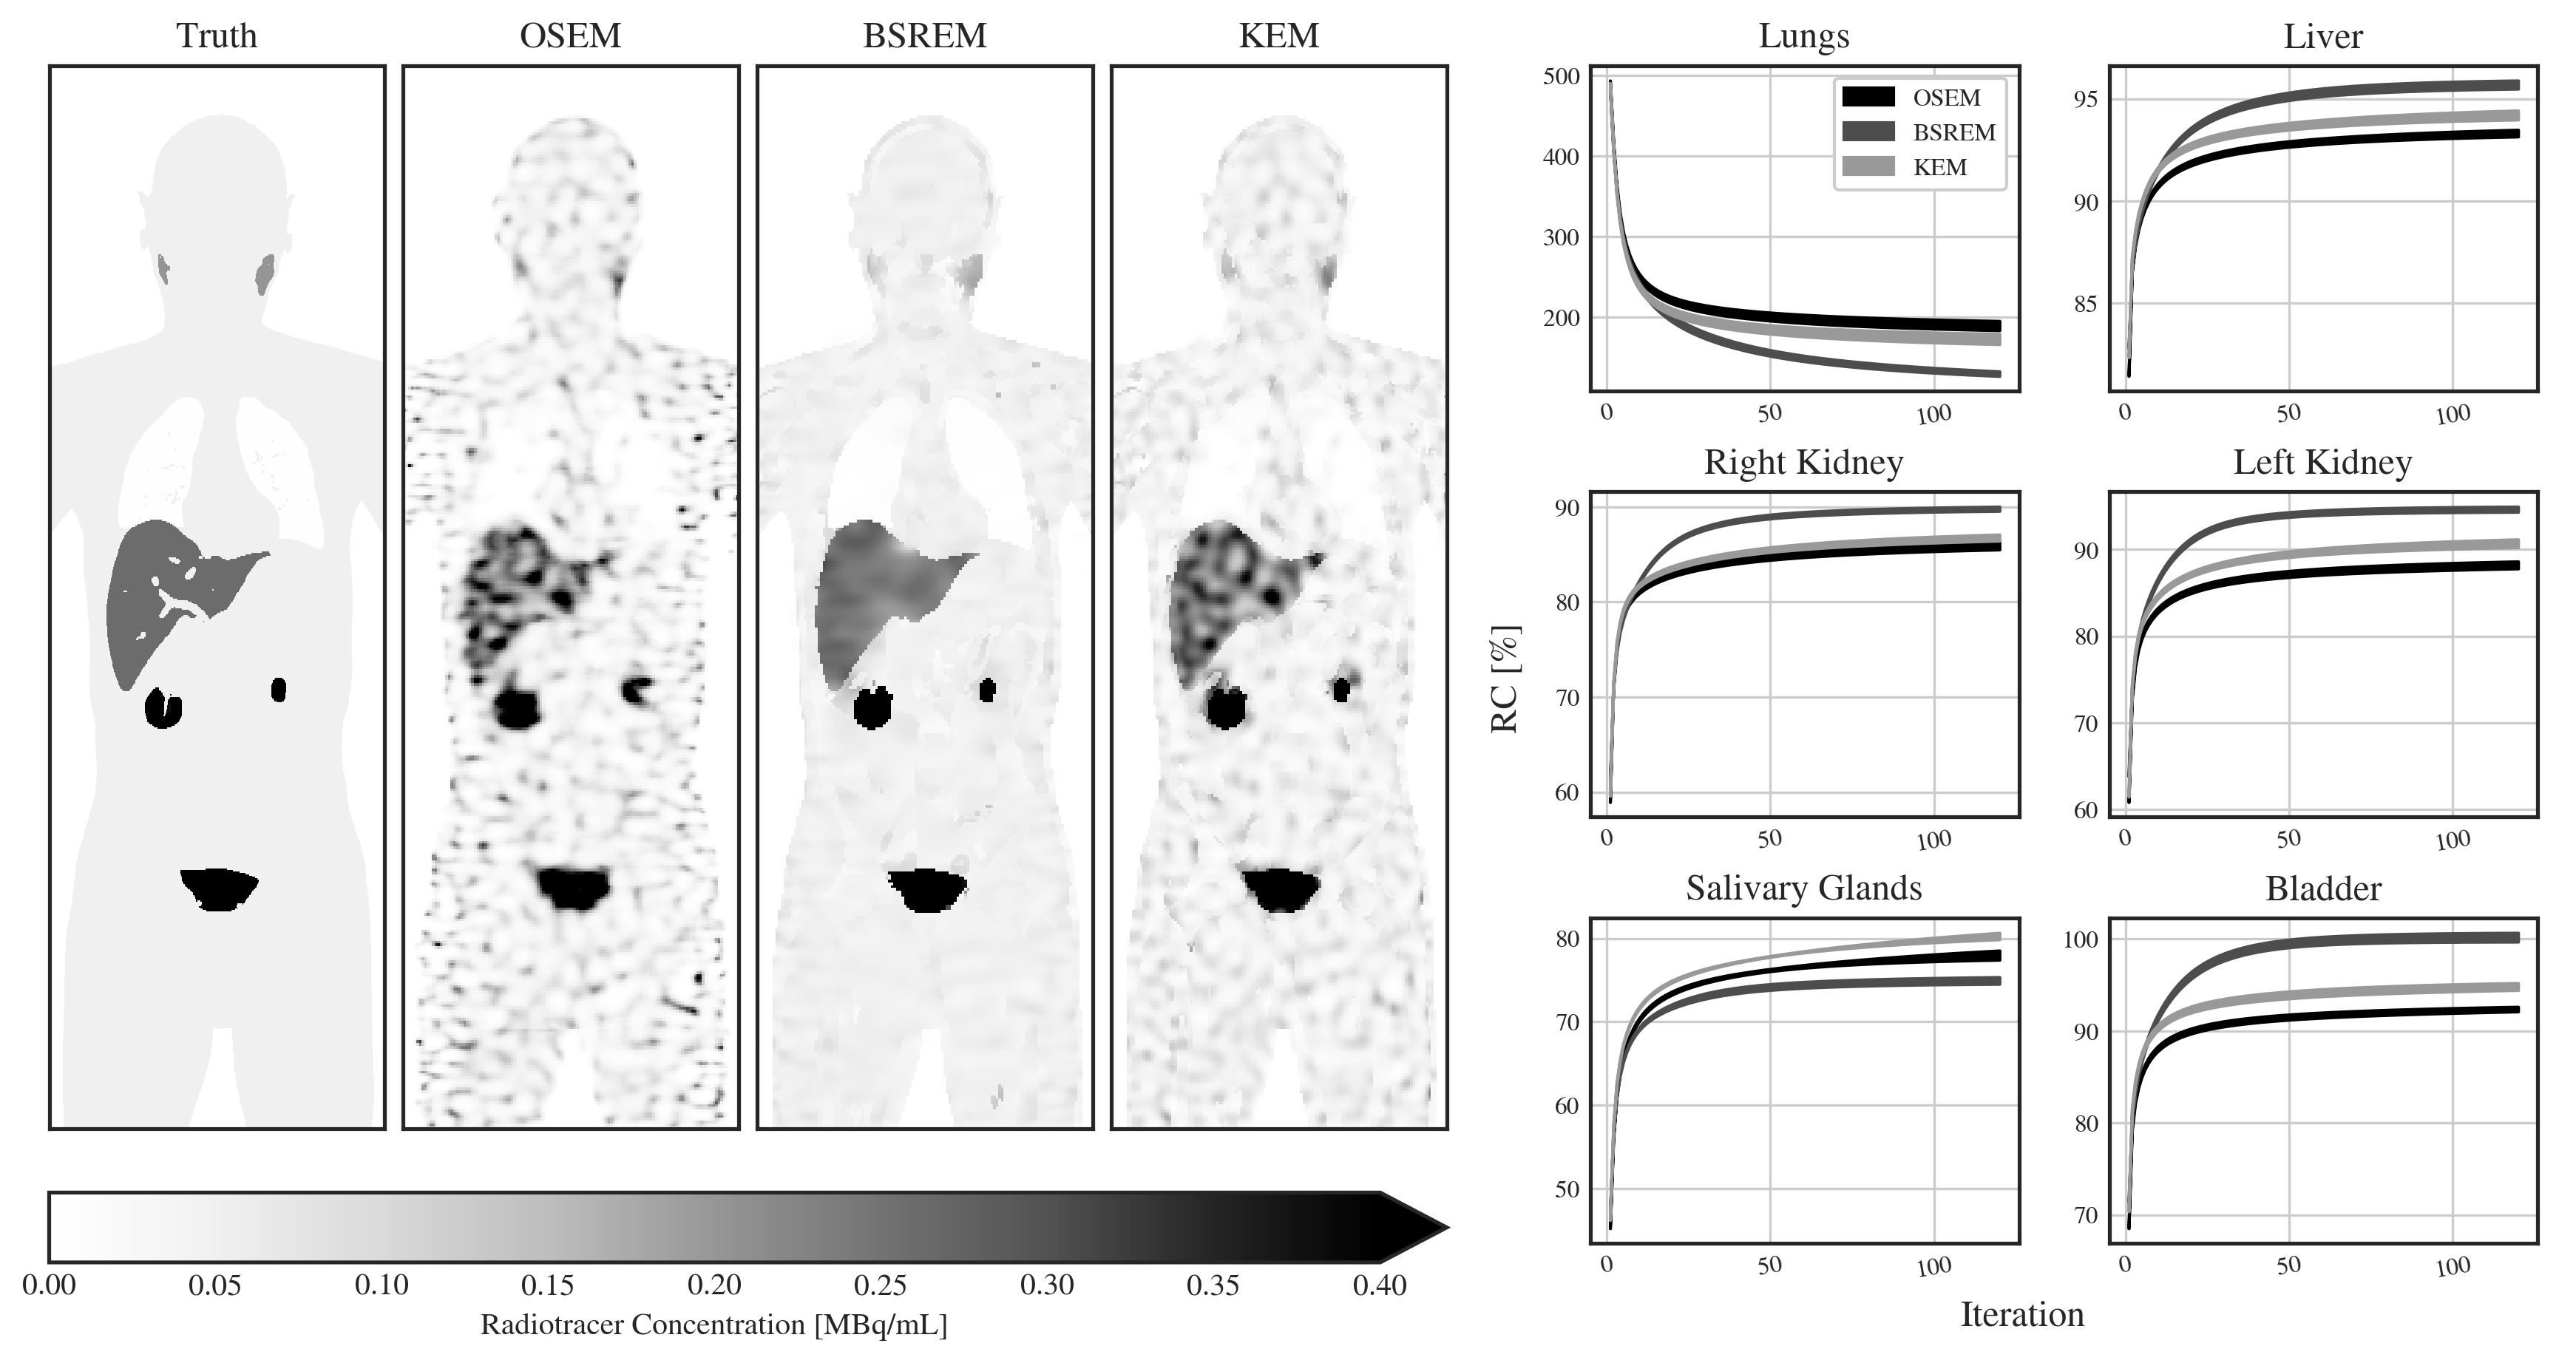
SIMIND: This example highlights a use case of PyTomography for reconstruction of SPECT image data obtained from the SIMIND Monte Carlo simulation program20. It features reconstructions of digital phantom data representing a 177Lu-PSMA-617 SPECT scan 38.6 minutes post injection. The digital phantom used for simulation was created using the extended-cardiac torso (XCAT) phantom21, where organ concentrations were obtained using a physiologically-based pharmacokinetic PBPK model22; the model includes major relevant physiological and molecular events and consists of 112 coupled ordinary differential equations. Relevant SIMIND acquisition parameters included 120 projections, a radial distance of , pixel spacing of , and dimensions of 128x384. Reconstructions were performed for 120 iterations. Organ masks were obtained using bilinear downsampling from ground truth phantoms; voxels with greater than 50% organ volume were included in the mask.
-
2.
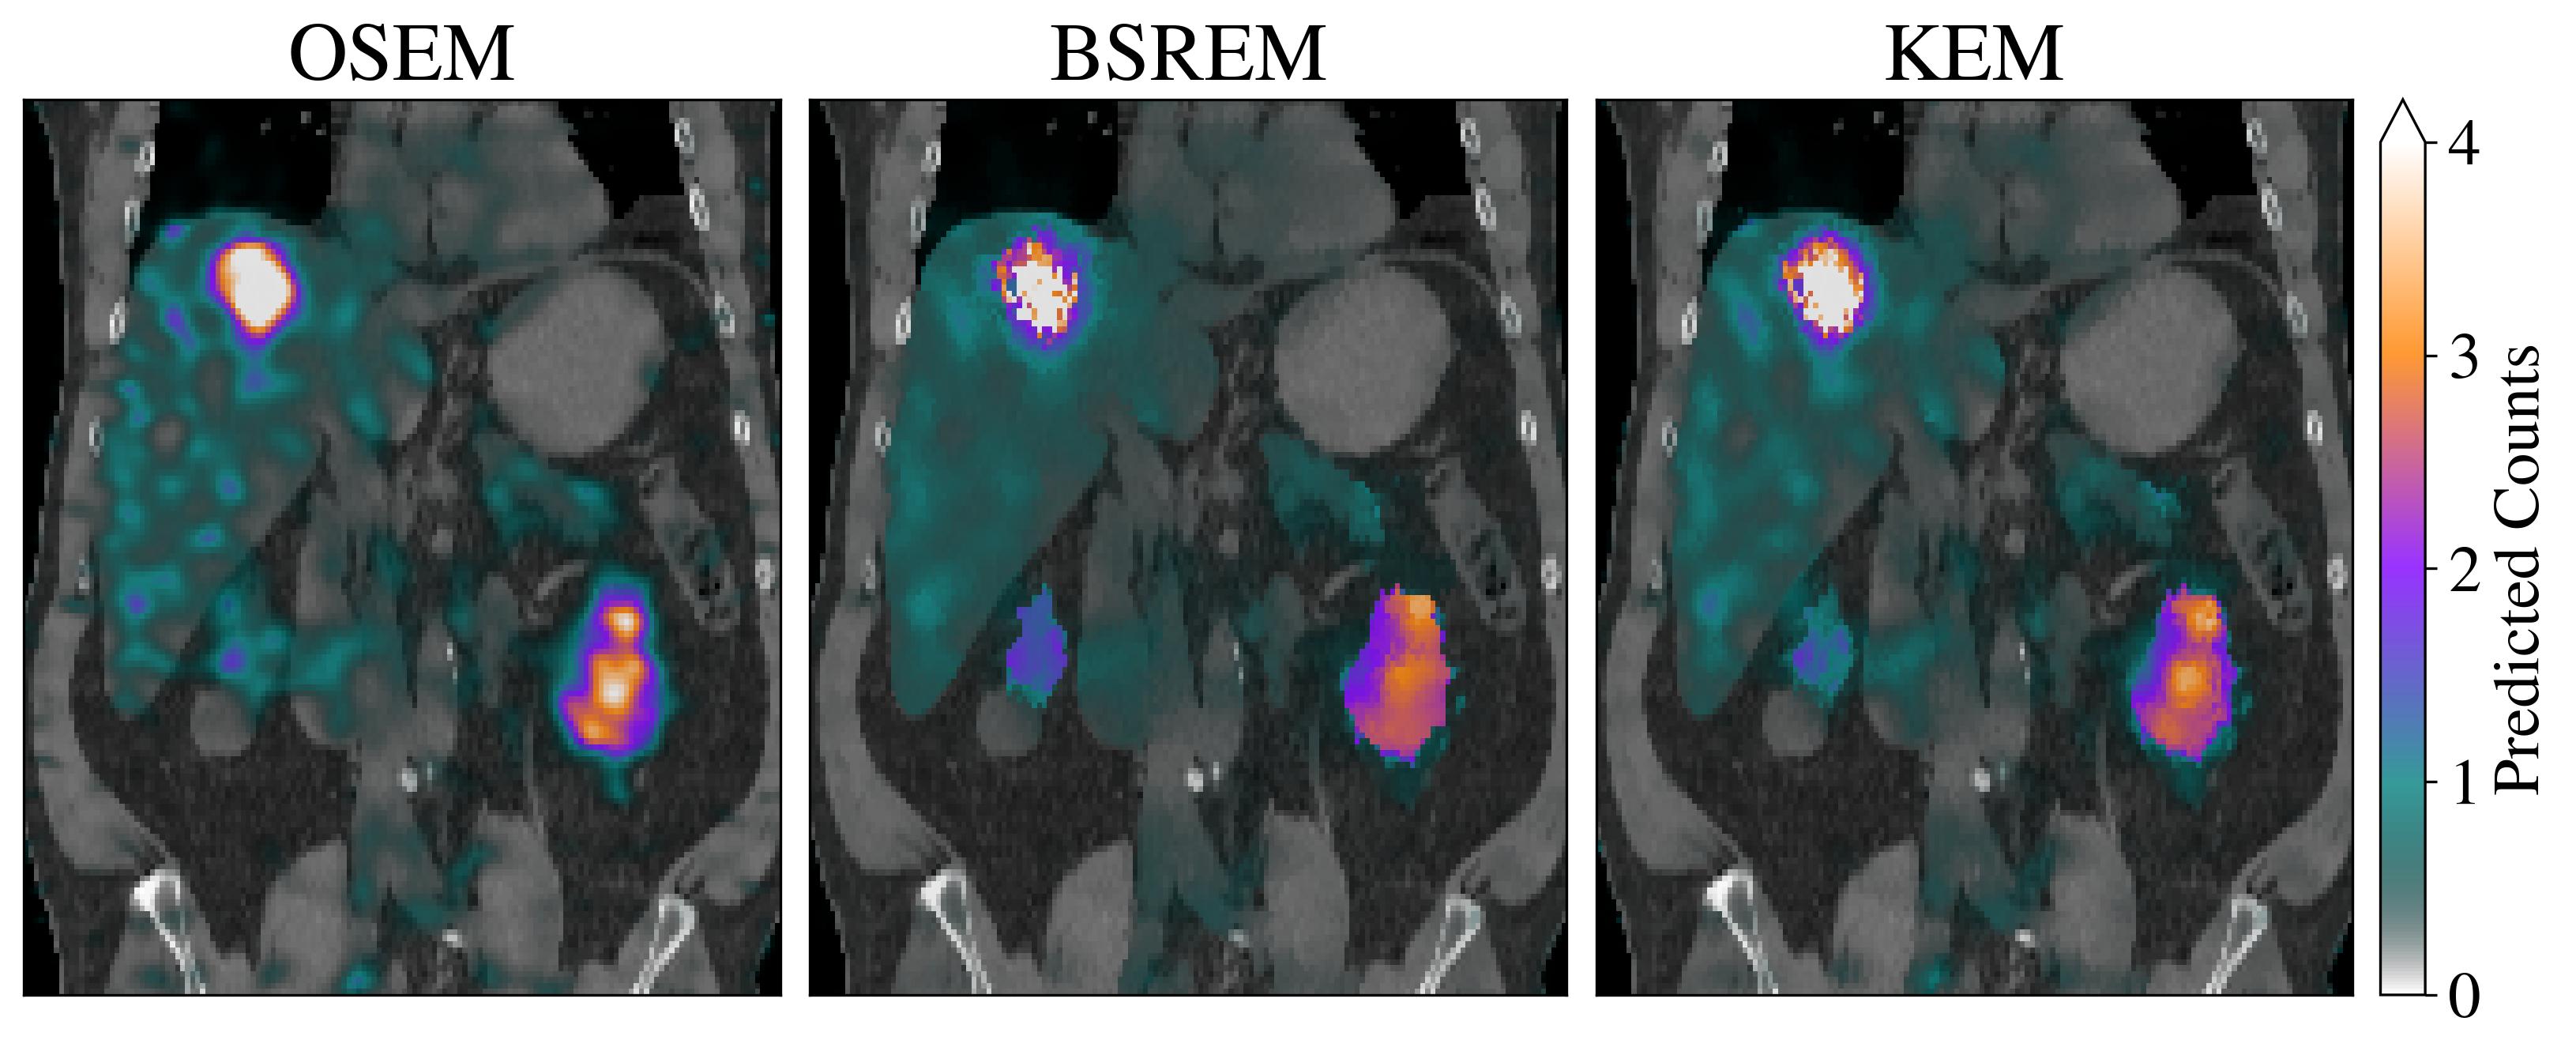
DICOM: This example highlights SPECT reconstruction on publicly available data from the Deep Blue data repository23. Patients received radiopharmaceutical therapy with 177Lu-DOTATATE for neuroendocrine tumours (4 cycles of 7.4 GBq/cycle administered every 8 weeks); scans were taken at 4 different time points in the week following a therapeutic dose. Images consisted of 120 projections of shape with resolution . Reconstructions were performed for 50 iterations for each algorithm. Organ masks for the liver and kidneys were obtained using a CT segmentation model24. Masks were then downsampled and aligned with SPECT images using bilinear interpolation; voxels with greater than 50% organ volume were included in the downsampled mask.
All computation was performed using a Microsoft Azure virtual machine (Standard NC6s v3) with a 6 CPUs (Intel(R) Xeon(R) CPU E5-2690 v4 @ 2.60GHz), 112 GB of RAM, and a TeslaV100 GPU. Python scripts and notebooks used to obtain these results can be found at https://github.com/qurit/PyTomography_paper_code.
III. Results
For the SIMIND data, the time required for reconstruction was 412.8 s (3.44 s/iteration) for OSEM, 434.8 s (3.62 s/iteration) for BSREM, and 601.8 s (5.02 s/iteration) for KEM; sample reconstructions with corresponding RC curves are shown for each algorithm in Figure 2. BSREM clearly produced the least noisy images, and had the best RCs for the lungs, liver, kidneys, and bladder. KEM produced an image estimate with an intermediate level of noise, and had the best recovery coefficient for the salivary glands. OSEM yielded the noisiest images, and had the worst recovery coefficients in all regions except the salivary glands.
The time required to reconstruct the Deep Blue DICOM data was 464.7s (9.29 s/iteration) for OSEM, 453.1s (9.06 s/iteration) for BSREM, and 1825s (36.50 s/iteration) for KEM. Central coronal slices are shown in Figure 3; the patient had a region of high uptake value in the liver, indicative of a liver lesion. Both BSREM and KEM can qualitatively be observed to confine activity within the boundary of the kidneys, with BSREM exhibiting slightly more of this behaviour. In addition, OSEM produced the most observed noise in the liver. A common artifact of both BSREM and KEM, however, is the noise in the liver lesion; use of anatomical nearest neighbours may cause the lesion activity noise profile to resemble the CT noise profile. The mean predicted counts in the kidneys were 1.98 (OSEM), 2.07 (BSREM), and 2.02 (KEM); these relative proportions are consistent with the RCs of Figure 2, suggesting that BSREM may yield the largest and most accurate recovery coefficients.
IV. Discussion
This technical report described the software architecture of PyTomography, and presented use cases on both SIMIND and DICOM data. The short times required for reconstruction permit extensive studies on phantom and patient data that many include multiple patients, noise realizations, and reconstruction algorithms. Validation of PyTomography against alternative reconstruction libraries is shown in the appendix.
As example applications, the use of OSEM, BSREM, and KEM were explored in 177Lu-SPECT reconstruction, where BSREM featured the use of the relative difference prior using similar anatomical neighbours. It should be emphasized that the purpose of this technical report was not to rank the different algorithms, but rather to demonstrate the capabilities of the software library. While some evidence was shown to favour BSREM over OSEM and KEM for kidney and liver dosimetry based on better recovery coefficients, this evidence is not strong enough to establish any extensive ranking of the different reconstruction algorithms. An extensive study that aims to quantitatively compare algorithms should involve (i) multiple XCAT activity and anatomical configurations, (ii) inclusion of patient motion, (iii) effect of misalignment between SPECT and CT images, (iv) different hyperparameters in each reconstruction algorithm and (iv) should seek to use real patient data to validate any phantom studies. In addition, recovery coefficients alone are not a sufficient metric to rank algorithms, studies should also consider source-to-background ratios as well as error analysis based on intra and inter patient variability.
While the RDP-AP prior was featured heavily in this study, the framework of PyTomography is designed to foster the development and validation of other novel prior functions as well. In addition, while KEM was featured using anatomically-based basis functions, the library permits use of any external image for construction of the basis functions. Different priors and basis functions may also have significant implications for (i) quantitative PET/SPECT imaging in dosimetry, and (ii) qualitative observer based studies in lesion detection and classification. Since the library is open source, newly developed functionality can be easily tested and verified by many independent research groups with their own data. The immediate goals for future development in PyTomography at the time of publication are
-
1.
Fast PSF modeling for high energy SPECT isotopes, such as 131I and 225Ac.
-
2.
System matrix modeling of “swiveling” detector SPECT systems, such as General Electric’s StarGuide system.
-
3.
System matrix modeling of PET systems.
-
4.
Development of a 3D Slicer25 extension
We highly encourage and appreciate open-source contributions to assist in the items listed above; those who wish to contribute are encouraged read the developers’ guide on the documentation website. Contributions could also include the implementation of novel reconstruction algorithms and modeling of different imaging systems (e.g. pinhole collimator SPECT, fan beam CT, etc.).
V. Conclusion
This work describes the python library PyTomography and highlights specific use cases in SPECT imaging. Implementation using the GPU-accelerated functionality of PyTorch functionality permits extremely fast reconstruction times compared to other open source alternatives. The class hierarchy provides flexibility when developing novel reconstruction techniques, but is also straightforward to use with traditional algorithms. The purpose of PyTomography is to create a transparent and computationally efficient library for medical image reconstruction, where novel reconstruction techniques are implemented, shared, and evaluated by experts in the community.
VI. Appendix
VI.A. Relevant Links
Links to the various webpages of PyTomography are contained in Table 2: GitHub contains the source code, readthedocs contains all relevant documentation, and PyPI is the host of the built source files.
| Website | Link |
|---|---|
| Github | https://github.com/qurit/PyTomography |
| Readthedocs | https://pytomography.readthedocs.io/en/latest/ |
| PyPI | https://pypi.org/project/pytomography/ |
VI.B. Validation of PyTomography
This section contains two examples used to validate PyTomography against other reconstruction software:
-
1.
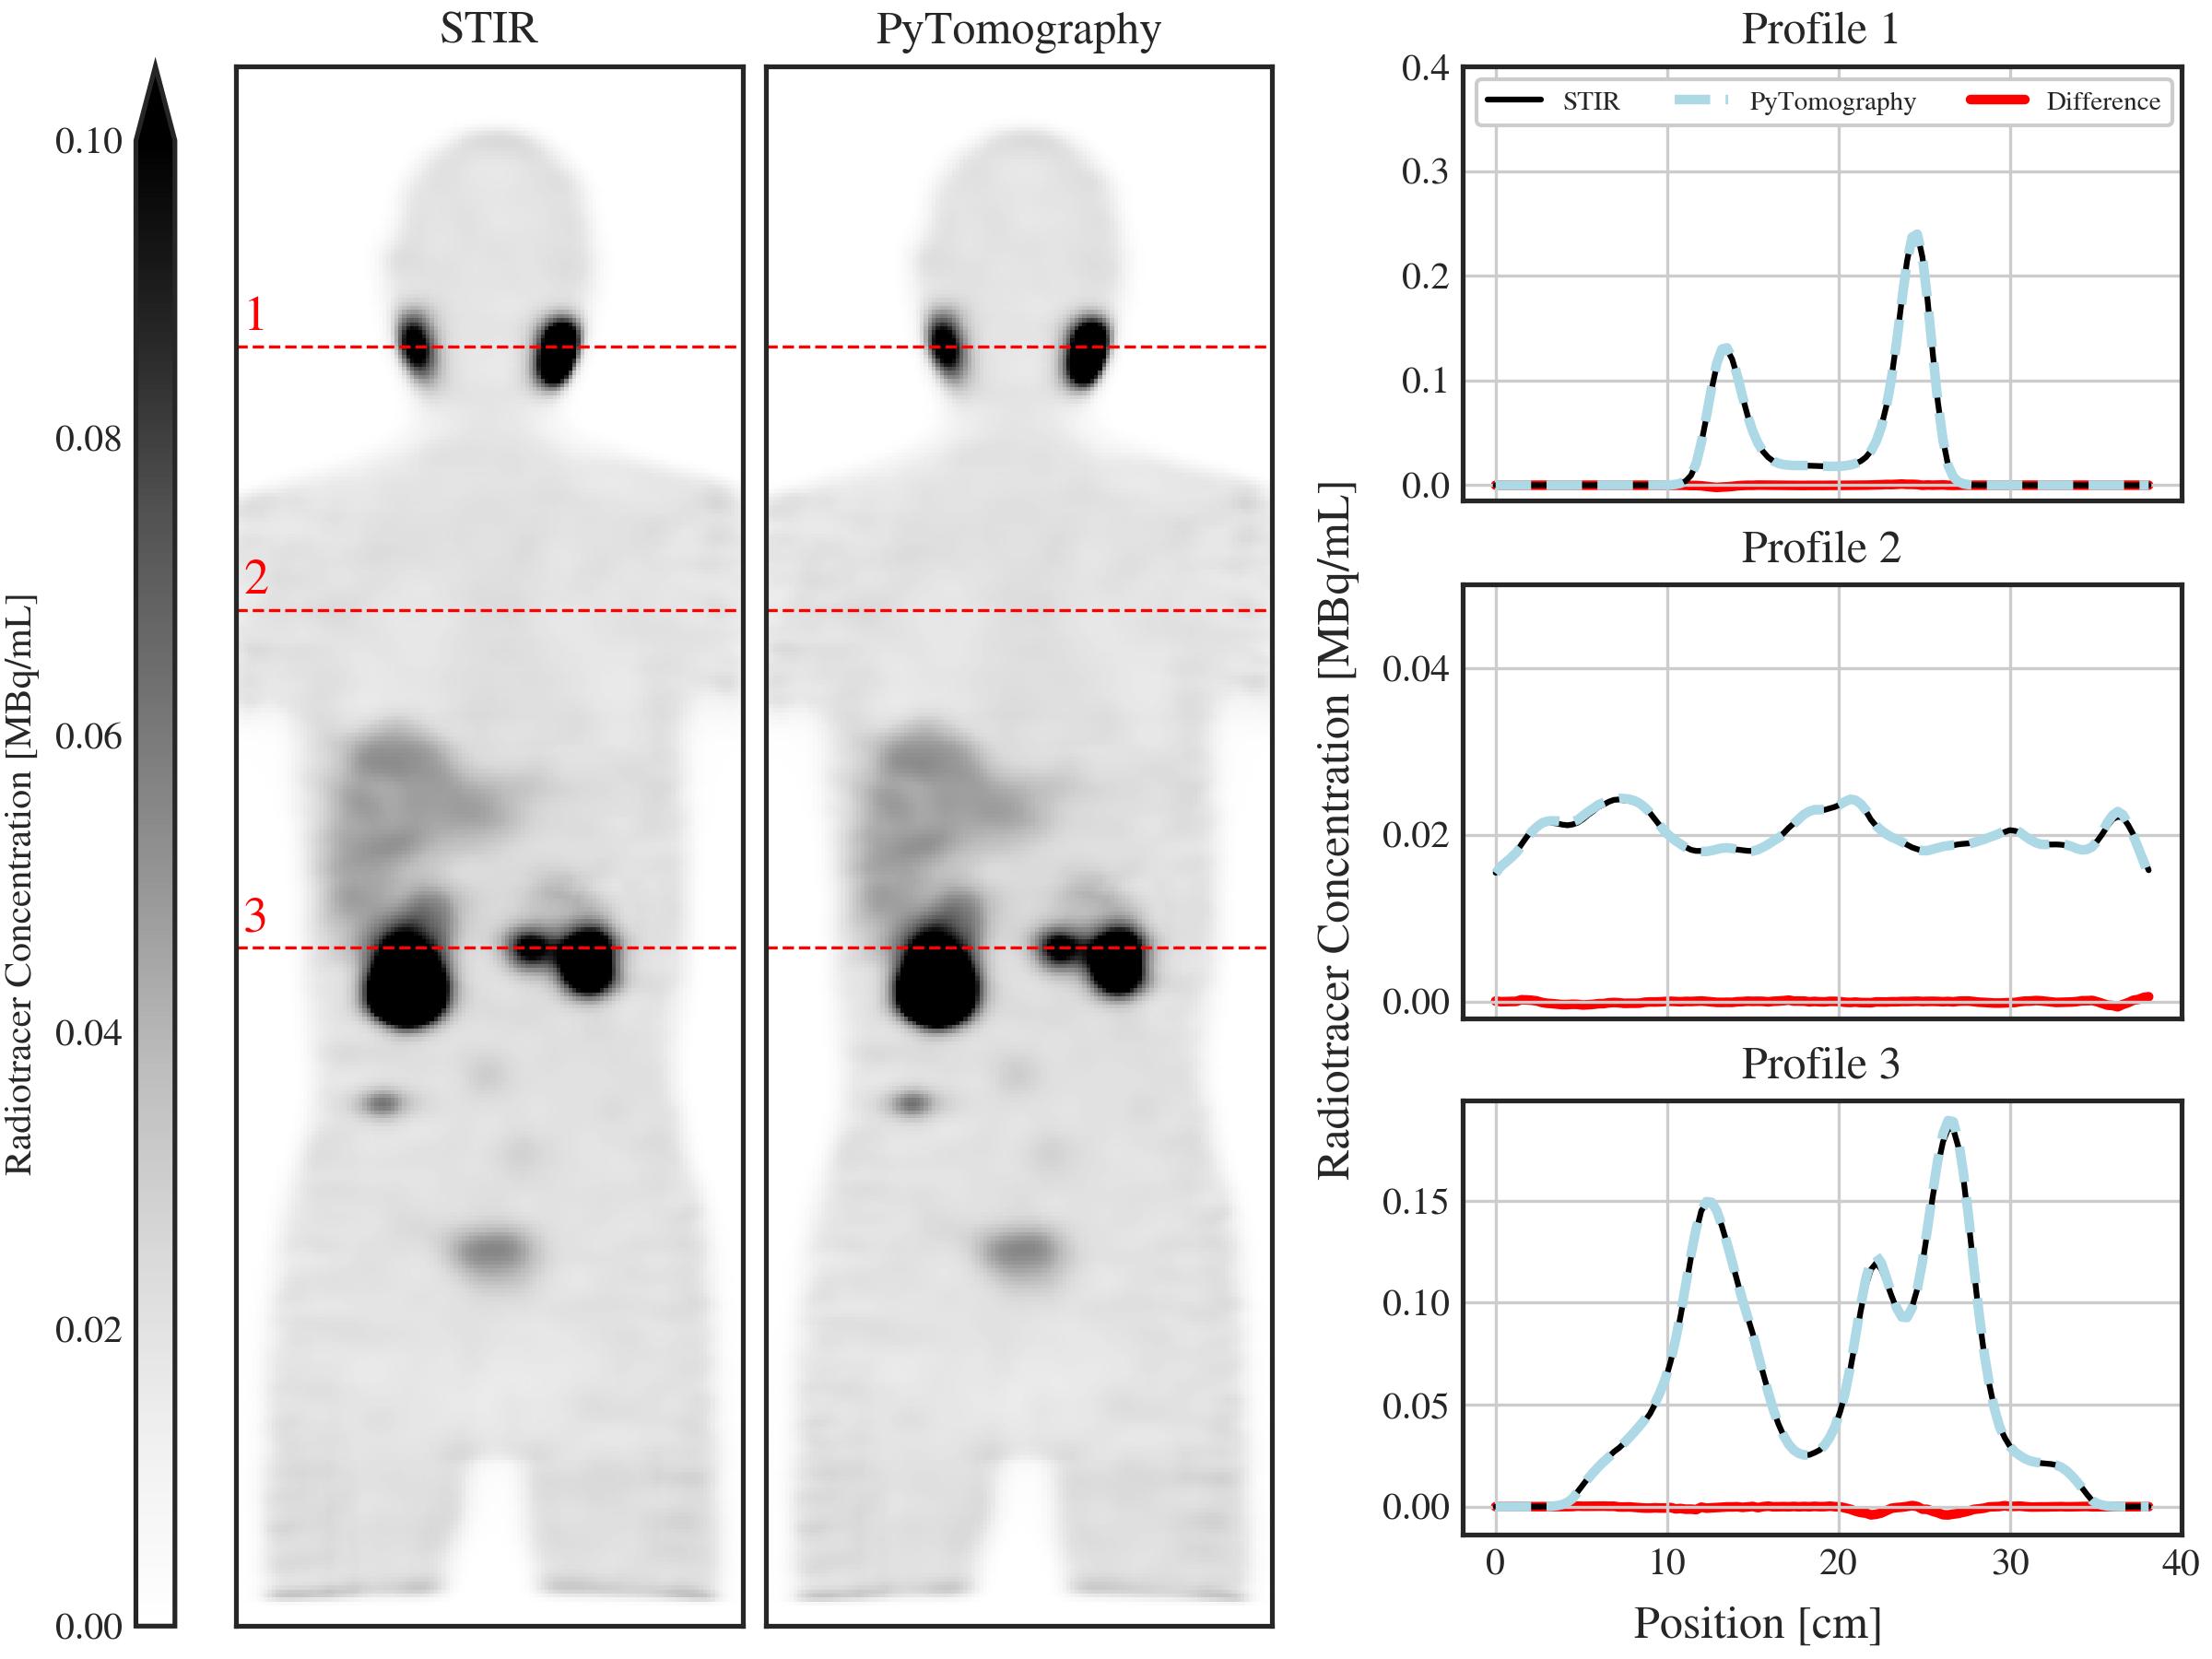
SIMIND Data: Radioactivity concentrations in a digital phantom were selected to correspond to a 24-hour post injection prostate cancer patient (1700 MBq total activity) imaged via the prostate-specific membrane antigen (PSMA)-targeting radiopharmaceutical, 177Lu-PSMA-617. Simulated data was reconstructed with OSEM (2 iterations, 8 subsets) using (i) STIR and (ii) PyTomography. Reconstructions are shown in Figure 4 and are nearly identical, with error margins for all regions with non-negligible activity concentration . The reconstruction time in PyTomography (5.4 s) was significantly faster than the time required in STIR (51542.2 s), owing to the speed-up factor of GPU implementation.
-
2.
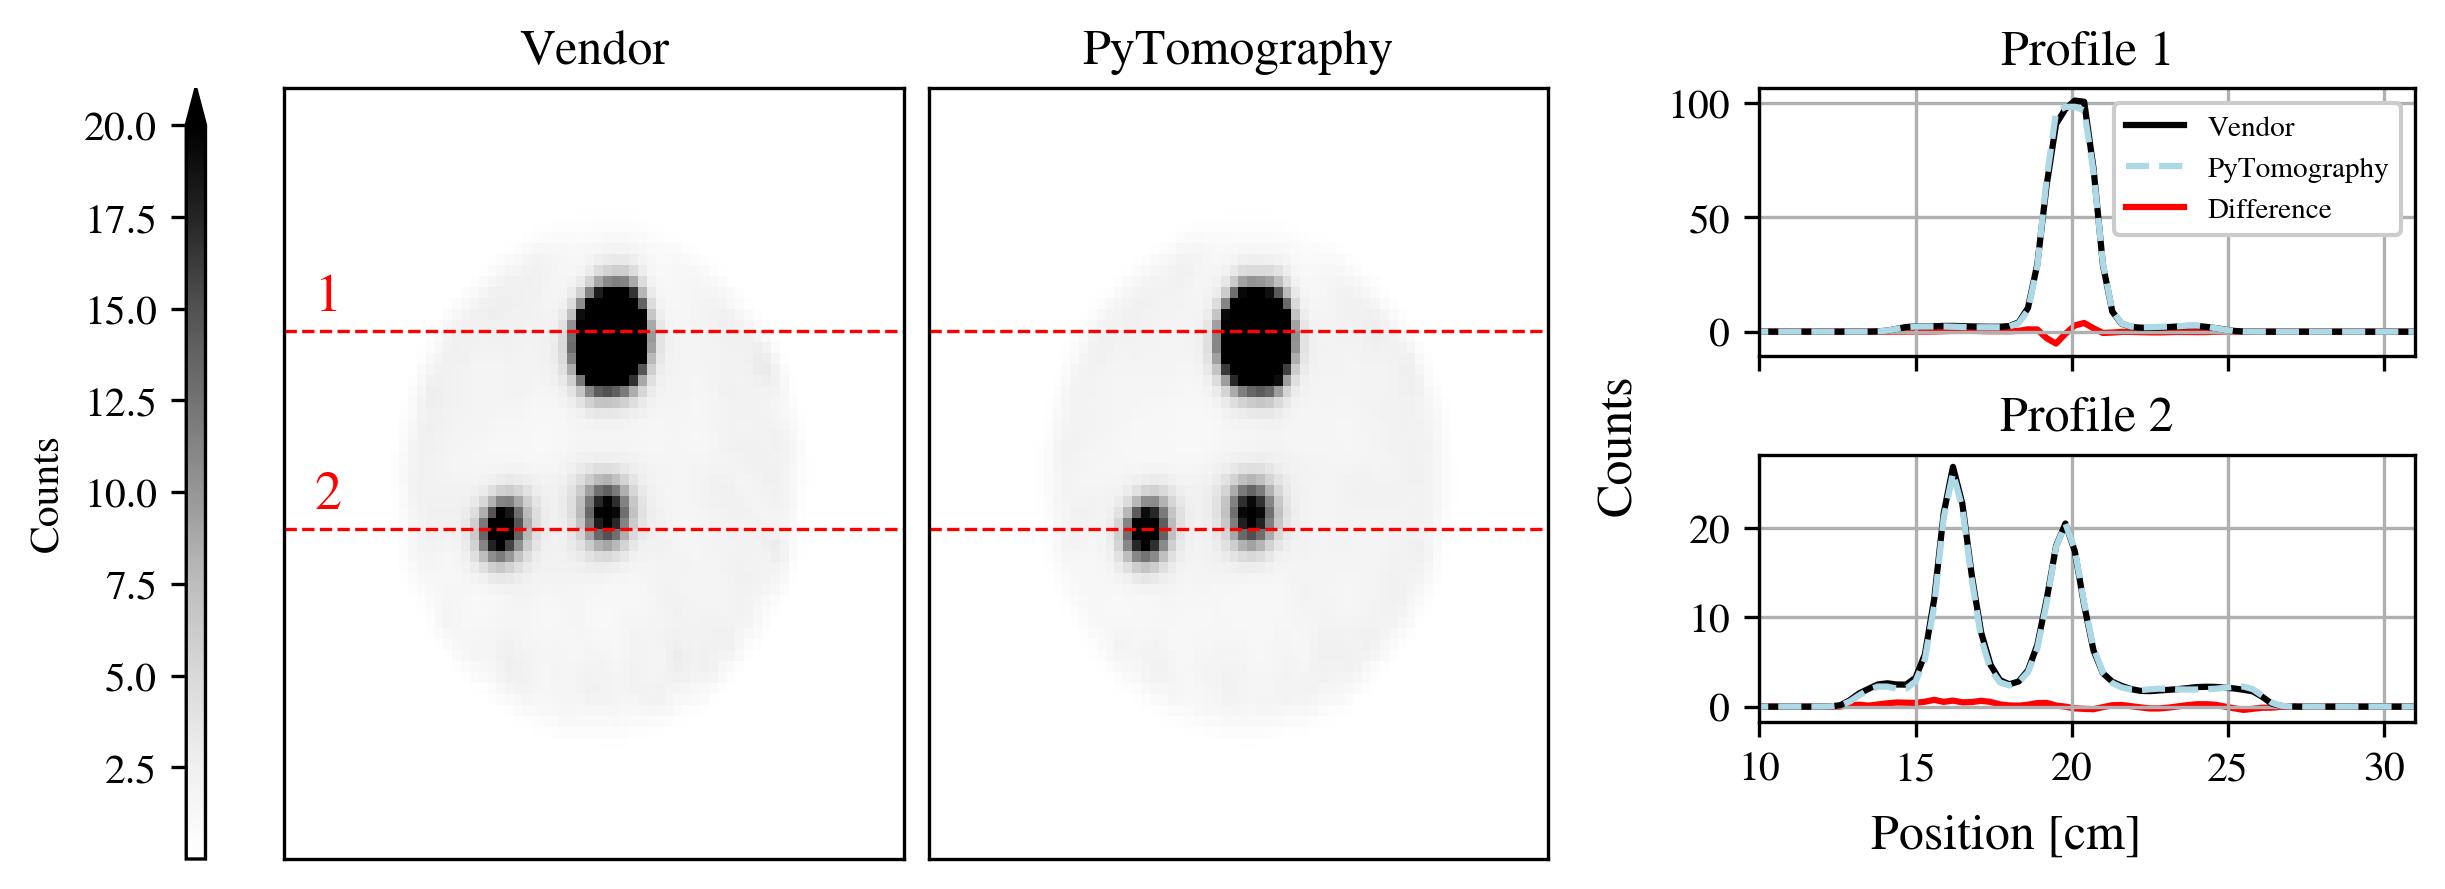
DICOM Data: A Jaszczak phantom was filled with Lu-177 and scanned at 180 projections (, resolution ) using a Siemens Symbia T Series SPECT/CT scanner with Medium Energy collimators. Reconstruction was performed with OSEM (4 iterations, 10 subsets) using (i) the manufacturer scanner software and (ii) PyTomography. Reconstructions and corresponding 1 dimensional profiles are shown in Figure 5. The reconstruction performed using PyTomography and the on-board scanner software are similar; the root mean squared error ( counts) provides a quantitative metric for this similarity.
Acknowledgements
This work was supported by the Natural Sciences and Engineering Research Council of Canada (NSERC) CGS D Award 569711, NSERC Discovery Grants RGPIN-2019-06467 and RGPIN-2021-02965, as well as computational resources and services provided by Microsoft for Health.
References
- 1 J. Mendes and N. Matela, Breast Cancer Risk Assessment: A Review on Mammography-Based Approaches, Journal of Imaging 7, 98 (2021).
- 2 L. Emmett, K. Willowson, J. Violet, J. Shin, A. Blanksby, and J. Lee, Lutetium 177 PSMA radionuclide therapy for men with prostate cancer: a review of the current literature and discussion of practical aspects of therapy, Journal of Medical Radiation Sciences 64, 52–60 (2017).
- 3 T.-C. Yen, G. C. Pereira, M. Traughber, and R. F. Muzic, The Role of Imaging in Radiation Therapy Planning: Past, Present, and Future, BioMed Research International 2014, 231090 (2014).
- 4 A. M. Owrangi, P. B. Greer, and C. K. Glide-Hurst, MRI-only treatment planning: benefits and challenges, Physics in Medicine & Biology 63, 05TR01 (2018).
- 5 J. Qi and R. M. Leahy, Iterative reconstruction techniques in emission computed tomography, Physics in Medicine & Biology 51, R541 (2006).
- 6 H. E. Vuohijoki, C. J. Constable, and A. O. Sohlberg, Anatomically guided reconstruction improves lesion quantitation and detectability in bone SPECT/CT, Nuclear Medicine Communications 44 (2023).
- 7 Z. Yu, M. A. Rahman, T. Schindler, R. Laforest, and A. K. Jha, A physics and learning-based transmission-less attenuation compensation method for SPECT, Proc. SPIE Int. Soc. Opt. Eng. 11595, 10.1117/12.2582350 (2021).
- 8 K. Gong, C. Catana, J. Qi, and Q. Li, PET Image Reconstruction Using Deep Image Prior, IEEE Transactions on Medical Imaging 38, 1655–1665 (2019).
- 9 C. Chrysostomou, L. Koutsantonis, C. Lemesios, and C. N. Papanicolas, SPECT Angle Interpolation Based on Deep Learning Methodologies, in 2020 IEEE Nuclear Science Symposium and Medical Imaging Conference (NSS/MIC), pages 1–4, 2020.
- 10 K. Thielemans, S. Mustafovic, and C. Tsoumpas, STIR: Software for Tomographic Image Reconstruction Release 2, in 2006 IEEE Nuclear Science Symposium Conference Record, volume 4, pages 2174–2176, 2006.
- 11 T. Merlin, S. Stute, D. Benoit, J. Bert, T. Carlier, C. Comtat, M. Filipovic, F. Lamare, and D. Visvikis, CASToR: a generic data organization and processing code framework for multi-modal and multi-dimensional tomographic reconstruction, Physics in Medicine & Biology 63, 185005 (2018).
- 12 D. Gürsoy, F. De Carlo, X. Xiao, and C. Jacobsen, TomoPy: a framework for the analysis of synchrotron tomographic data, Journal of Synchrotron Radiation 21, 1188–1193 (2014).
- 13 W. van Aarle, W. J. Palenstijn, J. De Beenhouwer, T. Altantzis, S. Bals, K. J. Batenburg, and J. Sijbers, The ASTRA Toolbox: A platform for advanced algorithm development in electron tomography, Ultramicroscopy 157, 35–47 (2015).
- 14 B. D. Man and S. Basu, Distance-driven projection and backprojection in three dimensions, Physics in Medicine & Biology 49, 2463 (2004).
- 15 H. Hudson and R. Larkin, Accelerated image reconstruction using ordered subsets of projection data, IEEE Transactions on Medical Imaging 13, 601–609 (1994).
- 16 P. Green, Bayesian reconstructions from emission tomography data using a modified EM algorithm, IEEE Transactions on Medical Imaging 9, 84–93 (1990).
- 17 S. Ahn and J. Fessler, Globally convergent image reconstruction for emission tomography using relaxed ordered subsets algorithms, IEEE Transactions on Medical Imaging 22, 613–626 (2003).
- 18 G. Wang and J. Qi, PET Image Reconstruction Using Kernel Method, IEEE Transactions on Medical Imaging 34, 61–71 (2015).
- 19 J. Nuyts, D. Beque, P. Dupont, and L. Mortelmans, A concave prior penalizing relative differences for maximum-a-posteriori reconstruction in emission tomography, IEEE Transactions on Nuclear Science 49, 56–60 (2002).
- 20 M. Ljungberg and S.-E. Strand, A Monte Carlo program for the simulation of scintillation camera characteristics, Computer Methods and Programs in Biomedicine 29, 257–272 (1989).
- 21 W. P. Segars, G. Sturgeon, S. Mendonca, J. Grimes, and B. M. W. Tsui, 4D XCAT phantom for multimodality imaging research, Medical Physics 37, 4902–4915 (2010).
- 22 A. F. Paranj, J. Brosch-Lenz, C. Uribe, B. Saboury, and A. Rahmim, Non-linearities in the Transition from Imaging Radiotracers to Therapeutic Radiopharmaceuticals, Journal of Nuclear Medicine 63, 2821–2821 (2022).
- 23 Y. Dewaraja and B. J. Van, Lu-177 DOTATATE Anonymized Patient Datasets: Lu-177 SPECT Projection Data and CT-based Attenuation Coefficient Maps, Data set, 2021.
- 24 A. Myronenko, M. M. R. Siddiquee, D. Yang, Y. He, and D. Xu, Automated Head and Neck Tumor Segmentation from 3D PET/CT HECKTOR 2022 Challenge Report, in Head and Neck Tumor Segmentation and Outcome Prediction, edited by V. Andrearczyk, V. Oreiller, M. Hatt, and A. Depeursinge, pages 31–37, Cham, 2023, Springer Nature Switzerland.
- 25 S. Pieper, M. Halle, and R. Kikinis, 3D Slicer, in 2004 2nd IEEE International Symposium on Biomedical Imaging: Nano to Macro (IEEE Cat No. 04EX821), pages 632–635 Vol. 1, 2004.