Unsupervised Skin Lesion Segmentation via Structural Entropy Minimization
on Multi-Scale Superpixel Graphs
Abstract
Skin lesion segmentation is a fundamental task in dermoscopic image analysis. The complex features of pixels in the lesion region impede the lesion segmentation accuracy, and existing deep learning-based methods often lack interpretability to this problem. In this work, we propose a novel unsupervised Skin Lesion sEgmentation framework based on structural entropy and isolation forest outlier Detection, namely SLED. Specifically, skin lesions are segmented by minimizing the structural entropy of a superpixel graph constructed from the dermoscopic image. Then, we characterize the consistency of healthy skin features and devise a novel multi-scale segmentation mechanism by outlier detection, which enhances the segmentation accuracy by leveraging the superpixel features from multiple scales. We conduct experiments on four skin lesion benchmarks and compare SLED with nine representative unsupervised segmentation methods. Experimental results demonstrate the superiority of the proposed framework. Additionally, some case studies are analyzed to demonstrate the effectiveness of SLED.
Index Terms:
skin lesion segmentation, structural entropy, medical image analysisI Introduction
Skin lesion segmentation of dermoscopic images is essential for skin cancer diagnosis [1]. Accurate segmentation of skin lesions from the surrounding skin is challenging because skin lesions, especially melanoma ones, vary in color, texture, shape, size, and location. Moreover, low contrast between the lesion and healthy skin, changing illumination, and the existence of artifacts like hairs, blood vessels, and color calibration charts make this task even harder.
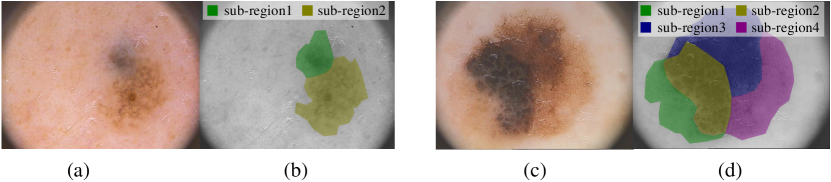
A large amount of unsupervised skin lesion segmentation methods have been proposed by researchers in recent years, including thresholding-based methods [2], region-based methods [3], saliency-based methods [4], and clustering-based methods [5]. They segment skin lesions without labeled datasets, relieving medical experts from the laborious work of data labeling. However, the fine-grained characteristics of lesion skins and healthy skins are under-explored. Figure 1 illustrates examples of skin lesions from the PH2 dataset [6]. On the one hand, the features like color and texture of pixels within the lesion regions are diverse, and the lesion region can be further divided into some unspecified number of sub-regions as shown in Figures 1(b) and 1(d). Ignoring the diversity in a fine-grained level of those pixels leads to sub-optimal segmentation results. On the other hand, the features of pixels in healthy skin are generally consistent, which is one of the most important prior information for skin lesion segmentation. Existing methods fail to fully and effectively utilize this prior, thus being unable to accurately segment the margin between the lesion region and healthy skin.
Regarding the diversity of pixel features in the lesion region, some works directly segment the dermoscopic image into two regions, i.e., the lesion region and healthy skin [2, 3]. They ignore the fine-grained level distinction within the lesion region, which can lead to inaccurate segmentation of pixels at lesion borders. Other works segment dermoscopic images into a proper number of regions [5], and then classify regions into the lesion region and healthy skin. Though being better at distinguishing the fine-grained features, they require a pre-defined number of sub-regions, which lacks generalization ability to new scenarios. Regarding the consistent healthy skin prior, RSSLS [7] utilizes reconstruction error-based saliency to segment skin lesions. With the detected background, i.e., the healthy skin, the whole image is reconstructed based on the background, forming the saliency map. However, the background detection process is complex and imprecise, inducing noise into the segmentation procedure.
In this work, we propose a novel unsupervised Skin Lesion sEgmentation framework via structural entropy (SE) and outlier Detection, namely SLED, which adaptively determines the number of segments by SE minimization, and utilizes the consistent healthy skin prior through isolation forest outlier detection. The basic idea is that we take image segmentation as the graph partition problem where graphs are constructed to incorporate both color features and spatial position of pixels (or superpixels). First, we segment the dermoscopic image into a proper number of regions by minimizing the SE of a graph constructed from the image without the need to know the number of sub-regions a priori, which is critical as shown in Figure 1 the number of sub-regions of a lesion is unknown and unpredictable. The nodes of the graph are pre-segmented superpixels and edge weights are the similarity between superpixels. Modules in the graph partition obtained by SE minimization represent the regions. Second, we distinguish these regions into the lesion region and healthy skin by maximizing the between-class variance, forming a single-scale segmentation. Third, we integrate single-scale segmentation results from different superpixel scales into multi-scale segmentation. To achieve this integration, we train isolation forest models using superpixels in the healthy skin regions from single-scale segmentation results and generate a multi-scale outlier score map by combining outlier scores from different scales. The consistency of pixel features in healthy skin helps isolation forest models to distinguish the lesion region from healthy skin with higher outlier scores. Thresholding on the multi-scale score map gives the multi-scale segmentation. Source code is available on Github111https://github.com/SELGroup/SLED.
We comprehensively evaluate our framework with state-of-the-art unsupervised segmentation methods and several clustering-based methods on four popular skin lesion segmentation datasets. The results show that our framework is more accurate in skin lesion segmentation. We also test the performance of several outlier detection methods, finding that isolation forest best models healthy skin in dermoscopic images. The main contributions of this paper are summarized as follows: (1) An unsupervised skin lesion segmentation framework guided by iteratively refined structural entropy is proposed, which adaptively determines the number of segments in the segmentation process. (2) We characterize the fact that features in healthy skin are consistent and devise a novel multi-scale segmentation mechanism via isolation forest outlier detection method. (3) Comprehensive experiments on four popular skin lesion segmentation datasets demonstrate that our framework achieves new state-of-the-art performance among unsupervised skin lesion segmentation methods.
II Related Work
II-A Unsupervised Skin Lesion Segmentation
Compared to supervised methods, unsupervised skin lesion segmentation methods avoid the laborious work of lesion labeling, and have attracted great interest in recent years. Here we briefly review existing unsupervised skin lesion segmentation methods, including thresholding-based, region-based, saliency-based, and clustering-based approaches.
Histogram thresholding is a simple yet effective way for skin lesion segmentation. The thresholding histograms are constructed in different ways, such as principle component analysis (PCA) on color bands [8] and carefully chosen color bands [2]. More specialized thresholding techniques are also designed for skin lesion segmentation, including weighted thresholding [9] and adaptive thresholding [10]. Region-based methods iteratively merge image regions until the desired lesion region is found. In [3], a simple region merging method that merges superpixels into two regions, i.e., the lesion region and healthy skin, is proposed. In [11], a superpixel region labeling method via continuity classification for skin lesion segmentation is proposed. Saliency detection-based methods treat skin lesions in dermoscopic images as the salient object. They construct a saliency map by assigning each pixel a saliency score, and segment the lesion region by thresholding on the saliency map. The saliency scores are defined by reconstruction errors [7], color and brightness prior [12], color channel volume[4] in unsupervised manners, or lists of regional contrast and regional property in a supervised manner [13]. Clustering-based methods group pixels or superpixels into regions and then classify them to find the skin lesion. Ahn et al.[5] proposed a spatial guided self-supervised clustering network (SGSCN) for skin lesion and liver tumor segmentation that iteratively determines the number of segments. Zhang et al.[14] proposed a deep hyperspherical clustering method based on the theory of belief functions to achieve unsupervised skin lesion segmentation. In the single-scale segmentation step of our framework, we group superpixels by minimizing SE and classify regions by maximizing the between-class variance.
II-B Unsupervised Image Segmentation
Apart from methods specifically designed for skin lesion segmentation, there exist a large number of unsupervised image segmentation methods for more general usage. Classical image segmentation methods group pixels into meaningful regions. Representative methods include -means and spectral clustering [15]. More recent works utilize the power of deep learning such as convolutional neural networks (CNNs) to learn vision features. Kanezaki et al. [16] proposed a CNN-based model to group spatially continuous pixels of similar features to facilitate unsupervised natural image segmentation. In order to perform the segmentation of the target region, there are several other research lines in unsupervised image segmentation related to skin lesion segmentation, which focuses on different scenarios. The first line is unsupervised salient object detection, which aims at localizing and segmenting salient objects simultaneously without manual annotations. Yan et al. [17] pointed out the unreliability of usually used noisy labels generated by traditional unsupervised salient object detection methods and proposed unsupervised domain adaptive salient object detection which learns from synthetic labels with higher quality. Zhou et al. [18] proposed a texture-guided saliency distilling unsupervised salient object detection model through a confidence-aware saliency distilling strategy that assigns scores to samples based on confidence, and a boundary-aware texture matching strategy which refines boundaries by matching textures. The second line is unsupervised foreground extraction, which aims for a binary partition of an image with a foreground containing identifiable objects and a background with remaining regions. Yu et al. [19] presented deep region competition (DRC) to solve the foreground extraction problem by reconciling energy-based prior with generative image modeling in the form of mixture of experts. Ding et al. [20] pointed out two kinds of trivial solutions in the image compositional generation process when performing foreground extraction, and solved trivial solutions with the proposed ComGAN model. For the task of skin lesion segmentation, lesions can be taken as salient objects or image foregrounds, so both methods belonging to these two research lines can be used to tackle the task of skin lesion segmentation.
II-C Structural Entropy
SE [21] is first proposed to measure the complexity of the hierarchical structure of graphs through associated encoding trees, which is naturally a node clustering method. As the SE of a graph is the minimum overall number of bits required to determine the codewords of the graph nodes, it measures the uncertainty embedded in . SE has been successfully applied in the field of bioinformatics [22], reinforcement learning [23, 24], and graph neural networks [25, 26, 27]. In this work, we use the two-dimensional SE, i.e., SE of a graph by a partition, to perform skin lesion segmentation. Without confusion, SE in the following sections means two-dimensional SE.
Let be an undirected weighted graph, where is the node set, is the edge set, and is the edge weight matrix. A graph partition defined on can be formulated as , where is the -th module containing a subset nodes of . Given a graph and its graph partition , the SE of given by is defined as:
| (1) | |||
where is the degree of node , is the weight sum of edges connecting and other nodes, and are volumes, i.e., the sum of the node degrees, in module and graph , respectively, and is the cut of , i.e., the weight sum of edges between nodes in and not in module .
III Methodology
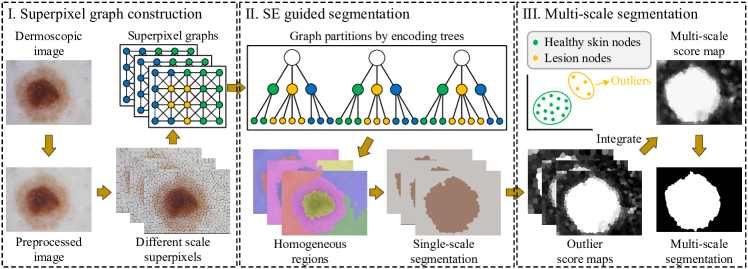
In this section, we present SLED, a novel unsupervised skin lesion segmentation framework based on SE and outlier detection. The overview of SLED is depicted in Figure 2. SLED composes of three components: superpixel graph construction, SE guided segmentation, and multi-scale segmentation mechanism by outlier detection. Different scale superpixels are grouped by SE to form single-scale segmentation results, which are then integrated by the outlier detection-based multi-scale mechanism to generate the final segmentation.
III-A Basic Notations
In this paper, superpixel graphs are constructed from images to perform segmentation, so some notations refer to elements both in graphs and images. In particular, denotes both a graph node and a superpixel, denotes both a graph partition and an image segmentation, and and denote both modules in graph partition and regions in images. We list some important notations in Table I.
| Symbol | Domain | Description |
| - | Superpixel graph | |
| - | Node set, edge set, edge weight matrix | |
| - | graph node/superpixel | |
| - | Graph partition (image segmentation) | |
| Number of modules/regions | ||
| - | Modules in graph partition (regions in images) | |
| - | SE of given by | |
| Cut of | ||
| (weight sum of edges connected to nodes in ) | ||
| Volume of (degree sum of nodes in ) | ||
| Between class variance of regions | ||
| Outlier score of a superpixel | ||
| Outlier score map | ||
| superpixel scale |
III-B Superpixel Graph Construction
Graph-based segmentation methods [15, 28] integrate the information of both color features and spatial position of pixels (or superpixels) in the procedure of graph construction. This gives graph-based methods the ability to segment images accurately and keep the spatial continuity of segments in the meantime. Among the graph-based methods, SE-based methods give a high-quality graph partition by SE minimization. Furthermore, SE-based methods adaptively determine the number of modules in the partition, which are segments corresponding to sub-regions in images in the case of skin lesion segmentation. This gives SE-based methods the advantage of accurate segmentation of pixels at lesion borders.
We construct a graph based on the image, where the nodes in correspond to superpixels of image segmented by SLIC algorithm [29], the edges in connect spatially close superpixels, and the weight matrix measures the similarities among superpixels. To utilize the spatial information of superpixels, we only connect the nodes whose spatial distance is smaller than a threshold . For nodes and with edge connected, the similarity weight is computed as follows:
| (2) |
where is the mean color distance between and , and are the local scaling parameters for nodes [30]. We then sparsify this graph into a -nearest neighbor graph by retaining most significant edges for each node, which avoids the complex dense graphs for subsequent SE minimization.
III-C Structural Entropy Guided Segmentation
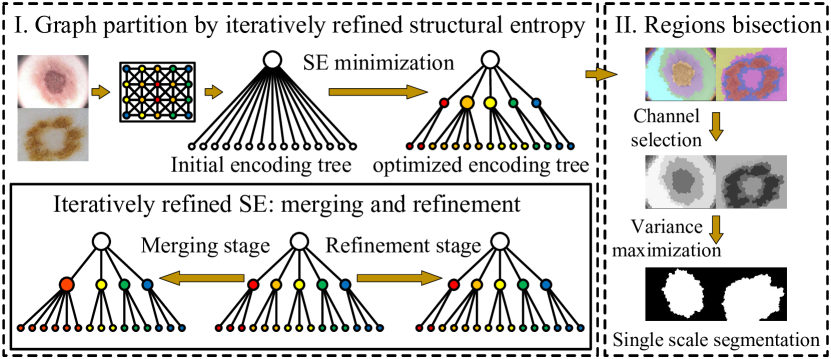
After superpixel graphs construction, images are segmented into regions through SE minimization on these graphs. The procedure of SE guided segmentation is depicted in Figure 3. We aim to partition the graph into several modules by SE minimization. Since nodes in modules represent the superpixels of the image, those modules thus represent homogeneous regions of the image. As such, we can simply classify those regions to be either lesion regions or healthy skin regions to predict accurate lesion boundaries.
We minimize the SE of to obtain a high-quality graph partition . Greedily applying the merging operator [21] on the encoding tree gives the SE minimized encoding tree and corresponding graph partition with adaptively determined modules. However, the partition result by greedy merging can be sub-optimum. We propose the iteratively refined structural entropy for better results. It composes a merging stage and a refinement stage, as illustrated in Algorithm 1. In the merging stage, we merge nodes to maximize the decreasing amount of SE to obtain the encoding tree with multiple modules. And then in the refinement stage, we greedily adjust nodes into different modules to achieve better SE scores.
In the merging stage, we apply the merging operator on the initial encoding tree which contains all graph nodes as tree leaves to obtain the encoding tree by merging. For an encoding tree with modules and contained, the decrease amount of SE after merging and is given by:
| (3) |
where denotes modules erging, is a module merged from and , containing nodes from either or , and are the volume of and , and is the cut of , as defined in Section II-C. Merging operator merges and into if .
In the refinement stage, we iteratively refine the encoding tree from the merging stage to obtain the encoding tree by refinement. For graph node , the decrease amount of SE by removing from the original module is given by:
| (4) |
where denotes node emoving, means removing node from module , and the increase amount of SE by inserting node into another module is given by:
| (5) |
where denotes node nserting, denotes inserting node into module . It should be noted that the constructed graph contains no self-loop, thus for graph node . In each iteration, we remove nodes from the original modules and find modules that minimize SE the most.
In the merging stage, the merging operator is performed iff , so decreases after each merging iteration and converges when no such module pair exists. In the refinement stage, node transfers from module to a module with largest in each iteration, so decreases or stays constant after each refinement iteration, and converges when no improvement can be made.
The time complexity of the merging stage is [21]. In the refinement stage, calculating and for each node and every possible module take time of for each iteration. Also, updating the cut and the volume of each module take time of for each iteration. Thus, the total time complexity of Algorithm 1 is , where , , and denote the number of nodes, modules, and iterations, respectively.
Homogeneous Regions Bisection. Hereafter, we classify those segmented regions into the lesion region and healthy skin. We adopt the between-class variance maximization method, which is a widely used criterion in skin lesion segmentation [2]. Specifically, we choose a color channel from the image, obtain a gray image, and use the intensity of the gray image to classify the regions into classes and . To better separate the regions, the channel is chosen from the RGB channels with maximum after bisection. For each region , the occurrence probability and the mean intensity are represented as:
| (6) |
and
| (7) |
respectively, where is the intensity of pixel , is the number of pixels in region , and is the total number of pixels in the image. The between-class variance of regions is given by:
| (8) |
where is the occurrence probability of class defined as:
| (9) |
is the mean intensity of class defined as:
| (10) |
and is the total mean intensity of and , defined as:
| (11) |
In practice, we arrange in ascending order and separate those regions into two classes, i.e., and using a threshold which gives the greatest . The darker class is the lesion region.
III-D Multi-Scale Segmentation Mechanism
Due to the complex condition of different dermoscopic images, mis-segmentation may occur in SE-guided segmentation. We develop a multi-scale superpixel-based segmentation mechanism to improve the segmentation accuracy. In fact, we observed features of pixels in healthy skin are consistent. Thus, we view superpixels in healthy skin as normal, while those in the lesion region are outliers. Hence, we can distinguish healthy and lesion regions by the outlier detection method. Intuitively, a higher outlier score of a superpixel reflects a higher possibility to be a lesion region.
Outlier Detection by Isolation Forest. Isolation Forest (iForest) [31] detects outliers by building an ensemble of binary trees that separate training data points called iTrees. The susceptibility of data points to being outliers is measured by the average traversal path length on iTrees. The average traversal path length-based outlier scores of iForest are well-graded. These graded scores help mis-segmented superpixels to be reclassified correctly in the following binary segmentation procedure by thresholding.
Given a dermoscopic image segmentation with lesion region and healthy skin, we train an iForest model containing a collection of iTrees using superpixels in the healthy skin whose attributes are the average RGB colors. With this ensemble of iTrees, the average path lengths of all superpixels are counted, and the outlier score of an superpixel is calculated as:
| (12) |
where is the average of from the collection of iTrees, is the number of superpixels in healthy skin, and is the normalization term. The outlier scores of all superpixels are obtained from the iTrees, forming a score map at the size of the image.
Multi-Scale Integration. We integrate the outlier scores from different superpixel scales and form the multi-scale score map. The weighted score of pixel being an outlier is defined as:
| (13) |
where is the score of pixel at scale , is the number of different scales, and is the weight of scale . We use the in Eq. (8) to indicate the confidence of single-scale segmentation where larger should be associated with larger weights. Specifically, the weight of a scale is defined as:
| (14) |
where is the between-class variance of scale .
The binary segmentation result is obtained by applying GHT thresholding [32] on the multi-scale score map. We also perform hole filling to avoid small holes in the lesion part. Following [9], we compute the region score of every connected component which increase with region size and proximity to the image center. This is achieved by filtering each connected component with a two-dimensional Gaussian filter. The connected component with the largest region score is selected as the final lesion region.
IV Experiments and Results
| ISIC 2016 | ISIC 2017 | ISIC 2018 | |||||||||||||
| Method% | AC | SE | SP | DI | JA | AC | SE | SP | DI | JA | AC | SE | SP | DI | JA |
| UDASOD | 71.15 | 45.44 | 76.57 | 34.50 | 27.96 | 59.07 | 60.07 | 55.99 | 31.19 | 23.70 | 67.87 | 35.92 | 79.60 | 24.51 | 18.86 |
| Sp. Merging | 86.67 | 67.13 | 95.39 | 69.97 | 61.06 | 79.89 | 59.16 | 88.72 | 54.66 | 46.02 | 84.53 | 69.82 | 92.79 | 70.11 | 60.89 |
| DRC | 83.78 | 68.51 | 97.11 | 66.84 | 53.32 | 83.77 | 70.35 | 95.58 | 59.11 | 45.40 | 83.85 | 70.00 | 97.00 | 68.71 | 56.05 |
| Saliency-CCE | 85.91 | 74.72 | 95.70 | 72.18 | 60.64 | 83.87 | 74.07 | 92.98 | 61.77 | 49.53 | 85.51 | 77.44 | 94.34 | 72.85 | 61.91 |
| A2S-v2 | 87.51 | 82.64 | 93.85 | 75.52 | 65.67 | 82.85 | 68.65 | 92.80 | 61.35 | 51.10 | 86.22 | 72.13 | 97.35 | 75.01 | 65.94 |
| SpecWRSC | 84.83 | 65.95 | 92.69 | 68.76 | 58.05 | 83.03 | 68.21 | 89.96 | 61.01 | 50.52 | 81.20 | 69.39 | 86.34 | 68.97 | 58.41 |
| NCut | 85.24 | 64.86 | 93.54 | 68.78 | 58.14 | 83.79 | 67.12 | 90.90 | 62.13 | 51.84 | 82.48 | 68.12 | 88.31 | 69.11 | 58.78 |
| -means | 89.24 | 69.88 | 95.76 | 76.13 | 66.37 | 84.90 | 70.77 | 90.64 | 67.78 | 58.11 | 83.70 | 71.73 | 88.09 | 71.46 | 61.57 |
| SGSCN | 86.61 | 63.36 | 96.59 | 71.08 | 60.24 | 85.13 | 54.98 | 95.56 | 59.95 | 50.04 | 82.30 | 71.17 | 87.36 | 70.97 | 61.81 |
| SLEDSS | 90.69 | 77.85 | 97.23 | 81.61 | 72.21 | 86.96 | 75.98 | 92.98 | 70.62 | 60.56 | 86.22 | 79.77 | 90.52 | 76.81 | 67.98 |
| SLEDMS | 91.82 | 80.83 | 97.72 | 84.33 | 76.02 | 88.81 | 77.96 | 94.61 | 73.90 | 64.45 | 86.93 | 80.12 | 91.84 | 77.68 | 69.35 |
| Improvement | 4.31 | - | 0.61 | 8.81 | 10.35 | 3.68 | 3.89 | - | 12.13 | 13.35 | 0.71 | 2.68 | - | 2.67 | 3.41 |
In this section, we first describe our experimental setup, including datasets, evaluation metrics, baselines, and implementation details of SLED. Next, we quantitatively evaluate SLED on four datasets to verify the effectiveness of SLED. Besides, we perform ablation studies and case studies to analyze SLED in detail. At last, we evaluate the efficiency of SLED. All experiments are conducted to answer the following questions:
-
•
Q1: Does SLED outperform state-of-the-art baselines regarding skin lesion segmentation?
-
•
Q2: Dose our outlier detection-based multi-scale segmentation mechanism effectively utilize the consistent healthy skin prior?
-
•
Q3: Is SLED sensitive to major parameters?
-
•
Q4: Is SLED efficient enough for skin lesion segmentation compared to baselines?
IV-A Experimental Setup
Datasets. We evaluate SLED on four public benchmark datasets: ISIC 2016 [33], ISIC 2017 [34], ISIC 2018 [35], and PH2 [6]. The first three datasets are provided by the International Skin Imaging Collaboration (ISIC) archive from the “Skin Lesion Analysis toward Melanoma Detection” challenge hosted by the International Symposium on Biomedical Imaging (ISBI) in 2016, 2017, and 2018 respectively. We evaluate the performance of different methods on the test sets, which contain 379, 600, and 1000 RGB dermoscopic images respectively at the resolution ranging from 1022 767 to 4288 2848, along with their corresponding ground truth. The PH2 dataset is another frequently used benchmark, especially for unsupervised skin lesion segmentation. It contains a total of 200 RGB dermoscopic images at the resolution of 768 560 pixels, along with their pixel-level lesion ground truth annotated by expert dermatologists.
Evaluation Metrics and Baselines. We adopt five metrics used in ISIC challenges for evaluating all compared methods, which are pixel-level accuracy (AC), pixel-level sensitivity (SE), pixel-level specificity (SP), Dice Coefficient (DI), and Jaccard Index (JA), as defined in [33]. We compare SLED with a variety of baseline methods including unsupervised skin lesion segmentation methods, an unsupervised foreground extraction method, unsupervised salient object detection methods, and several clustering methods. For unsupervised skin lesion segmentation methods, we consider superpixel merging (Sp. Merging [3]), saliency map thresholding (Saliency-CCE), and deep learning-based clustering (SGSCN [5]). For the unsupervised foreground extraction method, we consider Deep Region Competition (DRC [19]), where skin lesions are taken as foreground. For unsupervised salient object detection methods, we consider Unsupervised Domain Adaptive Salient Object Detection (UDASOD [17]) and texture-guided saliency distilling (A2S-v2 [18]), where skin lesions are taken as salient objects. For clustering methods, we consider normalized cut (NCut [15]), -means, and hierarchical clustering (SpecWRSC [36]). The number of segments of -means, NCut, and SpecWRSC is set to be three, which has been reported to perform well for skin lesion segmentation [5]. To achieve a fair comparison, we perform the same preprocessing, homogeneous region bisection, and postprocessing method for clustering-based methods as SLED. The details of important methods are as follows:
-
•
Sp. Merging [3] segments skin lesions by greedily merging superpixels using the distance of the mean color of each superpixel as the criterion.
-
•
Saliency-CCE [4] utilizes a hand-crafted color feature extractor called color channel volume to obtain the saliency map of skin lesions and binarize this map through adaptive thresholding to obtain lesion masks.
-
•
SGSCN [5] is a spatial guided self-supervised clustering network that groups pixels that are spatially close and have consistent features.
-
•
DRC [19] is an unsupervised foreground extraction approach by reconciling energy-based prior with generative image modeling in the form of Mixture of Experts.
-
•
UDASOD [17] is an unsupervised domain adaptive salient object detection method which learns saliency from synthetic but clean labels.
-
•
A2S-v2 [18] is an unsupervised salient object detection method with a confidence-aware saliency distilling strategy and a boundary-aware texture matching strategy.
-
•
SpecWRSC [36] is an efficient hierarchical clustering algorithm running in nearly-linear time in the input size of the input graph. We choose the largest modules from the hierarchical clustering tree to obtain clusters.
Implementation Details. For all datasets, images are resized into pixels, artifacts in dermoscopic images are removed using existing methods, including hairs [37], dark corners [38], and color charts [13]. Color constancy [39] is also performed on images to cope with illumination problems. We set the parameters of superpixel graph construction empirically, with the spatial distance threshold of 0.3 times image height and width, the local scaling parameter of 30, and retained edge number of 50. To evaluate the effectiveness of the multi-scale mechanism in SLED framework, we report both the results of single-scale SLED (SLEDSS) and multi-scale SLED (SLEDMS), corresponding to SLED without and with the multi-scale mechanism. In the reported results, we empirically set the number of superpixels of SLEDSS to be 400. The segmentation results of SLEDMS integrate the results of SLEDSS with superpixel numbers from 200 to 700 at increments of 50. All the experiments are conducted on a server with two Intel(R) 2.30 GHz CPUs and 500 GB RAM.
IV-B Quantitative Results (Q1)
Table II shows the results of unsupervised skin lesion segmentation methods on three ISIC datasets. Compared to state-of-the-art methods, SLEDMS and SLEDSS achieve the best and second-best performance on three metrics including AC, DI, and JA on both three datasets. SLEDMS witnesses improvements from 0.61% to 13.35% on these three metrics, as shown in the last row of Table II. Since SE and SP are a pair of metrics to measure how well methods can identify true positives and true negatives respectively, SLEDMS failed to achieve the best performance on both metrics. However, SLEDMS achieves the best performance on at least one metric on both three datasets and achieves quite well performance on the other metric, demonstrating the superiority of SLEDMS on this pair of metrics. Both SLEDSS and SLEDMS achieve better performance than all other clustering-based methods, which thanks to their ability to adaptively determine the number of segments of SE. We can also see that SLEDMS achieves better performance than SLEDSS on all metrics, which proves the effectiveness of our outlier detection-based multi-scale mechanism.
We also evaluate SLED on the popular PH2 dataset, as shown in Table III. SLEDMS and SLEDSS achieve the best and second-best performance on four metrics and achieve quite high SP scores comparable to baseline methods. Improvements of SLEDMS on this dataset range from 1.20% to 3.35% on four metrics, as shown in the last row of Table III. Through quantitative comparison with nine baselines on four datasets, SLED is proven to achieve new state-of-the-art performance among unsupervised skin lesion segmentation methods.
| Method% | AC | SE | SP | DI | JA |
| UDASOD | 63.18 | 48.22 | 68.03 | 31.56 | 23.68 |
| Sp. Merging | 89.10 | 79.63 | 96.00 | 82.83 | 73.97 |
| DRC | 82.63 | 69.18 | 97.65 | 72.41 | 59.76 |
| Saliency-CCE | 84.62 | 78.90 | 93.77 | 76.79 | 65.62 |
| A2S-v2 | 85.66 | 87.56 | 91.37 | 78.21 | 67.15 |
| SpecWRSC | 85.96 | 79.08 | 89.74 | 78.12 | 68.54 |
| NCut | 88.15 | 76.16 | 94.94 | 80.17 | 70.51 |
| -means | 91.64 | 83.82 | 95.03 | 86.14 | 77.78 |
| SGSCN | 91.80 | 84.26 | 93.82 | 87.89 | 80.15 |
| SLEDSS | 92.00 | 89.35 | 94.76 | 88.02 | 80.11 |
| SLEDMS | 93.00 | 89.97 | 96.37 | 90.34 | 83.50 |
| Improvement | 1.20 | 2.41 | - | 2.45 | 3.35 |
| Method% | AC | SE | SP | DI | JA |
| SLEDEcod | 75.58 | 24.51 | 99.51 | 33.36 | 23.77 |
| SLEDK-NN | 84.80 | 47.94 | 99.78 | 60.07 | 47.72 |
| SLEDOCSVM | 91.34 | 79.52 | 97.48 | 82.59 | 74.13 |
| SLED | 91.82 | 80.83 | 97.72 | 84.33 | 76.02 |
IV-C Ablation Study (Q2, Q3)
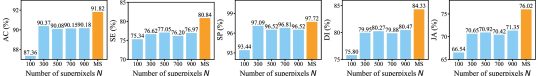
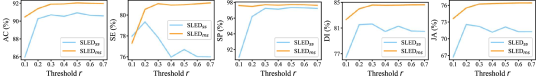
Sensitivity Analysis. We analyze the sensitivity of parameters involved in SLED. One important parameter is the superpixel number . A larger value of reduces the risk of over-merge but impeded the efficiency of SLED. We explore the performance of SLEDSS with different values of as shown in Figure 4. The performance of SLEDSS is slightly fluctuating but generally stable when , indicating that SLEDSS adapts well among a wide range value of . SLEDMS outperforms any SLEDSS results in four out of five metrics by integrating segmentation of SLEDSS at different superpixel scales, demonstrating the effectiveness of the multi-scale segmentation mechanism.
Another important parameter is the spatial distance threshold , which is used to balance the importance of color features and the spatial position of superpixels in the graph construction. A larger value of means greater importance of the color feature. Figure 5 shows the sensitivity of to SLED. It can be observed that the performance of SLED is poor when and gets stable when is larger. SLEDSS witnesses a small drop in performance when is larger than 0.3, but this drop can be eliminated by the multi-scale segmentation mechanism of SLEDMS.
Outlier Detection Methods. The proposed multi-scale segmentation mechanism is a general approach, which can be implemented by many unsupervised outlier detection methods. To find the method that best models healthy skin, we utilize different outlier detection methods to implement several variants of SLED , including SLEDEcod (Ecod [40]), SLEDK-NN (-Nearest Neighbors [41]), SLED OCSVM (OCSVM [42]), and SLED (Isolation Forest [31]). Table IV presents the performance of these variants. SLED achieves best performance in all metrics, which indicates that iForest models healthy skin better. SLED OCSVM ranks second with comparable performance.
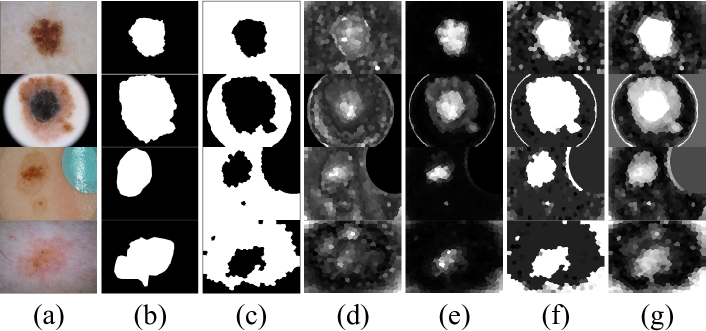
Figure 6 illustrates examples of outlier score maps using different outlier detection methods. Both Ecod and -NN fail to distinguish the lesion region and healthy skin. OCSVM distinguishes the lesion region but fails to reflect the diverse pixel feature in the lesion region, as shown in the second and third rows. Visually the outlier score maps of iForest better reflect the features of the lesion region by giving different superpixels graded scores. When the detected healthy skin by SLEDSS is not accurate, as shown by the last row, all methods fail to give a good score map. However, the score map of iForest still reflects the lesion region. In all, iForest best models healthy skin, and best fits our framework.
IV-D Case Study
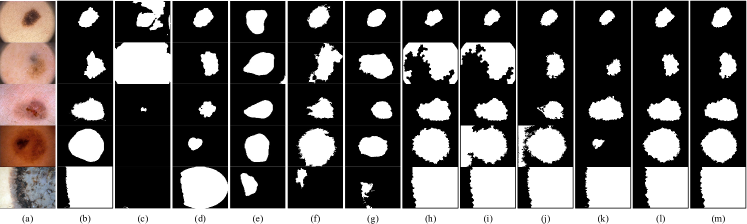
Qualitative Comparison. Figure 7 gives a qualitative comparison of different segmentation methods. Variations of lesions in color, texture, shape, size, and location impede lesion segmentation accuracy. Low contrast between lesions and healthy skin (shown by 2nd and 3rd rows) and changing illumination (shown by 4th row) are the other two challenges. Furthermore, many lesions show diverse features and can be divided into several sub-regions, misleading some methods to take less prominent parts of lesions as healthy skin. Both K-means, NCut, and SpecWRSC suffer from the problem of fixed segments number, leading to poor segmentation results in some cases. Compared to other methods including SLEDSS, SLEDMS gives more accurate lesion boundaries.
Examples of Outlier Score Maps. Figure 8 shows several examples of outlier score maps. The multi-scale mechanism helps reduce the mis-segmentation of SLEDSS, as shown in the second and third rows. In these two rows, the segmented lesion regions by SLEDSS are smaller than the ground truths, leading to inaccurate single-scale score maps. Multi-scale score maps however better distinguish lesion regions by integrating different single-scale score maps, leading to more accurate segmentation results of SLEDMS. It should also be noted that when the features of pixels in healthy skin are not consistent, the proposed multi-scale mechanism induces noises. For example, the image in the last row has inconsistent backgrounds due to the influence of light illumination, and the segmentation result of SLEDMS is worse than SLEDSS.

|
Method |
UDASOD |
Sp. Merging |
DRC |
Saliency-CCE |
A2S-v2 |
SpecWRSC |
NCut |
-means |
SGSCN |
SLEDSS |
SLEDMS |
| Time (min) | 1 | 60 | 292 | 18 | 1 | 25 | 24 | 22 | 396 | 25 | 51 |
IV-E Efficiency (Q4)
We test the efficiency of different methods on the PH2 dataset as shown in Table V. The running time of SLEDSS is comparable to Saliency-CCE, NCut, and -means. By calculating the segmentation of SLEDSS with different scales in parallel, the running time of SLEDMS is comparable to Sp. Merging, and less than DRC and SGSCN. Although UDASOD and A2S-v2 consume the least running time, they both require tremendous model training time. In all, SLED is quite efficient.
V Conclusion
In this paper, we have presented SLED, a novel unsupervised skin lesion segmentation framework. To address the challenges of diverse pixel features within the lesion region and the consistency of pixel features in healthy skin, we introduce two key components in our framework: SE guided segmentation and a multi-scale mechanism utilizing isolation forest outlier detection. Our extensive experimental evaluations on four widely used skin lesion segmentation benchmarks confirm the superiority of SLED over existing methods in terms of effectiveness and efficiency. We believe that SLED holds great potential for improving dermatological diagnosis and aiding in early disease detection.
Acknowledgement
This work is supported by the National Key R&D Program of China through grant 2021YFB1714800, NSFC through grant 61932002, S&T Program of Hebei through grant 20310101D, Natural Science Foundation of Beijing Municipality through grant 4222030, CCF-DiDi GAIA Collaborative Research Funds for Young Scholars, and the Fundamental Research Funds for the Central Universities. Philip S. Yu is supported by NSF under grant III-2106758.
References
- [1] Y. Yuan, M. Chao, and Y.-C. Lo, “Automatic skin lesion segmentation using deep fully convolutional networks with jaccard distance,” IEEE transactions on medical imaging, vol. 36, no. 9, pp. 1876–1886, 2017.
- [2] M. R. Guarracino and L. Maddalena, “Sdi+: A novel algorithm for segmenting dermoscopic images,” IEEE journal of biomedical and health informatics, vol. 23, no. 2, pp. 481–488, 2018.
- [3] D. Patiño, J. Avendaño, and J. W. Branch, “Automatic skin lesion segmentation on dermoscopic images by the means of superpixel merging,” in International Conference on Medical Image Computing and Computer-Assisted Intervention. Springer, 2018, pp. 728–736.
- [4] X. Zhou, T. Tong, Z. Zhong, H. Fan, and Z. Li, “Saliency-cce: Exploiting colour contextual extractor and saliency-based biomedical image segmentation,” Computers in Biology and Medicine, p. 106551, 2023.
- [5] E. Ahn, D. Feng, and J. Kim, “A spatial guided self-supervised clustering network for medical image segmentation,” in International Conference on Medical Image Computing and Computer-Assisted Intervention. Springer, 2021, pp. 379–388.
- [6] T. Mendonça, P. M. Ferreira, J. S. Marques, A. R. Marcal, and J. Rozeira, “Ph 2-a dermoscopic image database for research and benchmarking,” in 2013 35th annual international conference of the IEEE engineering in medicine and biology society (EMBC). IEEE, 2013, pp. 5437–5440.
- [7] E. Ahn, J. Kim, L. Bi, A. Kumar, C. Li, M. Fulham, and D. D. Feng, “Saliency-based lesion segmentation via background detection in dermoscopic images,” IEEE journal of biomedical and health informatics, vol. 21, no. 6, pp. 1685–1693, 2017.
- [8] F. Peruch, F. Bogo, M. Bonazza, V.-M. Cappelleri, and E. Peserico, “Simpler, faster, more accurate melanocytic lesion segmentation through meds,” IEEE Transactions on Biomedical Engineering, vol. 61, no. 2, pp. 557–565, 2013.
- [9] M. Zortea, E. Flores, and J. Scharcanski, “A simple weighted thresholding method for the segmentation of pigmented skin lesions in macroscopic images,” Pattern Recognition, vol. 64, pp. 92–104, 2017.
- [10] D. N. Thanh, U. Erkan, V. S. Prasath, V. Kumar, and N. N. Hien, “A skin lesion segmentation method for dermoscopic images based on adaptive thresholding with normalization of color models,” in 2019 6th International Conference on Electrical and Electronics Engineering (ICEEE). IEEE, 2019, pp. 116–120.
- [11] F. Navarro, M. Escudero-Vinolo, and J. Bescós, “Accurate segmentation and registration of skin lesion images to evaluate lesion change,” IEEE journal of biomedical and health informatics, vol. 23, no. 2, pp. 501–508, 2018.
- [12] H. Fan, F. Xie, Y. Li, Z. Jiang, and J. Liu, “Automatic segmentation of dermoscopy images using saliency combined with otsu threshold,” Computers in biology and medicine, vol. 85, pp. 75–85, 2017.
- [13] M. Jahanifar, N. Z. Tajeddin, B. M. Asl, and A. Gooya, “Supervised saliency map driven segmentation of lesions in dermoscopic images,” IEEE journal of biomedical and health informatics, vol. 23, no. 2, pp. 509–518, 2018.
- [14] Z. Zhang, S. Ye, Z. Liu, H. Wang, and W. Ding, “Deep hyperspherical clustering for skin lesion medical image segmentation,” IEEE Journal of Biomedical and Health Informatics, 2023.
- [15] J. Shi and J. Malik, “Normalized cuts and image segmentation,” IEEE Transactions on pattern analysis and machine intelligence, vol. 22, no. 8, pp. 888–905, 2000.
- [16] W. Kim, A. Kanezaki, and M. Tanaka, “Unsupervised learning of image segmentation based on differentiable feature clustering,” IEEE Transactions on Image Processing, vol. 29, pp. 8055–8068, 2020.
- [17] P. Yan, Z. Wu, M. Liu, K. Zeng, L. Lin, and G. Li, “Unsupervised domain adaptive salient object detection through uncertainty-aware pseudo-label learning,” in Proceedings of the AAAI Conference on Artificial Intelligence, vol. 36, no. 3, 2022, pp. 3000–3008.
- [18] H. Zhou, B. Qiao, L. Yang, J. Lai, and X. Xie, “Texture-guided saliency distilling for unsupervised salient object detection,” in Proceedings of the IEEE/CVF Conference on Computer Vision and Pattern Recognition, 2023, pp. 7257–7267.
- [19] P. Yu, S. Xie, X. Ma, Y. Zhu, Y. N. Wu, and S.-C. Zhu, “Unsupervised foreground extraction via deep region competition,” Advances in Neural Information Processing Systems, vol. 34, pp. 14 264–14 279, 2021.
- [20] R. Ding, K. Guo, X. Zhu, Z. Wu, and L. Wang, “Comgan: unsupervised disentanglement and segmentation via image composition,” Advances in neural information processing systems, vol. 35, pp. 4638–4651, 2022.
- [21] A. Li and Y. Pan, “Structural information and dynamical complexity of networks,” IEEE Transactions on Information Theory, vol. 62, no. 6, pp. 3290–3339, 2016.
- [22] A. Li, X. Yin, B. Xu, D. Wang, J. Han, Y. Wei, Y. Deng, Y. Xiong, and Z. Zhang, “Decoding topologically associating domains with ultra-low resolution hi-c data by graph structural entropy,” Nature communications, vol. 9, no. 1, p. 3265, 2018.
- [23] X. Zeng, H. Peng, and A. Li, “Effective and stable role-based multi-agent collaboration by structural information principles,” in Proceedings of the Thirty-Seventh AAAI Conference on Artificial Intelligence, 2023, pp. 11 772–11 780.
- [24] X. Zeng, H. Peng, A. Li, C. Liu, L. He, and P. S. Yu, “Hierarchical state abstraction based on structural information principles,” in Proceedings of the Thirty-Second International Joint Conference on Artificial Intelligence, 2023, pp. 4549–4557.
- [25] J. Wu, X. Chen, K. Xu, and S. Li, “Structural entropy guided graph hierarchical pooling,” in International Conference on Machine Learning. PMLR, 2022, pp. 24 017–24 030.
- [26] D. Zou, H. Peng, X. Huang, R. Yang, J. Li, J. Wu, C. Liu, and P. S. Yu, “Se-gsl: A general and effective graph structure learning framework through structural entropy optimization,” in Proceedings of the ACM Web Conference 2023, 2023, pp. 499–510.
- [27] Z. Yang, G. Zhang, J. Wu, J. Yang, Q. Z. Sheng, H. Peng, A. Li, S. Xue, and J. Su, “Minimum entropy principle guided graph neural networks,” in Proceedings of the Sixteenth ACM International Conference on Web Search and Data Mining, 2023, pp. 114–122.
- [28] P. F. Felzenszwalb and D. P. Huttenlocher, “Efficient graph-based image segmentation,” International journal of computer vision, vol. 59, no. 2, pp. 167–181, 2004.
- [29] R. Achanta, A. Shaji, K. Smith, A. Lucchi, P. Fua, and S. Süsstrunk, “Slic superpixels compared to state-of-the-art superpixel methods,” IEEE transactions on pattern analysis and machine intelligence, vol. 34, no. 11, pp. 2274–2282, 2012.
- [30] L. Zelnik-Manor and P. Perona, “Self-tuning spectral clustering,” Advances in neural information processing systems, vol. 17, 2004.
- [31] F. T. Liu, K. M. Ting, and Z.-H. Zhou, “Isolation-based anomaly detection,” ACM Transactions on Knowledge Discovery from Data (TKDD), vol. 6, no. 1, pp. 1–39, 2012.
- [32] J. T. Barron, “A generalization of otsu’s method and minimum error thresholding,” in European Conference on Computer Vision. Springer, 2020, pp. 455–470.
- [33] D. Gutman, N. C. Codella, E. Celebi, B. Helba, M. Marchetti, N. Mishra, and A. Halpern, “Skin lesion analysis toward melanoma detection: A challenge at the international symposium on biomedical imaging (isbi) 2016, hosted by the international skin imaging collaboration (isic),” arXiv preprint arXiv:1605.01397, 2016.
- [34] N. C. Codella, D. Gutman, M. E. Celebi, B. Helba, M. A. Marchetti, S. W. Dusza, A. Kalloo, K. Liopyris, N. Mishra, H. Kittler et al., “Skin lesion analysis toward melanoma detection: A challenge at the 2017 international symposium on biomedical imaging (isbi), hosted by the international skin imaging collaboration (isic),” in 2018 IEEE 15th international symposium on biomedical imaging (ISBI 2018). IEEE, 2018, pp. 168–172.
- [35] N. Codella, V. Rotemberg, P. Tschandl, M. E. Celebi, S. Dusza, D. Gutman, B. Helba, A. Kalloo, K. Liopyris, M. Marchetti et al., “Skin lesion analysis toward melanoma detection 2018: A challenge hosted by the international skin imaging collaboration (isic),” arXiv preprint arXiv:1902.03368, 2019.
- [36] S. Laenen, B.-A. Manghiuc, and H. Sun, “Nearly-optimal hierarchical clustering for well-clustered graphs,” arXiv preprint arXiv:2306.09950, 2023.
- [37] T. Lee, V. Ng, R. Gallagher, A. Coldman, and D. McLean, “Dullrazor®: A software approach to hair removal from images,” Computers in biology and medicine, vol. 27, no. 6, pp. 533–543, 1997.
- [38] S. W. Pewton and M. H. Yap, “Dark corner on skin lesion image dataset: Does it matter?” in Proceedings of the IEEE/CVF Conference on Computer Vision and Pattern Recognition Workshops, 2022, pp. 4831–4839.
- [39] G. D. Finlayson and E. Trezzi, “Shades of gray and colour constancy,” in Color and Imaging Conference, vol. 2004, no. 1. Society for Imaging Science and Technology, 2004, pp. 37–41.
- [40] Z. Li, Y. Zhao, X. Hu, N. Botta, C. Ionescu, and G. Chen, “Ecod: Unsupervised outlier detection using empirical cumulative distribution functions,” IEEE Transactions on Knowledge and Data Engineering, 2022.
- [41] F. Angiulli and C. Pizzuti, “Fast outlier detection in high dimensional spaces,” in European conference on principles of data mining and knowledge discovery. Springer, 2002, pp. 15–27.
- [42] B. Schölkopf, J. C. Platt, J. Shawe-Taylor, A. J. Smola, and R. C. Williamson, “Estimating the support of a high-dimensional distribution,” Neural computation, vol. 13, no. 7, pp. 1443–1471, 2001.