Simultaneous mm/X-ray intraday variability in the radio-quiet AGN MCG+08-11-11
Most of the Active Galactic Nuclei (AGN) are radio-quiet (RQ) and, differently from radio-loud (RL) AGN, do not show signature of large-scale and powerful jets. The physical origin of their radio emission remains then broadly unclear. The observation of flat/inverted radio spectra at GHz frequencies seems to support however the presence of an unresolved synchrotron self-absorbed region in the close environment of the supermassive black hole. Its size could be as small as that of the X-ray corona. Since synchrotron self absorption decreases strongly with frequency, these sources need to be observed in the millimetric (mm) domain. We report here a 12h simultaneous mm-X-ray observation of the RQ AGN MCG+08-11-11 by NOEMA and NuSTAR, respectively. The mm flux shows a weak but clear increase along the pointing with a fractional variability of %. The 3-10 keV flux of NuSTAR also increases and shows a fractional variability of %. A structure function analysis shows a local maximum in the mm light curve corresponding to 2-3% of variability on timescale of seconds (100-300 light crossing time). Assuming an optically thick mm emitting medium, this translates into an upper limit of its size of 1300 . The observation of fast variability in radio-mm and X-ray wavelengths, as well as a similar variability trend, well support the mm emission to be emitted by a region close, and potentially related to, the X-ray corona like an outflow/weak jet.
1 Introduction
Active Galactic Nuclei (AGN) can be subdivided in two main groups, the Radio-Quiet (RQ) and Radio-Loud (RL) AGN, depending on their radio-loudness 111 is generally defined as the ratio between the rest frame radio luminosity at a given frequency and the optical luminosity, usually in the B band. (Kellermann et al., 1989). The threshold value between the two groups is typically . The two groups are also characterised by a different radio to X-ray luminosity ratio (Terashima & Wilson, 2003), where for RL AGN, and in RQ AGN (Laor & Behar, 2008). In the case of RL AGN the origin of their radio emission is relatively well understood and is a direct signature of synchrotron emission from large-scale and powerful jets. On the contrary, the physical origin of the radio emission in RQ AGN is still unclear. It is suspected to be a mix of emission of different origins. The most favoured ones are: nuclear star-forming regions, weak/small scale jets and/or an opaque (optically thick) unresolved source in the close environment of the accretion disk around the supermassive black hole, referred to as the corona (see Panessa et al., 2019, for a recent review). The presence of the latter is sustained by the observation of flat/inverted radio spectra at GHz frequencies, characteristic of synchrotron self-absorption emission, which exceeds the low-frequency spectral slope (Doi et al., 2011; Park et al., 2013; Behar et al., 2015, 2018; Inoue & Doi, 2018), the so called mm-wave excess. This excess luminosity can extend with a flat slope up to 230 GHz (Kawamuro et al., 2022), and shows a tight correlation with the X-ray luminosity (Behar et al., 2015, 2018; Kawamuro et al., 2022).
Recent observations with the VLBA, reaching a resolution of a few mas, which corresponds in some cases to a few pc, also suggest that the radio emission of low Eddington ratio RQ AGN ( 0.3) predominately originates from an unresolved and extremely compact region (Alhosani et al. 2022). A larger VLBA sample shows that most RQ AGN have a flat-slope compact core that coincides with the Gaia position, and whose luminosity tightly correlates with the X-ray luminosity (Chen et al., 2023). Currently it is not possible to go below the pc scale with imaging, and one has to turn to variability time scales to constrain the source size based on light travel time arguments. This is the purpose of this letter, presenting for the first time intraday (hour timescale) variability of simultaneous mm (NOEMA) and X-ray (NuSTAR) observations of an AGN (MCG+08-11-11).
Simple estimates indeed show that the size of an opaque self absorbed synchrotron source decreases strongly with frequency. The physical size of a self-absorbed synchrotron source can indeed be estimated from its measured radio flux density (in units of ) at the frequency (e.g. following Laor & Behar 2008):
| (1) | |||||
| (2) |
where is the frequency in GHz, is the magnetic field strength (assumed to be uniform) in Gauss and the redshift of the AGN, a proxy for its distance at low-, assuming a Hubble constant equal to 70 km s-1 Mpc-1. Equation 2 is rescaled with respect to the gravitational radius of a supermassive black hole222 cm with . Since above 300 GHz the thermal dust emission starts to dominate (Barvainis et al., 1992), the best radio window to observe radio emission as close as possible to the central black hole is in the range 50-250 GHz.
| Start NOEMA observation | NOEMA Exposure | Start NuSTAR observation | NuSTAR exposure | |
| (MJD) | (h) | (MJD) | (ks on source) | |
| 59566.708333 | 13.15 | 59566.688298 | 25 |
Equation 1 shows that for sources dominated by self-absorbed synchrotron emission with radio flux density at 100 GHz in the range of 1-10 mJy and redshift of 0.02 (which is the one of MCG+08-11-11), the size of the radio photosphere is of the order of cm (1-100 hours light crossing time). This corresponds to gravitational radii for a supermassive black hole of (see Fig. 8 with the contour plot of the radio flux density in the plane). These sizes are close to the estimated size of the X-ray emitting region in RQ AGN, the so-called hot corona, a plasma of hot electrons at a temperature of kT100 keV estimated from hard X-ray spectra (e.g. Perola et al. 2002; Fabian et al. 2015, 2017; Tortosa et al. 2018; Akylas & Georgantopoulos 2021).
Variability of the mm emission (on day timescale) already supports the small ( light day) size of (part of) the mm radio emitting region (e.g., Doi et al. 2011).
The similar inter-day variability parameters detected at 100 GHz and in X-rays in the RQ AGN NGC 7469 adds even more to the evidence that the mm and X-ray emission may have the same physical origin, and could be both associated with the hot corona (Baldi et al., 2015; Behar et al., 2020). Actual inter-day temporal correlation between radio and X-ray light curves, however, is much harder to substantiate (Panessa et al., 2022; Chen et al., 2022), mostly due to radio photometric stability over weeks and months.
Here, we introduce a novel approach to catch intra-day variability in RQ AGN simultaneously in X-ray and mm-waves. Indeed, the dramatic X-ray variability on short time scales known to exist in RQ objects should definitely help to look for correlated variability and to properly test the physical connection between the two bands. We present in this paper the result of the simultaneous NOEMA/NuSTAR campaign on the RQ AGN MCG+08-11-11, the main result of this paper being the detection, for the very first time, of fast intraday variability in, and simultaneous increase between, the mm and X-ray bands.
2 Target selection and observation strategy
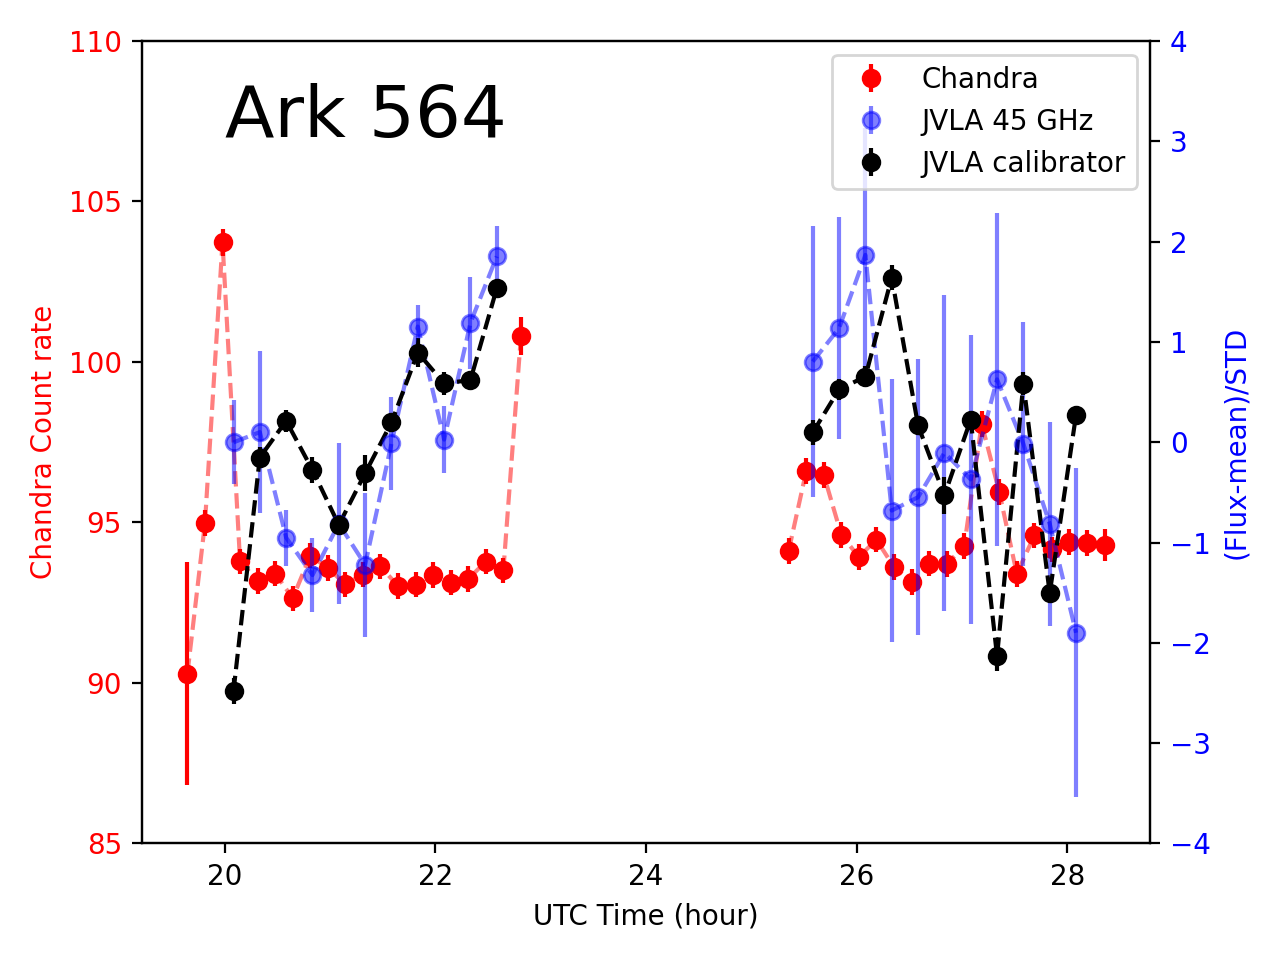
For this project we selected bright X-ray AGN that are also bright (5-10 mJy) in the mm range, show short (1h) time scale variability in X-rays and are visible by NOEMA. Our two first targets were NGC 7469 and NGC 5506 that were observed in X-rays with XMM-Newton. Their unsuccessful campaigns are presented in the Appendix, where we also show a similar failed attempt with the JVLA and Chandra for Ark 564.
The observations of MCG+08-11-11 (z=0.02) benefited from this experience and are the subject of this letter. MCG+08-11-11 is a well known and bright X-ray RQ AGN with a supermassive black hole mass of (e.g. Bentz & Katz (2015a) and references therein). It is among the few RQ AGN that have been observed at mm wavelengths with the ATCA and CARMA telescope arrays (Behar et al., 2015, 2018). It is bright (5-10 mJy) at 95 GHz, it shows short (1h) time scale variability in X-rays with variations of 20% in a few hours (e.g. Matsumoto et al. 2006) and it was visible by NuSTAR and NOEMA for more than 12 hours at night at the beginning of the NOEMA winter period (December).
The log of the observations is reported in Table 1. The NOEMA/NuSTAR observations of MCG+08-11-11 lasted 13h and were performed during the winter night 18-19 of December 2021. The details of the data reduction of both instruments are presented in Sect. A of the Appendix.
3 Results
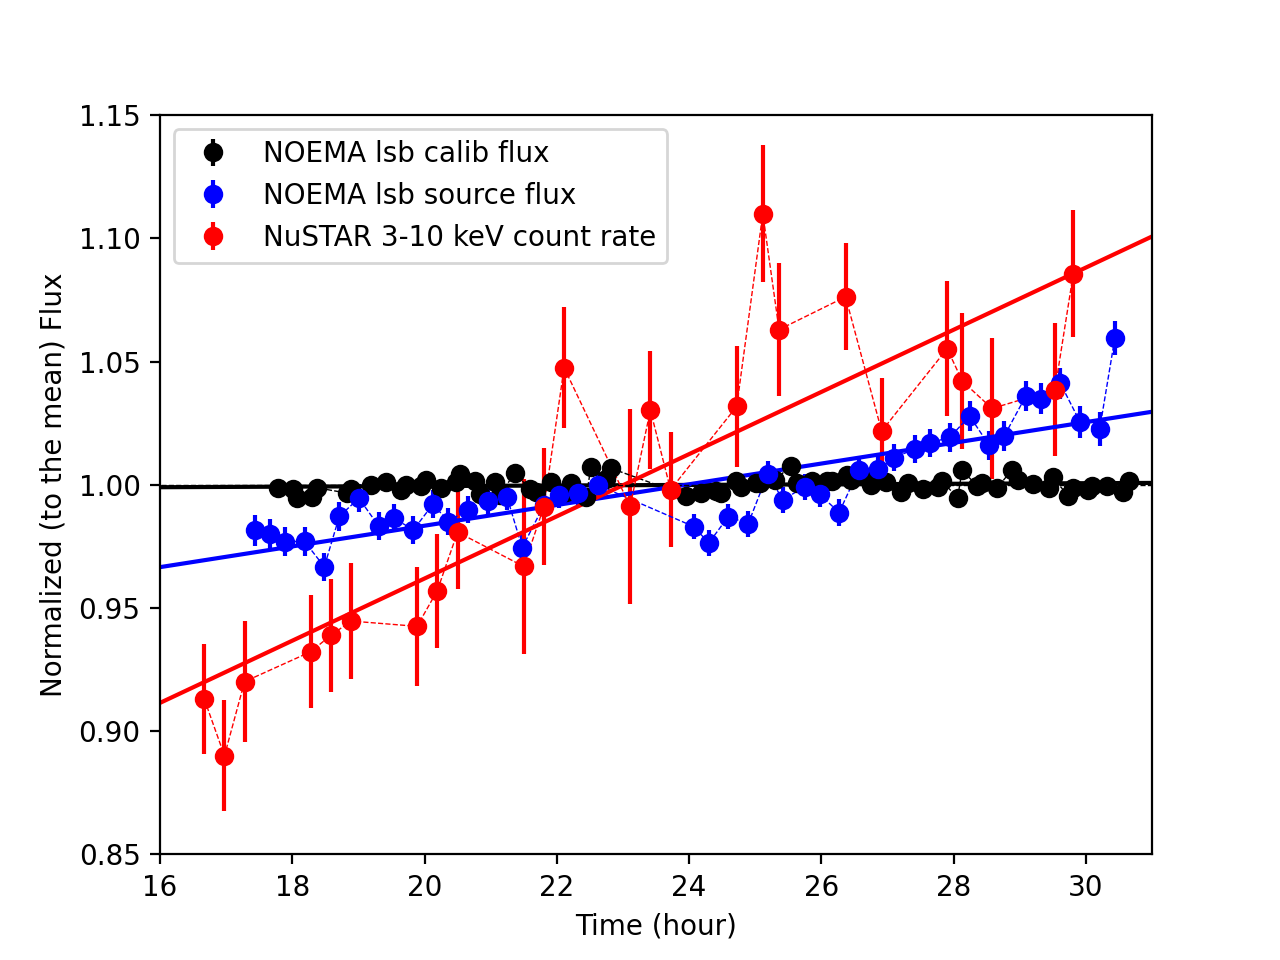
The light curves, normalised to their mean, of the NOEMA LSB flux density at 100 GHz and the NuSTAR 3-10 keV X-ray count rate of MCG+08-11-11 are reported in Fig. 1 in blue and red respectively. The NOEMA and NuSTAR time bins are of the order of 20 minutes. The NuSTAR and NOEMA normalised light curves clearly increase during the observations (even taking into account the small residual variability found in the calibrator, see Sect. A.1.2), while the one of the NOEMA calibrator remains constant. This is confirmed by linear fits of each normalised data sets with best fit values for the line slope equal to hour-1 and hour-1 for the NOEMA LSB and NuSTAR respectively. Both slopes are positive and significantly different from 0. This confirms the variability of the source in the two bands. This is the first time that mm variability on hour timescales is observed in a RQ AGN.
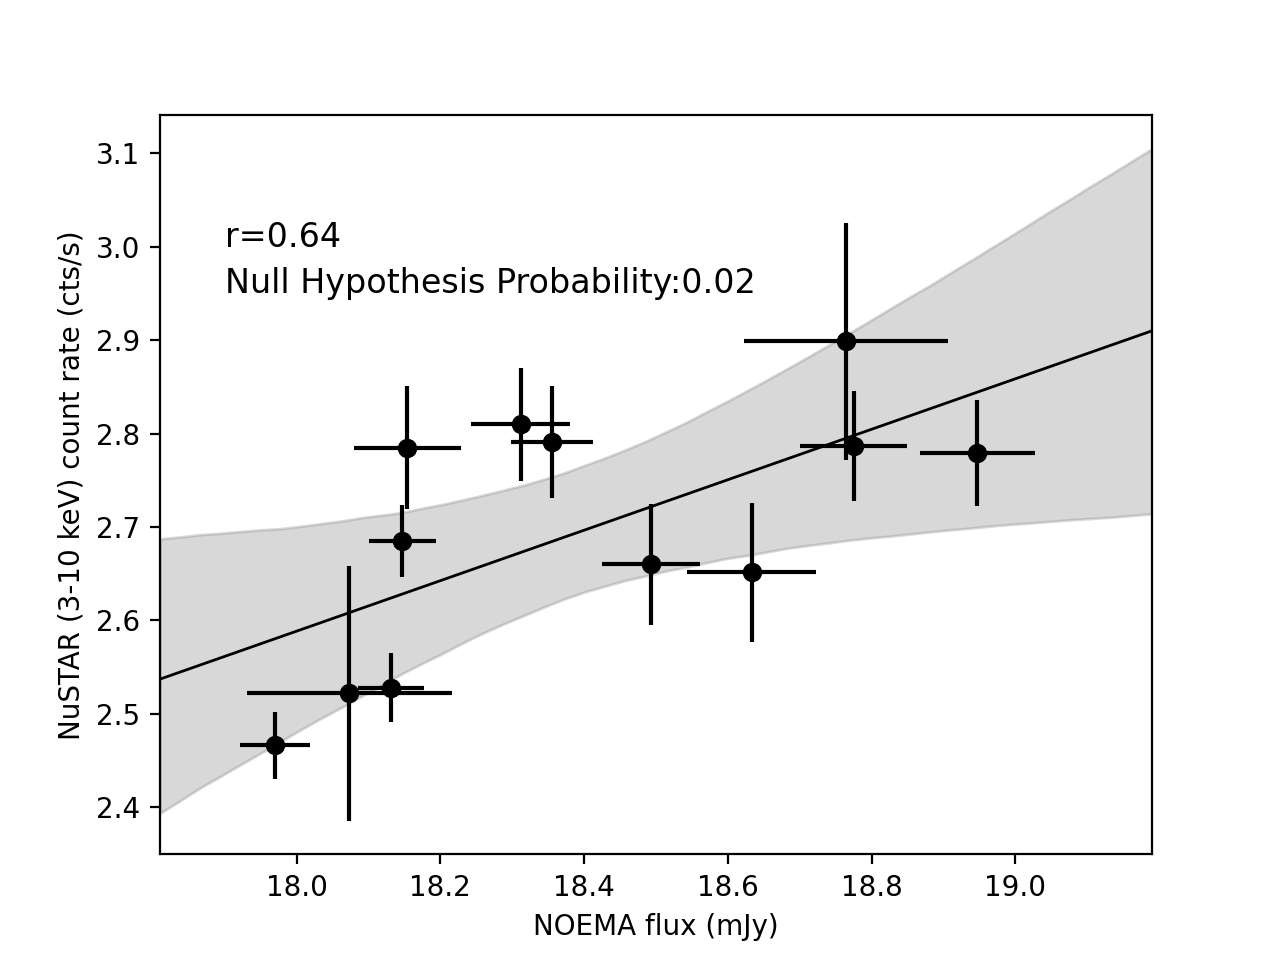
Moreover, the fact that we detect the same variability behaviour (both mm and X-ray emission are increasing during the observation) is remarkable on such short timescales. We apply the classical Spearman’s rank correlation test on the mm and X-ray light curves. To do so, we need to take into account the gaps in the NuSTAR and NOEMA light curves and defined time zones where both instruments observed simultaneously (see Fig. 6). Then we computed the weighted mean of the mm and X-ray light curves in these time zones. These weighted mean fluxes are reported in Fig. 2. We find a Spearman correlation coefficient and its corresponding p-value of 0.02 indicating a quite strong correlation. The trueness of the causality between the two wavebands is admittedly questionable however given the short time interval on which the increasing trend is observed. We also searched for lags between the different light curves using the PyCCF333https://bitbucket.org/cgrier/python_ccf_code/src/master/ python code (Peterson et al., 1998; Sun et al., 2018). However this search was inconclusive with a flat cross-correlation function and a lag consistent with 0.
| (cts s-1) | (cts s-1) | (per cent) | (mJy) | (mJy) | (per cent) | (mJy) | (mJy) | (per cent) |
| 2.770.01 | 0.77 | 7.01.5 | 18.330.02 | 0.4 | 2.00.1 | 692.30.1 | 2.1 | 0.290.01 |
3.1 Variability estimates
To better quantify the variability of the light curves, and following Behar et al. (2020), we have reported in Tab. 2 the weighted mean 2-10 keV count rates (combining the two NuSTAR detectors), , the weighted mean mm flux densities, , with their errors (including 0.3% of systematics, see Sect. A.1.2) and their respective standard deviation and . We have also computed the fractional variability amplitudes:
| (3) |
where and are the mean of the squared of the flux errors. The error on the fractional variabilities, and , are given in Eq. 2 of Behar et al. (2020) and they have been also reported in Tab. 2. For comparison, we have also reported in this table the weighted mean flux density with its error, the respective standard deviation and the fractional variability amplitude with its error for the NOEMA calibrator.
The value of shows that the NOEMA photometric accuracy is much better than 1% during this observation. In comparison the fractional variability amplitude of the source at 100 GHz, , confirms intraday variability of a RQ AGN at mm wavelength. A few NOEMA data points even suggest variability on hour timescale. This corresponds, in term of light travel time, to a size of tens of for a black hole. This indicates that at least a few percent of the mm emission of the source is coming from such small regions. On the other hand, while the increasing trend all along the monitoring looks stronger in X-rays than in the mm, the 3-10 keV fractional variability amplitude of the source is of about 7%, due to the larger X-ray error bars.

3.2 Structure function
An interesting method to better quantify time variability when we have a quite small number of measurements (limiting the use of standard Fourier analysis) is via a structure function (SF) analysis (e.g. Simonetti et al. 1985; Hughes et al. 1992; Gliozzi et al. 2001). The shape and extrema of the structure function can indeed reveal the range of time scales that contribute to the variations in the data set (see, e.g., Paltani 1999). There are different definitions of the structure function in the literature (e.g., Simonetti et al. 1985; Hughes et al. 1992; di Clemente et al. 1996; Vagnetti et al. 2011; Middei et al. 2017). We have chosen the following one (we have checked that the results do not depend qualitatively on the structure function expression):
| (4) |
where and are two measures of the flux, is the time lag between these two flux measurements and the means that an average is computed within an appropriate bin of time lag around . The term is the quadratic contribution of the photometric noise to the observed variations. The computation of the errors of the structure function are detailed in Sect. E.
The structure functions of the NuSTAR and NOEMA light curves of MCG+08-11-11 are reported in Fig. 3. The structure function of the light curve of the NOEMA calibrator is also reported at the top of this figure. The linear (in log space) best fit of the structure functions are over-plotted in black solid line and the corresponding slope is indicated on each plot. In the case of the NOEMA calibrator, the slope of the structure function is consistent with 0, with an average variability fraction of less than 0.5% on the whole range of time lags explored. The slope is however significantly different from 0 for the NuSTAR and NOEMA light curves. In the case of NuSTAR, the significance is just above 3 (due to the large error bars) while it is for NOEMA.
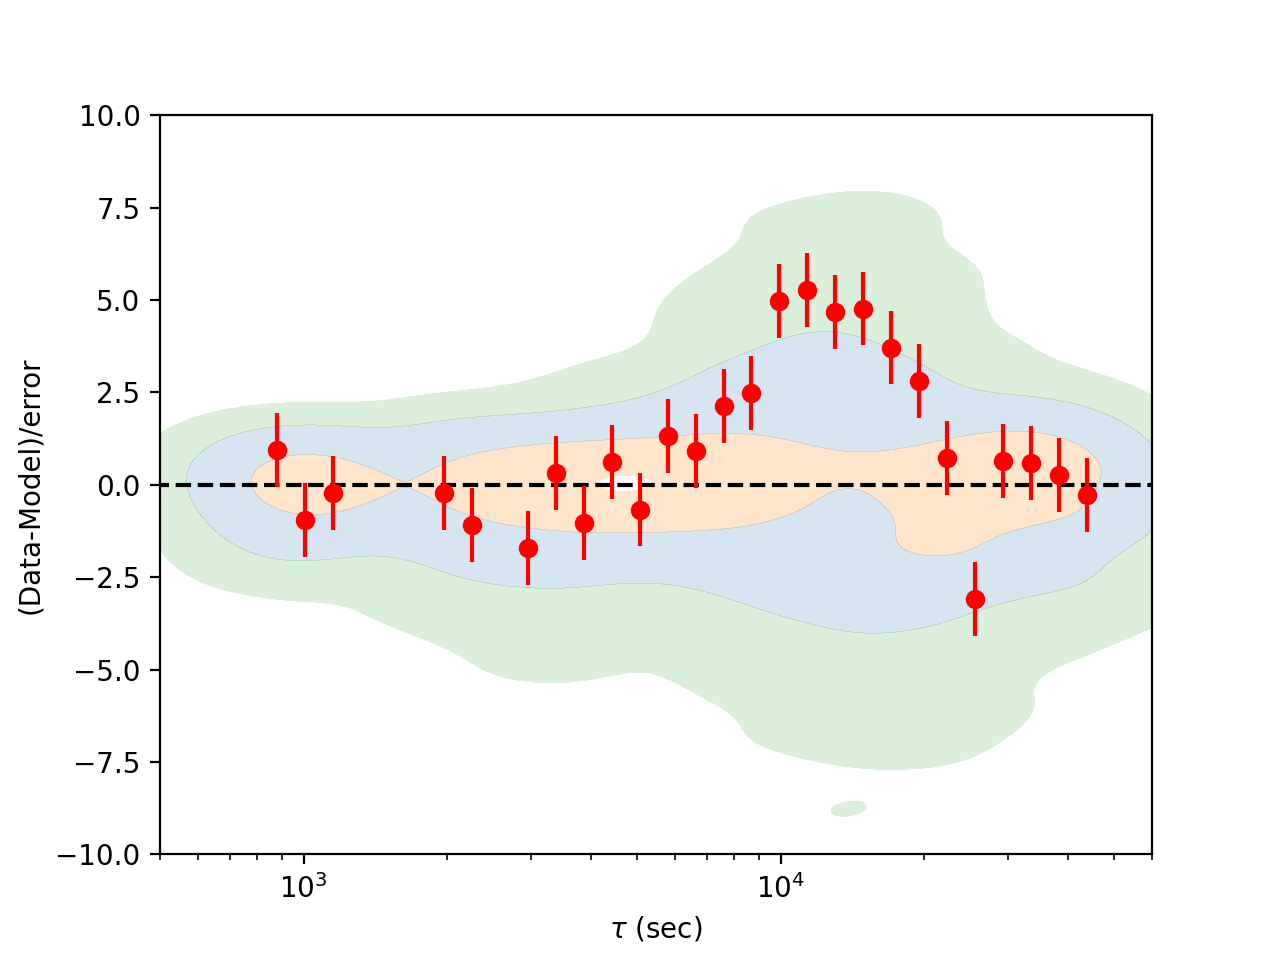
More interestingly, we observe a local maximum of the NOEMA structure function around 2 s (indicated by the vertical doted line in Fig. 3) suggesting a typical variability timescale of a similar order. To make this local maximum more apparent, we have reported in red points in Fig. 5 the ratio between the NOEMA SF and its cubic polynomial best fit (reported in black dashed line in the middle plot of Fig. 3) obtained by ignoring the SF point in the time lag range [] seconds.
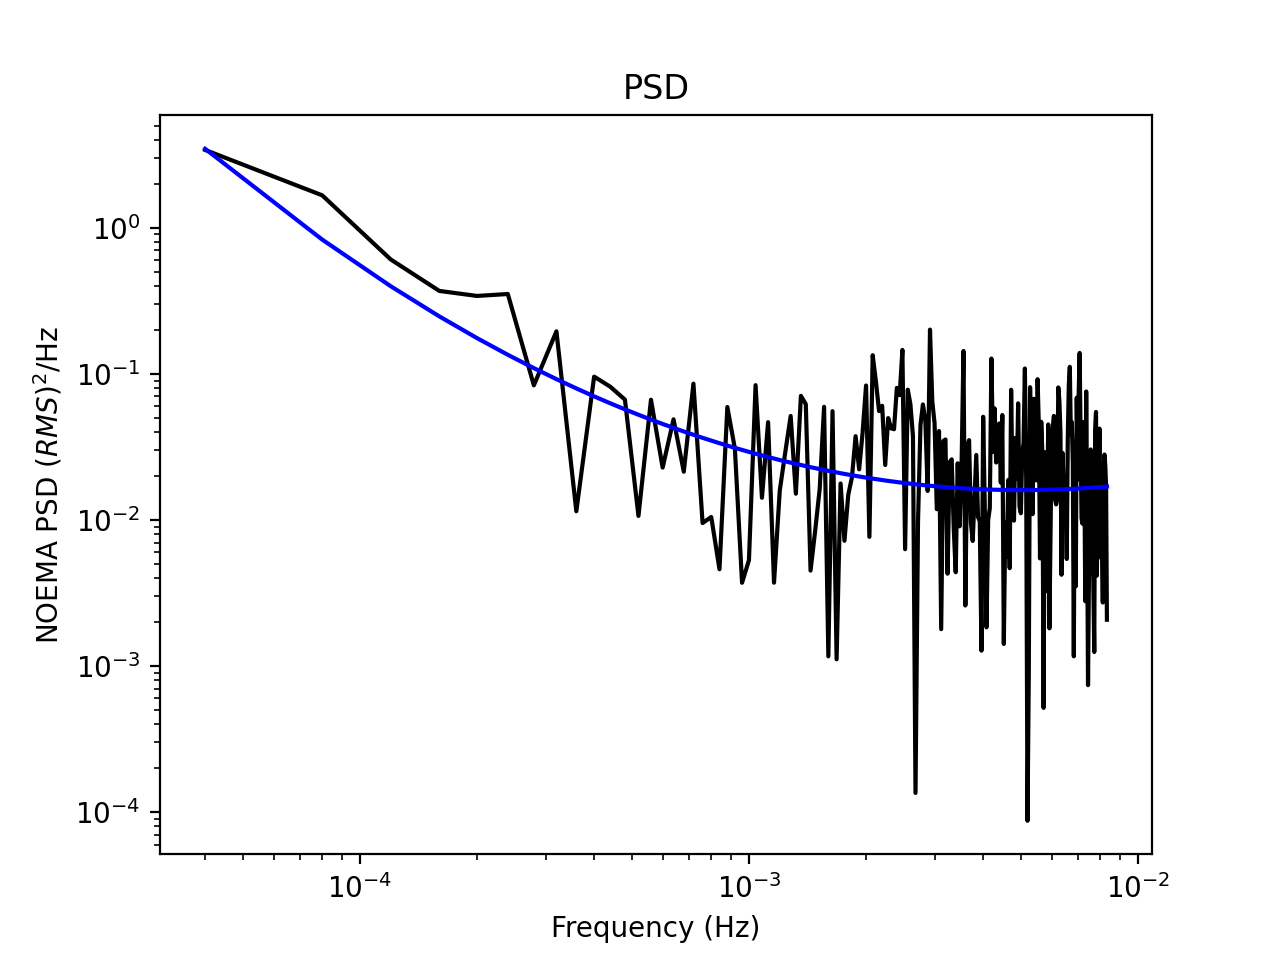
We tried different tests to check the pertinence of this timescale in the NOEMA data. We first performed a Fourier analysis anyway. We computed the Power Spectral Density (PSD) of the NOEMA light curve using the astrophysical spectral-timing Python software package Stingray v1.1.2555https://docs.stingray.science/index.html (Huppenkothen et al., 2019, 2019). We used the AveragedPowerspectrum class adapted to not-regularly-sampled light curves. It is reported in Fig. 4. The PSD statistics is quite poor at low frequency (which corresponds to the SF peak). This is expected since it is very close to the lowest possible frequency of the light curve. We do not detect any excess that would be the counterpart of the local maximum detected in the SF.
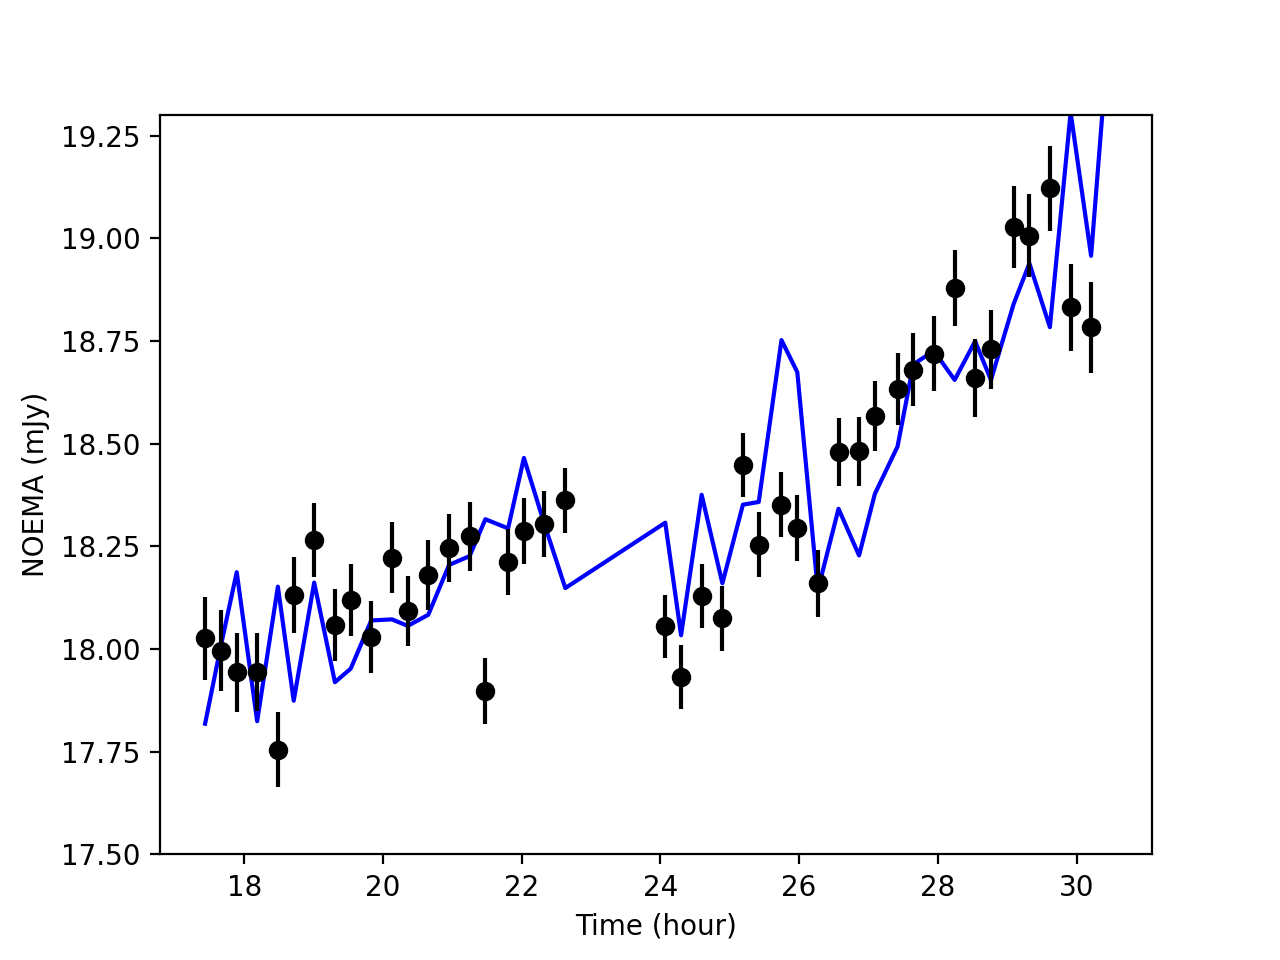
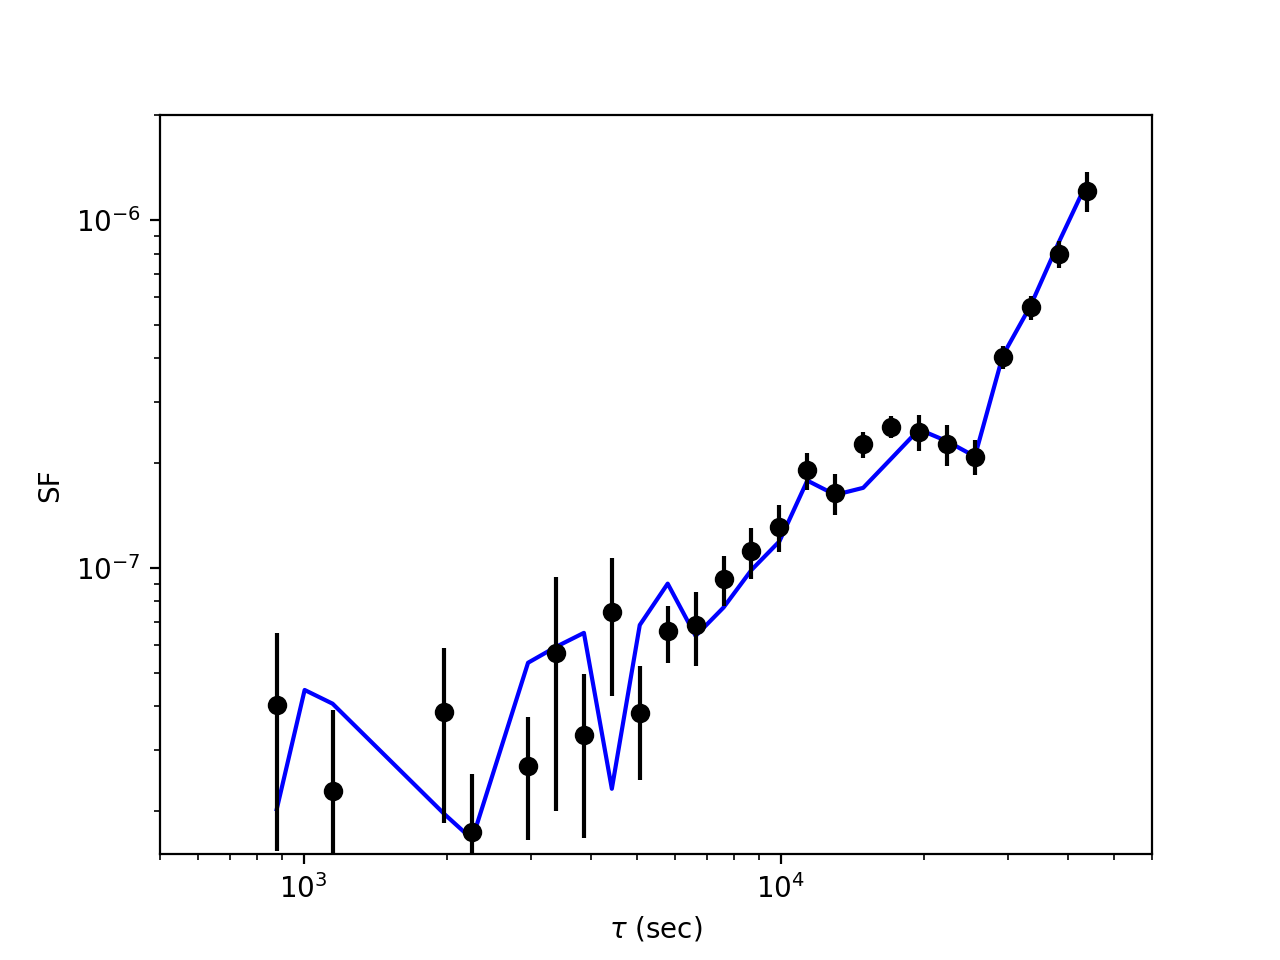
Estimating the significance of such feature in a SF is not straightforward. We thus tried to reproduce such a local maximum via simulations. For that purpose we generated NOEMA light curves using the quadratic (in log scale) best fit of the PSD of the observed data (reported in blue in Fig. 4). This quadratic best fit was used as the PSD input to the light curve simulator python package pyLCSIM666https://pabell.github.io/pylcsim/html/code.html (Campana, 2017). The phases being generated randomly in the process, most of the simulated light curves do not behaves like the observed one. Thus we selected the simulated light curves which are at less than 5 from the observed one. For each of these selected simulated light curves we produced the corresponding SF following the procedure applied to the real data. An example of a simulated light curve and the associated SF are plotted in Fig. 7 with the observed ones for comparison. Then we computed the ratio between the simulated SF and its best fit cubic polynomial. The orange, blue and green areas reported in Fig. 5 correspond to the 50%, 90% and 99% percentile of the distribution of these simulated ratios. The observed local maximum peaks above the 90% contour meaning that a similar maximum is reproduced in less than 10% of the simulated SF. While this is by no mean an estimate of the significance of the observed peak (longer observations would be necessary for that), our procedure shows that this is not a generic feature which can be easily reproduced.
Assuming then this peak is real, for the BH mass of MCG+08-11-11, its timescale corresponds to a light crossing time of 100-300 . The value of the mm SF at this peak corresponds to an average variability fraction of about 2.5%. Assuming the mm emission is optically thick, the variation of the observed flux is then related to the variation of the surface of the emitting region, i.e., to the squared of its typical size. An upper limit of this typical size can then be estimated assuming the emitting surface is homogeneous. Then 100% variation of its flux would correspond to total emitting surface which is a factor 6-7 larger in radius. This puts the upper limit of the mm emitting region typical size of the order of 1300 .
This is about the accretion disk to BLR scales, i.e., significantly larger than the size of the hot corona as deduced by, e.g., micro-lensing (e.g., Morgan et al. 2010; Chartas et al. 2016). Despite this difference in size, our results suggest that the two emitting regions are connected one with each other, indicating that the mm radio emitting region could be an extension of the hot corona, like an outflow/weak jet (see the discussion in Panessa et al. 2019). Such outflow components are indeed expected as soon as a poloidal magnetic field component is present in the accretion flow (e.g., Beckwith et al. 2008).
In this respect, using Eq. 2 the upper limit in size translates in an upper limit of the magnetic field of a few Gauss for the radio flux density of 18 mJy observed for MCG+08-11-11. This is an admittedly fairly loose constraint but this magnetic field strength is of the order to the one expected at a distance of 1300 for a magnetic field distribution which starts around a few in equipartition with radiation at Eddington luminosity around a supermassive black hole of (e.g., Rees 1984).
It is also worth noting that the mm SF starts to re-increase after this local maximum, with a steeper slope, and with no evidence for flattening in agreement with longer (day) timescale variability observed in mm several RQ AGN (e.g., Doi et al. 2011; Baldi et al. 2015; Behar et al. 2020). In comparison, the NuSTAR structure function is rather flat down to the smallest time lags ( sec), without apparent peculiar timescale, and with a variability fraction of about 4% on the whole range of time lags explored.
4 Concluding remarks
We report in this letter the results of a strictly simultaneous NOEMA/NuSTAR observation of 10 hr of the RQ AGN MCG+08-11-11. For the very first time we observe intraday (a few hours) variability of a few percent of the 100 GHz emission of a RQ AGN. Moreover, the mm and X-ray light curves show a similar increasing trend all along the observation. This fast variability in the mm band and the apparent correlation with the X-rays clearly suggest a strong physical link between the two emitting regions.
A structure function analysis suggests a typical mm-wave variability of 2-3% on a timescale around seconds, which translates in an upper limit of the size of the emitting regions 1300 . These results indicate that the mm radio emitting region could be an extension of the hot corona, like an outflow/weak jet.
New mm-X-ray observations are needed to support or rule-out different interpretations, especially if we are able to detect a delay in the mm and X-ray light curves which would put important constraints to study the mm-wave emission mechanism. Along these lines, an XMM/NOEMA campaign on NGC 4051 is expected during Winter 2023-2024.
Acknowledgements.
The strict simultaneity, required between NOEMA and NuSTAR or XMM to be able to catch simultaneous variability in both bands, was perfectly conducted thanks to the efforts of the Science Operation Committee of the different observatories. The results presented in this letter would not have been possible without their precious help. Thanks a lot to all the SOC people of both instruments! Part of this work has been done thanks to the financial supports from CNES and the French PNHE. The Technion group was supported in part by a Center of Excellence of the Israel Science Foundation (grant No. 1937/19). The scientific results reported in this article are based on observations with the XMM-Newton and NuSTAR satellites and NOEMA ground based telescopes. This work is based on observations carried out under project numbers S21BI and W21BU with the IRAM NOEMA Interferometer. IRAM is supported by INSU/CNRS (France), MPG (Germany) and IGN (Spain).Appendix A Observation and Data reduction
A.1 NOEMA
A.1.1 Observation
The weather conditions for the NOEMA observation were excellent, with less than 1mm of precipitable water vapor. The phase stability was excellent with less than 15∘ r.m.s. We used 3C454.3 for the bandpass calibration, and MWC349 for the flux calibration. Amplitude and phase calibrator was 0538+498, only 4 degrees away from MGC+08-11-11. Compared to standard NOEMA projects, we used a shortened calibration cycle of 13min to better track instrumental and weather variations.
The source was observed from 17.3h UT, 18 December 2021 to 06.5h UT, 19 December 2021 with a 1.2h gap when the source transits at high local elevation and is impossible to track. Data were reduced using the standard NOEMA pipeline. At the time of observation, a slight non-closure problem was affecting NOEMA, so baseline-based amplitude calibration was used. Any residual amplitude gain error due to the distance between calibrator and source is estimated to be .
The data were then exported in uv tables in small time chunks (separately for lower sideband (LSB) and upper sideband (USB)). Each uv table corresponding to one time step was then self-calibrated in phase, and a circular gaussian was fitted to the data in the (u,v) plane. The fitted fluxes and associated errors are then used to produce a light-curve.
A.1.2 Calibration
The NOEMA calibrator light curve, with a time bin of 10 minutes and normalised to its mean flux, is reported in black in Fig. 1. A linear fit gives a best fit value for the slope of hour-1, i.e. almost consistent with 0 (at 1 ), as expected for constant flux. The linear best fit is reported with a black solid line in Fig. 1. The result of a fit by a constant value (chi2/dof=1604/70) indicates however that some variability is not captured in the error bars. This is expected since the errors are computed from the thermal noise of the antenna and do not include their variations in gain. The standard deviation of the calibrator light curve allows us to estimate the systematic error related to this variation in gain. It is equal to 0.3% (see Tab. 2). It is then included in the total error of the NOEMA light curve (quadratically added to the thermal noise error) of the source.
A.2 NuSTAR
We calibrate and clean raw NuSTAR (Harrison et al., 2013) data of MCG+08-11-11 using the NuSTAR Data Analysis Software (NuSTARDAS777see http://heasarc.gsfc.nasa.gov/docs/nustar/analysis/nustar_swguide.pdf package v. 2.1.1). Level 2 cleaned data products were obtained with the standard nupipeline task while 3rd level science products (spectra and light curves) were computed with the nuproducts pipeline and using the calibration database 20211202. A circular region with a radius of 50 arcsec centred on a blank area nearby the source was used to estimate the background. The extraction region for the source was selected using an iterative process that maximises the S/N similarly to what is described in Piconcelli et al. (2004). While we are mainly interested in the variability aspects in this paper, we had a quick look at the spectra. A simultaneous fit of the A and B module spectra in the 3-78 keV energy range with a cut-off power law + reflection component (wabs*(cutoffpl+xillver) in xspec) gives a reasonable fit with /dof=3647/3743 corresponding to a Null hypothesis probability of 0.9. The best fit parameters are a power-law photon index , a cutoff energy keV and a reflection parameter . A more detailed spectral analysis will be done in a following paper. The present fit enables us to estimate the 2-10 keV luminosity (assuming ) of erg s-1, and the corresponding bolometric luminosity (applying a X-ray bolometric correction factor based on the empirical relation computed by Duras et al. 2020) of erg s-1, i.e., 15% of the Eddington luminosity for a BH of .
Appendix B Good time interval for correlation analysis
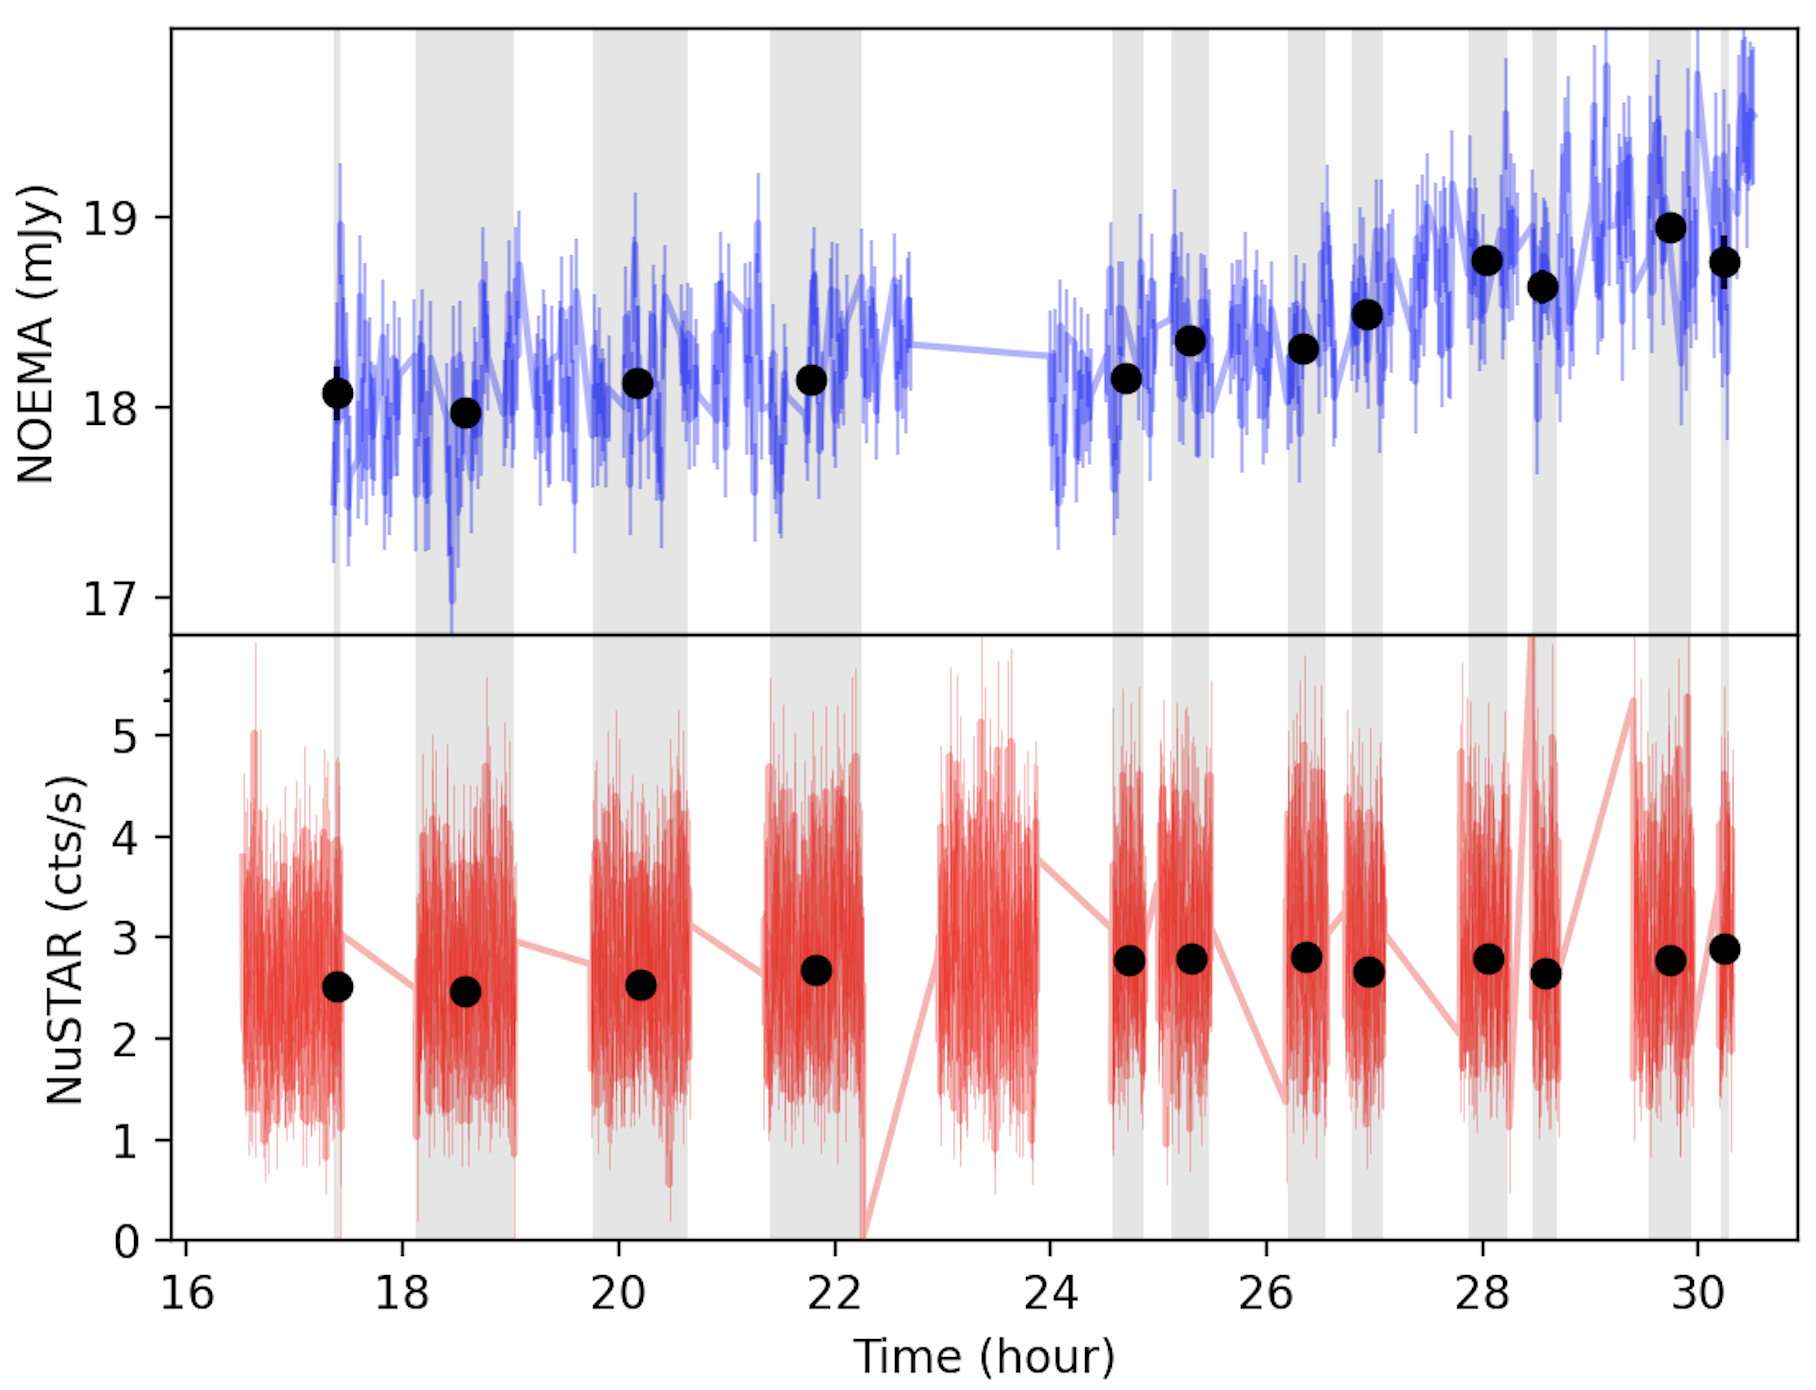
The light curves of NOEMA and NuSTAR, with a time binning of 60 and 6 sec respectively, are reported on top and bottom of Fig. 6. The gaps in the NuSTAR light curve correspond to the time when the satellite was not acquiring valid data due to, e.g., Earth occultation or SAA passages. The gap in the middle of the NOEMA observation is when the source transited at high local elevation and was impossible to track.
The grey area on Fig. 6 correspond to the time zones where both NOEMA and NuSTAR data are acquired. The black points correspond to the weighted mean of each light curve in the different time zones. These weighted mean values have been used for the Spearman’s rank correlation test discussed in Sect. 3.
Appendix C Simulated light curve and Structure function
We have reported in Fig. 7 an example of a simulated NOEMA light curve (top) and its corresponding Structure Function (bottom). The simulation procedure is explained in Sect. 3.2.
Appendix D The plane
The contour plot of the radio flux density in the plane is shown in Fig. 8. It results from Eq. 1 and 2 assuming a redshift of 0.02 (which is the one of MCG+08-11-11) and for a frequency of 100 GHz (which corresponds to the frequency of our NOEMA observation). The scaling in term of is indicated by the right y-scale of Fig. 8.

Appendix E Structure function Errors
The errors on the Structure Function have been estimated by simulating light curves from the observed ones. For that purpose, we have simulated light curves with the same number of data points than the observed ones, each data point being randomly distributed in a normal distribution centred on the observed flux and with a standard deviation equal to the observed photometric error. For each simulated light curve, we have computed the corresponding structure function SF ( between 1 and ). Then we deduced the structure function error at each from the standard deviation of the measurements. A number 10 (we took 30) is generally sufficient to have a good error estimate of the structure function for the range of covered by our observed light curves.
Appendix F Previous tentatives
The unsuccessful campaigns on NGC 5506, NGC 7469, and Ark 564 are described below, were crucial for the development of this project. In addition to learning the best observing strategy for a successful campaign, we validated that with good weather conditions it was possible to reach a sensitivity of 12.5 Jy/beam at 100 GHz, allowing us to catch a few % variability for mJy sources.
F.1 NGC 5506
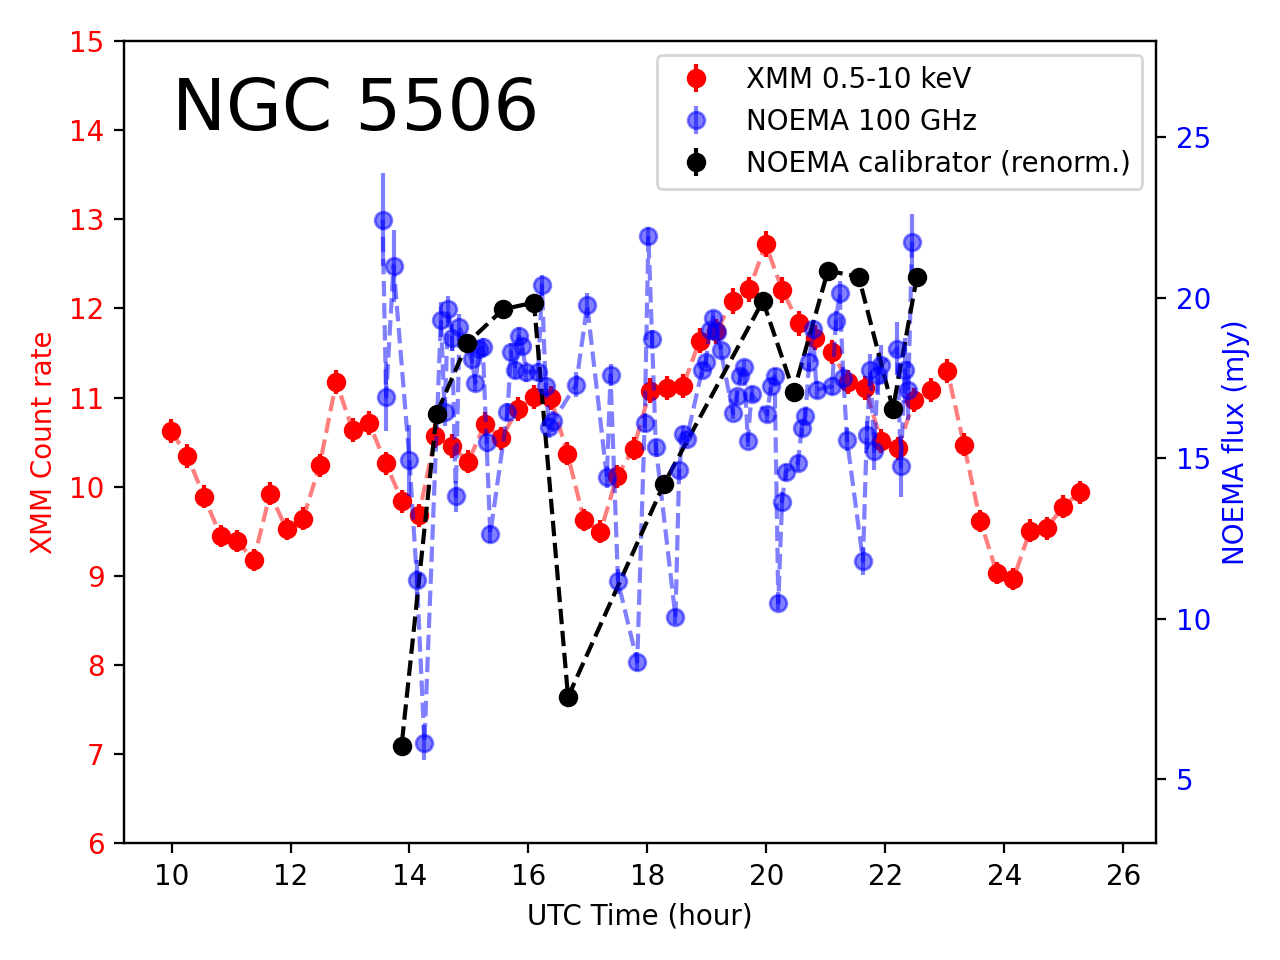
NGC 5506 (=0.006, poorly known in between , e.g. Matt et al. 2015) was well detected by NOEMA at a few mJy. However, to fit with the XMM visibility window the observation had to be conducted during the summer. The weather conditions were very bad at the NOEMA site, preventing any good estimate of the mm variability, while clear X-ray variability occured during all the XMM pointing (see Fig. 9). We have reported the light curve of the NOEMA calibrator in black in this figure. This observation demonstrates that to reach the conditions to detect weak ( 5-10 %) variability in the mm on hour timescale, the summer seasons has to be avoided.
Appendix G NGC 7469
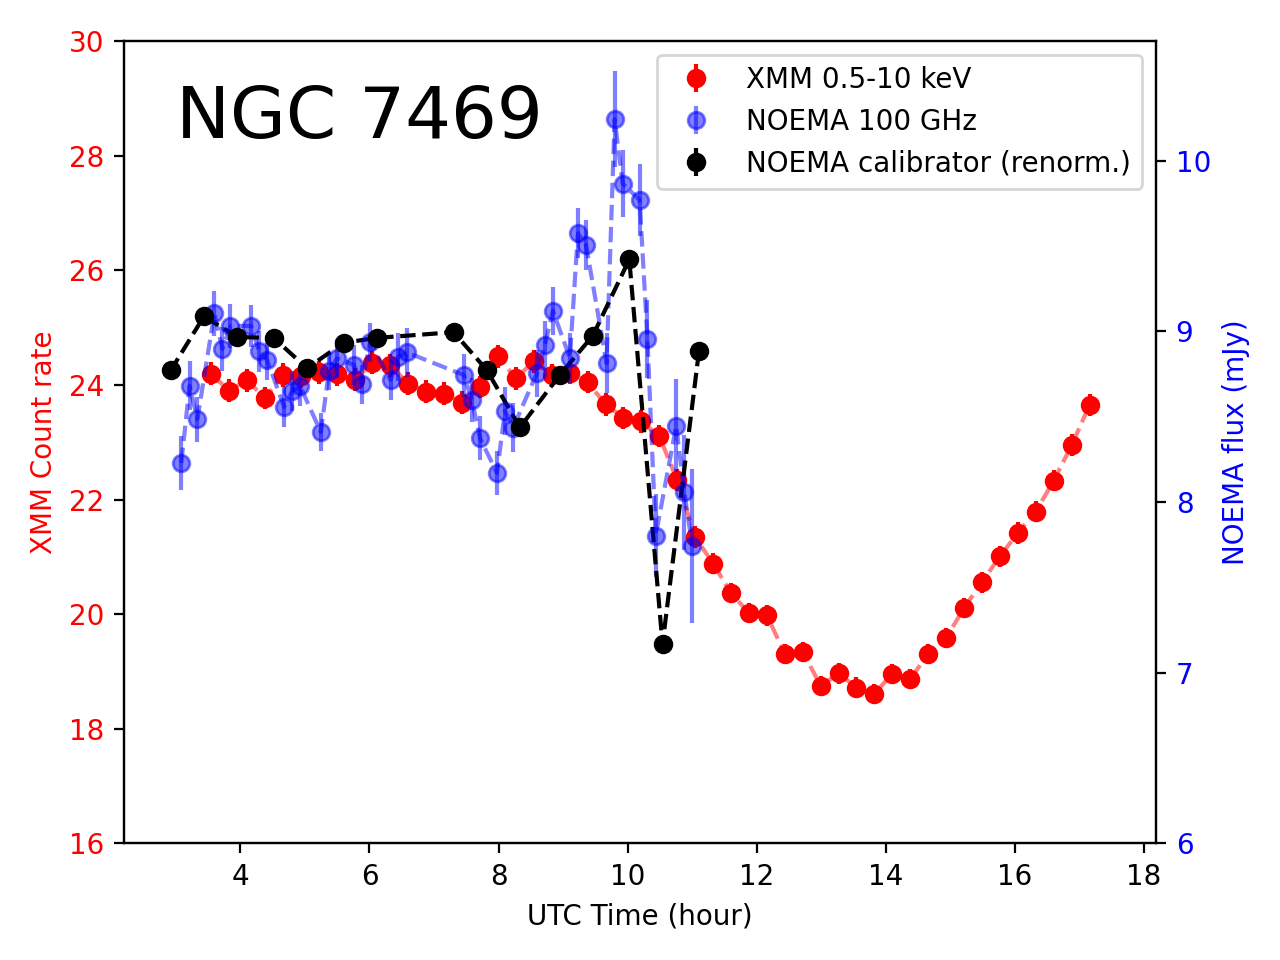
NGC 7469 (=0.016, , e.g. Peterson et al. 2014; Bentz & Katz 2015b) was also well detected by NOEMA at a few mJy. The weather was good at the NOEMA site. The NOEMA pointing lasted about 8 hours, as expected, while the XMM one, which cover entirely the NOEMA observation, was almost twice longer. However the source stayed almost constant in X-ray during all the NOEMA coverage, its X-ray flux starting to significantly vary (after 8-9h UTC) when the lower source elevation and sunrise induce large amplitude gain variations at NOEMA (see Fig. 10). These large amplitude gain variations produce variation in the light curve of the calibrator overplotted in black in this figure.
Appendix H Ark 564
Ark 564 (=0.024, , e.g., Zhang & Wang 2006) was chosen for a simultaneous X-ray radio campaign seeking intraday variability, due to its documented X-ray variability over hours, and its relatively low BH mass. Chandra/LETG observed Ark 564 in X-rays simultaneously with the JVLA at 45 GHz, for 3+3 hours (gap again due to high sky elevation) on Dec. 20, 2019. At 45 GHz, each observing scan is 4 min on target and 1 min on the phase calibrator. The light curves are shown in Fig 11. Unfortunately, no significant variability can be detected.
References
- Akylas & Georgantopoulos (2021) Akylas, A. & Georgantopoulos, I. 2021, A&A, 655, A60
- Alhosani et al. (2022) Alhosani, A., Gelfand, J. D., Zaw, I., et al. 2022, ApJ, 936, 73
- Baldi et al. (2015) Baldi, R. D., Behar, E., Laor, A., & Horesh, A. 2015, MNRAS, 454, 4277
- Barvainis et al. (1992) Barvainis, R., Antonucci, R., & Coleman, P. 1992, ApJ, 399, L19
- Beckwith et al. (2008) Beckwith, K., Hawley, J. F., & Krolik, J. H. 2008, The Astrophysical Journal, 678, 1180, (c) 2008: The American Astronomical Society
- Behar et al. (2015) Behar, E., Baldi, R. D., Laor, A., et al. 2015, MNRAS, 451, 517
- Behar et al. (2020) Behar, E., Kaspi, S., Paubert, G., et al. 2020, MNRAS, 491, 3523
- Behar et al. (2018) Behar, E., Vogel, S., Baldi, R. D., Smith, K. L., & Mushotzky, R. F. 2018, MNRAS, 478, 399
- Bentz & Katz (2015a) Bentz, M. C. & Katz, S. 2015a, PASP, 127, 67
- Bentz & Katz (2015b) Bentz, M. C. & Katz, S. 2015b, PASP, 127, 67
- Campana (2017) Campana, R. 2017, pyLCSIM: X-ray lightcurves simulator, Astrophysics Source Code Library, record ascl:1708.016
- Chartas et al. (2016) Chartas, G., Rhea, C., Kochanek, C., et al. 2016, Astronomische Nachrichten, 337, 356
- Chen et al. (2022) Chen, S., Laor, A., & Behar, E. 2022, MNRAS, 515, 1723
- Chen et al. (2023) Chen, S., Laor, A., Behar, E., Baldi, R. D., & Gelfand, J. D. 2023, MNRAS[arXiv:2307.13599]
- di Clemente et al. (1996) di Clemente, A., Giallongo, E., Natali, G., Trevese, D., & Vagnetti, F. 1996, ApJ, 463, 466
- Doi et al. (2011) Doi, A., Nakanishi, K., Nagai, H., Kohno, K., & Kameno, S. 2011, AJ, 142, 167
- Duras et al. (2020) Duras, F., Bongiorno, A., Ricci, F., et al. 2020, A&A, 636, A73
- Fabian et al. (2017) Fabian, A. C., Lohfink, A., Belmont, R., Malzac, J., & Coppi, P. 2017, MNRAS, 467, 2566
- Fabian et al. (2015) Fabian, A. C., Lohfink, A., Kara, E., et al. 2015, MNRAS, 451, 4375
- Gliozzi et al. (2001) Gliozzi, M., Brinkmann, W., O’Brien, P. T., et al. 2001, A&A, 365, L128
- Harrison et al. (2013) Harrison, F. A., Craig, W. W., Christensen, F. E., et al. 2013, ApJ, 770, 103
- Hughes et al. (1992) Hughes, P. A., Aller, H. D., & Aller, M. F. 1992, ApJ, 396, 469
- Huppenkothen et al. (2019) Huppenkothen, D., Bachetti, M., Stevens, A., et al. 2019, Journal of Open Source Software, 4, 1393
- Huppenkothen et al. (2019) Huppenkothen, D., Bachetti, M., Stevens, A. L., et al. 2019, ApJ, 881, 39
- Inoue & Doi (2018) Inoue, Y. & Doi, A. 2018, ApJ, 869, 114
- Kawamuro et al. (2022) Kawamuro, T., Ricci, C., Imanishi, M., et al. 2022, ApJ, 938, 87
- Kellermann et al. (1989) Kellermann, K. I., Sramek, R., Schmidt, M., Shaffer, D. B., & Green, R. 1989, AJ, 98, 1195
- Laor & Behar (2008) Laor, A. & Behar, E. 2008, MNRAS, 390, 847
- Matsumoto et al. (2006) Matsumoto, T., Nakazato, T., & Tomisaka, K. 2006, ApJ, 637, L105
- Matt et al. (2015) Matt, G., Baloković, M., Marinucci, A., et al. 2015, MNRAS, 447, 3029
- Middei et al. (2017) Middei, R., Vagnetti, F., Bianchi, S., et al. 2017, A&A, 599, A82
- Morgan et al. (2010) Morgan, C. W., Kochanek, C. S., Morgan, N. D., & Falco, E. E. 2010, ApJ, 712, 1129
- Paltani (1999) Paltani, S. 1999, in Astronomical Society of the Pacific Conference Series, Vol. 159, BL Lac Phenomenon, ed. L. O. Takalo & A. Sillanpää, 293
- Panessa et al. (2019) Panessa, F., Baldi, R. D., Laor, A., et al. 2019, Nature Astronomy, 3, 387
- Panessa et al. (2022) Panessa, F., Chiaraluce, E., Bruni, G., et al. 2022, MNRAS, 515, 473
- Park et al. (2013) Park, S., Sohn, B. W., & Yi, S. K. 2013, A&A, 560, A80
- Perola et al. (2002) Perola, G. C., Matt, G., Cappi, M., et al. 2002, A&A, 389, 802
- Peterson et al. (2014) Peterson, B. M., Grier, C. J., Horne, K., et al. 2014, ApJ, 795, 149
- Peterson et al. (1998) Peterson, B. M., Wanders, I., Horne, K., et al. 1998, PASP, 110, 660
- Piconcelli et al. (2004) Piconcelli, E., Jimenez-Bailón, E., Guainazzi, M., et al. 2004, MNRAS, 351, 161
- Rees (1984) Rees, M. J. 1984, ARA&A, 22, 471
- Simonetti et al. (1985) Simonetti, J. H., Cordes, J. M., & Heeschen, D. S. 1985, ApJ, 296, 46
- Sun et al. (2018) Sun, M., Grier, C. J., & Peterson, B. M. 2018, PyCCF: Python Cross Correlation Function for reverberation mapping studies, Astrophysics Source Code Library, record ascl:1805.032
- Terashima & Wilson (2003) Terashima, Y. & Wilson, A. S. 2003, ApJ, 583, 145
- Tortosa et al. (2018) Tortosa, A., Bianchi, S., Marinucci, A., Matt, G., & Petrucci, P. O. 2018, A&A, 614, A37
- Vagnetti et al. (2011) Vagnetti, F., Turriziani, S., & Trevese, D. 2011, A&A, 536, A84
- Zhang & Wang (2006) Zhang, E.-P. & Wang, J.-M. 2006, ApJ, 653, 137