Barless flocculent galaxies: a dynamic puzzle
Abstract
We draw attention to the bright galaxies that do not show a bar in their structure but have a flocculent spiral structure. Using the THINGS’ and HERACLES’ kinematic data for four barless galaxies (NGC 2841, NGC 3512, NGC 5055, NGC 7331) we built their mass models including dark halos. We concluded that the fraction of the dark matter does not exceed 50% within the optical radii of the galaxies. This is too little to explain the lack of a bar in these galaxies. In an attempt to understand the featureless structure of these galaxies we constructed several -body models with an initially reduced content of dark matter. We concluded that, in addition to the low mass of the dark halo, the decisive factor that leads to a barless disc is the start from an initially unstable state. An isolated dynamically cold disc (with the Toomre parameter ) settled into rotational equilibrium passes trough the short stage of violent instability with fragmentation and formation of stellar clumps. After that, it evolves passively and ends up with a featureless structure. We assume that the barless flocculent galaxies studied in the present work may be descendants of galaxies at high redshifts with rotation curves which are consistent with the high mass fraction of baryons relative to the total dark matter halo.
keywords:
galaxies: bar – galaxies: kinematics and dynamics – galaxies: structure1 Introduction
According to observational statistics, up to 60 of disc galaxies possess bars (e.g., Eskridge et al., 2000; Menéndez-Delmestre et al., 2007; Marinova & Jogee, 2007; Barazza et al., 2008; Aguerri et al., 2009). These statistics mean that a bulk of galaxies do not show bars in their structure. Meanwhile, in numerous -body simulations, the bar is an almost inevitable result of the evolution of the galaxy model. Rather specific model parameters are needed to suppress bar formation, at least on a timescale of 8 billion years or more. This can be achieved if a stellar disc is very hot dynamically (e.g., Athanassoula & Sellwood, 1986), or a model has a very compact initial classical bulge (Fujii et al., 2018; Saha et al., 2018; Kataria & Das, 2018), or the disc is embedded in a very massive dark halo (e.g., Ostriker & Peebles, 1973). Some other possibilities are discussed, for example, in Sellwood et al. (2019).
The lack of the bar in some bright galaxies seems mysterious in terms of stellar dynamics. Sellwood et al. (2019), not for the first time, raises the question of the absence of a bar in the M 33 galaxy. The authors provide an -body model of M 33, taking into account its modern observable characteristics (photometric parameters and a rotation curve). In their study, it turned out that for all considered physical constraints, the model is not stable with respect to the bar formation. In only two cases, the authors managed to prevent the formation of a bar in the model. In the first case, it deals with an increase in the random motion of stars (an increase of the Toomre parameter ). However, this solution was rejected as the developing multi-arm spirals in such a model contradict the bi-symmetric spiral pattern, which is observed in the IR range. In the second case, the mass-to-light ratio of the stars was reduced to in solar units, which contradicts the basic stellar population models with . For the basic model, the mass of a dark halo within four radial scales of the stellar disc can be estimated as three disc masses. Bar formation can be suppressed only by doubling it.
We draw attention to bright galaxies that do not show a bar in their structure. Such galaxies have an even lower relative mass of a dark halo than M 33 and look much more puzzling from a dynamic point of view. These galaxies are included in the THINGS survey (Walter et al., 2008) and some of them (e.g. NGC 2841) have rotation curves falling to the periphery, which distinguishes them from most galaxies that have an extended plateau in the rotation curve. We focused on the galaxies NGC 2841, NGC 3521, NGC 5055, and NGC 7331. The analysis of their isophotes in the S4G images (PA and ellipticity profiles) does not show the presence of an oval-like distortion or, at best, demonstrates only faint traces of such a distortion (Salo et al., 2015). In SDSS images galaxies demonstrate only flocculent spirals. The velocity difference between the peak of the rotation curve and the last point can reach 30 km/s–40 km/s, although NGC 7331 rather has a plateau in the rotation curve. The peak is located at about two radial scales of the stellar disc and is associated with the disc rotation curve. Even gently falling rotation curve indirectly indicates a reduced dark matter content in these galaxies, both within the optical radius of the galaxy and within the virial radius of the halo. It should be noted that we consider only massive flocculent galaxies without bar which shows the changing in circular velocity between peak and periphery at least 10%.
The rotation curves of the THINGS galaxies were extracted from spectral data cubes and decomposed in several previous works (de Blok et al., 2008; Katz et al., 2014; Frank et al., 2016; Saburova et al., 2016; Di Teodoro & Peek, 2021; Mancera Piña et al., 2022). Such a large number of decompositions of galaxies according to the same kinematic data is explained by the introduction of additional factors into consideration (the influence of the gas component, especially the molecular gas, the influence of the adiabatic compression of the halo by baryonic matter, additional models of the dark halo, radial motions etc.). In some cases, the decomposition results are close, in some cases they diverge greatly, which is explained by different restrictions that are imposed on the models. We also redid the kinematic analysis using 3DBBarolo (Di Teodoro & Fraternali, 2015). We focused only on galaxies with rotation curves that show signs of falling towards the periphery or, judging by the decomposition given in the literature, show a rotation curve of the stellar disc at the optical radius of the galaxy that lies above the rotation curve associated with the dark halo. One feature of our analysis is that we used S4G photometric models (Salo et al., 2015) and modern calibrations (Querejeta et al., 2015) based directly on 3.6 photometry. We obtained and emphasize it that the relative mass of the dark matter within four radial disc scales is very small (0.5-1.0 of the disc mass). Such a small mass of a dark matter and the lack of bars in these galaxies is strange from the dynamic point of view, and this needs to be explained. In this paper, we provide one of the possible explanations, based on the analysis of several -body models evolving from different initial conditions.
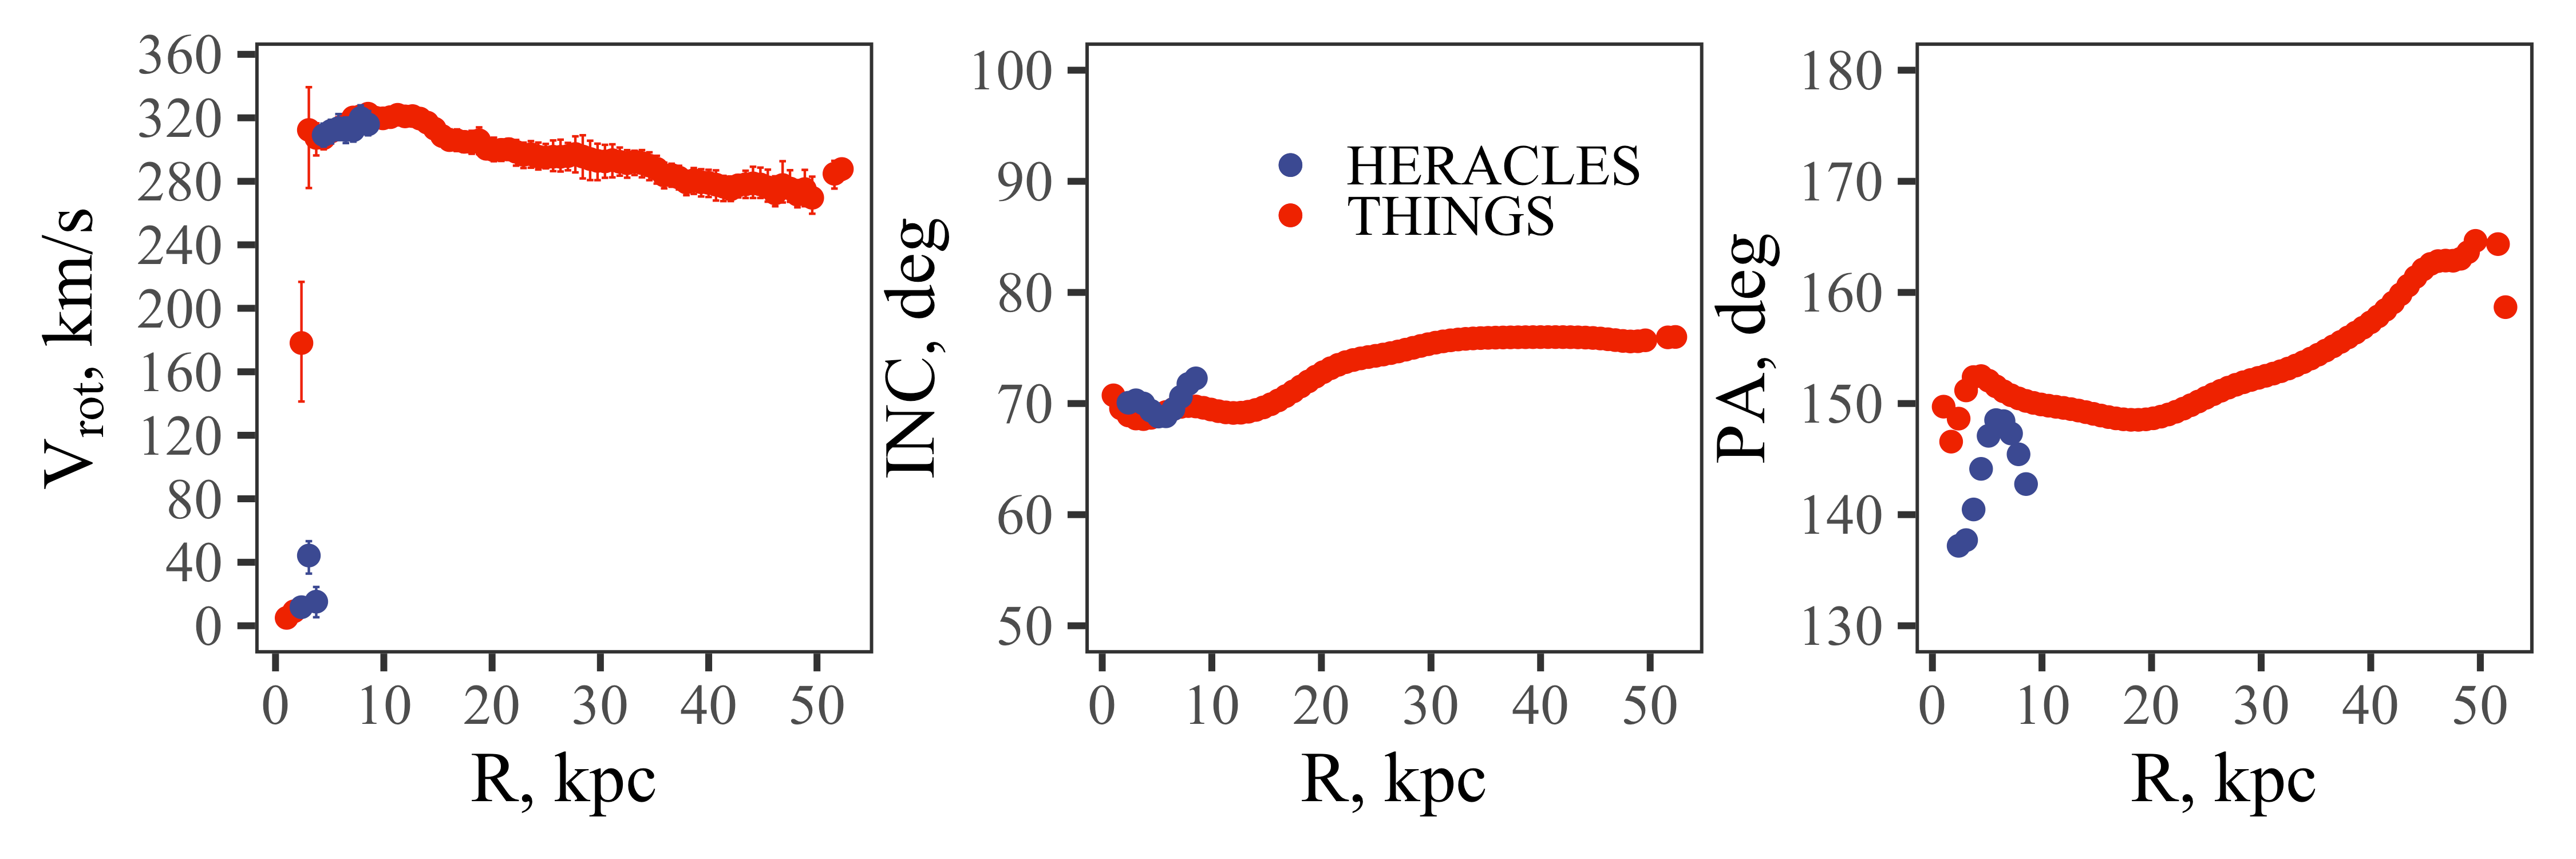
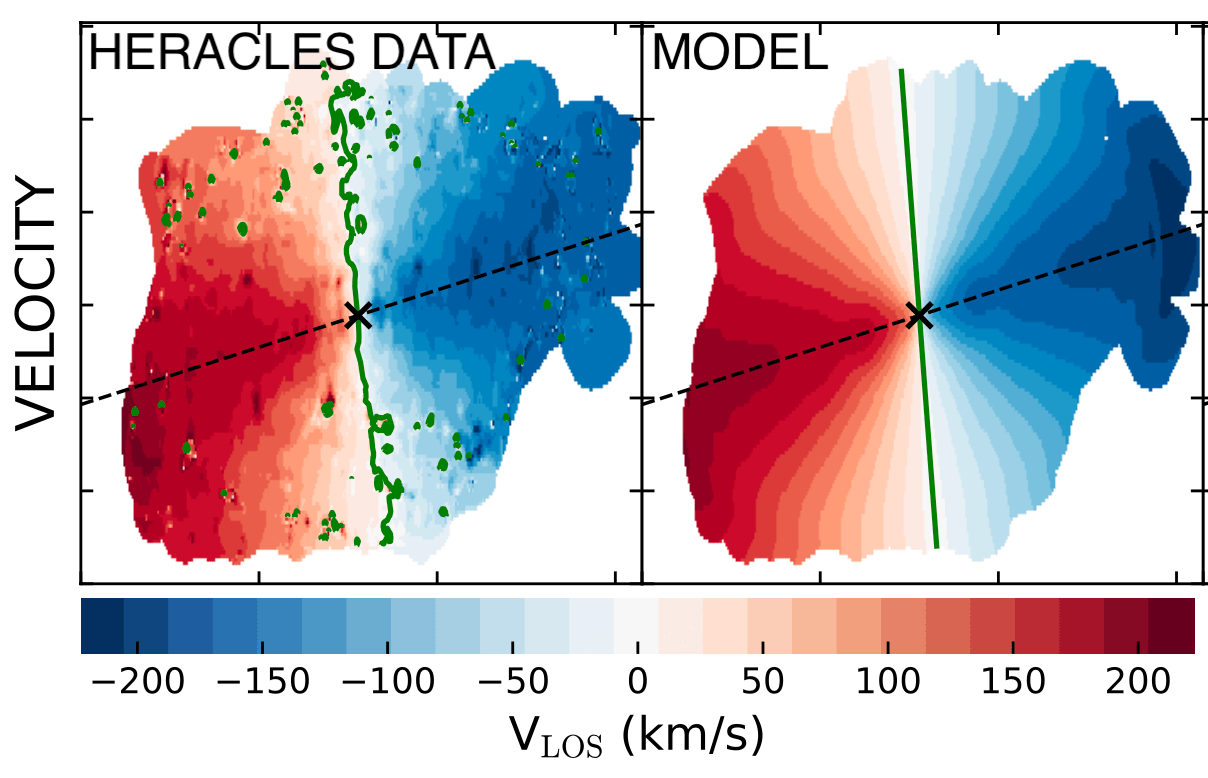
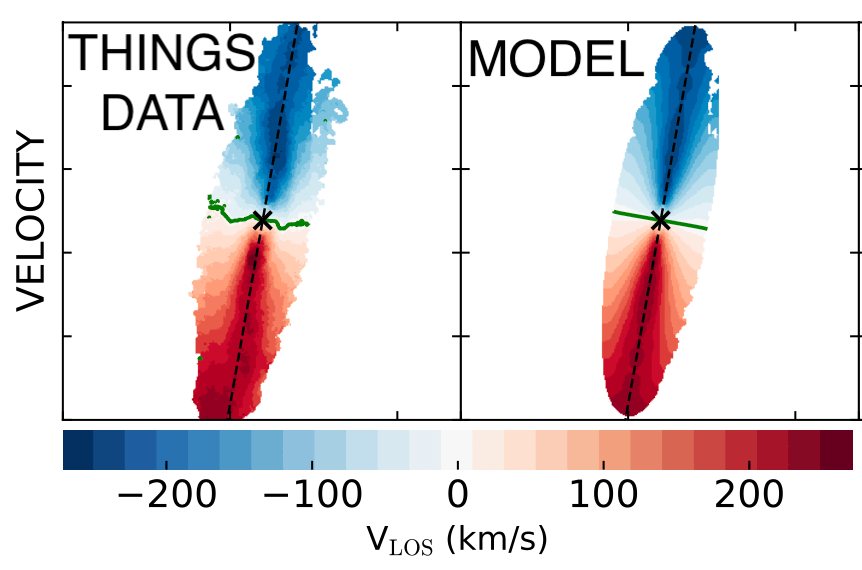
In Section 2.1, we list the selected galaxies and give their main parameters. In Section 2.2, we describe how we use kinematic data (the THINGS’ data by Walter et al., 2008 for the periphery of galaxies and HERACLES’ data by Leroy et al., 2009 for central regions). Here, we provide the extracted density profiles of the gas and rotation curves obtained from the velocity field using the 3DBBarolo package (Di Teodoro & Fraternali, 2015). In Section 3, we build the mass model of all baryonic components. In Section 4, we describe the dark matter mass models. In Section 5, we decompose the extracted rotation curves taking into account S4G photometric models (Salo et al., 2015), modern calibrations (Querejeta et al., 2015), the contribution of the atomic and molecular gas (Leroy et al., 2009), and several models for the dark halo. In Section 6, we testify scale relations for dark halo parameters. In Section 7, we discuss baryon-dominated galaxies in the cosmological context. In Section 8, we provide dynamic models for the galaxies considered. We give our conclusions in Section 9.
2 Sample and data
2.1 Investigated objects
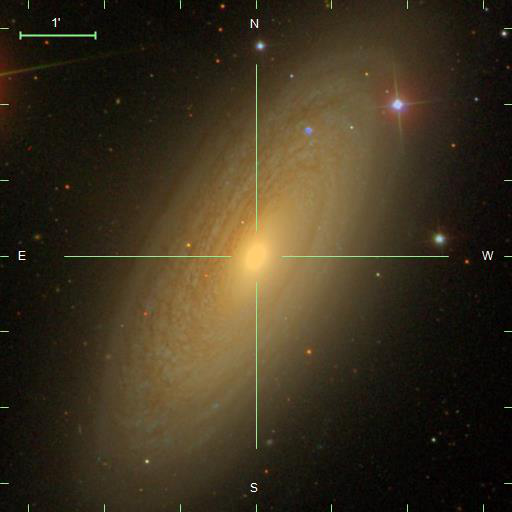
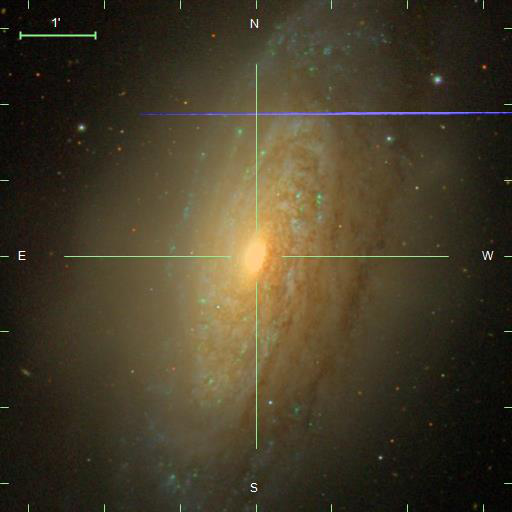
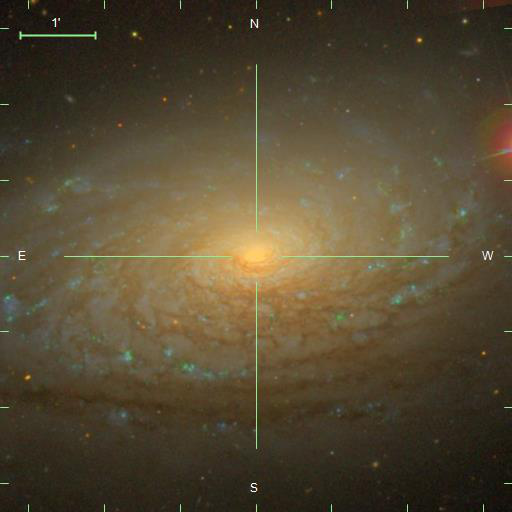
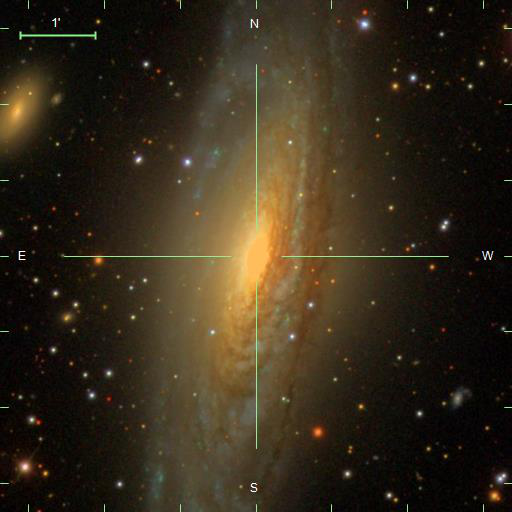
We paid attention to 4 bright galaxies ( mag) from the THINGS survey, which show a decrease in the rotation speed from the maximum value to the periphery by no less than 30 km/s. These are NGC 2841, NGC 3521, NGC 5055, and NGC 7331. Fig. 1 shows SDSS () images of these galaxies. They demonstrate flocculent spirals (Arm Class 3 according to Elmegreen & Elmegreen, 1987) and do not have a bar or even any noticeable oval-like distortion in the central regions111According to data collected on the S4G portal (https://www.oulu.fi/astronomy/S4G_PIPELINE4/MAIN/) the PA profiles for NGC 2841, NGC 3521, and NGC 5055 do not demonstrate any twisting. The ellipticity profiles change a little beyond the area of the bulge.. As will be shown below, these are galaxies in which mass of baryonic matter within the optical radius is greater than the mass of the dark matter.
The list of investigated galaxies is given in Table 1. Here one can find data on the morphological types, inclinations, and distances. Information is also given on the photometric model for each galaxy from the S4G survey (Salo et al., 2015). NGC 7331 galaxy is not included in the S4G survey, and the photometric decomposition for it into stellar sub-structures was done in this work (see Section 3). The last column of the table describes the observed morphology.
| Name | type | model | morphology | ||
| (t) | (∘) | (Mpc) | (Arm Class) | ||
| NGC 2841 | SAa | 71 | 14.1 | bd | 3 |
| NGC 3521 | SAab | 70 | 13.2 | bdd | 3, LSB |
| NGC 5055 | SAbc | 55 | 8.99 | ndd | 3 |
| (M 63) | |||||
| NGC 7331 | SAb | 77 | 14.7 | nbdd | 3 |
| Description: type (t): http://cdsportal.u-strasbg.fr/; inclination (): Di Teodoro & Peek (2021); derived with kinematic modeling; distance (): the Extragalactic Distance Database, http://edd.ifa.hawaii.edu, Tully et al. (2017); model: b – bulge, d – disc, n – nuclear core (Salo et al., 2015), the model for NGC 7331 was built in the present work; morphology: Arm Class according to Elmegreen & Elmegreen (1987), 3 — fragmented arms uniformly distributed around the galactic centre. | |||||
2.2 Data cubes
3DBBarolo (‘3D-Based Analysis of Rotating Objects from Line Observations’) package (Di Teodoro & Fraternali, 2015) was used to obtain the rotation curves of galaxies from the data cubes of the THINGS and HERACLES surveys. 3DBBarolo is a package for determining kinematic data of galaxies from observations of emission lines (). It implements the most common method of inclined rings (Rogstad et al., 1974): the galaxy is divided into several concentric rings with different radii, tilts, and position angles so that inside each ring the circular velocity is constant and it depends only on the distance from the centre .
3DBBarolo can work with any observational data associated with emission lines with very different spatial resolutions. The code creates a model and compares it with observational data, minimizing the difference between the real and model data cubes.
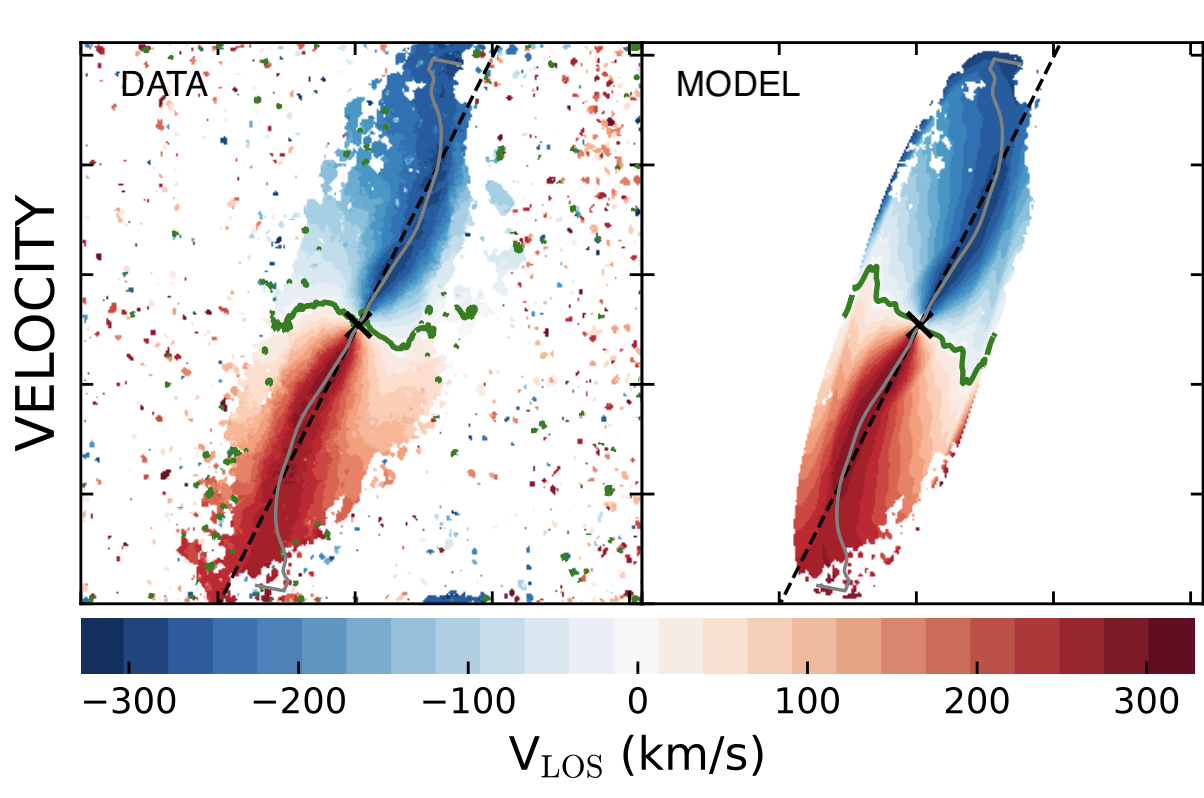
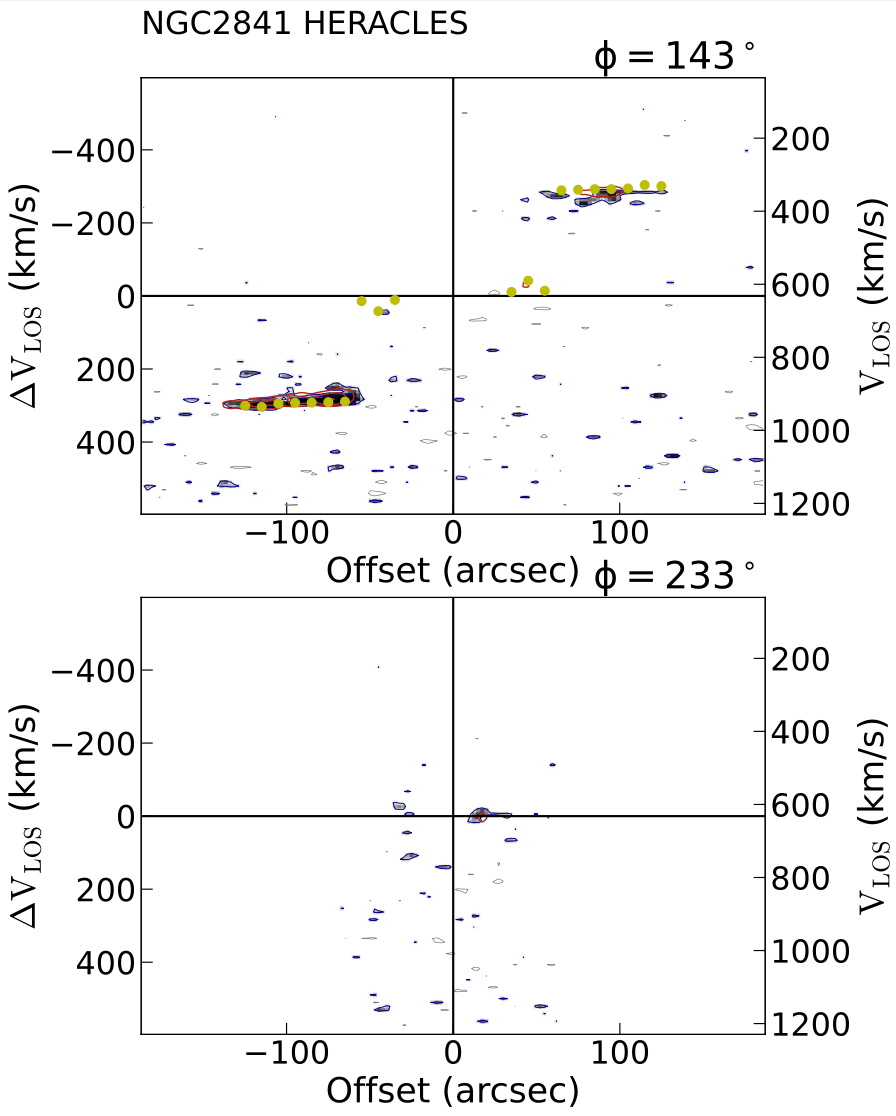
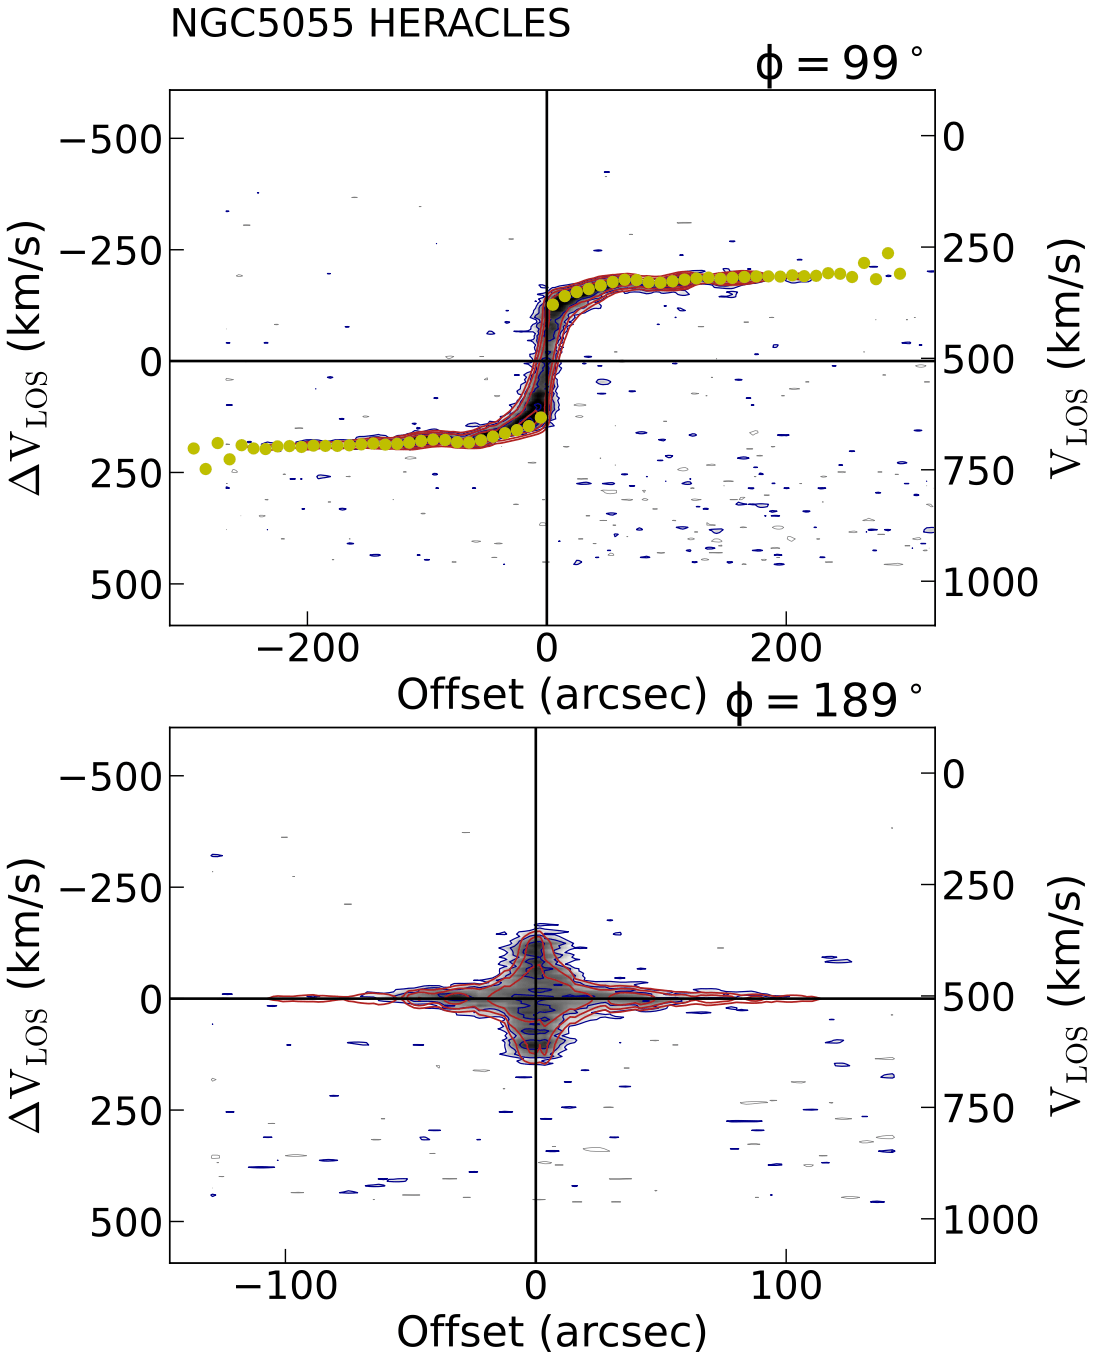
The results of our 3D modeling applied to the THINGS’ galaxies NGC 2841, NGC 3521, NGC 5055 and NGC 7331 are presented in the Appendix A. They include the comparison between the data and the best-fit model, which was double-checked, as well as the best-fit model parameters derived by 3DBBarolo: the rotation curves, surface density profiles of gas, inclinations, position angles and radial velocities. In general, our model rotation curves are in good agreement with the results presented in Di Teodoro & Peek (2021).
2.3 Hydrogen surface density profiles
2.3.1 distribution
To obtain the surface density of neutral gas, we used the result of the 3DBBarolo procedure. At the normalization stage, the package builds a surface density distribution of and produces the profile in /pc2 units. The resulting profile was then adjusted to take into account the presence of helium and other metals by multiplication of the data generated by the package 3DBBarolo by a factor of 1.36.
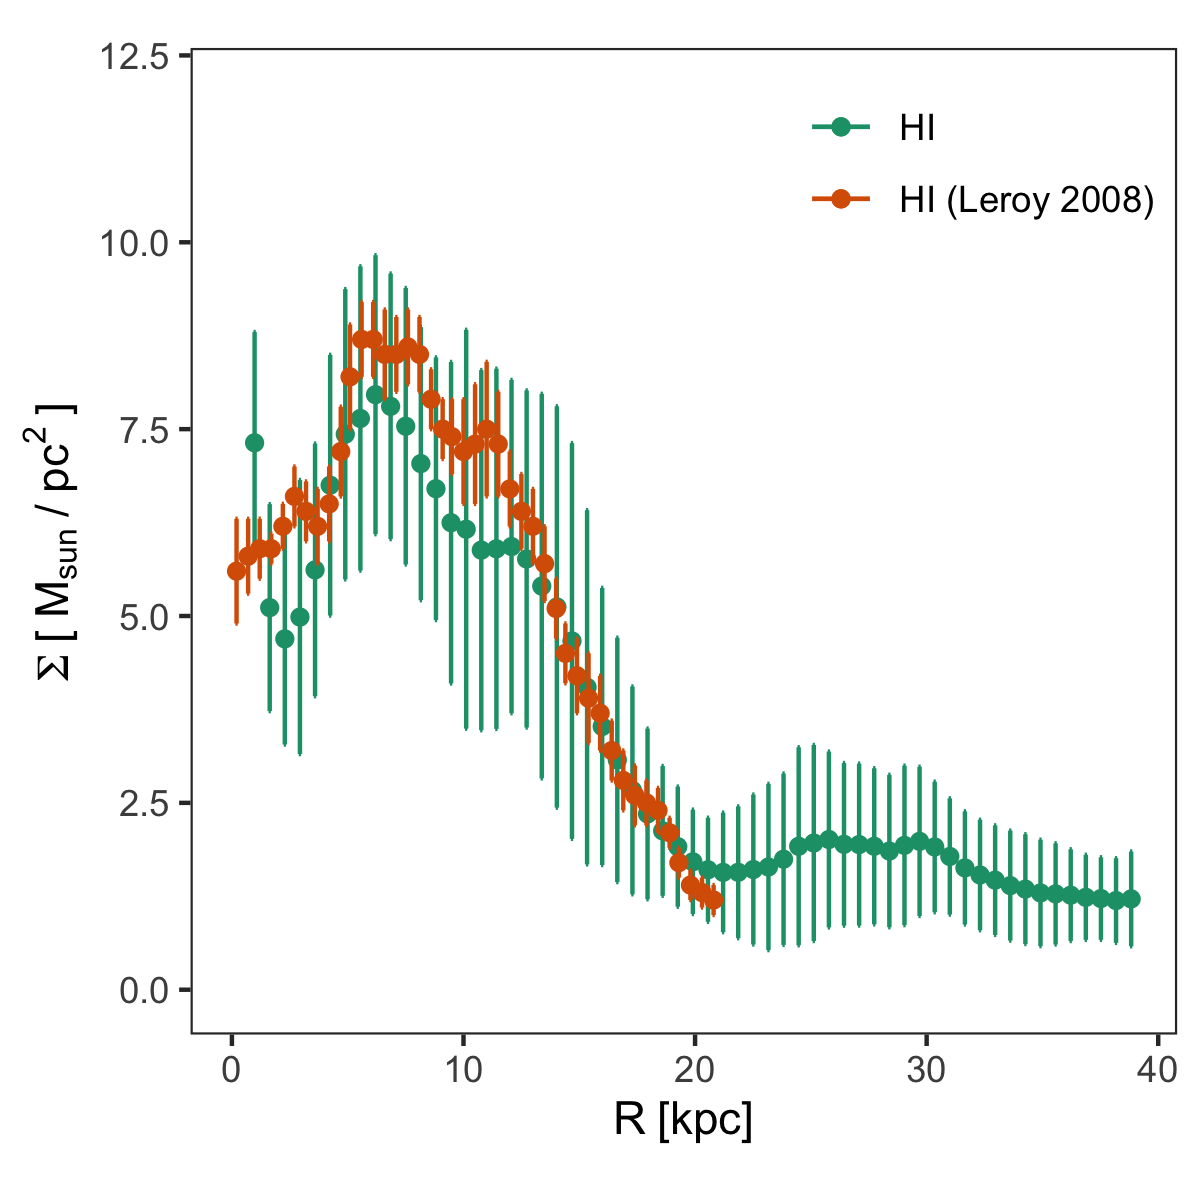
Fig. 2 (left plot) shows the surface density profile of neutral hydrogen for the NGC 5055 galaxy obtained by 3DBBarolo. For comparison, the profile presented in Leroy et al. (2008) is given in the same plot. One can see a good agreement in general. The discrepancy near the maximum is due to the use of different masks when extracting data from 3D cubes.
2.3.2 distribution
The observed luminosity of was converted into the surface density of molecular hydrogen /pc using the calibration (Leroy et al., 2013):
| (1) |
where is the -to- line ratio, and /pc2 (K km/s)-1 is the conversion factor for the Milky Way for the transition CO . Although there are improved estimates of for galaxies from the HERACLES (Sandstrom et al., 2013), it was shown that the change of this coefficient does not affect the decomposition of rotation curves (Frank et al., 2016), therefore, the value for the Milky Way was used in the present work. The expression (1) already includes the coefficient 1.36 to account for the helium and other heavy elements.
The corresponding values of can also be obtained using 3DBBarolo. The package constructs the distribution of the intensity over the rings in units of [K km/s].
As an example, Fig. 2 (right panel) shows the surface density profile of the molecular gas for galaxy NGC 5055.

3 Photometric and mass models for stellar subsystems
Mass models of stellar sub-structures were built on the basis of multi-component photometric decomposition of the images from the S4G in the band 3.6 m (Salo et al., 2015). The decomposition results are collected on the S4G portal, as well as in the tables of the VizieR database222http://vizier.cfa.harvard.edu/viz-bin/VizieR?-source=J/ApJS/219/4.
For the disc, the exponentional law for the sutface brightness is adopted (“expdisc”)
where is the central surface brightness of the disc observed face-on and denotes the exponential scale length. The bulge component is described with a Sérsic profile (“sersic”)
where is the surface brightness at the effective radius (isophotal radius encompassing half of the total flux of the component). The Sérsic-index describes the shape of the radial profile, which becomes steeper with increasing . For example, corresponds to an exponential profile and to a de Vaucouleurs profile. The factor is a normalization constant determined by . The galaxy NGC 5055 contains a central component (a small bulge) with angular size so small that it cannot be resolved in the S4G images ( of S4G images). This component is fit with a PSF-convolved point source and denoted in Table 1 as ‘n’ (nuclear core). In this case the free parameter is the total magnitude . In Salo et al. (2015) the free parameters are (instead of ) and the integrated magnitude (instead of ).
For the galaxies studied, the decomposition parameters are listed in Table 2. The stellar magnitudes are given in the AB system ().
| Bulge | Disc | |||||||||
| NGC | ||||||||||
| (mag) | (mag) | |||||||||
| 2841 | 114.03 | 0.166 | 10.50 | 10.92 | 2.25 | 0.834 | 8.75 | 0.457 | 56.28 | 19.50 |
| 3521 | 76.76 | 0.104 | 10.57 | 8.31 | 2.87 | 0.674 | 8.54 | 0.514 | 39.05 | 18.49 |
| 0.222 | 9.73 | 0.453 | 108.98 | 21.91 | ||||||
| 5055 | 114.94 | 0.016† | 12.46† | - | - | 0.170 | 9.88 | 0.556 | 14.99 | 17.75 |
| 0.814 | 8.18 | 0.556 | 73.57 | 19.51 | ||||||
| 7331 | 50.0 | 0.003‡ | 14.64‡ | - | - | 0.573 | 8.86 | 0.642 | 29.55 | 18.25 |
| 0.096 | 10.80 | 6.5 | 2.74 | 0.328 | 9.46 | 0.571 | 107 | 21.85 | ||
| Description: () — the effective radius from one-component decomposition, () — “sersic” fraction of the total model flux, () — “sersic” total 3.6 m AB magnitude, () — “sersic” effective radius, () — “sersic” parameter, () — “expdisc” fraction of the total model flux, () — “expdisc” total 3.6 m AB magnitude, () — “expdisc” axis ratio, () — “expdisc” exponential scale length, () — “expdisc” central surface face-on brightness. Note: for the unresolved nuclear cores, symbols and denote the PSF fraction of the total model flux and the PSF total 3.6 m AB magnitude. Source: (Salo et al., 2015). For NGC 7331 — parameters of decomposition were determined in the present paper. | ||||||||||
Photometric decomposition gives the surface brightness profile of all stellar components. To go to surface densities, one needs to know the ratio . It was calculated using the calibration formula from Querejeta et al. (2015). Unlike previous studies, the ratio was calculated without intermediate recalibration using 2MASS data in the -band. To calculate the colour index [3.6 m] – [4.5 m], we used integral magnitudes in the corresponding bands from Sheth et al. (2010). The corresponding values of can be found in Table 3. They were calculated via the formula (2) and calibrated for a “diet” Salpeter IMF, equivalent to a standard Salpeter (1955) IMF, but with a reduced number of very low mass stars. The values correspond to the Kroupa (2001) IFM. The calibration accuracy is .
| (2) |
| NGC | 3.6m | 4.5m | [3.6] – [4.5]m | - 0.15dex | |
|---|---|---|---|---|---|
| 2841 | 8.713 | 9.204 | -0.491 | 0.68 | 0.48 |
| 3521 | 8.202 | 8.656 | -0.454 | 0.66 | 0.47 |
| 5055 | 8.018 | 8.469 | -0.451 | 0.66 | 0.46 |
| 7331 | 8.250 | 8.725 | -0.475 | 0.67 | 0.47 |
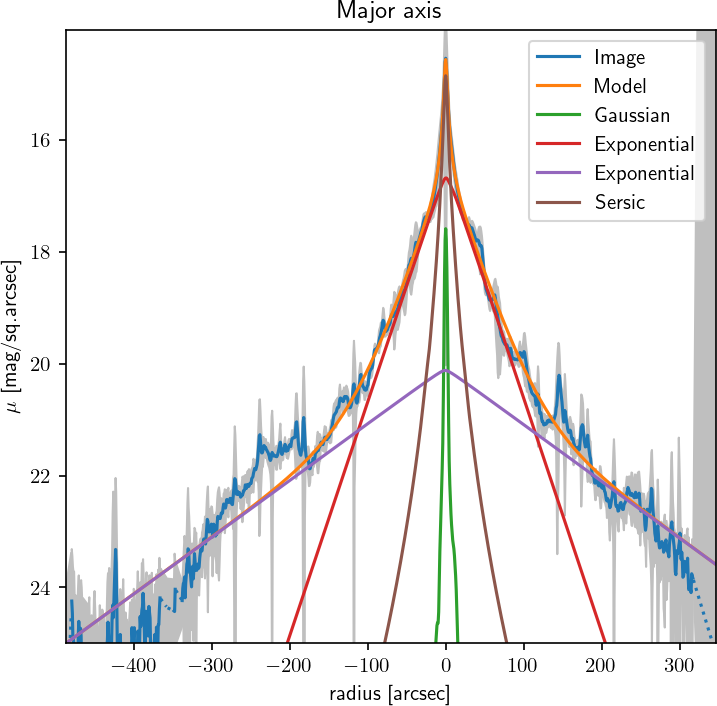
NGC 7331 is not included in the S4G survey. For this galaxy the surface brightness profile was extracted from the Spitzer telescope archive. For this galaxy we constructed our own photometric model. It consists from an unresolved nuclear (PSF), a small bulge and two exponential discs (see Table 2). Fig. 3 shows the surface brightness profile of the galaxy NGC 7331 in the band 3.6 m and the profiles of all components. Stellar magnitudes are given in the AB system. The ratio was calculated using the calibration formula (2).
4 Dark halo models
Three models were used to describe the dark matter halo: the pseudo-isothermal (ISO) halo model, the Navarro-Frank-White (NFW) model with a density peak at the centre (Navarro et al., 1996, 1997), and the Burkert (1995) model. The density profile in the Burkert model coincides with the NFW density profile at large distances from the centre, but in the centre the density does not have a peak, but reaches a final value.
de Blok et al. (2008), who used the ISO model and the NFW model, came to the conclusion that for bright galaxies with both dark halo models are equally well suited for describing rotation curves. Several galaxies are distinguished, for which the formal solution for the NFW model gives the model parameters that are incompatible with cosmological simulations (either very small values of the halo concentration parameter, or too large). For dwarf galaxies with , the ISO halo model is more suitable. In addition, Saburova et al. (2016) showed that the Burkert dark halo model (with a smoothed density profile at the centre compared to the NFW model) gives a nondegenerate solution for almost all galaxies, in contrast to the ISO and NFW models. The authors stress that models with NFW profile fail more often than madels with other profiles when the baryonic surface density is fixed.
4.1 The pseudo-isothermal (ISO) model
The ISO dark halo model has a radial density profile:
| (3) |
where is the central density, and is the radius of the core, where the density is almost constant.
The contribution to the rotation curve is calculated by the formula
| (4) |
At , the circular speed reaches a constant value . The model has two fit parameters and .
4.2 The Navarro–Frenk–White (NFW) model
The Navarro-Frank-White model (NFW) (Navarro et al., 1996, 1997) was proposed on the basis of numerical cosmological simulations of the dark halo formation. Its density profile is
| (5) |
where the density and the scale length are parameters of the model. It is believed that this profile is universal, its parameters practically do not depend on the halo mass, rotation and formation epoch, but depend on the chosen cosmological model. At small distances from the center, the density diverges (there is a density peak).
Typically, two other parameters (instead and ) are used to describe the NFW halo profile. The scale length can be expressed trough , the radius of the sphere, inside which the average density of dark matter is 200 times greater than the critical density of the Universe. This can be written via the condition
where is the total mass of dark matter inside a sphere of radius . The radius is close to the radius of the sphere, inside which the dark halo is virialized, i.e. is in dynamic equilibrium. Because of this, is often referred to as the virial mass. The radius for a given cosmology can be expressed through the circular velocity at this radius (Mo et al., 1998):
here is the Hubble constant at redshift . The coefficient “10” is not an exact number, but depends on the accepted “cosmology”. For the standard LCDM cosmology, it is about ten. Then the first independent (fitting) parameter of the model can be considered as .
Another parameter can be the concentration parameter
The concentration parameter is not completely independent and is rather strongly related to the history of merges, i.e. generally speaking it depends on the halo mass and “cosmology”. But within the same “cosmology” there is a scatter of this parameter, and in the first approximation its dependence on the virial mass (or ) can be neglected, considering to be a free (fitting) parameter.
If we denote , then the rotation curve of this model has the following form:
| (6) |
where The rotation curve of such a model has two fit parameters, the velocity and the concentration parameter .
4.3 The Burkert model
The density profile for the Burkert (1995) model is
| (7) |
At large distances from the centre, this profile behaves in the same way as the density profile (5) for the NFW model. At both profiles give the same density value . For the same values of the core radius and the density , the mass of the NFW halo inside the core radius is approximately 1.5 times greater than the mass in the Burkert model. Inside a sphere of radius both masses are approximately equal, and then the cumulative mass of the NFW model is about 10% less than the cumulative mass of the Burkert model. Thus, the NFW model has a slightly higher concentration of matter towards the center. The maximum of the rotation curve in the NFW model is reached approximately at , and in the Burkert model at approximately .
It is convenient to describe the rotation curve of this model with parameters similar to those for describing the rotation curve of the NFW model. By analogy, one can take the parameter — the circular velocity at the virial radius , and the concentration parameter . Then the circular speed at the distance can be calculated by the formula
| (8) |
where . Similar to the NFW model the rotation curve of the Burkert model has two fit parameters, the velocity and the concentration parameter .
4.4 Adiabatic contraction of the NFW dark halo
The compression of dark matter halos by baryonic component distorts the initial NFW density profiles predicted by cosmological simulations. We use the algorithm by Blumenthal et al. (1986) to account for the compession. This scheme assumes a spherically symmetric halo and particles in circular orbits. If the halo responds adiabatically to the slow assembly of the disc and remains spherical as it contracts, the angular momentum of the individual dark matter particles is conserved, e.g. . For circular orbits, if, in addition, the distribution of the baryons has spherical symmetry, we have , where is the enclosed mass within radius . This reduces further to . Blumenthal et al. (1986) formulate the last condition as following
| (9) |
where and are the initial and final radii of a spherical shell of the dark halo. gives the initial distribution of the matter (dark and baryonic) with the NFW density profile NFW, is the final mass profile.
Then the dark halo mass profile after adiabatic contraction will be
| (11) |
In fact, it is necessary to find the relationship between the initial radius of the dark halo spherical shell and its final value . This dependency, based on Eqs. (9) and (10), can be written as
| (12) |
where is the mass distribution in the NFW model. Eq. (12) is solved iteratively and is found as the function of . After this, the mass distribution in the compressed halo is defined as
Blumental scheme overpredicts the compression of the halo and, for, example Katz et al. (2014) used another formalism, by Young (1980), and applied it to a sample of galaxies from the THINGS. The Young’s method conserves the radial action in addition to the angular momentum and leads to a less strong compression of the halo, so that the initial values of the concentration parameter may still turn out to be too large. That is why we used the Blumental scheme for the galaxy NGC 2841.
5 Results of decomposition
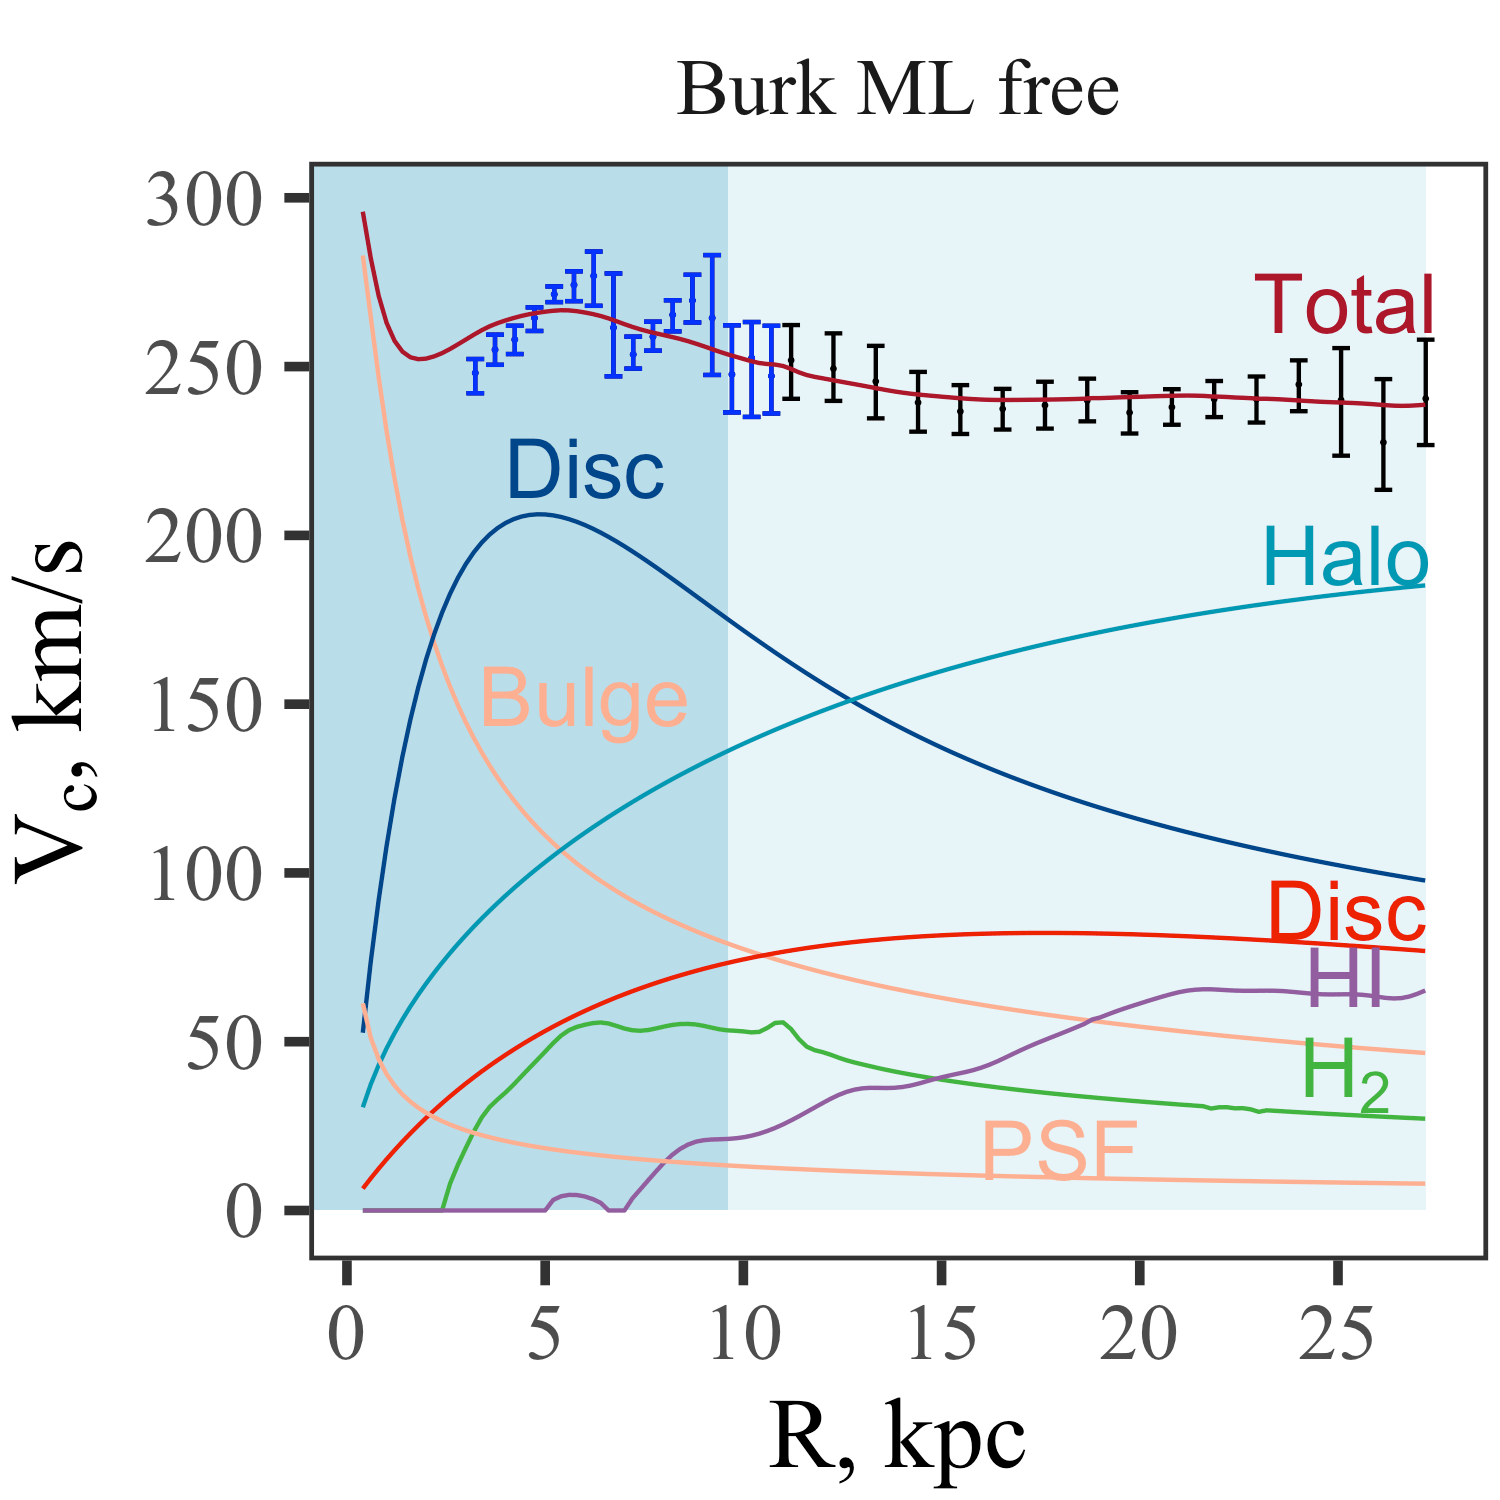
When decomposing the rotation curves, we considered the contribution of four subsystems: the bulge, the stellar disc, the gas disc, and the dark halo. For stellar components (bulge and disc) we have only photometric models. Models of mass distribution are obtained by taking into account factors and , respectively. Then, the contribution of each subsystem is accounted for by the formula
| (13) |
where , , and are the contributions to the circular speed by the bulge, disc, and discs and the dark matter halo, respectively, () are the disc (bulge) mass-to-light ratio.
Bulge (typical for galaxies of early morphological types) makes the main contribution to the rotation curve in the central region of the galaxy. The rotation curve, associated only with the bulge, rapidly decreases towards the periphery. For the bulge, the Sersic model (Sérsic, 1968) of the surface brightness profile is adopted. The contribution of the bulge to the rotation curve of the galaxy was calculated according to Noordermeer (2008). The contribution of the exponential stellar disc to the rotation curve was calculated using the formula by Casertano (1983). The thickness of the disc was taken into account. We adopted , where is the vertical scale and is the exponential scale of the disc. The contribution of the gas to the rotation curve is calculated by the formula for an infinitely thin disc (Freeman, 1970) with a radial surface density profile . The formulas for the dark halo contribution are described in Section 4.
The decomposition of the rotation curves refers to the so-called problems with degeneracy, when different sets of free parameters can give equally good (in the sense of the smallness of the value) solutions. There is always arbitrariness.
There are four free parameters: , and two parameters that describe the halo model. Preference is given to models with a fixed value of , which corresponds to the Kroupa IMF. The value of , as a rule, varied freely. Solutions with unrealistically large () and unrealistically small values () of were discarded. Sometimes it was necessary to vary within the calibration error. Below are only solutions for which iterations converge and which give the physical values of the parameters.
Decomposition of the rotation curve is the so-called multidimensional nonlinear least-squares fitting. To find the best-fit parameters we used the weighted nonlinear least-squares fitting solver from the gsl (GNU Scientific Library) library, which is based on the Levenberg–Marquardt algorithm. The algorithm uses a generalized trust region to keep each step of fitting under control. The gsl solver finds a solution even if it starts very far off the final minimum. We tested this by randomly varying the initial guess. Additionally, we made 20,000 random realizations of the observed rotation curve, varying it within the error and assuming that the error is Gaussian distributed. The solutions converge to our best solution for the original observational rotation curve (see Appendix B). When fitting, we discarded the most central points on the rotation curve, since galaxies are observed at rather high inclination and there is a beam-smearing problem for them. Because of this, difficulties could arise in finding a solution for if was fixed. In this case, the solver tends to attribute the rotation curve at the center to the disc only, giving negative or very small values for the bulge. We rejected these solutions for NGC 3521 and NGC 7331 and fixed . Such a fixation is close to that done in Mancera Piña et al. (2022), although there the factor before was a completely free parameter in the rotation curve decomposition333Mancera Piña et al. (2022) used a more sophisticated technique in such cases. They imposed a prior , varying the factor 1.4 with a small Gaussian scatter.. For galaxies NGC 2841 and NGC 5055, solutions for the fixed and free ratios , although they led to a redistribution of mass between the bulge and disc and slightly different dark halo parameters, did not generally change the conclusion that these galaxies have a reduced content of dark matter within four radial scale of a disc.
Tables 4-6 summarize fit parameters for three types of halos. gives the halo-to-baryonic mass ratio within four exponential scales of the heaviest disc while is the relative dark matter mass within the effective radius of the galaxy.
| ISO halo | ||||||||
| Name | ||||||||
| (free) | (kpc) | (km/s) | ||||||
| NGC 2841 | fixed | 0.68 | 0.23 | 1.34 | 0.41 | |||
| NGC 2841 | free | 0.23 | 1.21 | 0.41 | ||||
| NGC 3521 | fixed | - | - | - | - | - | - | - |
| NGC 3521 | free | 1.07 | 0.50 | 0.16 | ||||
| NGC 5055 | fixed | 0.46 | 1.22 | 0.63 | 0.13 | |||
| NGC 5055 | free | 0.86 | 0.89 | 0.22 | ||||
| NGC 7331 | fixed | - | - | - | - | - | - | - |
| NGC 7331 | free | 0.84 | 0.71 | 0.41 | ||||
| NFW halo | ||||||||
| Name | ||||||||
| (free) | (km/s) | |||||||
| NGC 2841 | fixed | 0.68 | 0.26 | 1.32 | 0.39 | |||
| NGC 2841# | fixed | 0.68 | 0.29 | 1.66 | 0.51 | |||
| NGC 2841 | free | 0.23 | 1.00 | 0.32 | ||||
| NGC 3521 | fixed | - | - | - | - | - | - | - |
| NGC 3521 | free | 1.04 | 0.73 | 0.27 | ||||
| NGC 5055 | fixed | 0.46 | 2.22 | 0.58 | 0.15 | |||
| NGC 5055 | free | 0.85 | 1.21 | 0.34 | ||||
| NGC 7331 | fixed | - | - | - | - | - | - | - |
| NGC 7331 | free | 0.94 | 0.66 | 0.39 | ||||
| Note: Symbol denotes the model with adiabatic contraction. See Section 4.4. | ||||||||
| Burkert halo | ||||||||
| Name | ||||||||
| (free) | (km/s) | |||||||
| NGC 2841 | fixed | 0.68 | 0.48 | 1.23 | 0.34 | |||
| NGC 2841 | free | 0.25 | 0.76 | 0.24 | ||||
| NGC 3521 | fixed | - | - | - | - | - | - | - |
| NGC 3521 | free | 1.09 | 0.63 | 0.22 | ||||
| NGC 5055 | fixed | 0.46 | 2.16 | 0.60 | 0.16 | |||
| NGC 5055 | free | 0.88 | 1.02 | 0.26 | ||||
| NGC 7331 | fixed | - | - | - | - | - | - | - |
| NGC 7331 | free | 1.09 | 0.39 | 0.27 | ||||
5.1 NGC 2841
NGC 2841 — a spiral galaxy without a bar in the constellation Ursa Major.
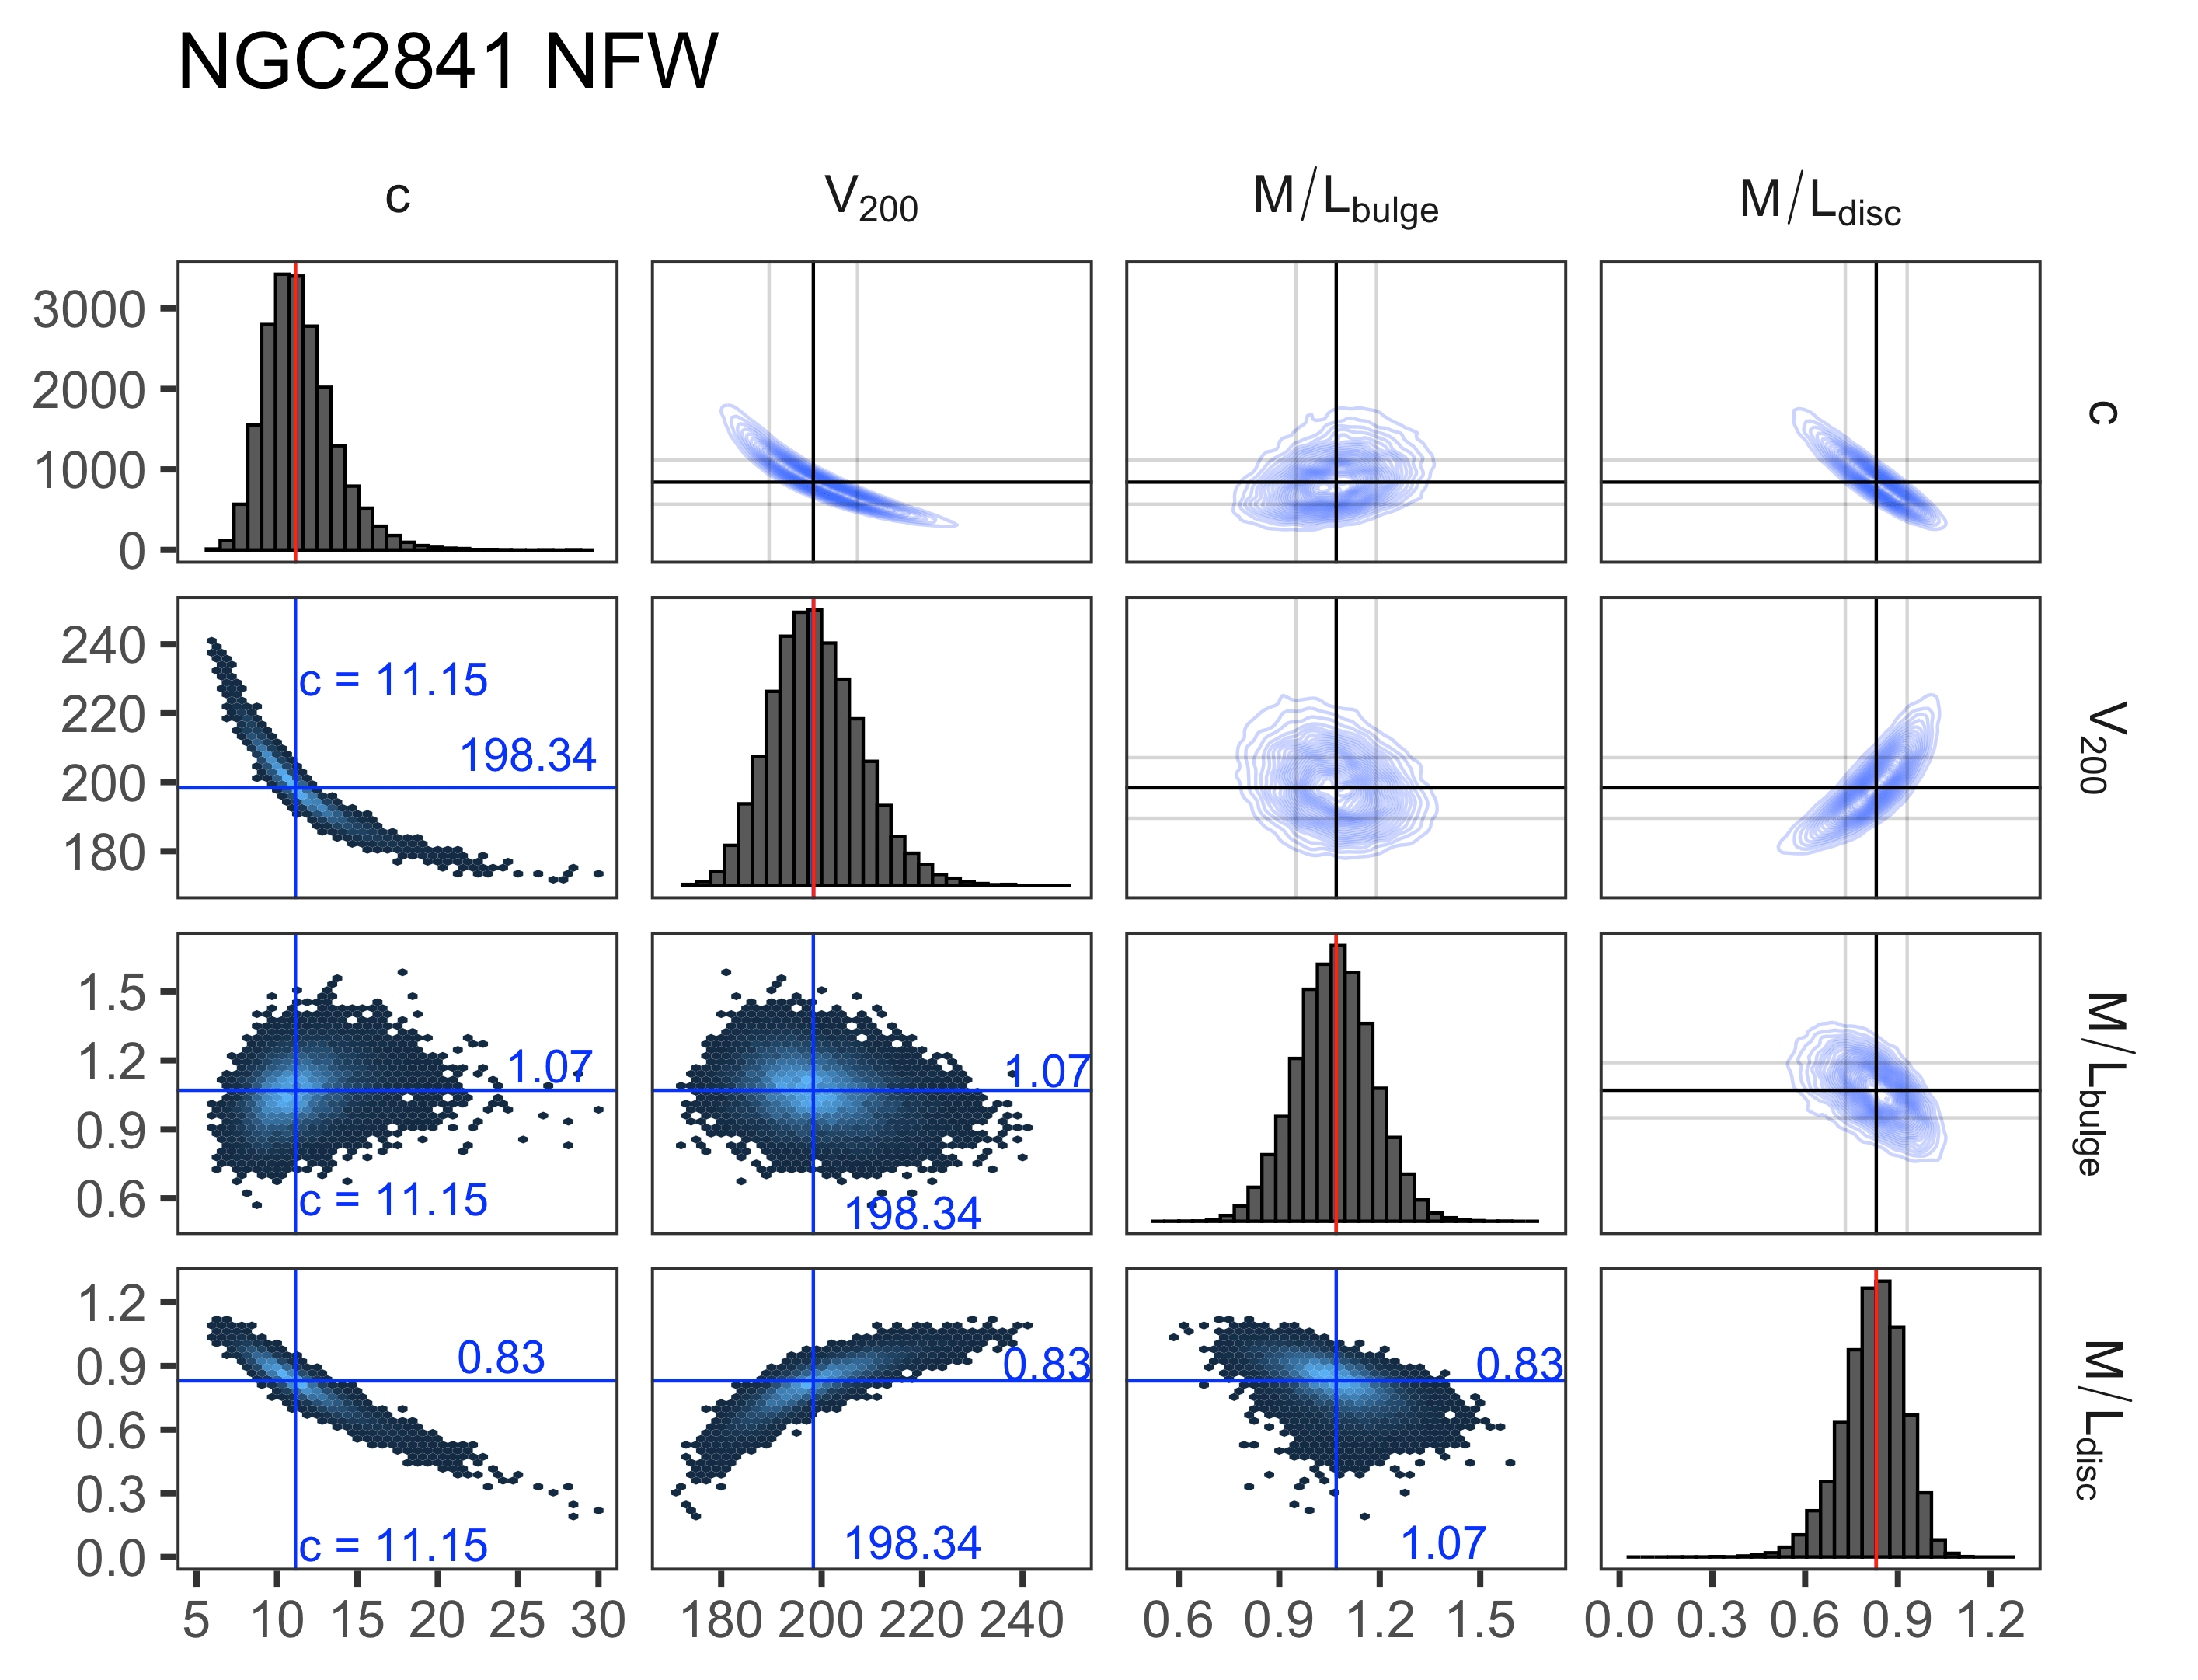
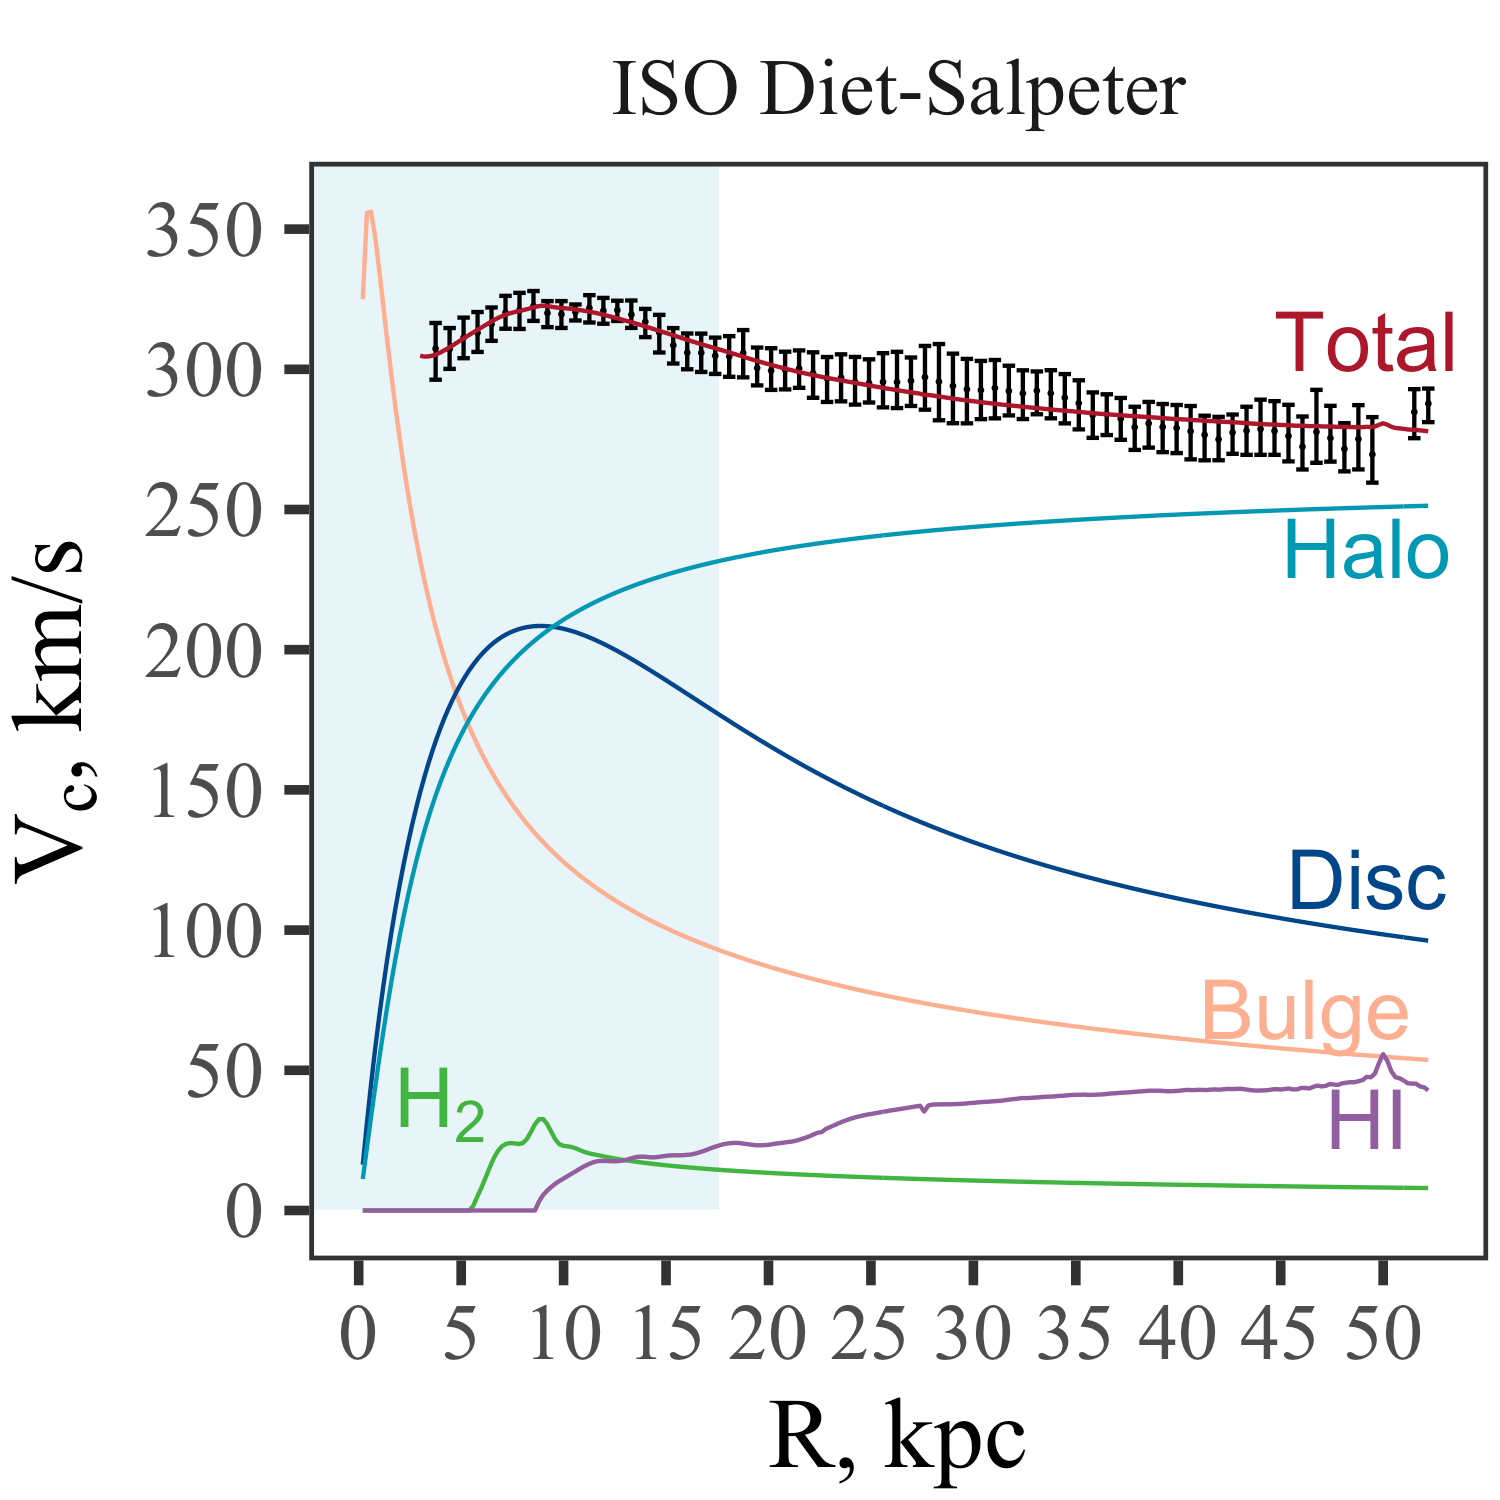
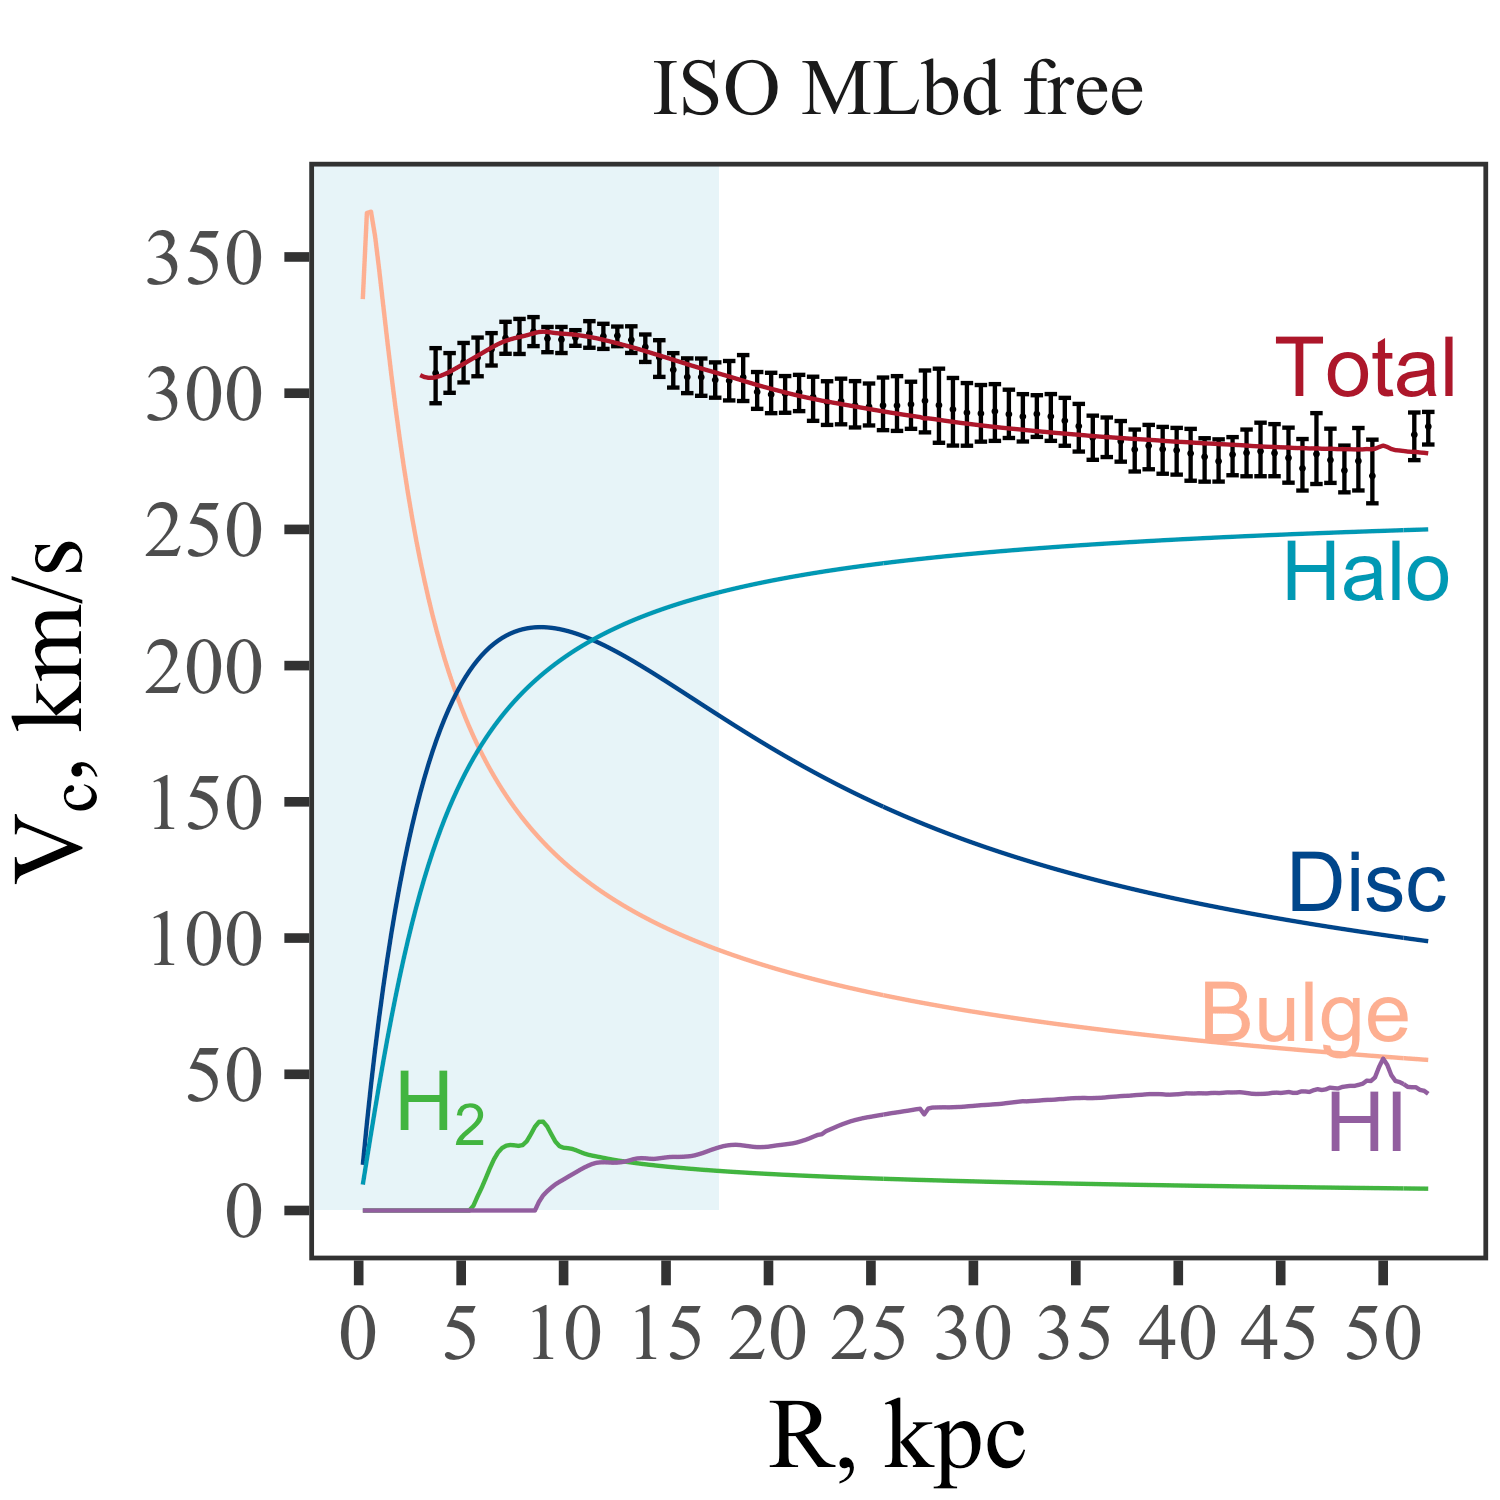
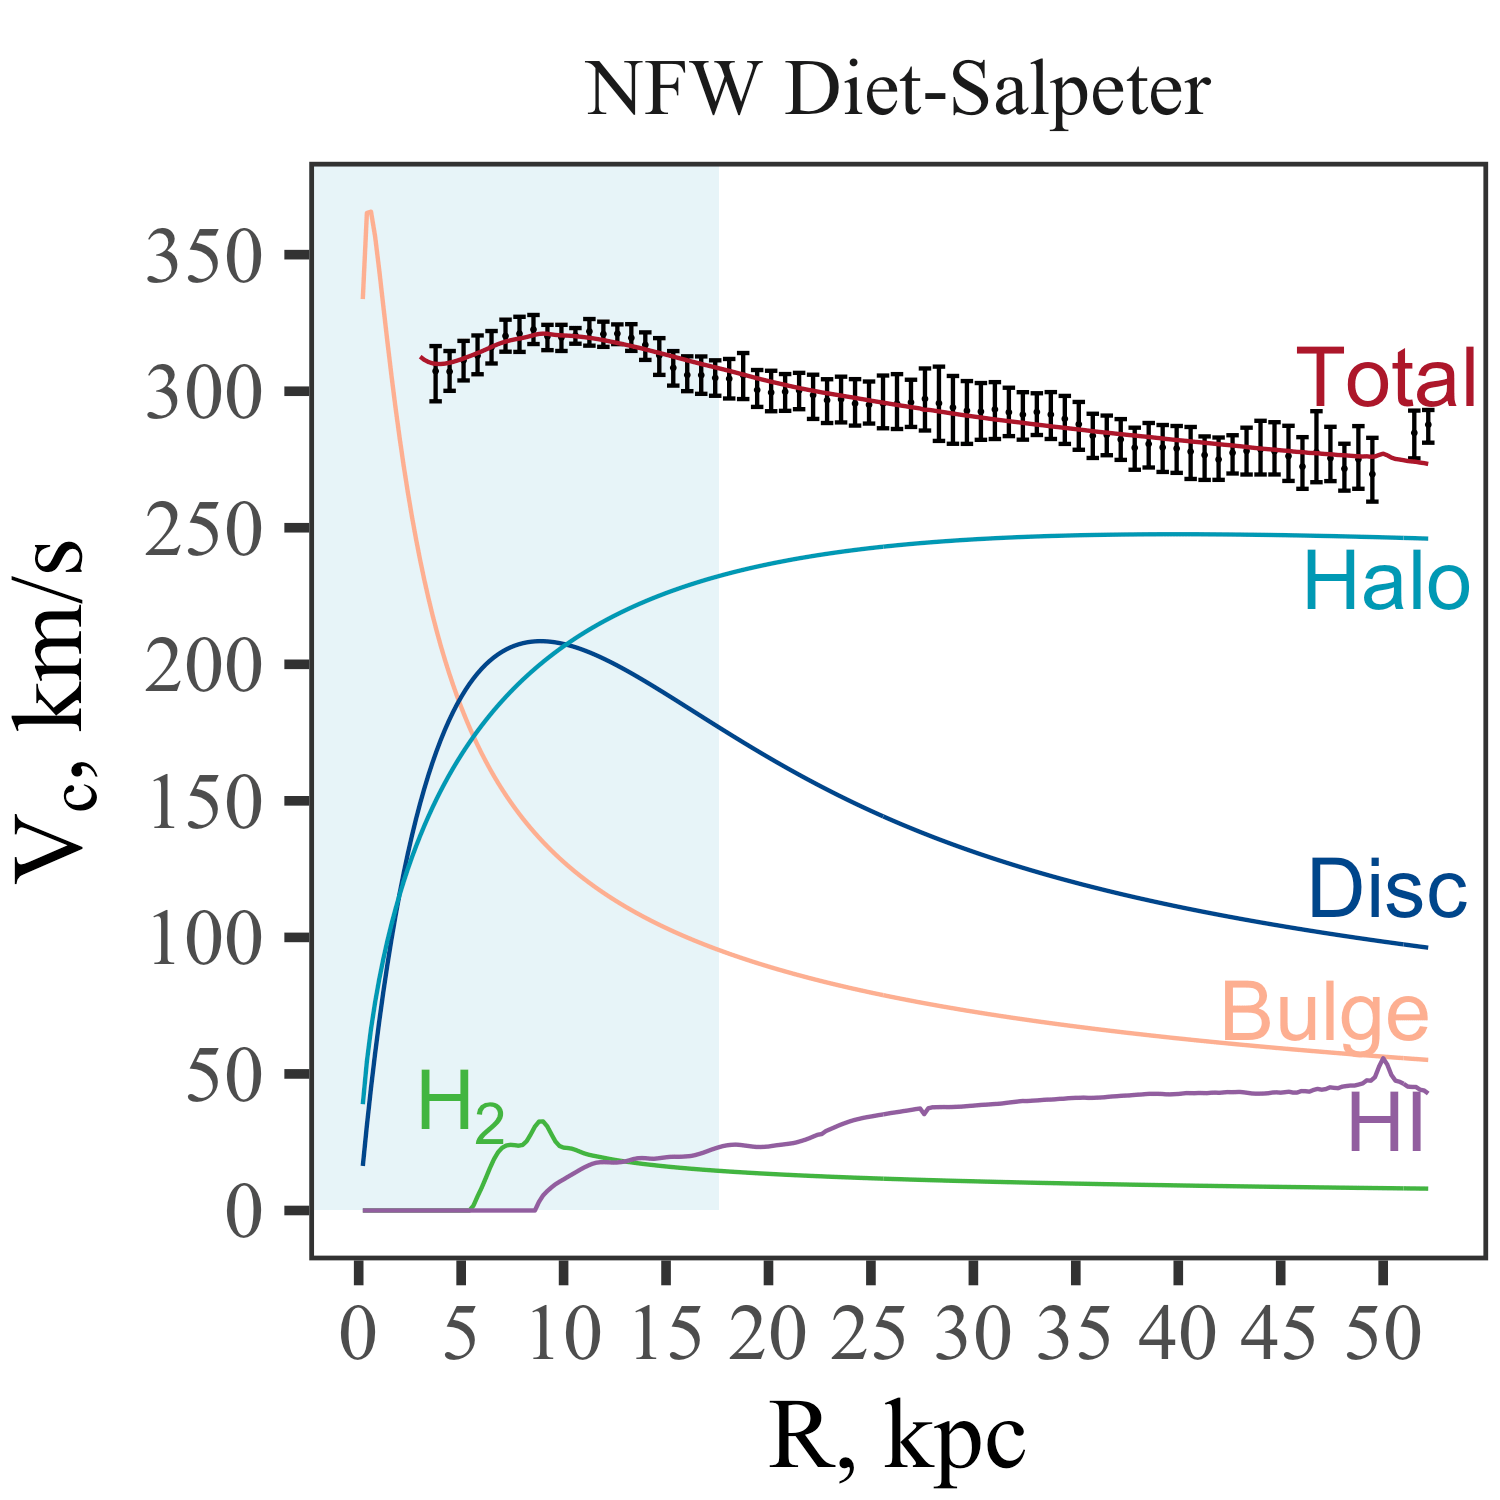
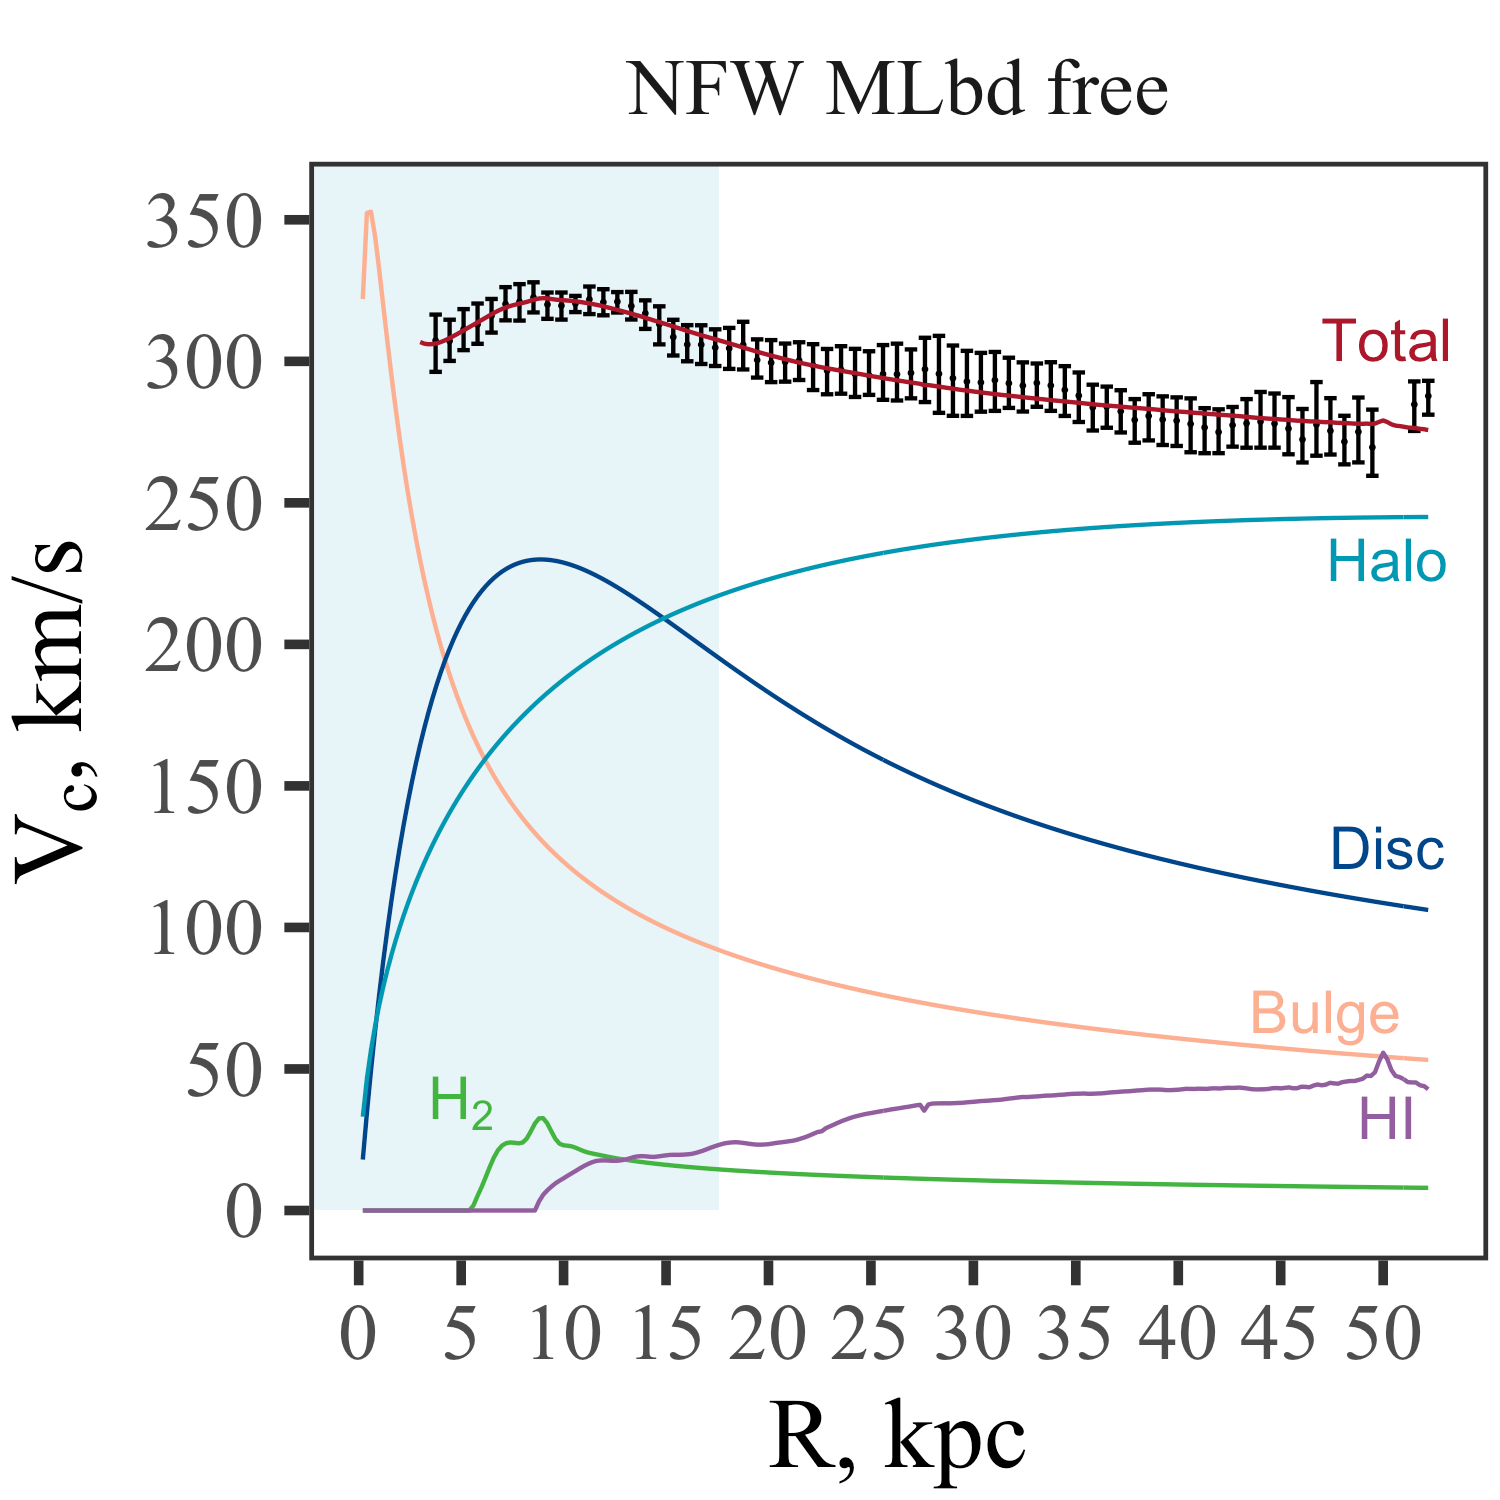
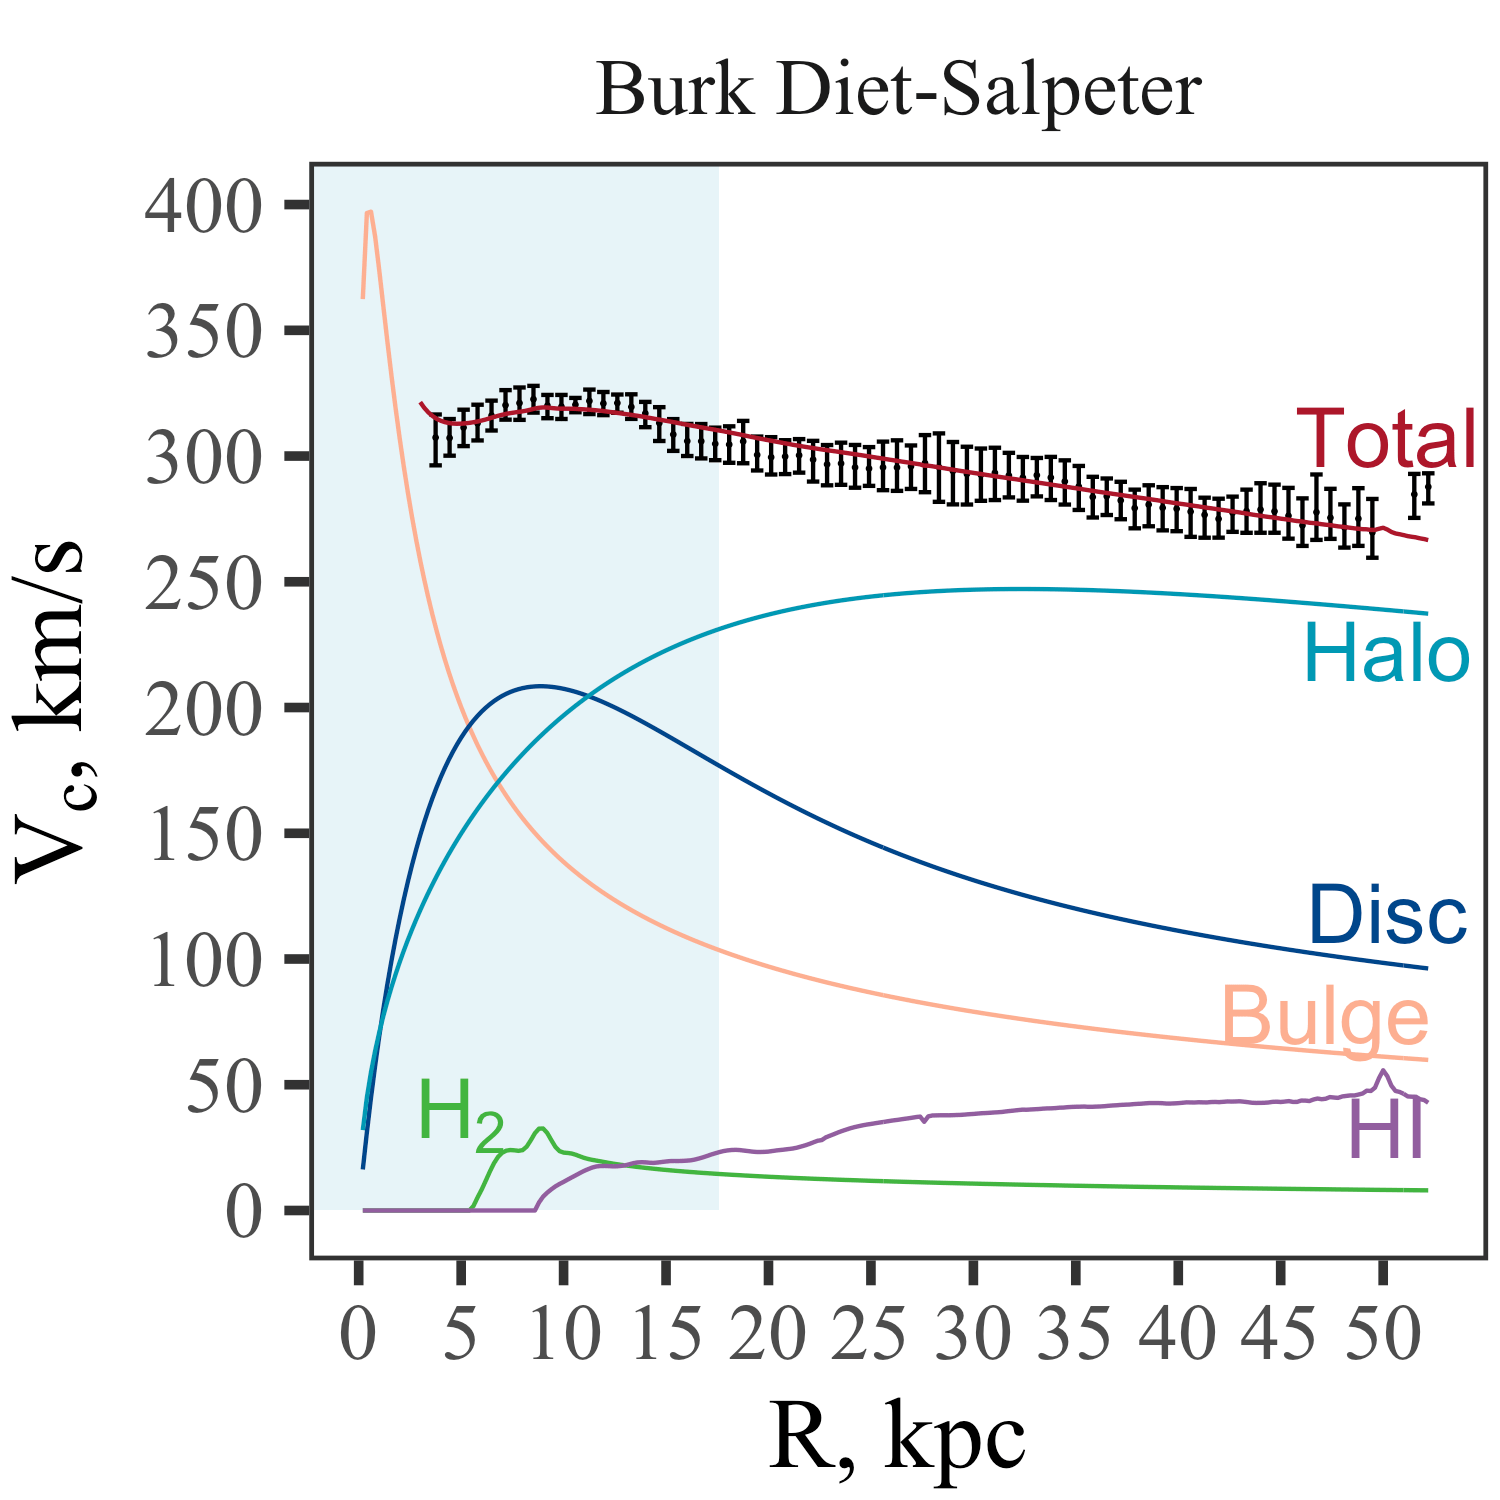
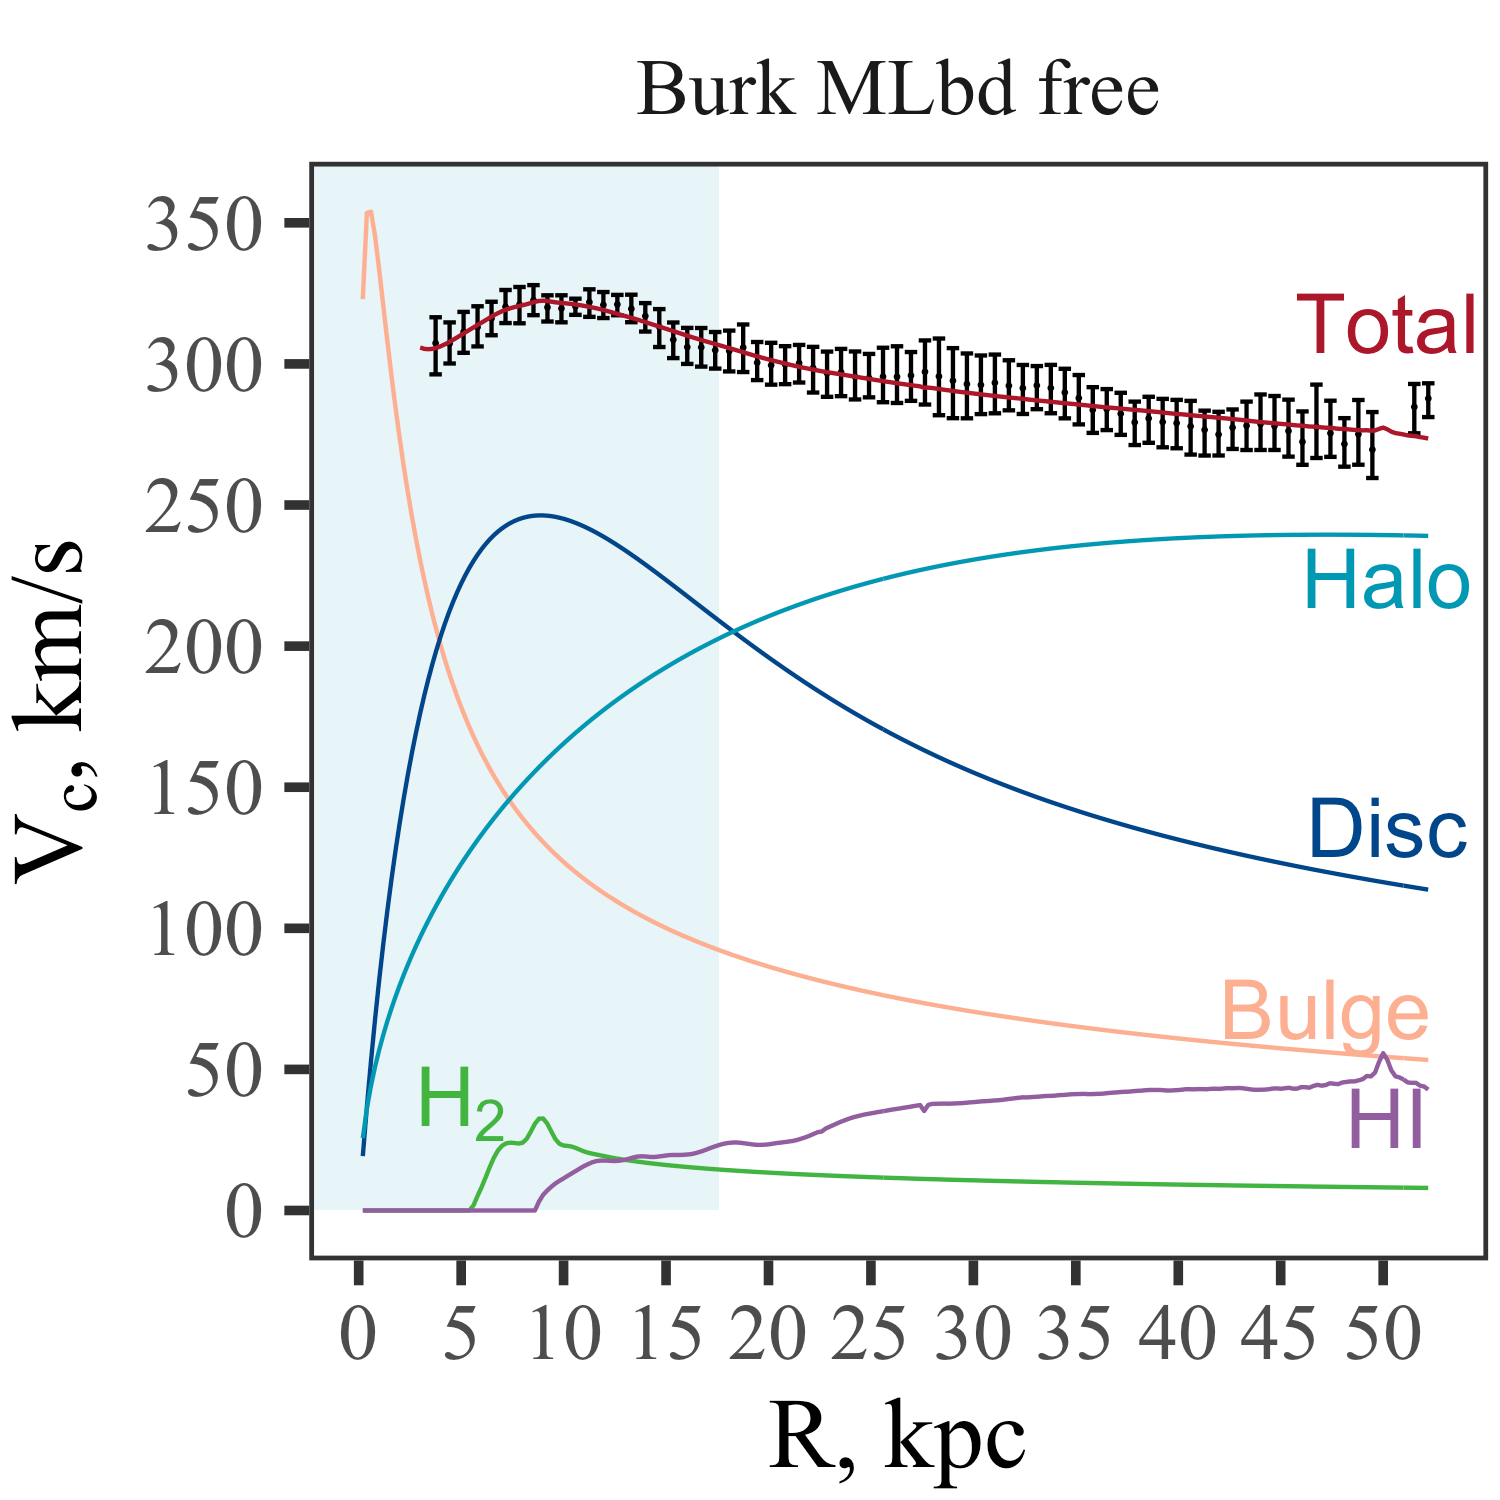
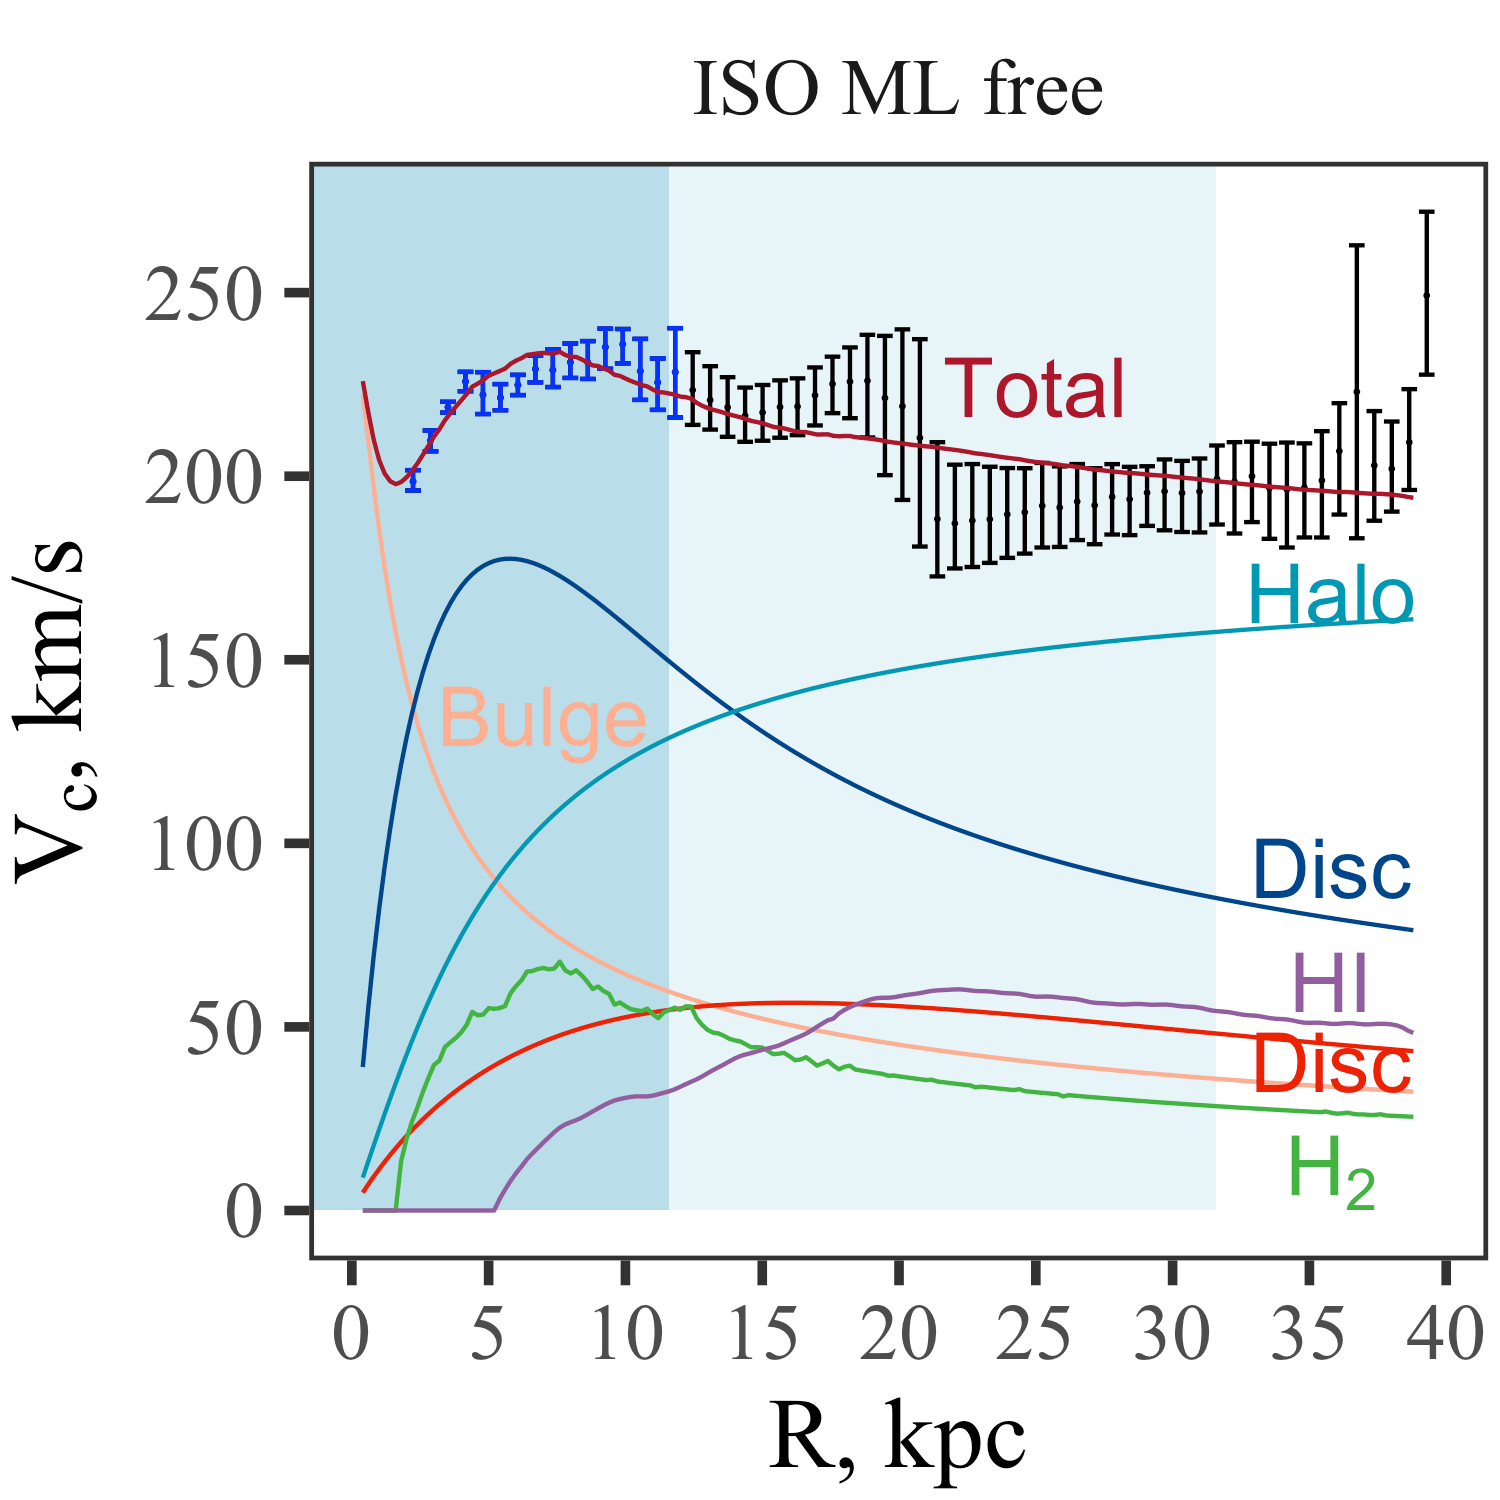
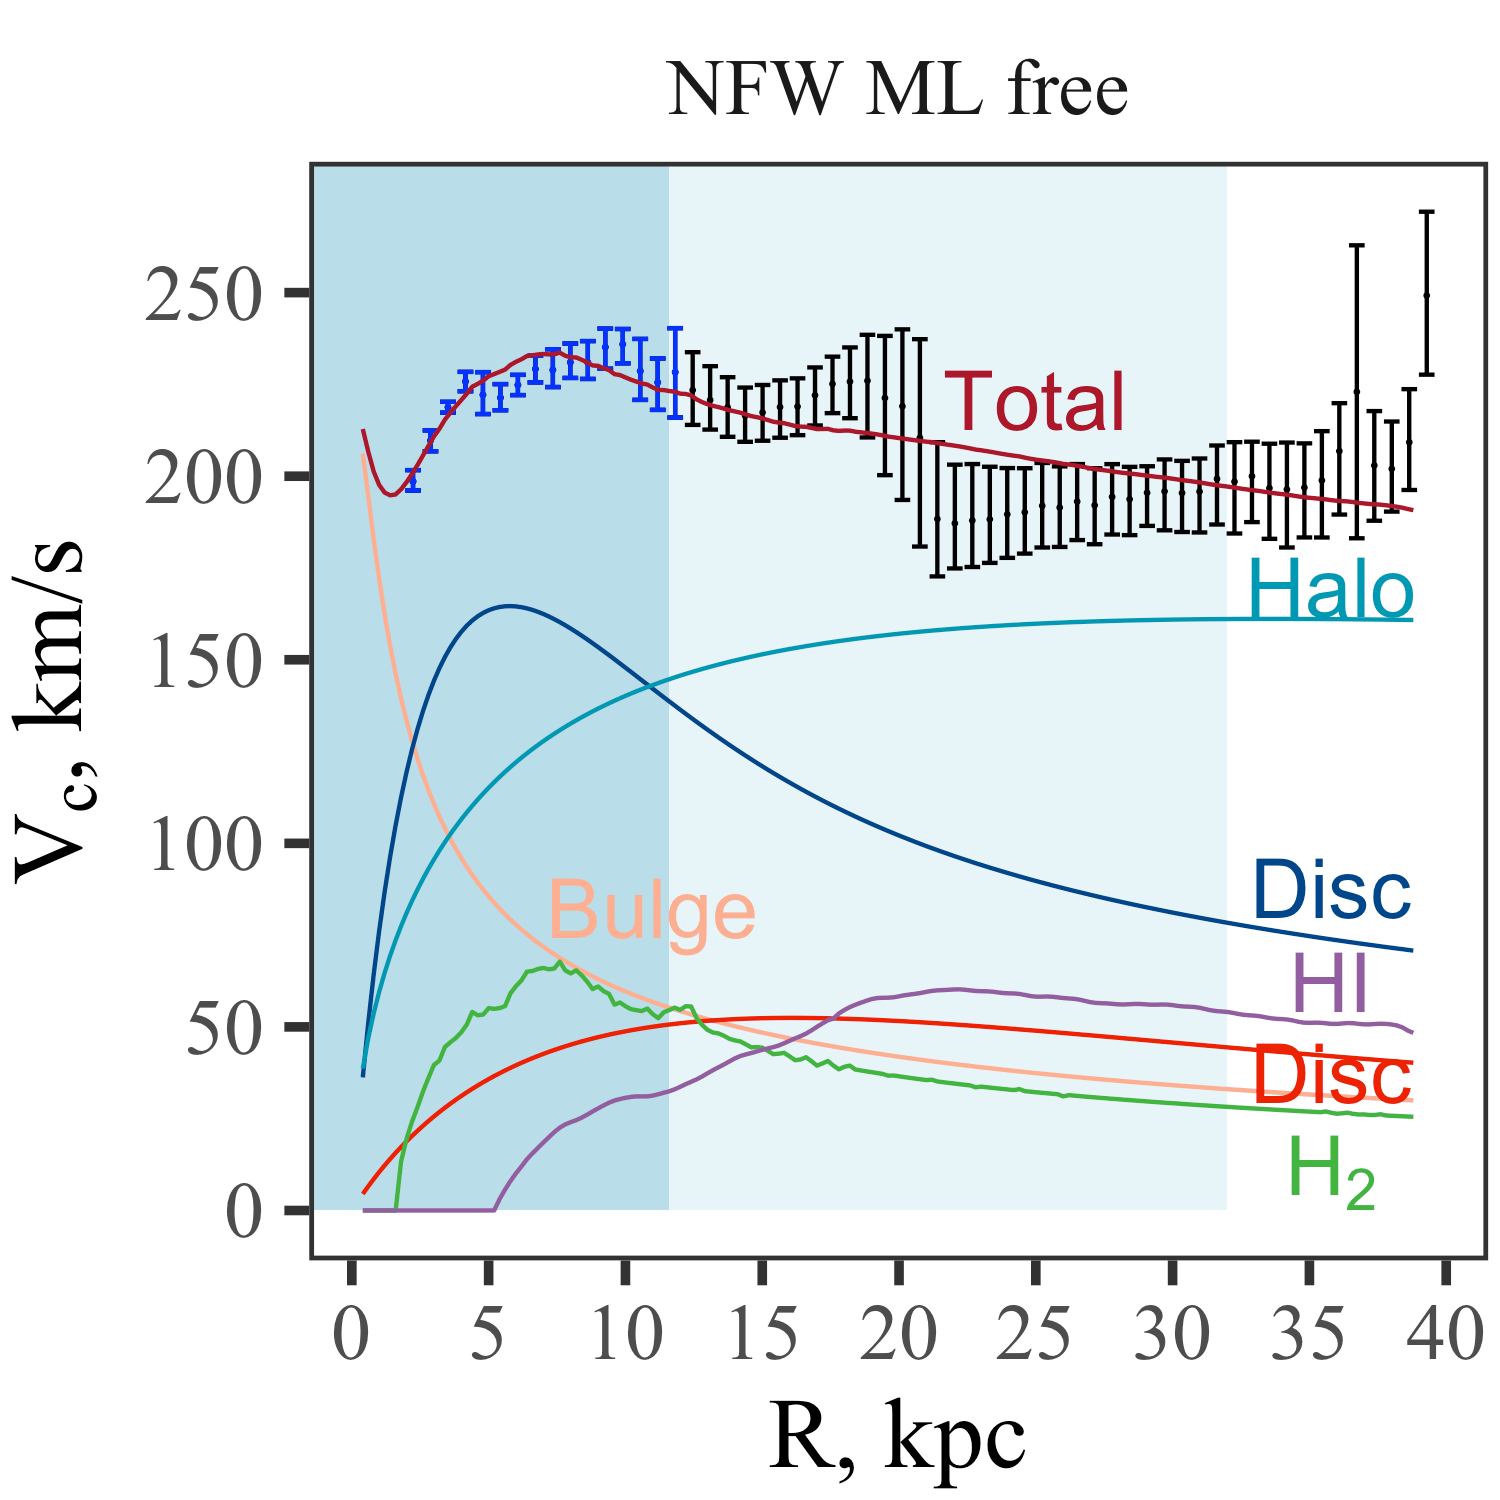
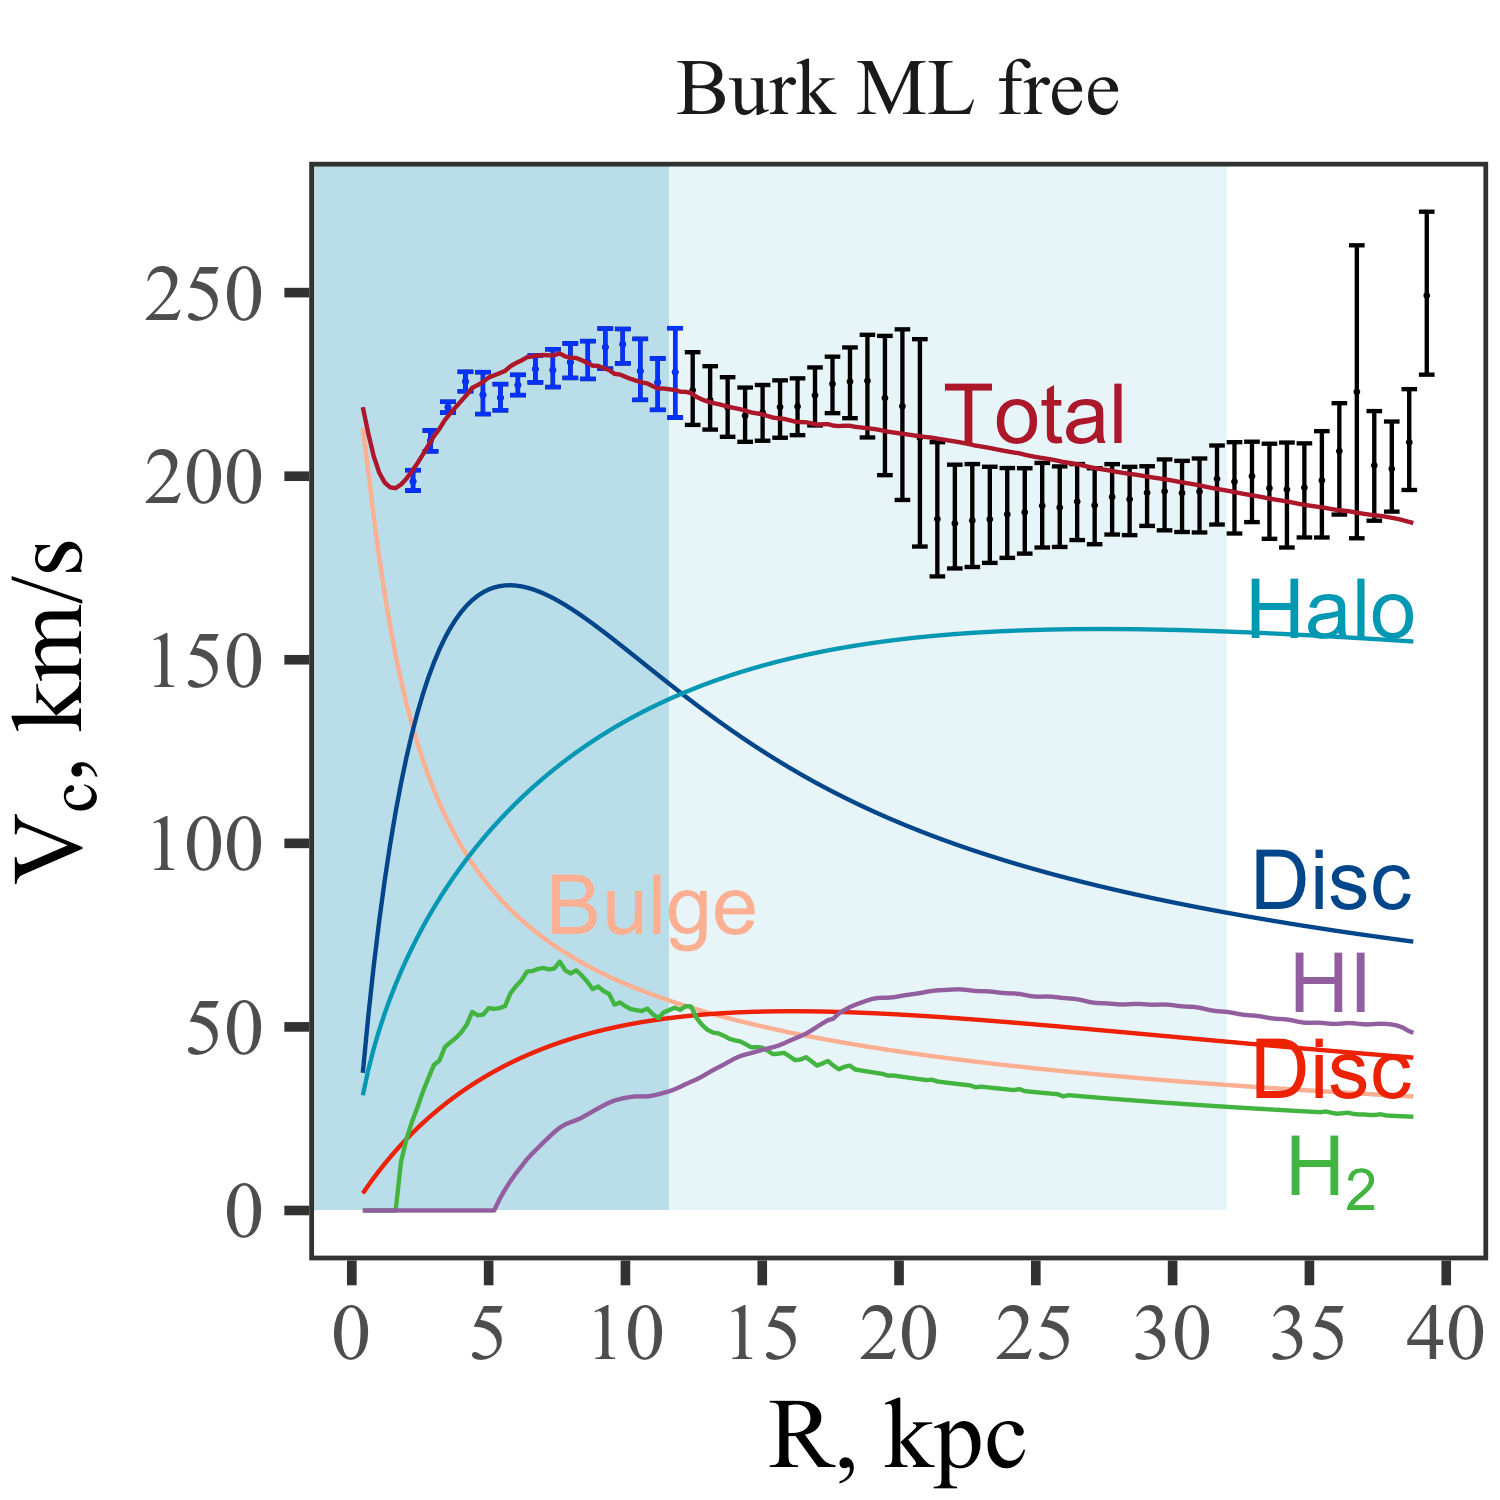
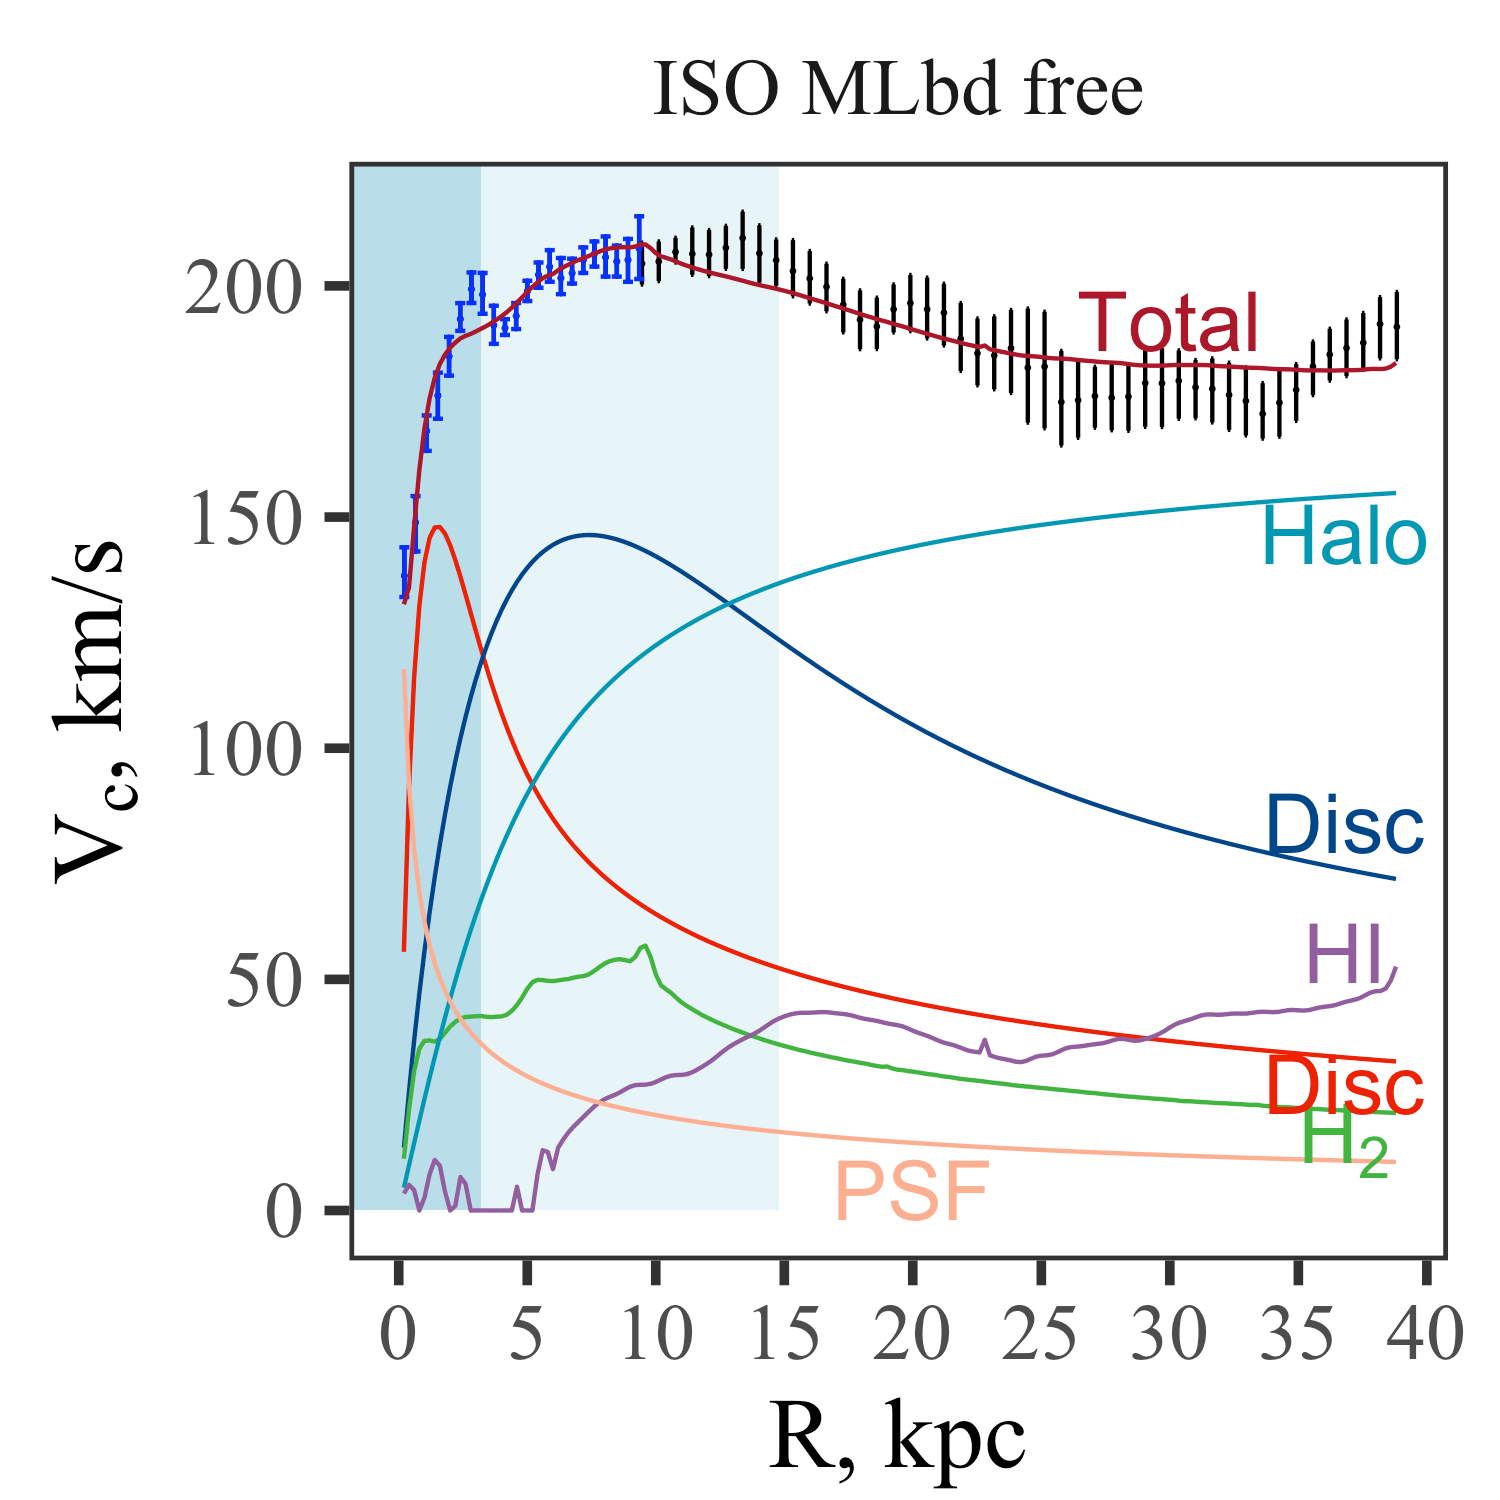
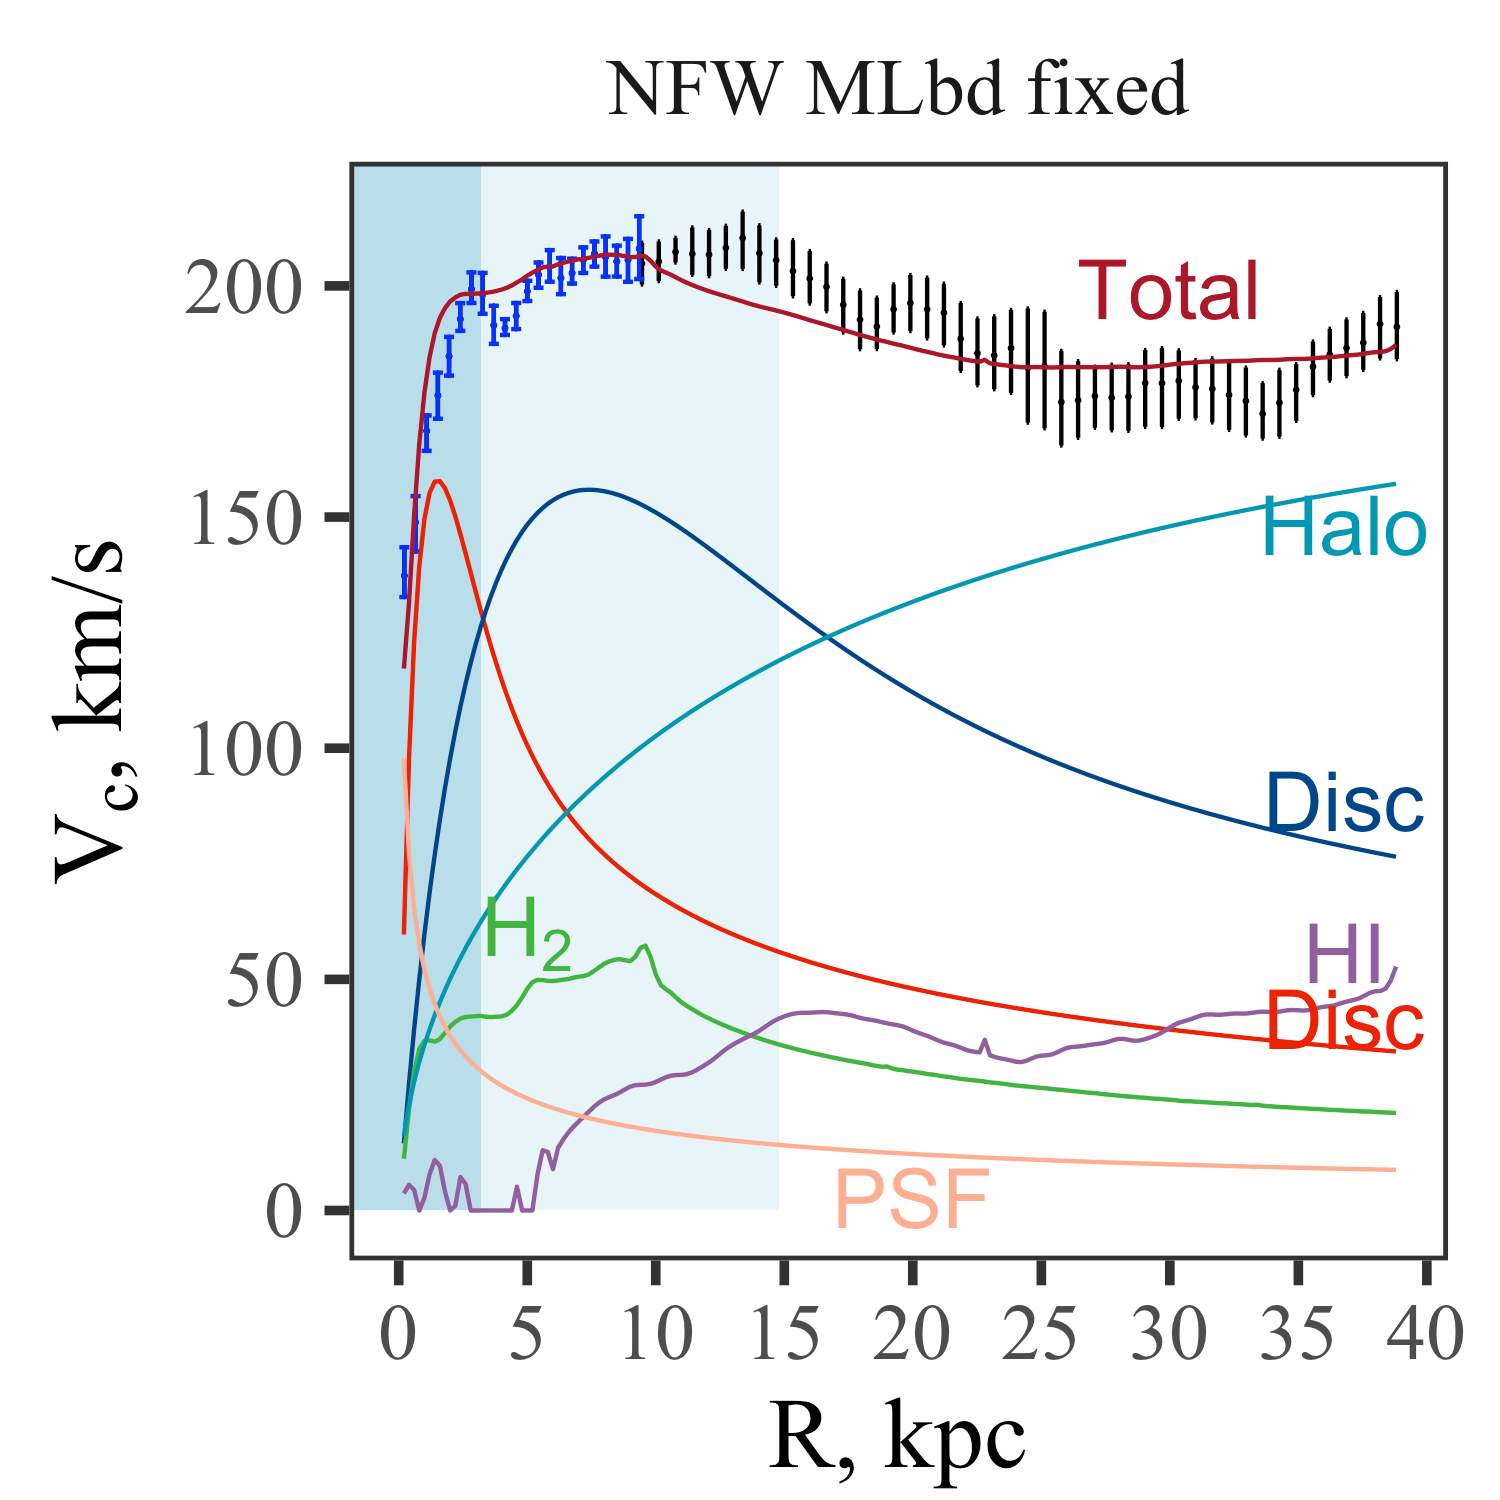
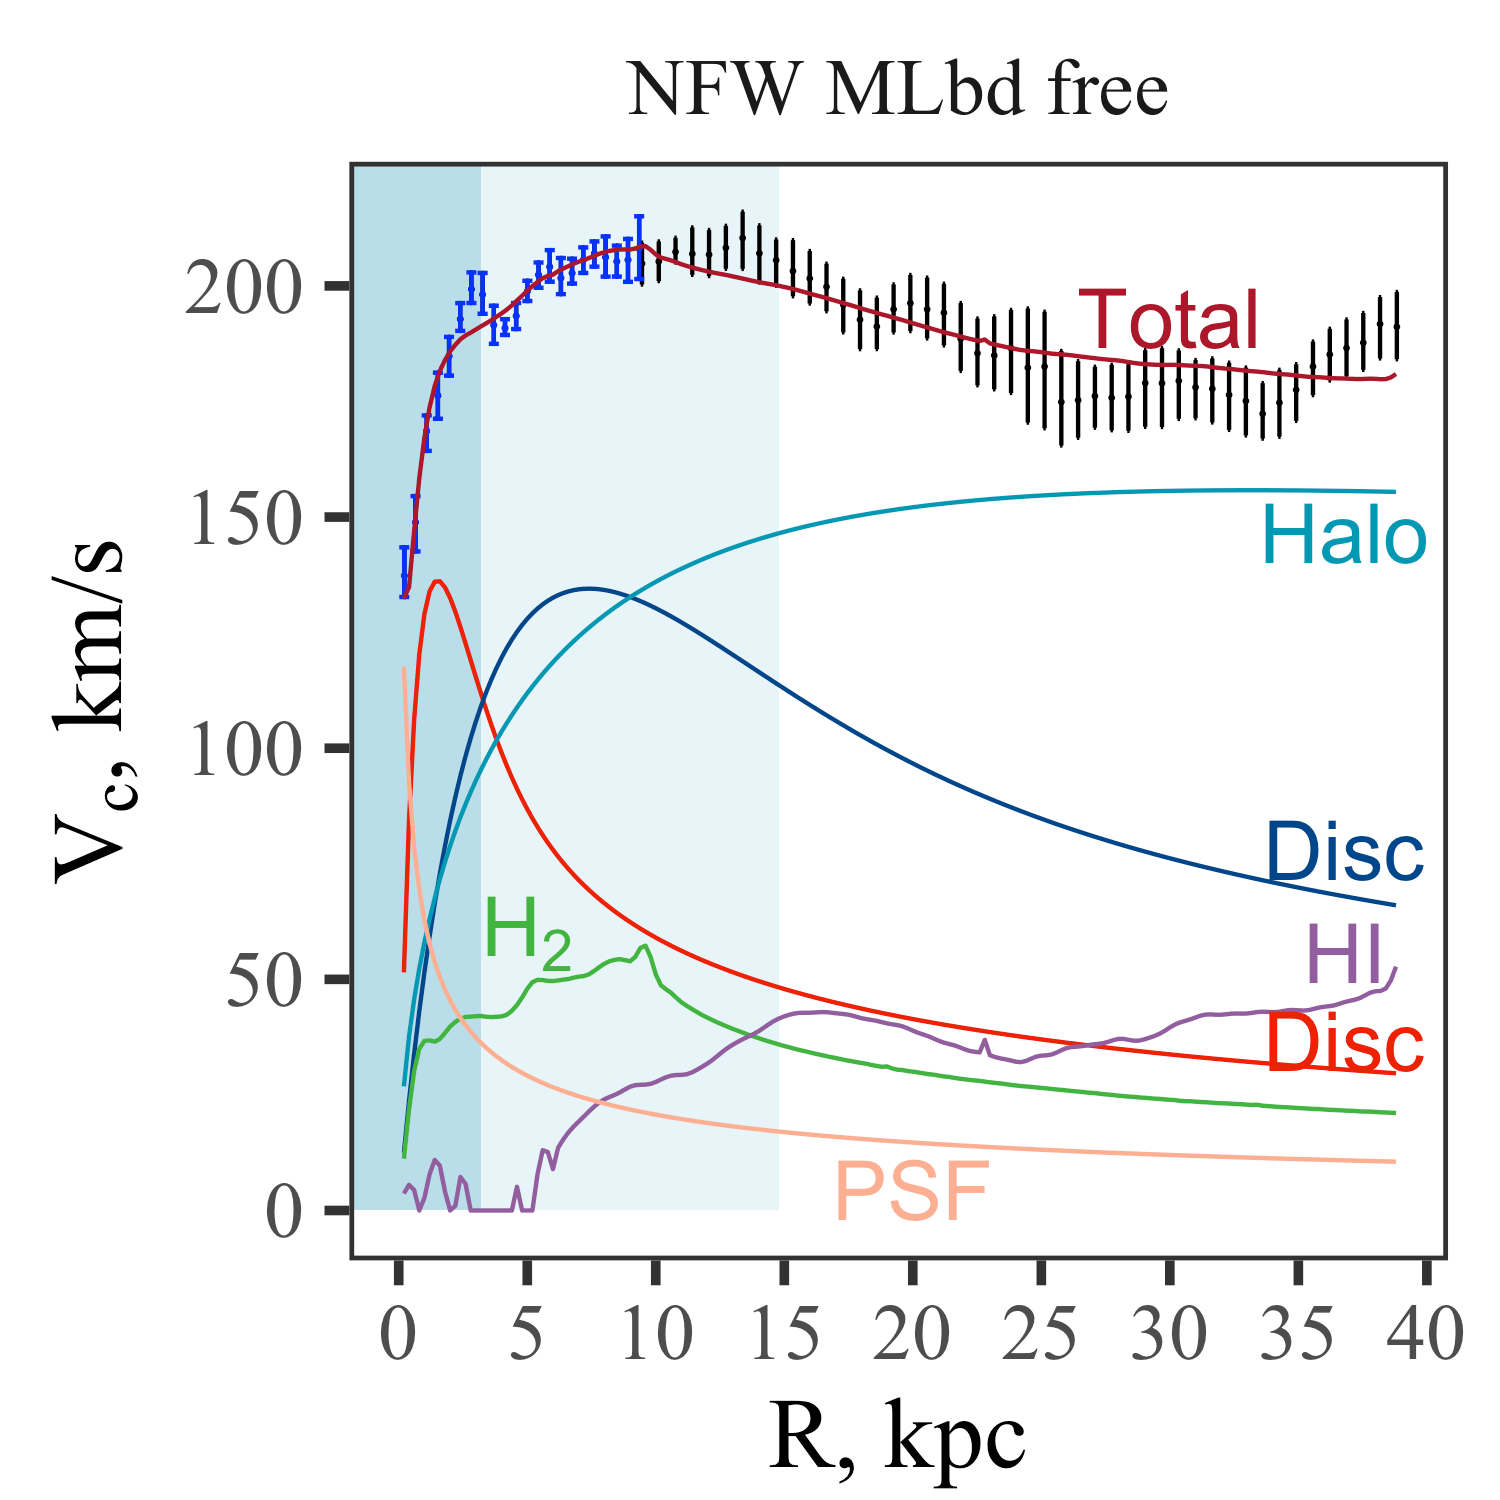
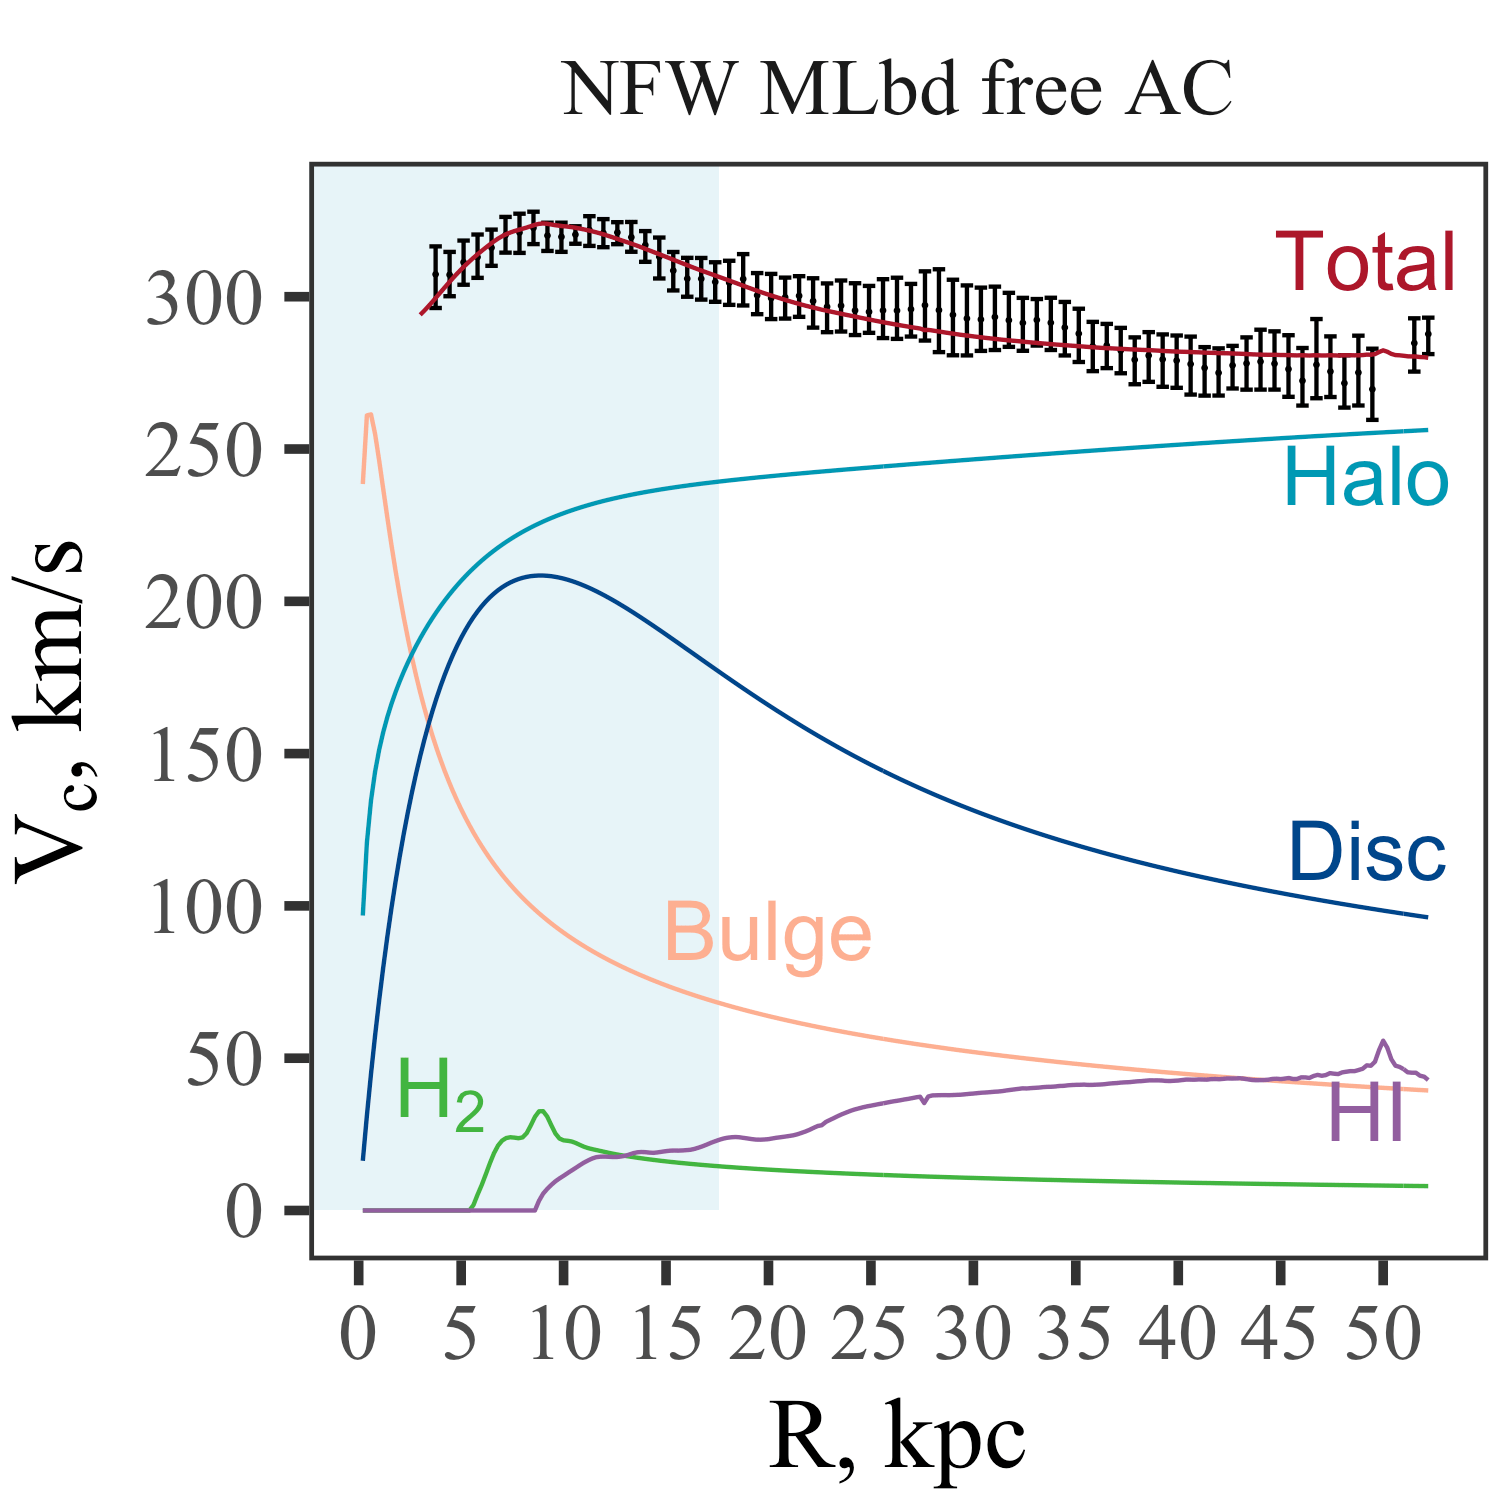
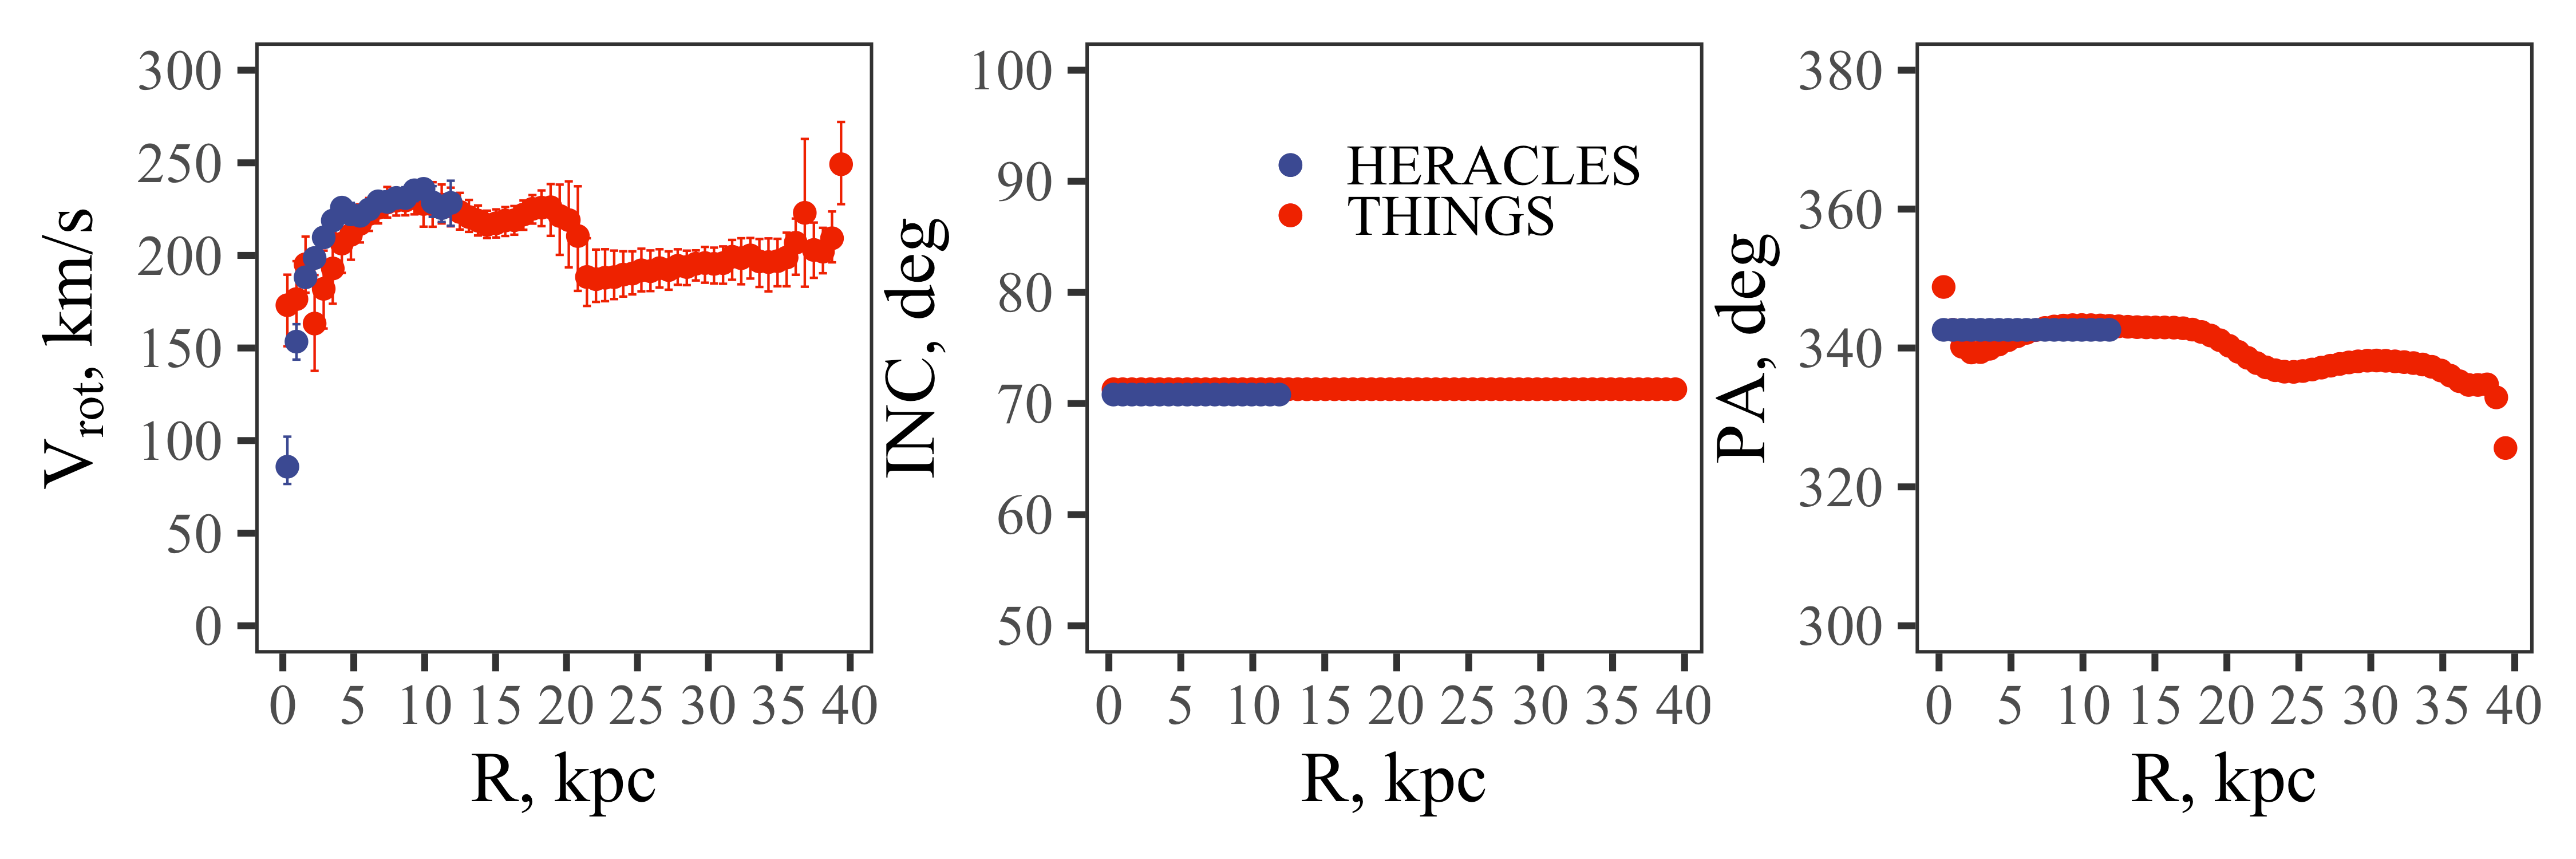
The rotation curve of this galaxy is traced up to 50 kpc and shows a gentle but clear fall by km/s. If the value of is fixed at 0.48, which corresponds to the Kroupa IMF, then all the obtained solutions will give high values of . The best solution with a minimal value of can be reached if and are free parameters. In this case, the values of are obtained at the upper boundary of this value for the “diet” Salpeter IMF taking into account calibration errors (1.0), regardless of the dark halo model. The parameters of the NFW halo correspond to the cosmological models and are very close to the parameters given by Mancera Piña et al. (2022) for the free ratio . Although in this work the ratio was set as with in a small range of values around 1.4, and in our case this ratio was a completely free parameter, without any restrictions, we obtained for this model. The resulting mass of the disc approximately equal to the mass of the dark halo within four exponential scales of the disc (for all types of halo). This is seen in Fig. 4–5 (right plots) and in Fig. 6: at , the circular speed associated with the disc alone is greater than the circular speed associated with the halo alone. The halo-to-baryonic mass ratio within four exponential scales of the disc varies from 0.8 to 1.2 for the free parameter (see Tables 4-6).
Given the tendency to get the best solution with a higher value of , we examined the solutions when fixing the ratio , which corresponds to the “diet” Salpeter IMF. For all models, a stellar disc does not show itself as baryon-dominated, but the total mass of baryonic matter (disc bulge gas) turns out to be only slightly less than the mass of the dark matter within four exponential scales of the disc (Figs. 4- 5, left plots; Tables 4-6). Moreover, as in the case of the free value of , the obtained dark halo parameters remain physical, and for the NFW model, they are consistent with cosmological simulations (see Section 6 and Fig 17), although the concentration parameter is somewhat overestimated. Halo parameters are compiled in Tables 4-6.
5.2 NGC 3521
NGC 3521 is a spiral galaxy in the constellation Leo.
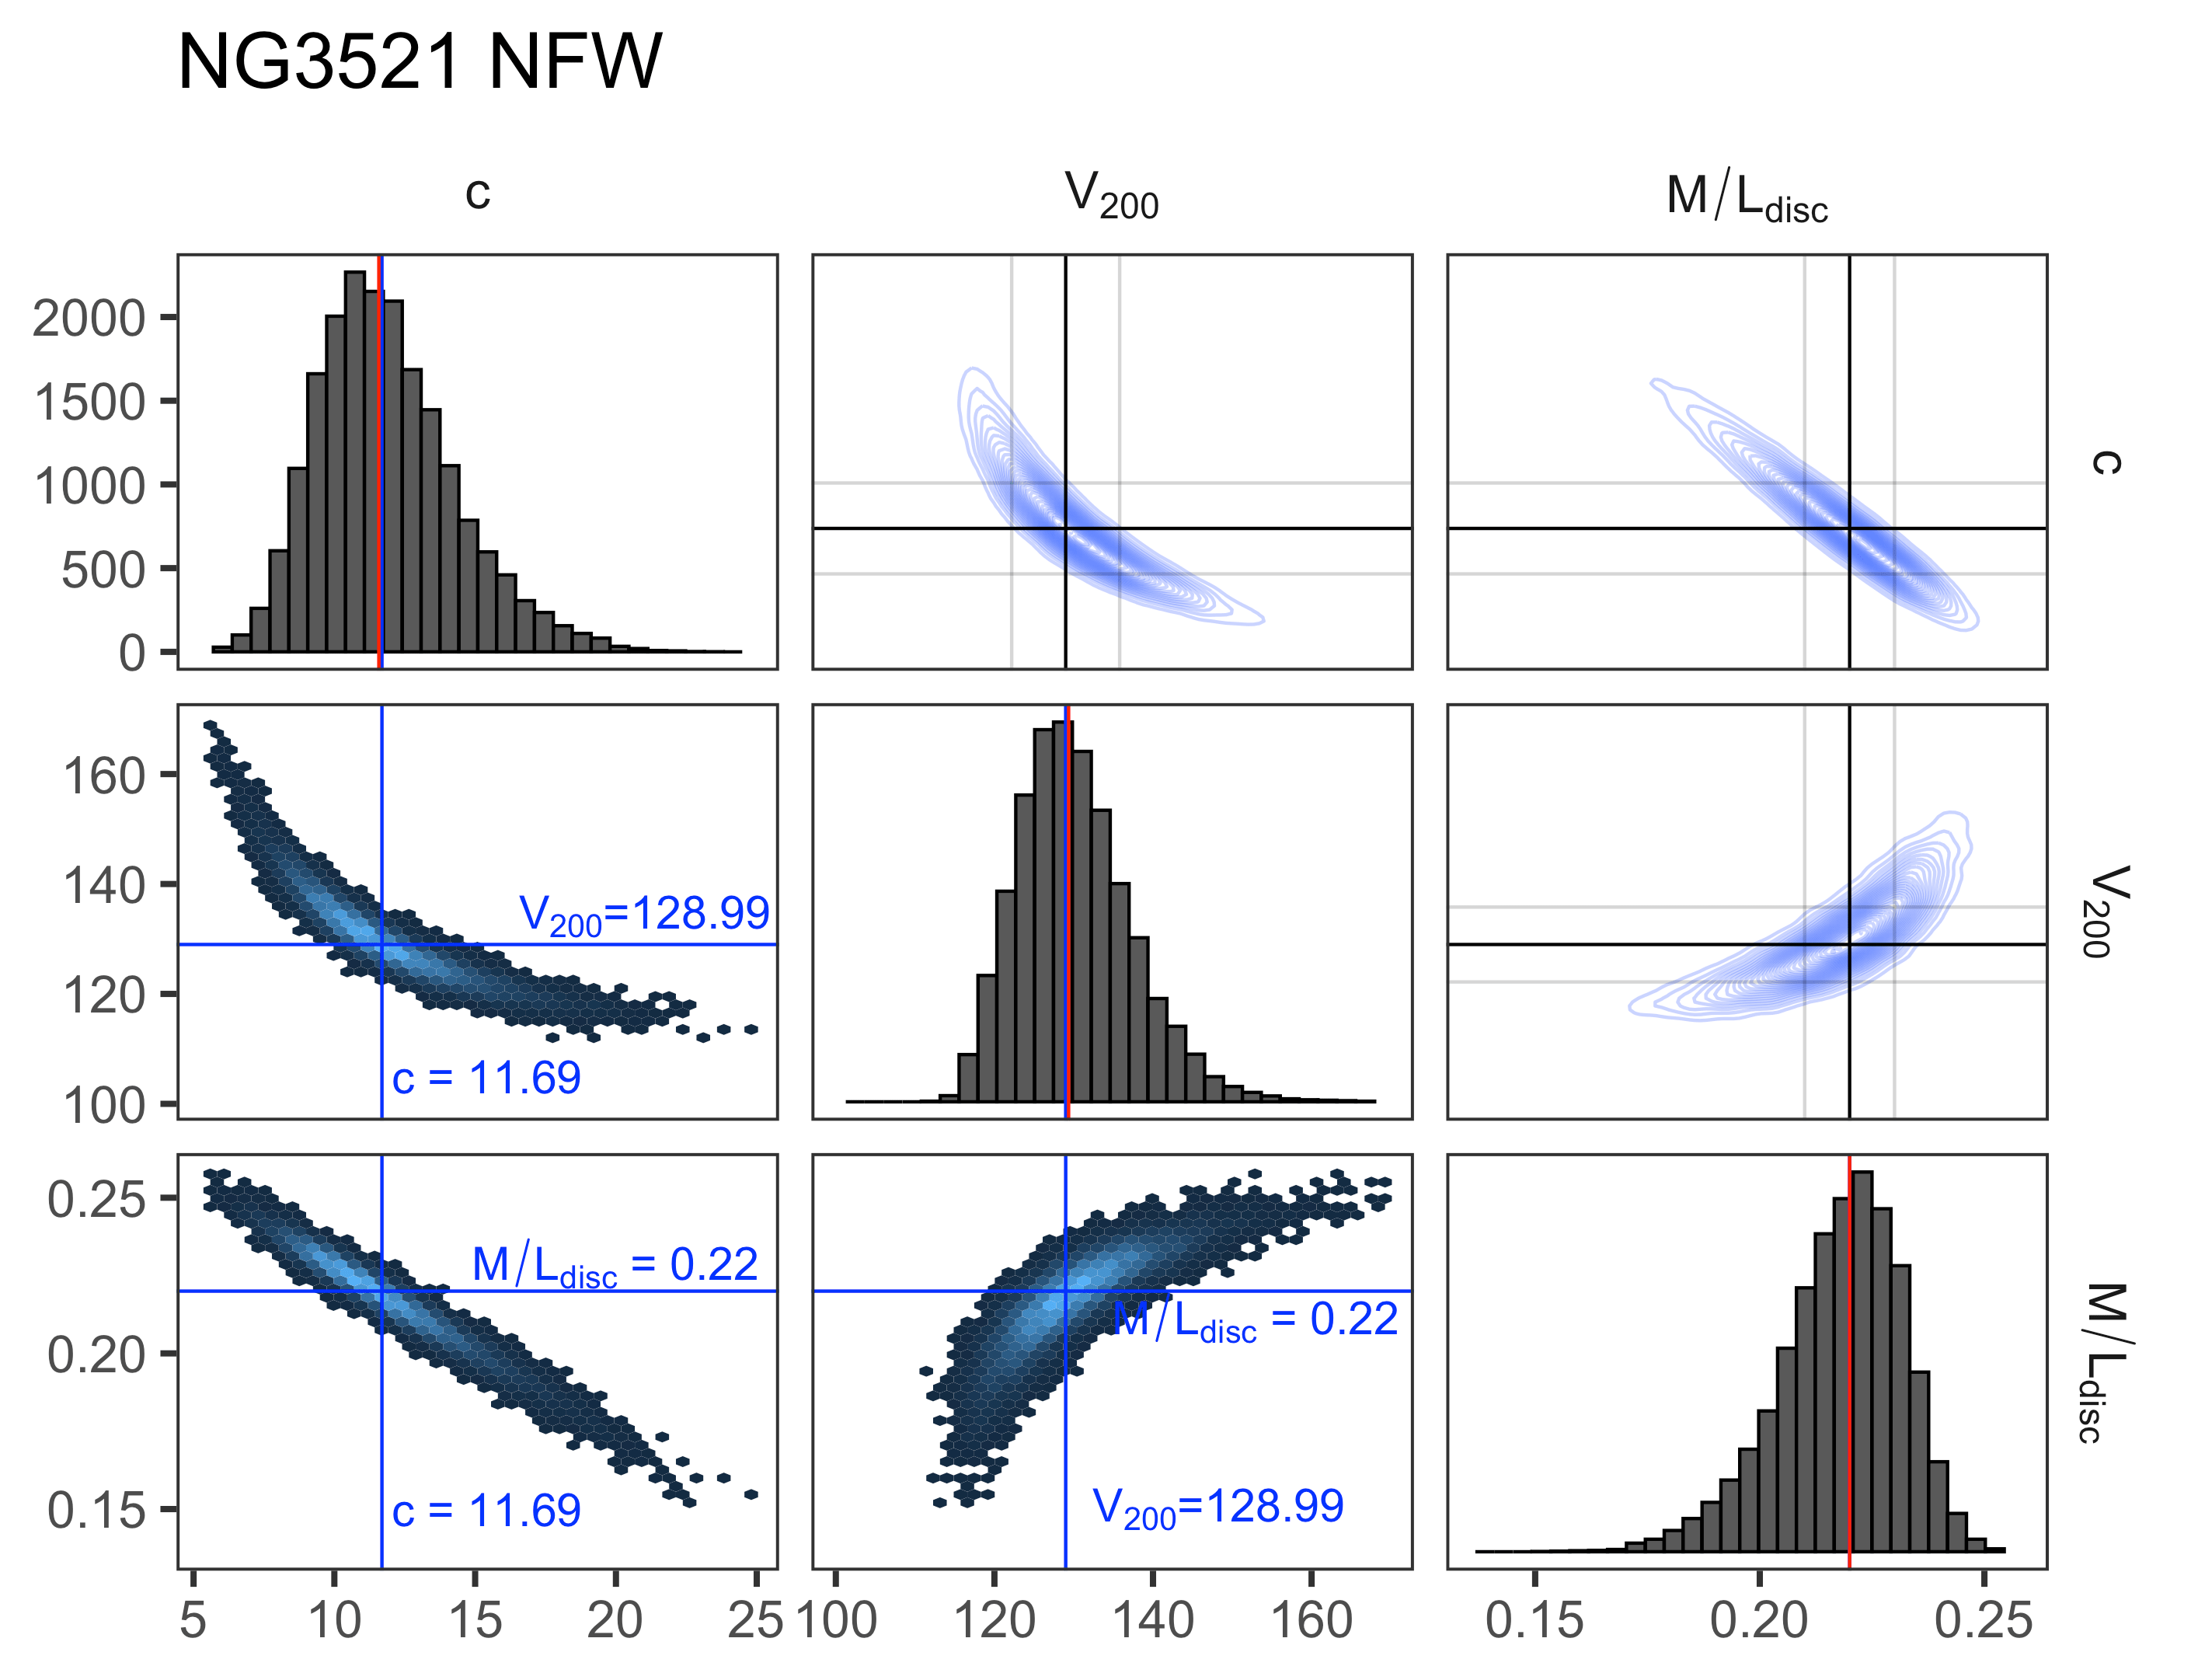
The rotation curve of the galaxy NGC 3521 shows a general decrease in the velocity of about 40 km/s (from 235 km/s at 155 arcsec to 200 km/s at 600 arcsec). This drop is created mainly by a sharp jump at about arcsec. The gap may be related to a very perturbed and asymmetric kinematics (e.g. Casertano & van Gorkom, 1991). This is confirmed by other authors (de Blok et al., 2008; Di Teodoro & Peek, 2021) and by our major-axis position-velocity diagram. Casertano & van Gorkom (1991) suggested that this galaxy experienced some interaction. However, the galaxy has the regular morphology. Due to perturbed kinematics the rotation curve of the cold gas might not trace well the gravitational potential (and thus the mass distribution) of this galaxy. However, we decided to leave this galaxy for further analysis, since in the central regions the rotation curve follows the rotation curve of a more massive disc surprisingly well. At the same time, in the very outer parts the approaching and receding sides of the rotation curve are symmetric.
Even for the contribution of the disc component is overestimated. When this ratio is set to be free it decreases substantially and the modelled rotation curve better describes the observed one. Due to the high inclination, the central part of the rotation curve, where the bulge should dominate and give a sharp gradient, is not very reliable even for the HERACLES’ data (for the effects of the inclination in the central regions, see, for example, Zasov & Khoperskov, 2003; Stepanova & Volkov, 2013 and Frank et al., 2016, their figure 3). We excluded very central points from the analysis. This galaxy has a bulge that contributes 10% to the luminosity. The absence of central points leads to a somewhat underestimated value of the ratio when this parameter is freely varied. A fixed value of compatible with the stellar population synthesis models (for example, Querejeta et al., 2015) leads to a slight redistribution of the baryon mass between the bulge and disc but does not significantly affect the parameters of the dark halo. Although the observed rotation curve that we analyze does not support the result by Casertano & van Gorkom (1991) about the falling rotation curve, all our model rotation curves that give the best solution show a downward trend.
Regardless of the halo type, this galaxy does not have an increased content of baryon matter within four exponential scales of an outer disc. For a free value of , the ratio of the dark matter mass within to the total mass of the baryon, including gas, turns out to be greater than 1.0. It should be noted that the outer disc, although extended, is low-mass444Its mass is almost 4 times less than the mass of the inner disc. and it unlikely can affect the dynamics of the galaxy. If we consider the area within , then the galaxy has undoubtedly reduced content of the dark matter, with (Tables 4-6). The same was noted in de Blok et al. (2008), where the disc component considered as a single component.
5.3 NGC 5055
NGC 5055 (M63, The Sunflower Galaxy) is a disc galaxy in the constellation Canes Venatici. It has a flocculent structure, no visible bar, and its photometric profile shows two discs.
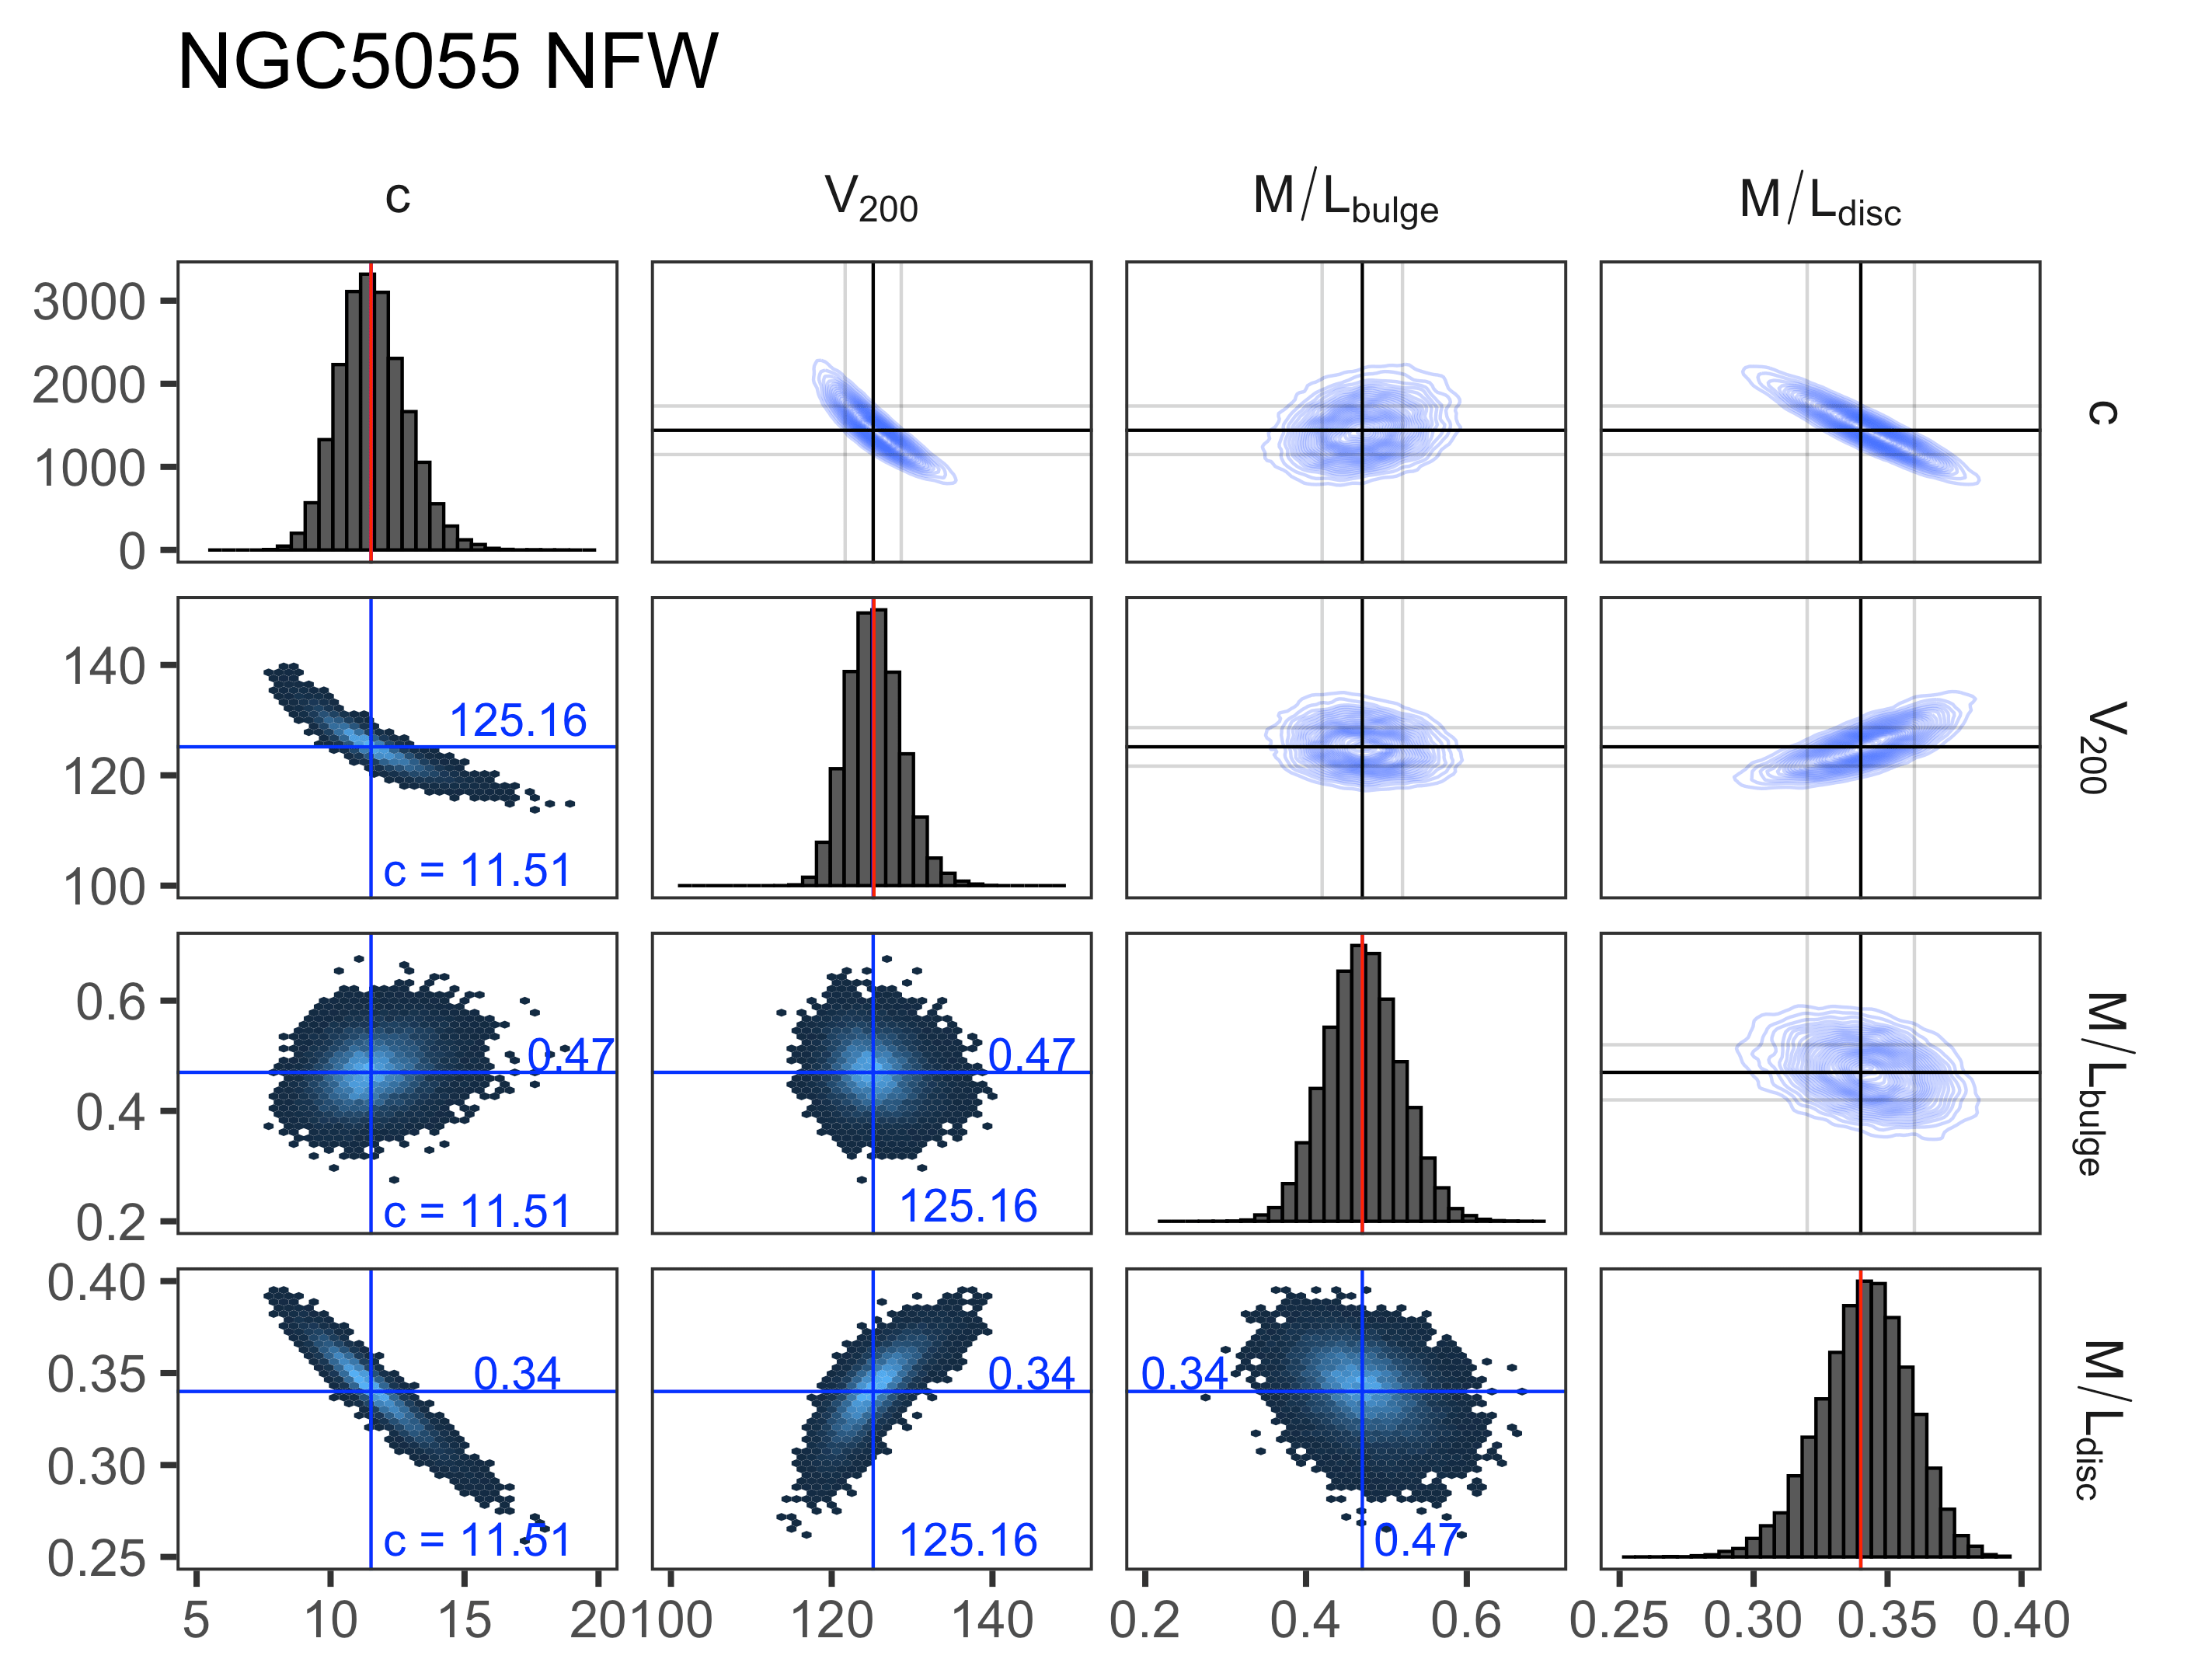
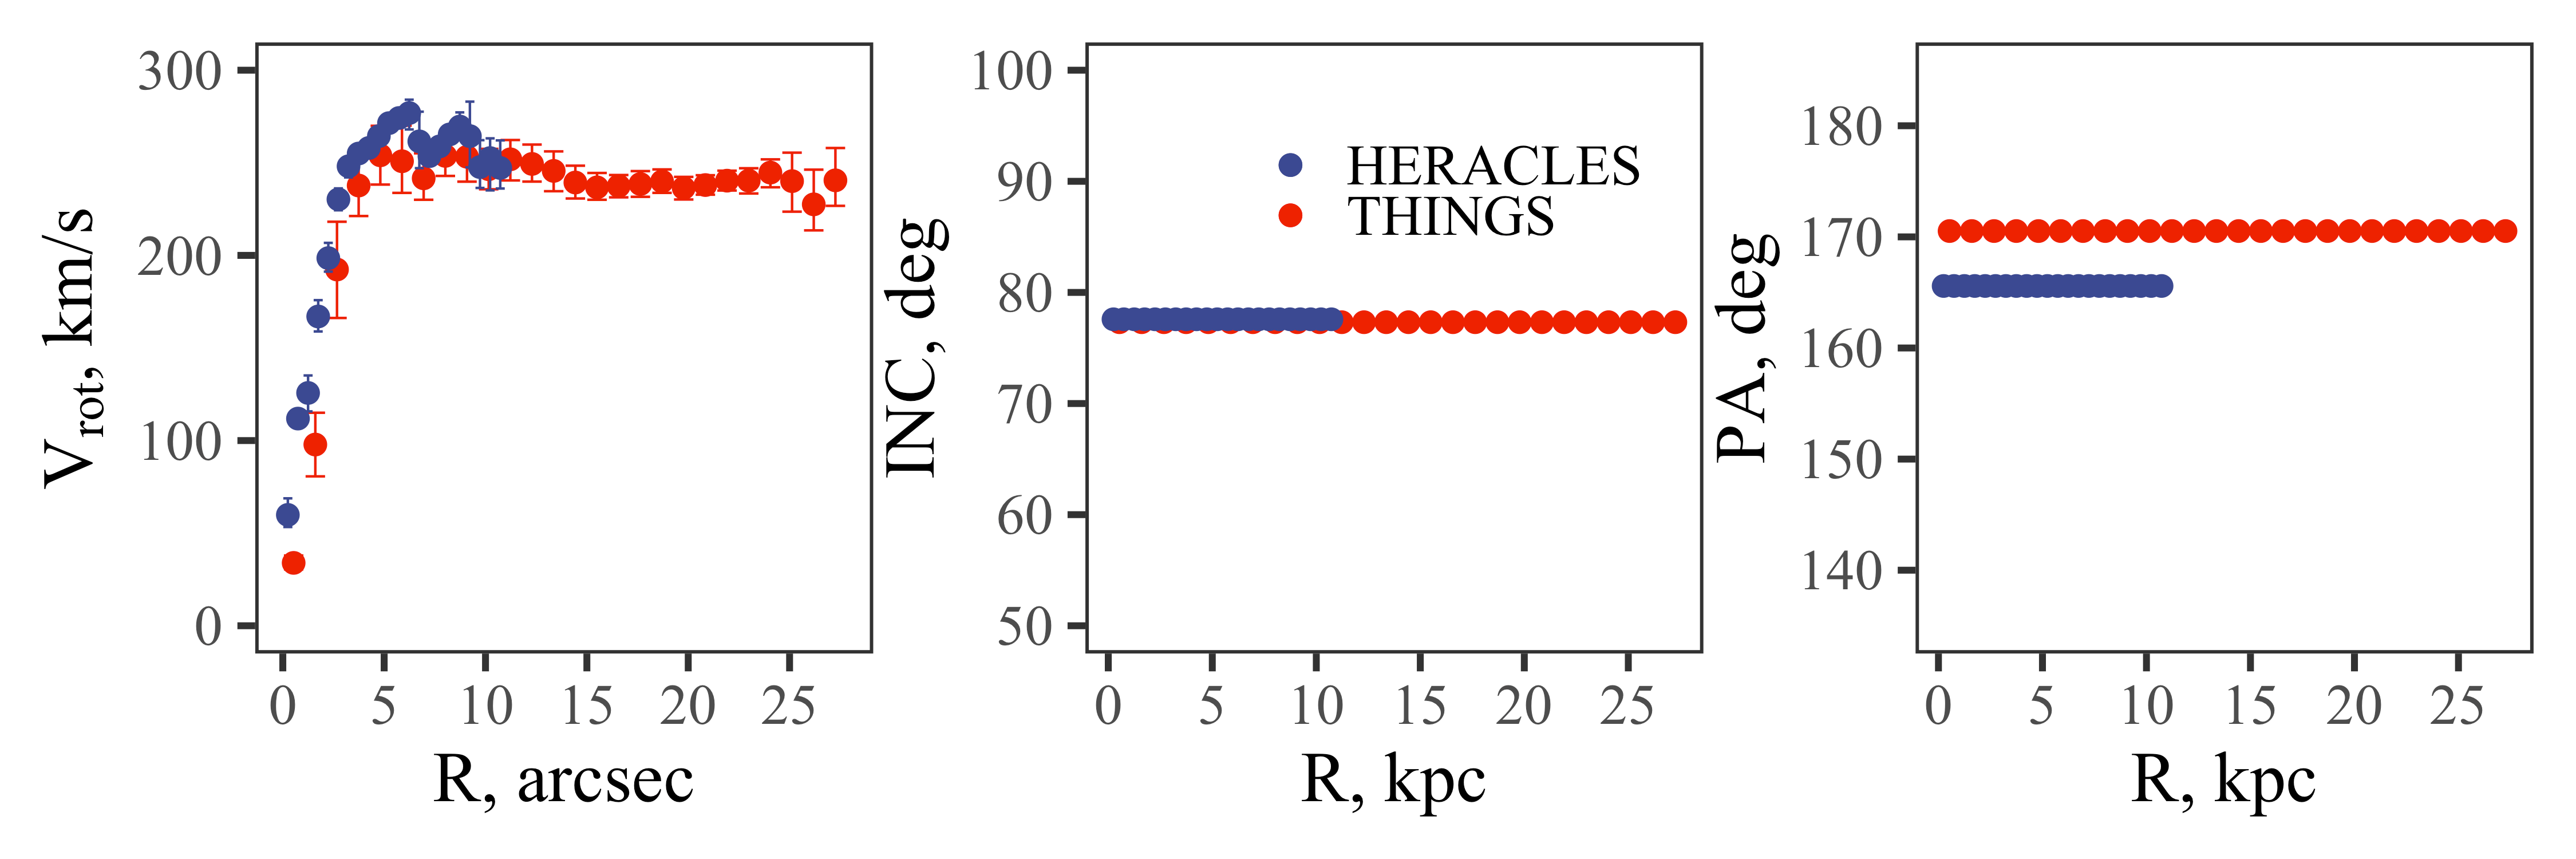
The rotation curve of NGC 5055 extends to 900 arcsec ( kpc) and has a maximal rotation speed of km/s at kpc. It shows a minor fall by km/s. A stronger fall down in the rotation curve was observed in the data by de Blok et al. (2008) but Di Teodoro & Peek (2021), who took into account the warp of this galaxy, did not confirm the falling character of the rotation curve. Nevertheless, the results of the decomposition with both the isothermal halo (de Blok et al., 2008; Frank et al., 2016) and the NFW halo (Mancera Piña et al., 2022) hint at the fact that the mass of the stellar disc within the optical radius of the galaxy exceeds the mass of the dark matter. In the region arcsec, our rotation curve is in good agreement with the rotation curve by Di Teodoro & Peek (2021), although other observational data were used in that work.
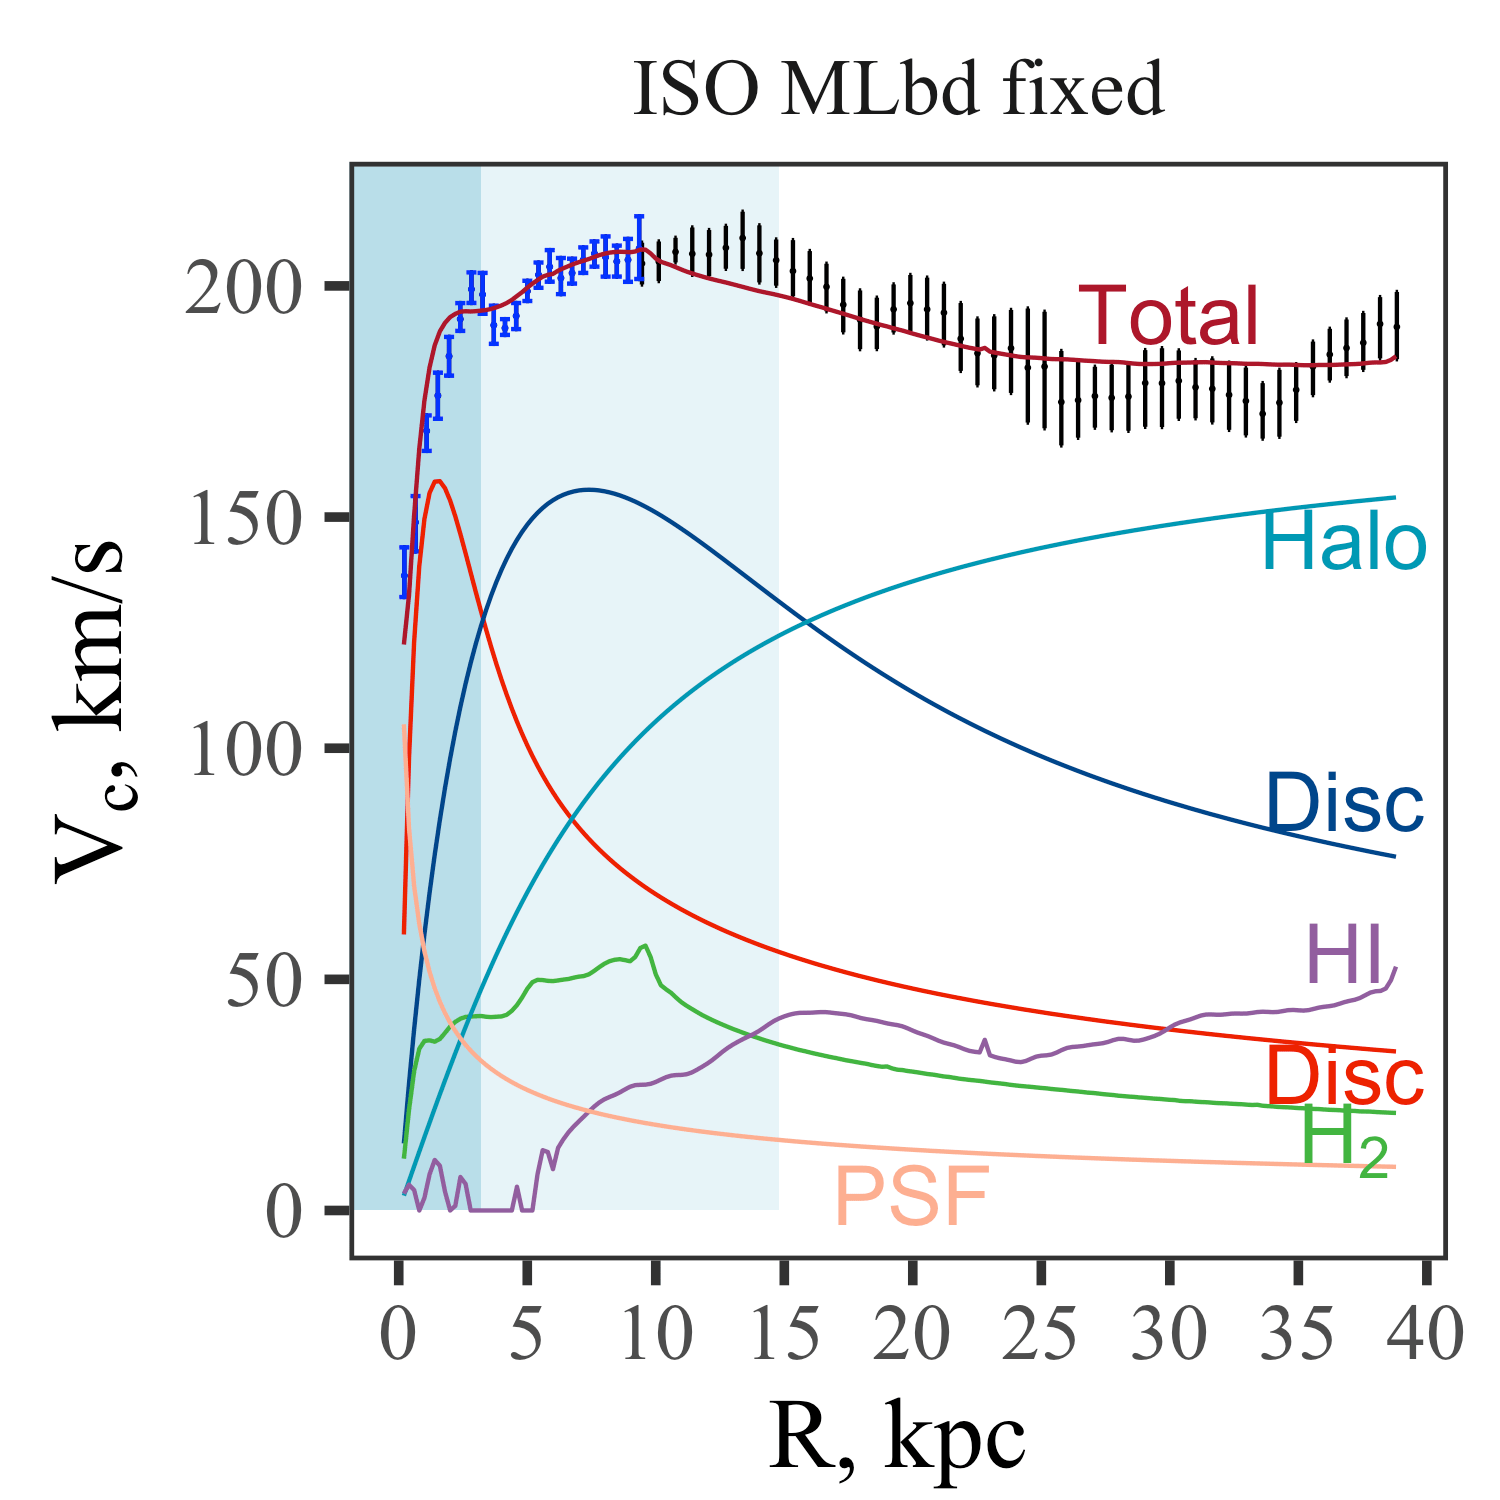
The results of the rotation curve decomposition for the three types of halo (ISO, NFW, Burkert) are given in Tables 4-6. When the parameter is fixed at the value of , regardless of the type of halo, the galaxy has reduced content of the dark matter within four exponential scales of the more extended disc ( kpc). The ratio of the mass of dark matter within four exponential scales of the disc to the baryonic mass was for all types of halos. The situation does not change significantly with the free value of . The total mass of baryonic matter (including gas) within four exponential scales of a larger disc is equal to the mass of the dark matter. The greatest dark to baryonic ratio was obtained for the NFW halo . It should be noted that all six decomposition results are physical, and the parameters of the NFW555If the ratio is considered as a free parameter, the concentration parameter of the NFW halo is slightly overestimated (see Section6 and Fig 17). for all models do not contradict cosmological simulations.


5.4 NGC 7331
NGC 7331 — a spiral barless galaxy in the constellation Pegasus.
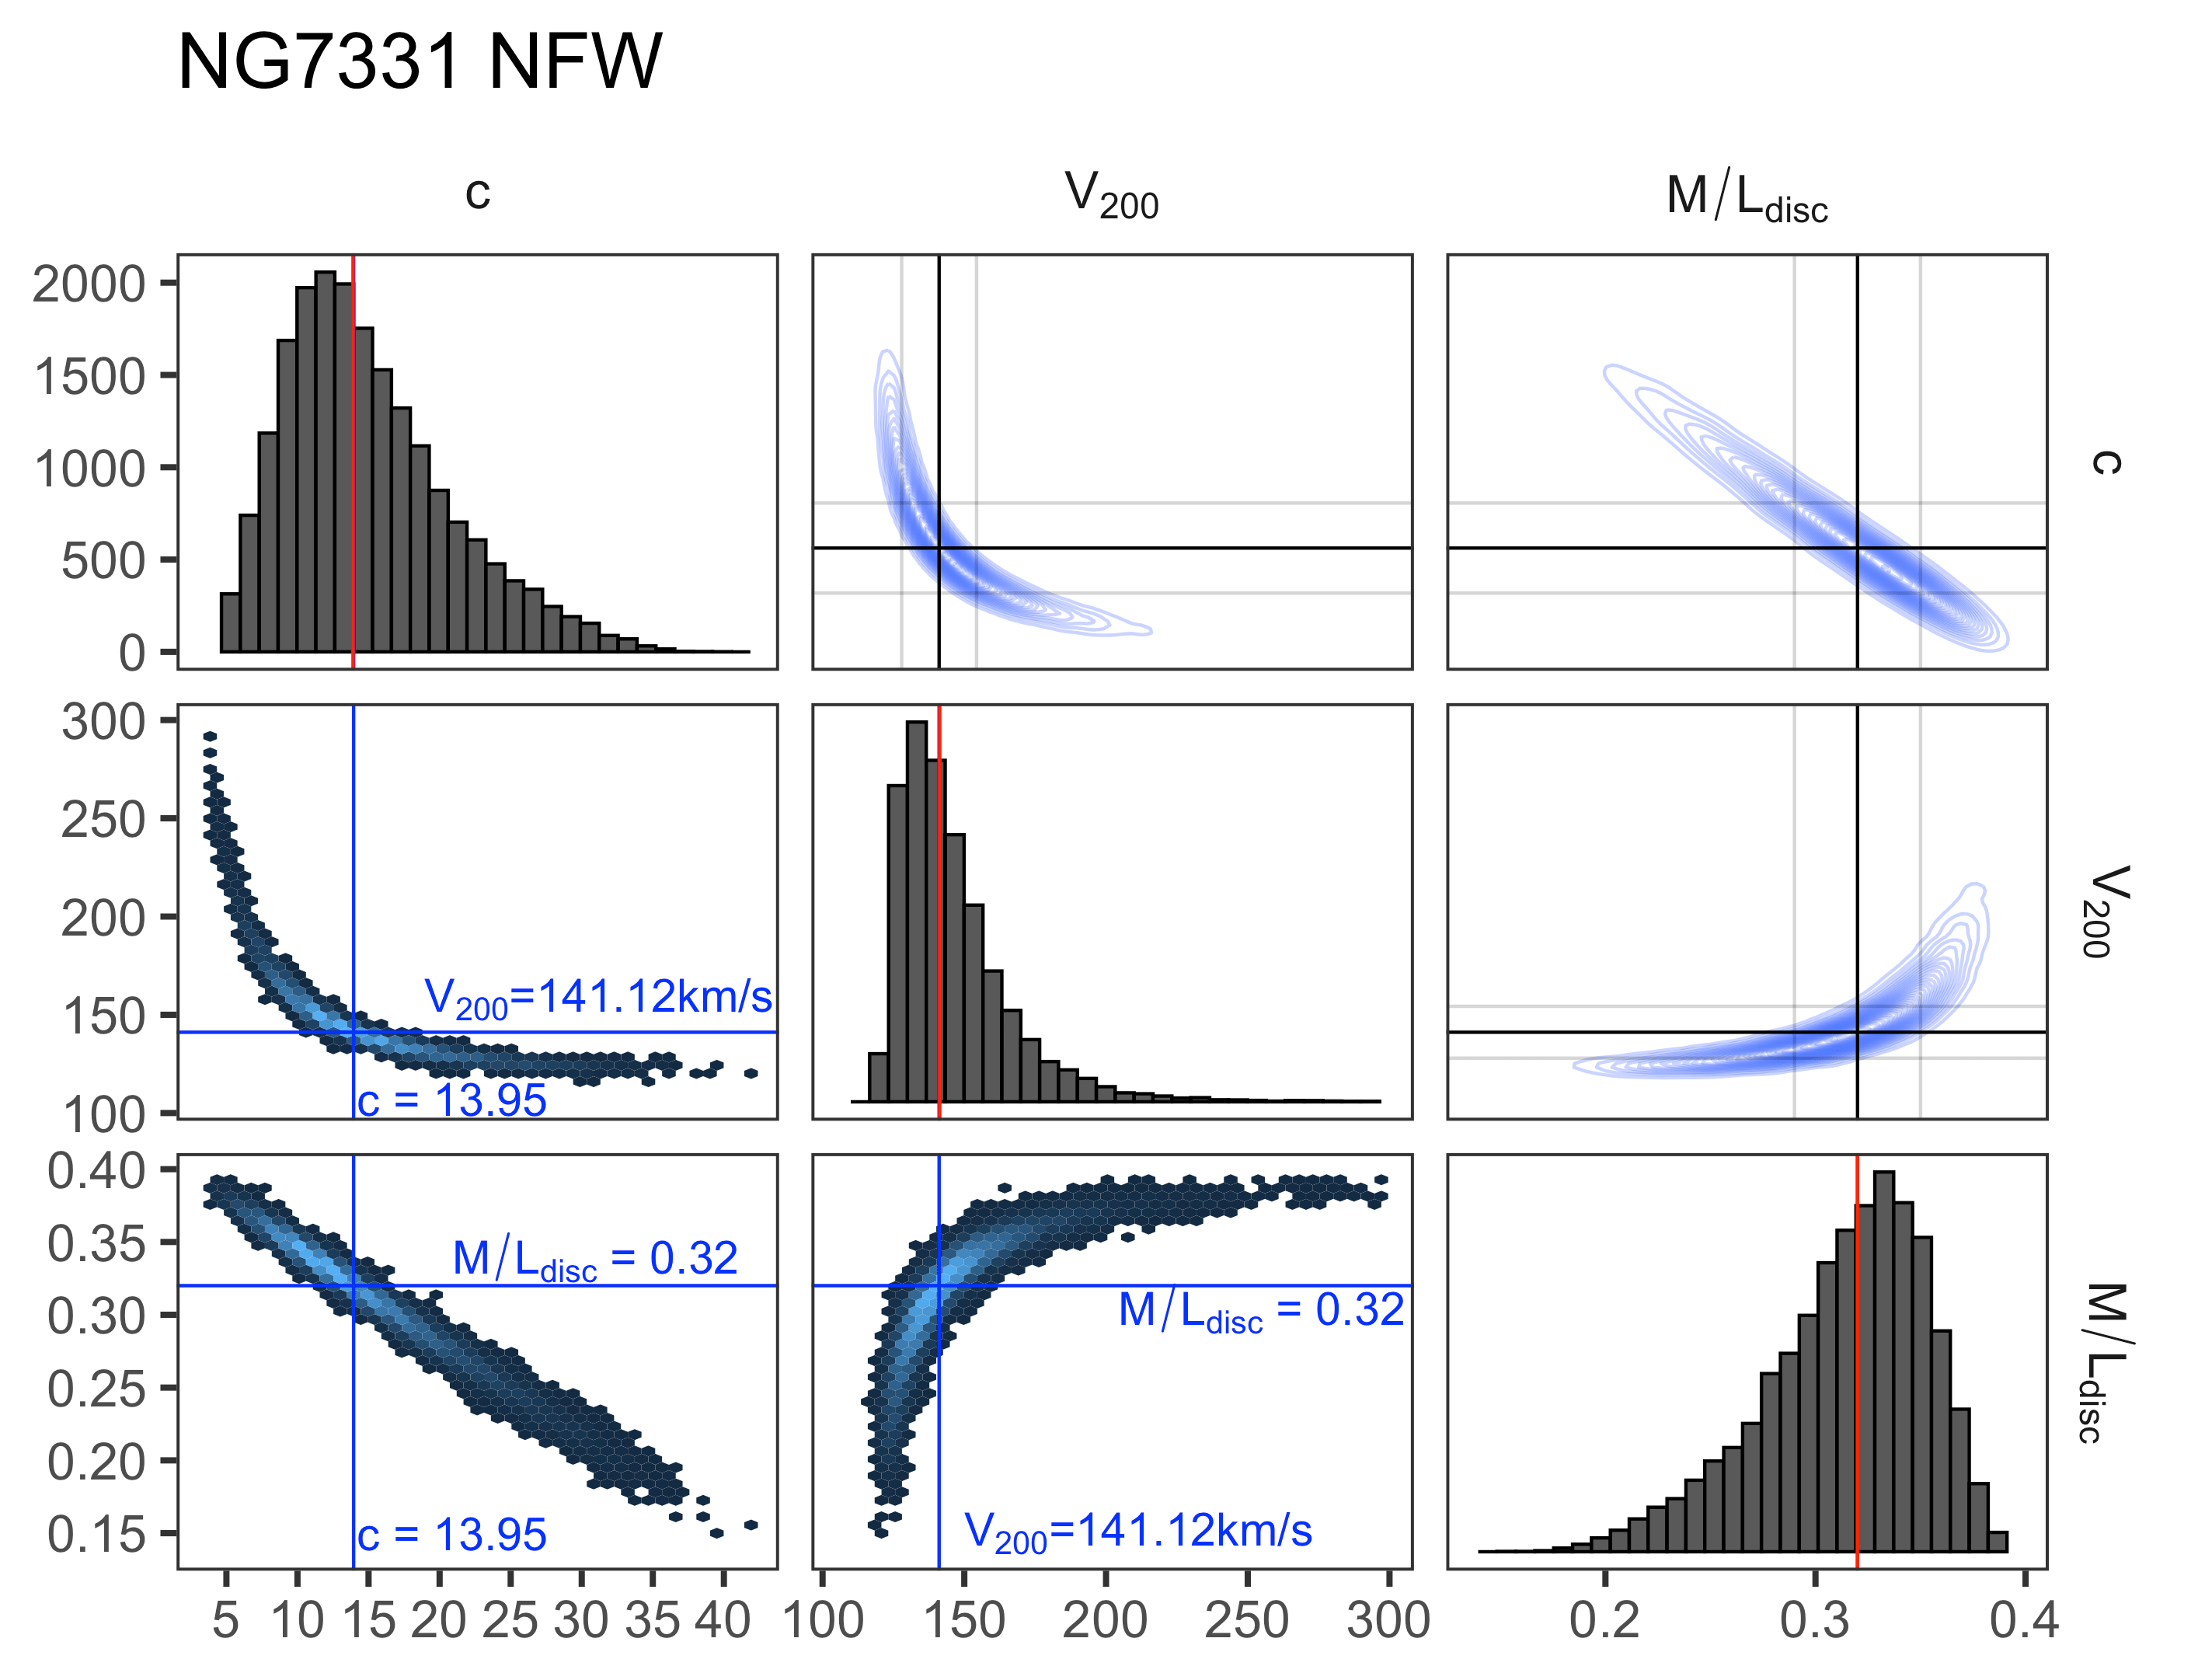
This galaxy has not clearly declining rotation (see de Blok et al. (2008); Di Teodoro & Peek (2021) and the Appendix A). However, the decomposition of the rotation curve of this galaxy (de Blok et al., 2008; Frank et al., 2016; Katz et al., 2014), although not very successful, suggests that the disc rotation curve dominates within optical radius of the galaxy. The absence of a bar and the flocculent structure were also the basis for its analysis in this work. It does not enter in S4G that is why we performed our own photometric decomposition666The photometric model used by de Blok et al. (2008), in which the central exponential disc is singled out, and the rest of the galaxy is treated as an outer disc, although the profile of this component is far from exponential, seems to us too simplified. (Table 2).
For a fixed ratio , the modelled rotation curve does not go beyond the observed curve only for values at the lower boundary of this ratio for the Kroupa IMF (0.47). However, in this case the ratio is too small. The problem here is the same as with the galaxy NGC 3521. NGC 7331 has a high inclination and the bulge contribution to the rotation curve in the central region does not fit well into the observational data, with the inclination effects being significant even for the HERACLES data we used in the central regions. As for the galaxy NGC 3521, we did not take into account the most central points of the rotation curve, since they do not reflect the contribution of the central bulge. If the ratio varies, then the best solutions are obtained even with lower values of if we set the ratio . For all halo models, the galaxy appears to have a reduce content of the dark matter within four exponential scales of the massive inner disc.

6 Scaling relations for the dark halo parameters
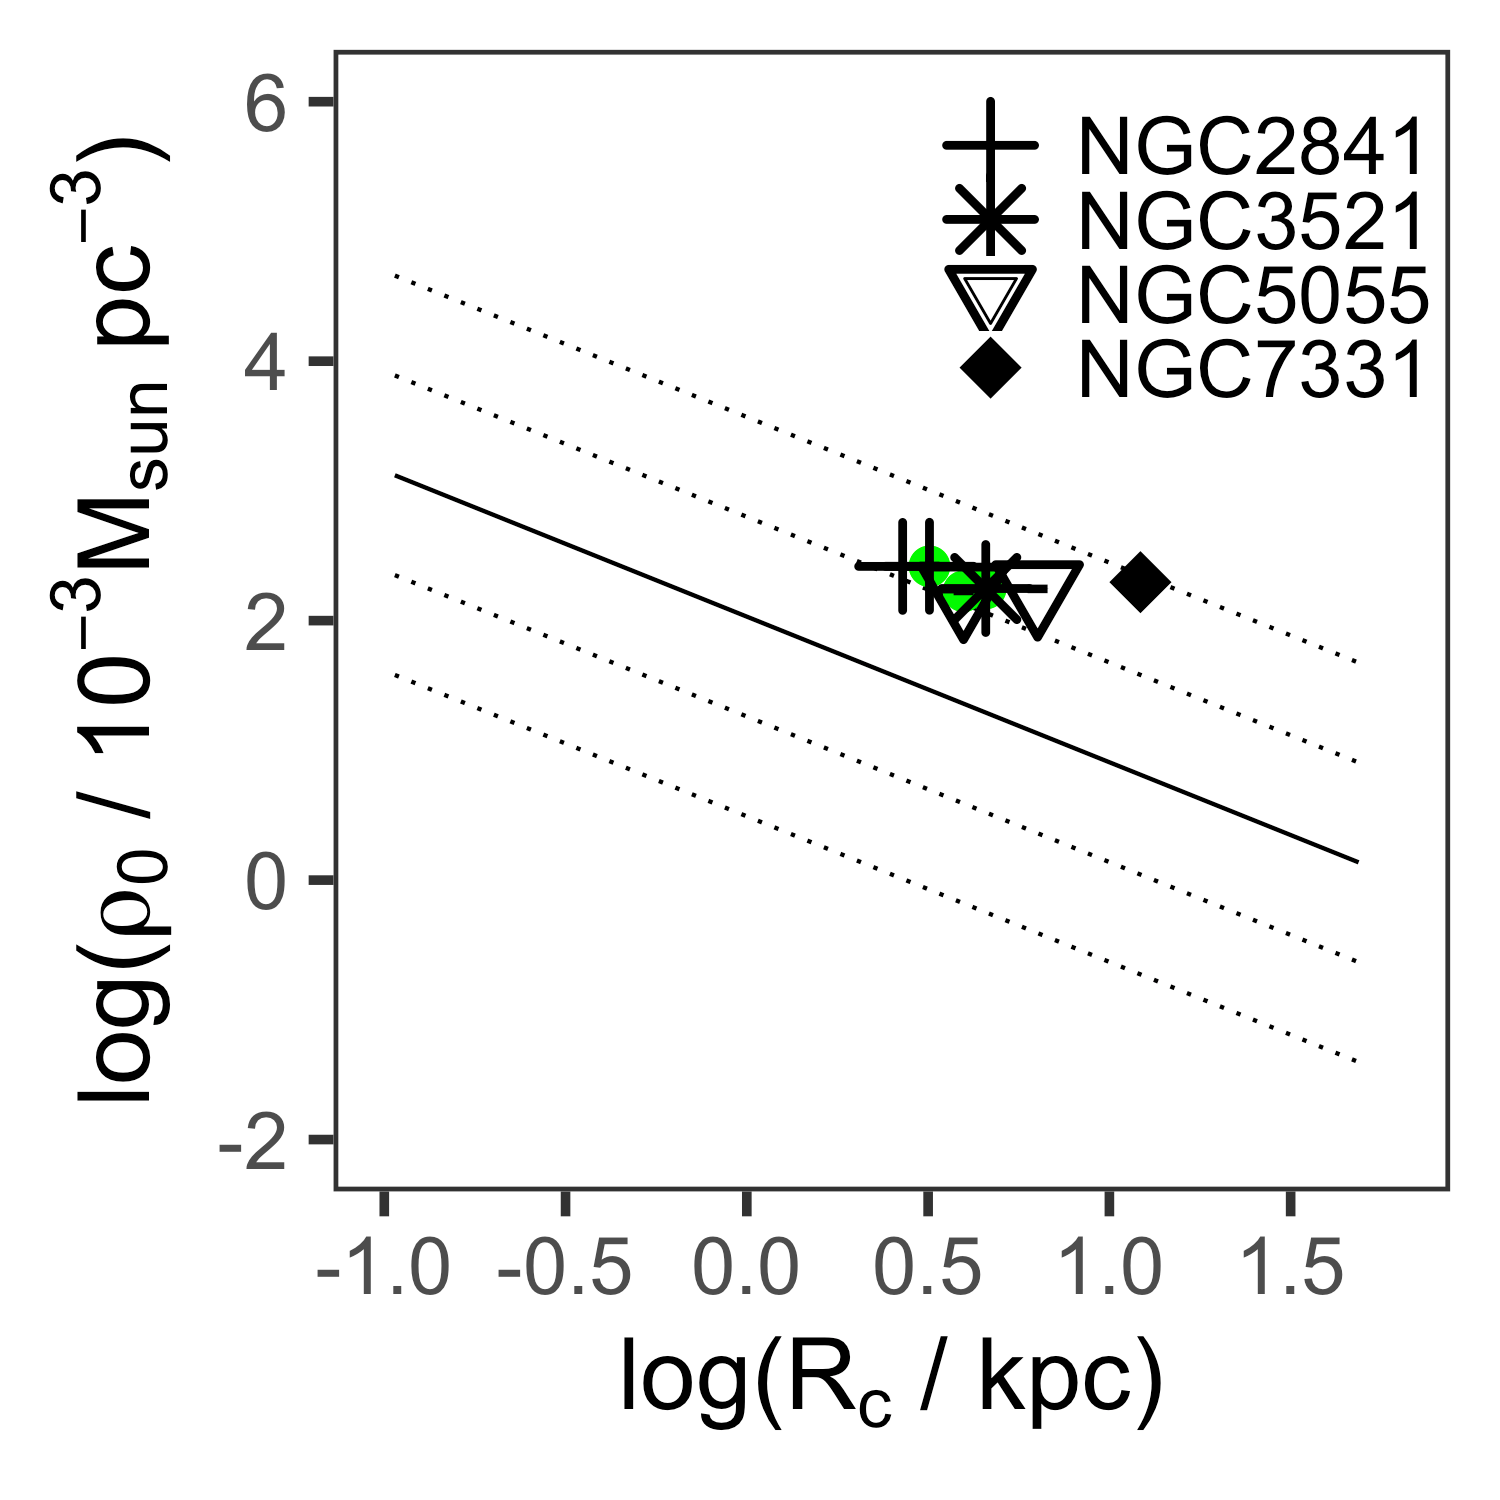
Fig. 16 demonstrates the Kormendy–Freeman relationship vs. from Kormendy & Freeman (2004) for the ISO dark halo parameters. Two thin dotted lines show the and scatter of this relation. Our fit dark halo parameters for all models from Table 4 are shown on the left777The parameter was calculated from and via .. The right plot presents the results of other authors. The parameters of the halo obtained in this work follow the expected relation and practically do not go beyond the line.

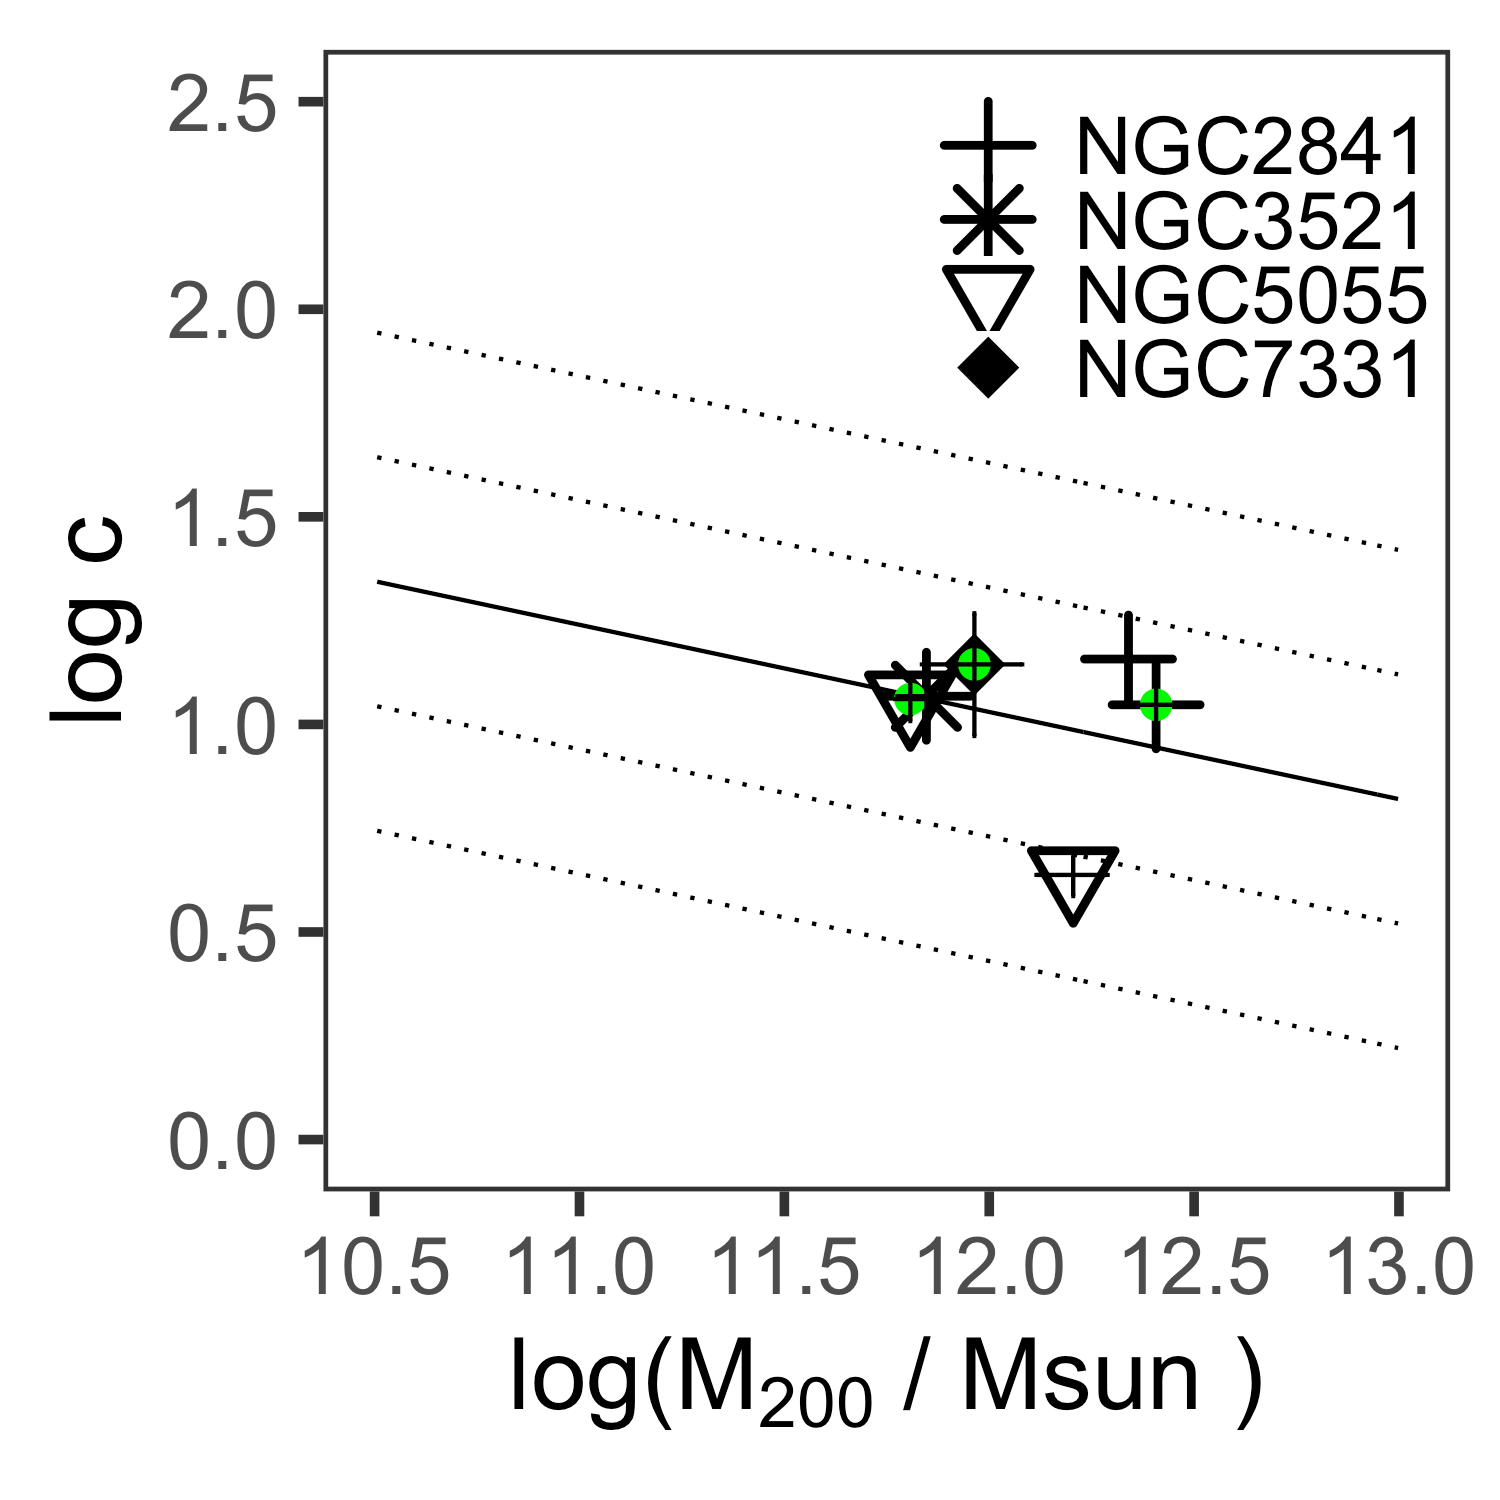
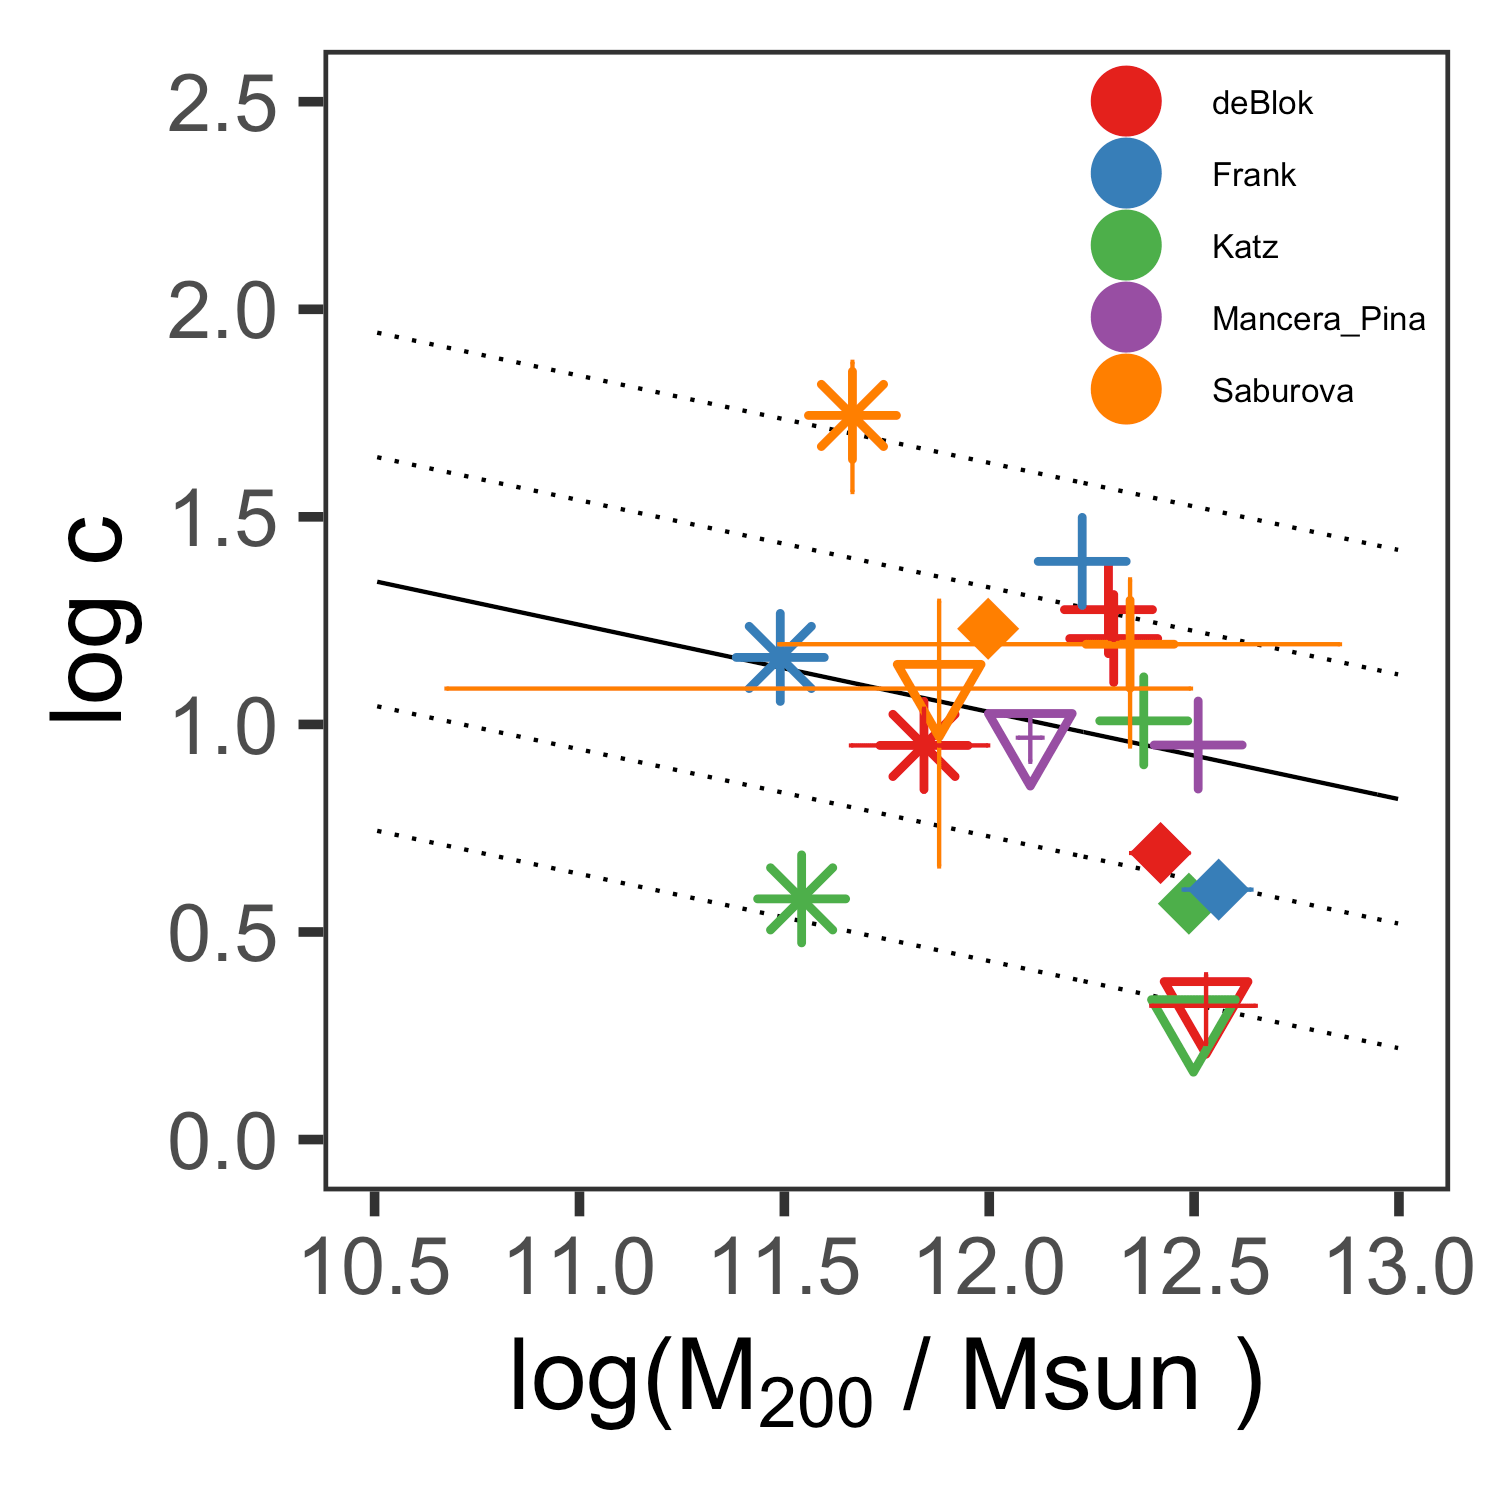
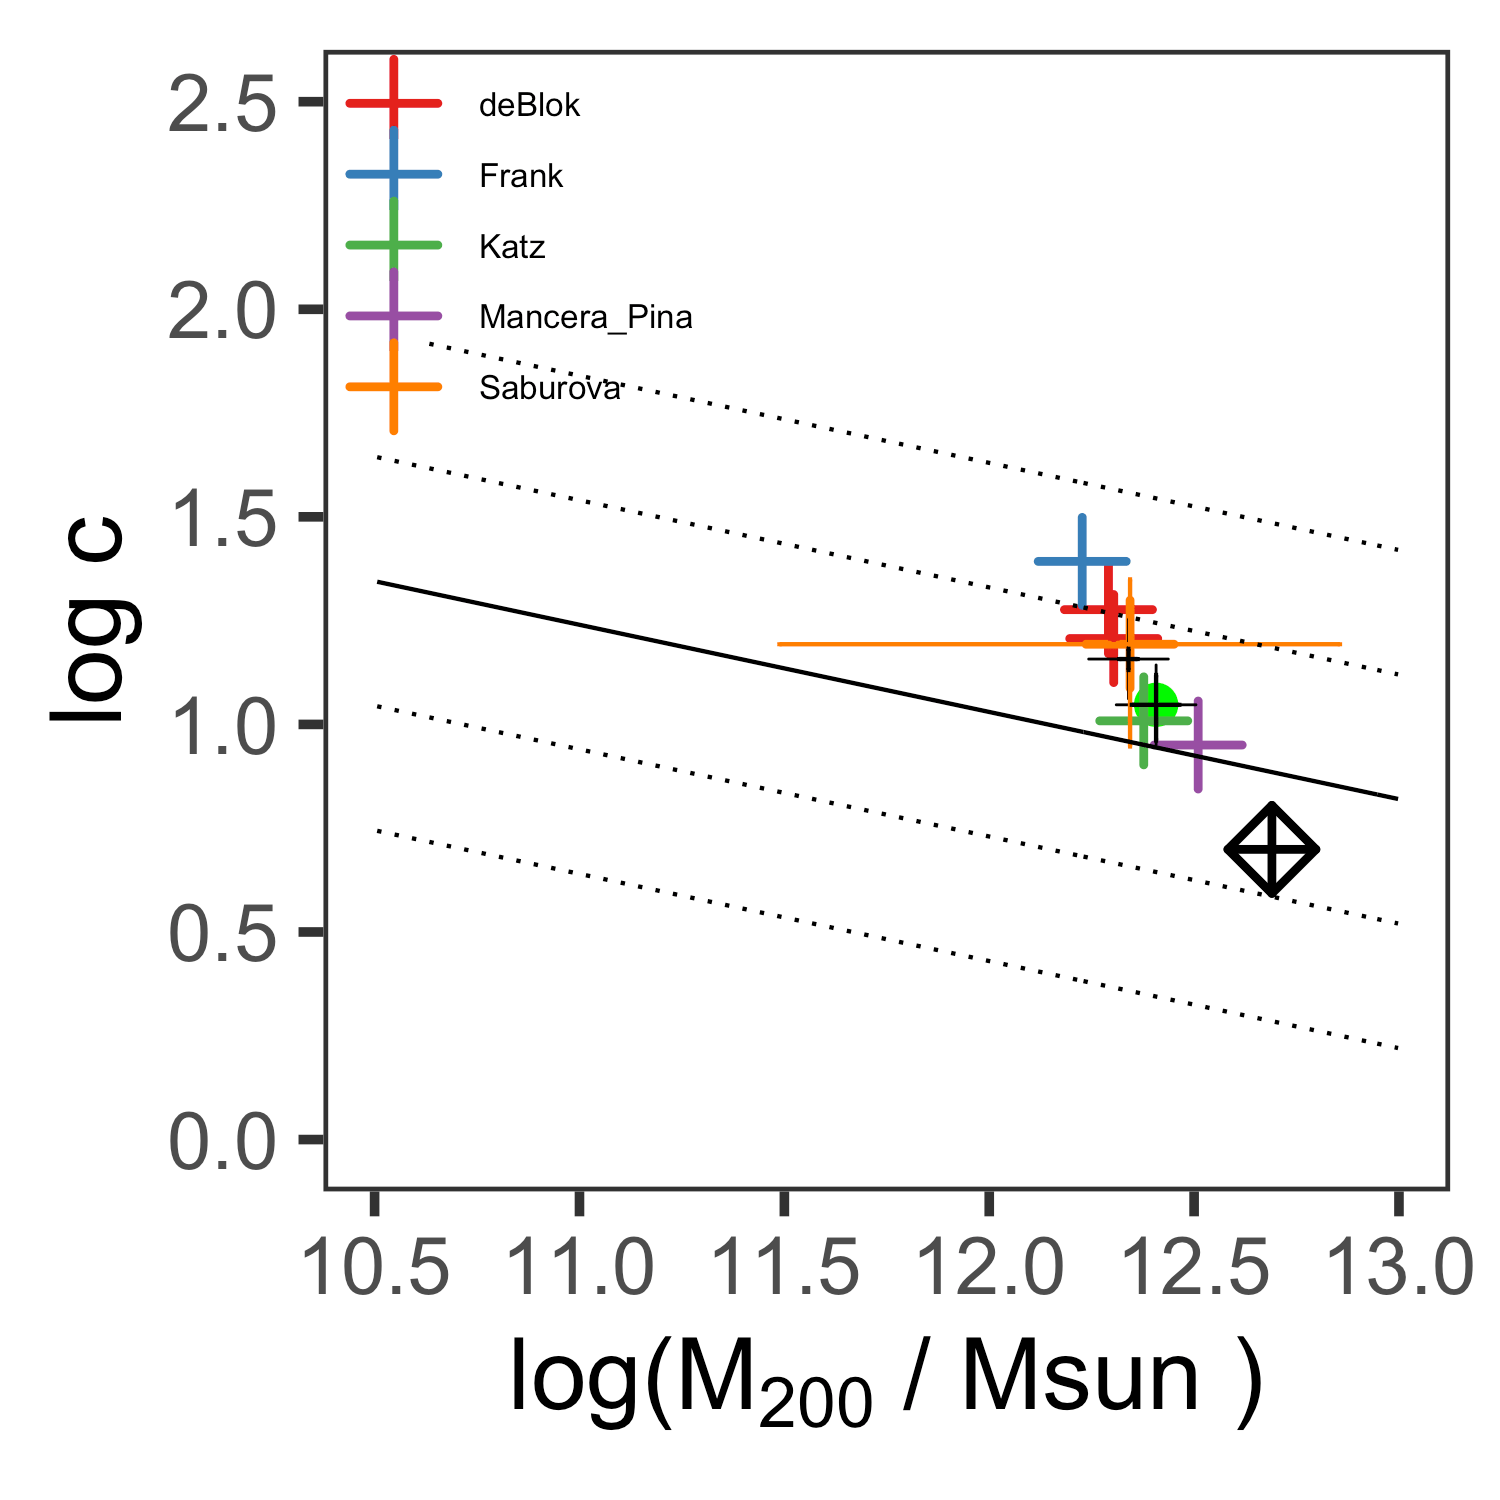
The fit parameters and for the NFW model are not completely independent but related. Their values are determined by the assumed cosmology. We plot (Fig. 17, left plot) fit parameters corresponding to all models that produce the lowest for each galaxy in order to make sure that our results are cosmologically justified. A straight thick line in Fig. 17 demonstrates the expected – relation from LCDM cosmology (Macciò et al., 2008). Two thin dotted lines show the and scatter of this relation. The parameters of the NFW halo from de Blok et al. (2008); Katz et al. (2014); Frank et al. (2016); Saburova et al. (2016); Mancera Piña et al. (2022) are shown in the right plot of Fig. 17. The parameters derived in the present work follow well the relation.
Although the parameters of the NFW halo are in good agreement with the scaling relations resulting from cosmological simulations, we have tested the effect of adiabatic contraction (AC) of the halo. We have applied this procedure to the galaxy NGC 2841 (Section 4.4). The fit parameters of the NFW halo for this galaxy, as they were before contraction, are also given in Table 5 and are plotted in Fig. 18 that demonstrates the scaling relation – (Macciò et al., 2008). We want to emphasize that in the new model, the contribution of the dark halo within the optical radius of the galaxy becomes large, but we have considered the extreme case of contraction according to Blumenthal et al. (1986) recipe. In Katz et al. (2014), who used a more gentle compression procedure, halo contraction did not significantly change the contributions of the disc and halo to the rotation curve.
Decomposition of the rotation curve of NGC 2841 with compressed halo is shown in Fig. 18 (left plot). Fig. 18 (right plot) presents vs. for NGC 2841 according to the present work and works of other authors. The black circles indicates the model without AC with a free ratio . Fit halo without AC with a fixed value of corresponds to the black diamond with an asterisk. The AC model with a fixed ratio is indicated by a green diamond with a cross888The primordial NFW halo parameters are plotted.. Accounting for AC increased the contribution of the dark matter halo inside , but did not change the tracking of the cosmological dependence between and .
7 Discussion
The selected galaxies have a very simple structure. Their bulges, if any, are small and have color indices that differ from the disc, which makes it possible to set physically reasonable conditions for the ratio . We impose numerous and fairly clear restrictions on the parameters of the rotation curve decomposition ( from the IR photometry, free or fixed, three different models for the halo). Using the Monte Carlo method, we made sure that the decomposition parameters converge to the same best solution (see Appendix B). We also make sure that, despite the variety of these restrictions, the contribution of dark matter within the optical radius of the galaxy for selected barless galaxies with flocculent morphology is less than the contribution of baryonic matter for all halo models, i.e., the total mass of baryonic matter (disc, bulge, gas) within the four disc scales is equal to or even higher than the mass of dark matter. This result is independent of the dark halo model and this is of crucial importance for the dynamics of galaxies.
Galaxies with similar properties have recently been discovered at large redshifts (Lang et al., 2017; Genzel et al., 2017, 2020). Lang et al. (2017) have shown that the rotation curve of these galaxies is consistent with a high mass fraction of baryons, relative to the total dark matter halo. Genzel et al. (2017) concluded that two-thirds or more of the of massive rotating discs are baryon-dominated within a few . At lower redshifts () that fraction is less than one-third, and at the fraction of baryon-dominated, massive discs is less than 10%. The galaxies at high redshifts have massive discs with powerful star formation, which is localized in giant star-forming clumps. Perhaps the stellar discs of these galaxies are going through a stage of violent instability. We in no way associate our flocculent galaxies with high redshift galaxies with a low content of dark matter, but among the latter there are a number of objects with small bulges and axisymmetric discs with many clumps lined up along fragments of flocculent spirals in which star formation is observed (for example, the galaxy EGS_13035123, figure 2, Genzel et al., 2020).
If the galaxies we are studying are the objects that have experienced early violent instability, then the evolution of their discs should proceed differently compared to those that start from a marginally stable state. If, at the same time, they retained some of the gas, then they may be similar to the flocculent galaxies we are studying. Models of such galaxies should be built taking into account two circumstances: a reduced content of dark matter and small values of the Toomre parameter (Toomre, 1964), which characterizes how unstable the disc is. We were motivated by the results of Saha & Cortesi (2018). The authors started their simulations from isolated dynamically cold disc () and showed that such a disc ends up with a featureless structure, while passing trough the short stage of violent instability with fragmentation and formation of stellar clumps. In the next section, we consider similarly unstable models, varying the contribution of the dark matter and the disc initial properties.
8 Dynamical models of galaxies with low contentent of dark matter
The existence of galaxies without bars and with reduced content of a dark matter within the optical radius is poorly explained in terms of galactic dynamics.
In -body simulations it is almost impossible to get a model without a bar. To prevent the formation of a bar in numerical simulations, special models are most often used: either with a very massive halo, or with a very compact and fairly massive bulge, or with a dynamically very hot disc (), or with an initially very thick disc. In real galaxies, such features are not always present. Sellwood et al. (2019) recently pondered a similar mystery of the galaxy M 33. For M 33, they constructed a mass model of all components based on an extended rotation curve with high space resolution. This rotation curve was exploited as the basis for the equilibrium -body model. All simulations with model parameters slightly varying within uncertainties led to the formation of a bar. Meanwhile, the galaxy shows neither a bar nor even traces of any oval-like distortion.
For galaxies NGC 2841, NGC 3521, NGC 5055, and NGC 7331, it is impossible to exclude the presence of a small oval-like distortion due to large inclination. An oval-like distortion, or a weak bar can be obtained in models with 0.5–1.0 starting from marginally stable conditions (Athanassoula & Misiriotis, 2002, figure 3, middle plot, model MD; Smirnov & Sotnikova, 2018, figure 8, left plot, ). If we compare the model with and the model with from Smirnov & Sotnikova (2019) (figure 1 there, upper left plot) we can notice that the amplitude of a bar decreases when going from to . Athanassoula (2003) explains the difference in amplitude by the smaller number of halo particles at the co-rotation. These particles effectively absorb the angular momentum of the resonant particles that make up the bar. It is the efficient exchange of angular momentum that drives the bar evolution and determines its strength and length. More massive halo and more angular momentum exchange lead to stronger bars.
To reduce the influence of dark matter particles on the growth of the bar, we built several additional to Smirnov & Sotnikova, 2018, 2019 models with .
8.1 Model setup
We do not consider here the models with the gaseous component. All models contain only stars dark matter. Each model initially consists of an exponential disc ( is the radial scale length) isothermal in the vertical direction ( is the vertical scale height) embedded in a live dark matter halo. The halo is modelled by a truncated sphere with the density profile close to the Navarro-Frenk-White (NFW) profile (Navarro et al., 1996, 1997). One model possesses a small classical bulge of a Hernquist (1990) profile with total bulge mass and the scale parameter . For some models, we also vary the Toomre parameter of a disc at from 0.5 to 2.0. The details about model parameters are given in Table 7.
For each of the models, we assume that the disc scale length is kpc and the disc mass is . Then the time unit will be Myr. We use 4 particles for the disc, 4.5 for the halo, and 0.4 for the bulge. The evolution of the model was followed up to 8 Gyr.
The whole procedure of model setup according to the specified initial conditions is described in details in Smirnov & Sotnikova (2018). A brief description is as follows. An -body representation of each model was prepared via mkgalaxy code of McMillan & Dehnen (2007). This code is a part of NEMO project (Teuben, 1995). The evolution of the models was calculated via gyrfalcON integrator (Dehnen, 2002).
| 1.5 | 0.05 | 1.2 | 0 | – |
| 1.5 | 0.05 | 0.5 | 0 | – |
| 0.5 | 0.05 | 1.2 | 0 | – |
| 0.5 | 0.20 | 1.2 | 0 | – |
| 0.5 | 0.05 | 1.2 | 0.1 | 0.1 |
| 0.5 | 0.05 | 2.0 | 0 | – |
| 0.5 | 0.05 | 0.5 | 0 | – |
| Notes: each column represents parameters of the models, one model on one line. is the mass of the halo in units of the disc mass within a sphere with radius , where is the scale length of the disc, is the initial ratio of the disc scale height to the disc scale length. is the Toomre parameter at . and are the total mass and the scale length of the bulge, respectively. | ||||
8.2 Model evolution and final morphology
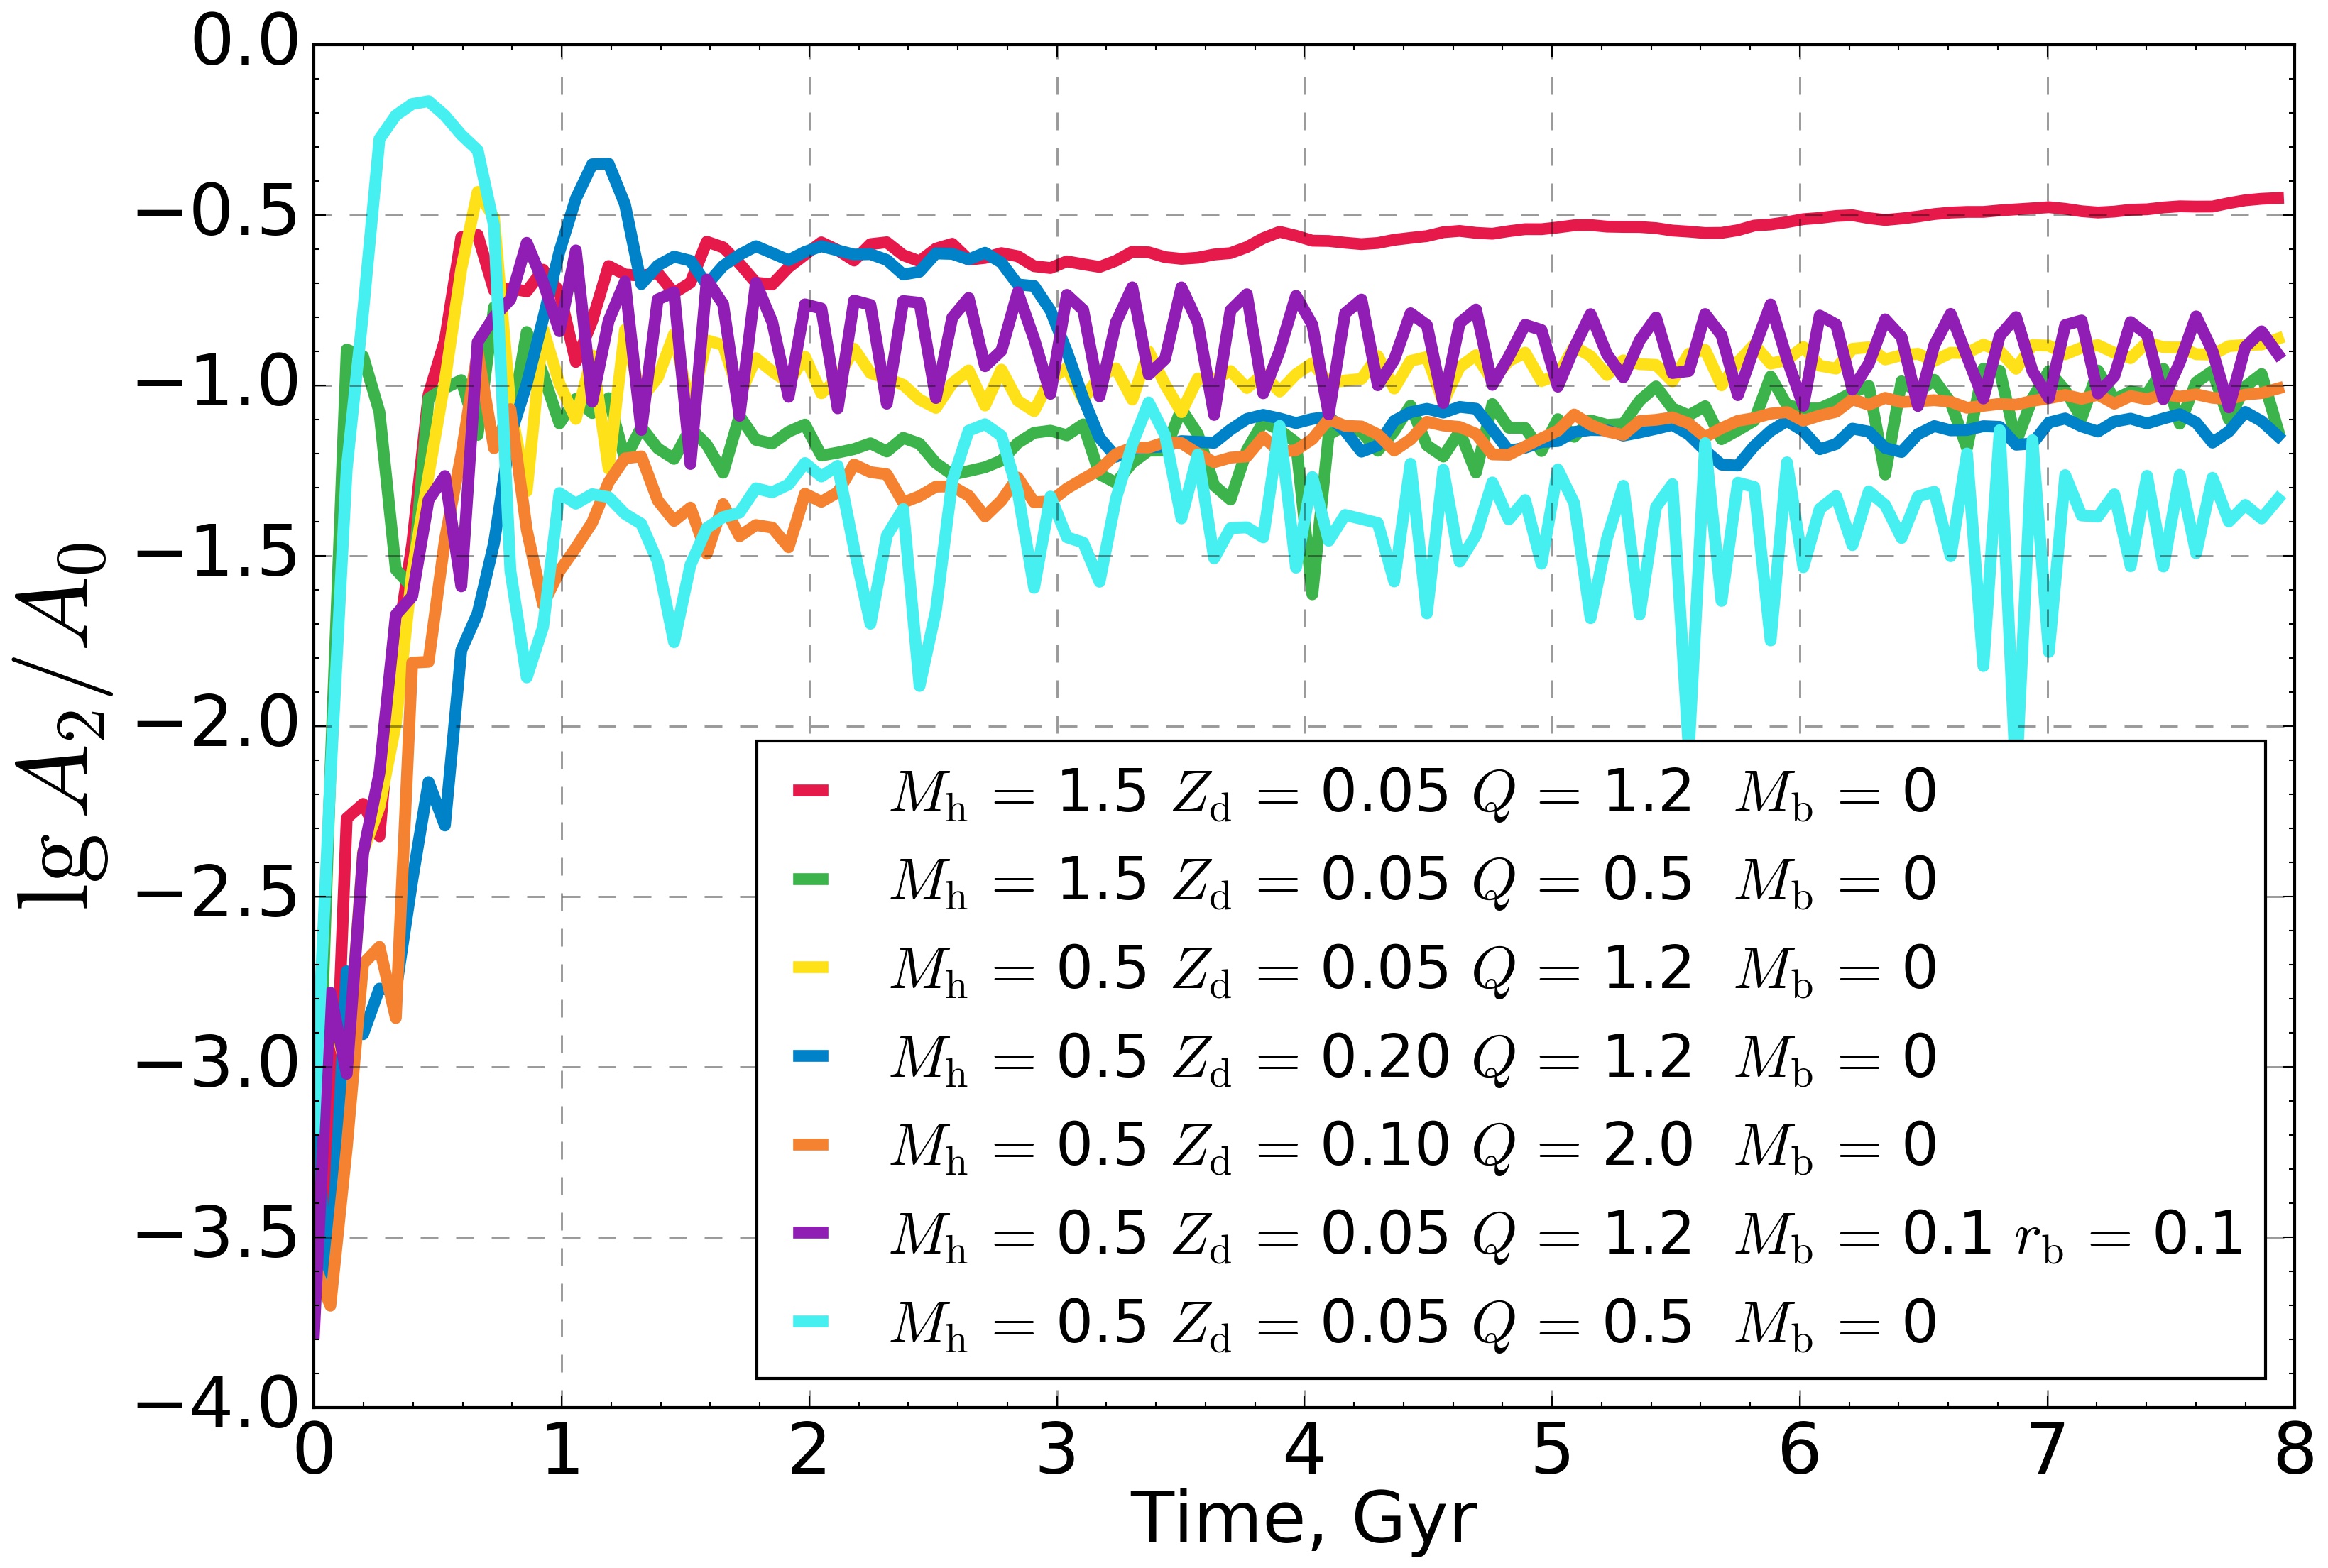
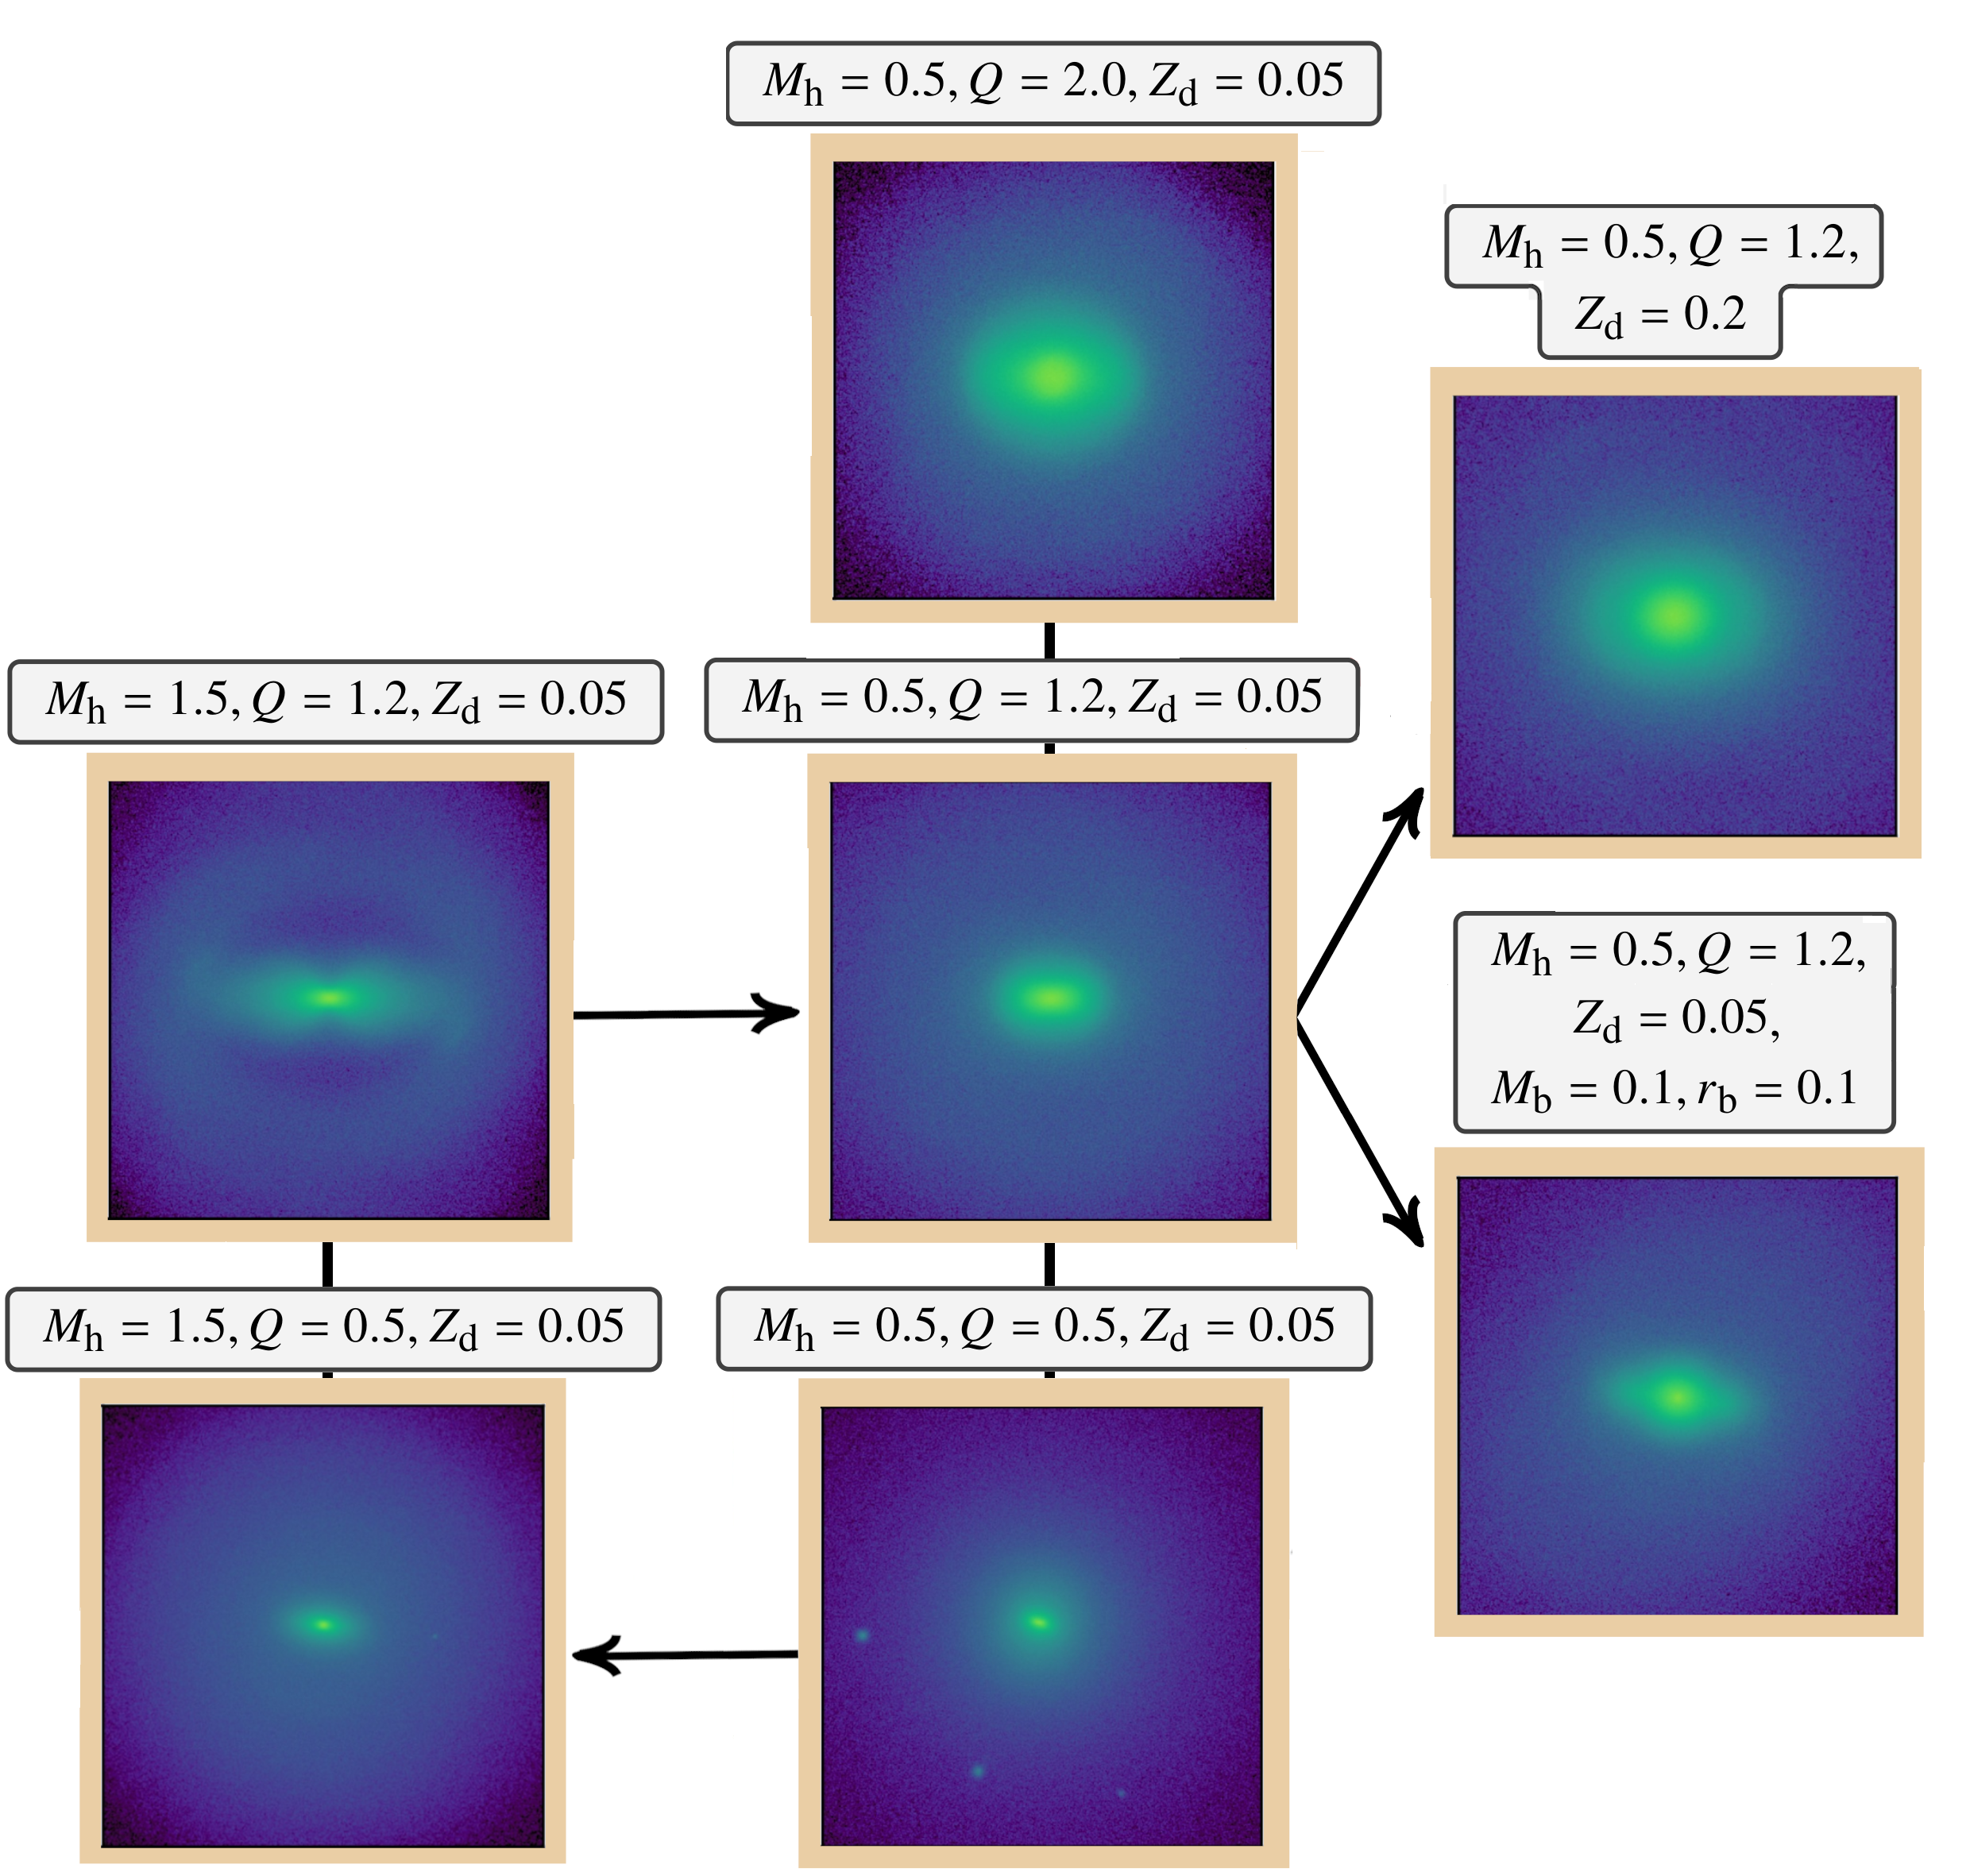
Fig. 19 demonstrates the difference in the bar amplitude between several models. Let us compare, for example, two marginally stable and initially thin models (, ), but with different dark matter contribution, with (dark red line) and (yellow line). The bar at time after 2 Gyr in the model with a reduced dark halo is substantially weaker.
In Fig. 20 one can see the difference in the morphology between these two models with (left middle plot) and (at the middle). For both models , . The bar for is weak and resembles a large scale oval distortion.
We consider the model with , and as a base model. We varied several parameters for this model keeping . An initially thicker model (, ) leads to an even weaker bar (Fig. 19, blue line) but the model itself looks like a lenticular galaxy at a face-on view (Fig. 20, upper right plot). The dynamically hotter model999We increased the initial thickness of a disc because it is impossible to build up an equilibrium model which is hot in-plane and cold in the vertical direction (, ) ends up with a faint oval-like perturbation (Fig. 19, dark orange line), but the final structure also resembles a lenticular galaxy (Fig. 20, upper middle plot). The addition of a small and compact bulge (, ) to the base model diminishes the bar amplitude (Fig. 19, blue violet line) but leads to a clear barlens morphology (Fig. 20, bottom right plot).
Recently Saha & Cortesi (2018) have shown that an isolated dynamically cold disc () settled into rotational equilibrium passes trough the short stage of violent instability with fragmentation and formation of stellar clumps. After that it evolves passively and ends up with a featureless structure. The final galaxy models (with and ) resemble the morphology of the present-day S0 galaxies with two almost exponential sub-structures, the inner Sérsic-like bulge (with ) and the extended exponential disc.
The model considered by Saha & Cortesi (2018) has (according to the rotation curve, figure 1, upper plot). We modified our base model with and started simulations from . As a result, we obtained a featurless at late stages of its evolution (Fig. 20, bottom middle plot). The model is almost barless, the amplitude is very small (Fig. 19, cyan line).
How can one be sure that the same picture is not observed for ? We constructed an additional model with , and . The model clearly exhibits a bar (Fig. 19, green line; Fig. 20, bottom left plot). Thus, there are two crucial factors to get a barless galaxy. First, a small amount of the dark matter leads to a weak bar for initial marginally stable disc. Secondly, a weak bar can be completely destroyed by violent instability ().
Our simulations are very similar to those of Saha & Cortesi (2018). Saha & Cortesi (2018) used models starting from highly unstable conditions and showed that the final models resemble S0 galaxies. On the one hand, this is consistent with Genzel et al. (2020) suggestion that the ATLAS-3D passive, early type galaxies with large bulges (ETGs, Cappellari et al., 2012, 2013) may be descendants of the baryon-dominated galaxies.
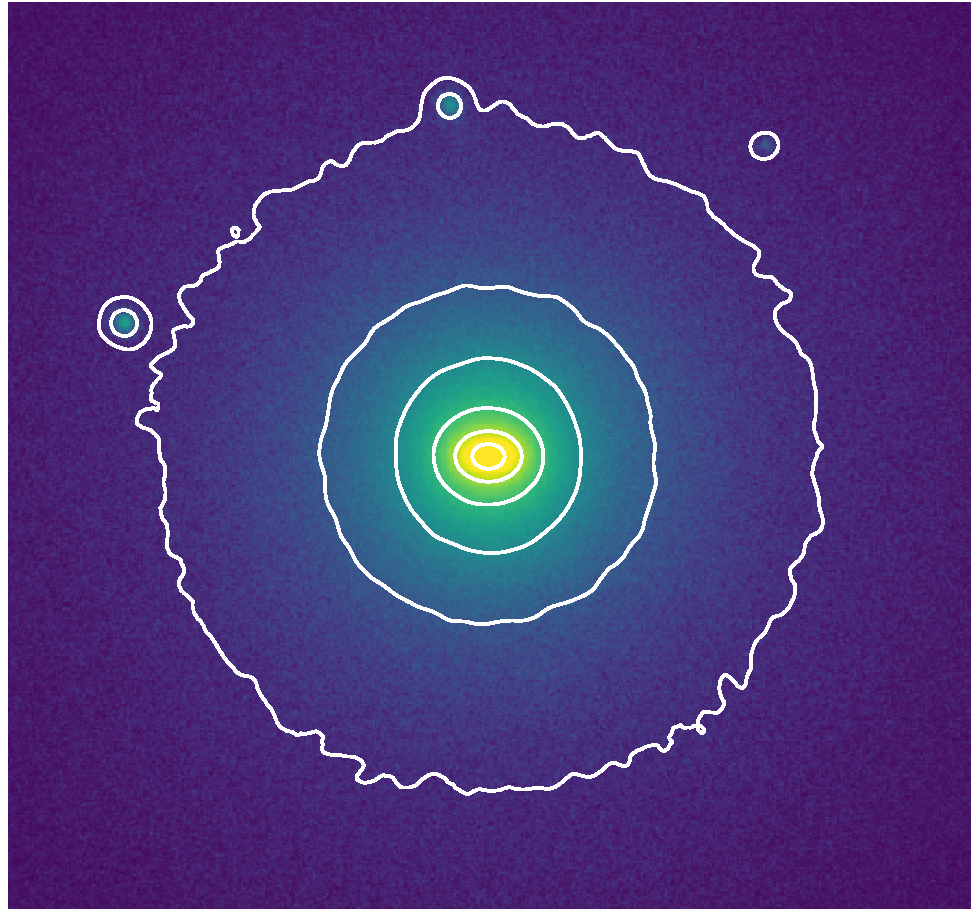
Actually, our final model demonstrates three components. The central component is of “sersic” type. Two outer components have exponential profiles (Fig. 21), similar to the results of decomposition by Saha & Cortesi (2018). The inner component can be treated as an Sérsic-like bulge (with ). The contribution of the inner structure is . The bulge need not have , but the bulge is a spheroidal system. Saha & Cortesi (2018) does not provide an edge-on view for their models with but the contribution of the inner sub-structure to the total mass is large (). To distinguish between a Sérsic-like bulge (with ) and an inner near exponential disc, we provide an edge-on snapshot of our model with initial parameters , and at the late stage of its evolution (Fig. 22, upper plot). Our model is definitely flat and has rather two discs as NGC 3521 and NGC 5055 (Table 2) and a central component with slightly elliptical isophotes. It should be noted that the galaxy NGC 3521 also has a classical bulge in its structure (Table 2), but in our model there was no bulge from the very beginning. As for the galaxy NGC 7331, it shows small traces of the presence of an inner sub-structure (Fig. 3) that is different from the main disc. Moreover, the galaxy is visible at a very large inclination; nevertheless, no signs of a noticeable 3D bulge in its structure are observed (Fig. 1). At the same time, an initially “hot” model (, , ) eventually comes to an almost barless state with a large bulge (Fig. 22, bottom plot). Such models are more reminiscent of the ATLAS-3D passive, early type galaxies with large bulges than initially very unstable and very “cold” models.
The main difference between the structure of our model (Fig. 20, bottom middle plot; Fig. 22, upper plot) and the structure of NGC 2841, NGC 3521, NGC 5055 and NGC 7331 galaxies is the absence of flocculent spirals in our model. But we carried out simulations without gas. As a result we got featureless models (without bar and without spirals). However, NGC 2841, NGC 3521, NGC 5055 and NGC 7331 have a lot of gas. They are active in starformation. The addition of gas in our model can lead to the flocculent structure. In simulations by Saha & Cortesi (2018) and in our simulations the model passes trought the stage of violent instability and breaks up into clamps (see, for example, Saha & Cortesi, 2018, figure 2). Some clumps are preserved even at the stage of passive evolution. If galaxies have stored a lot of gas, then star formation concentrated in clumps throughout the disc will lead to the appearance of multiple scraps of spirals due to differential rotation.
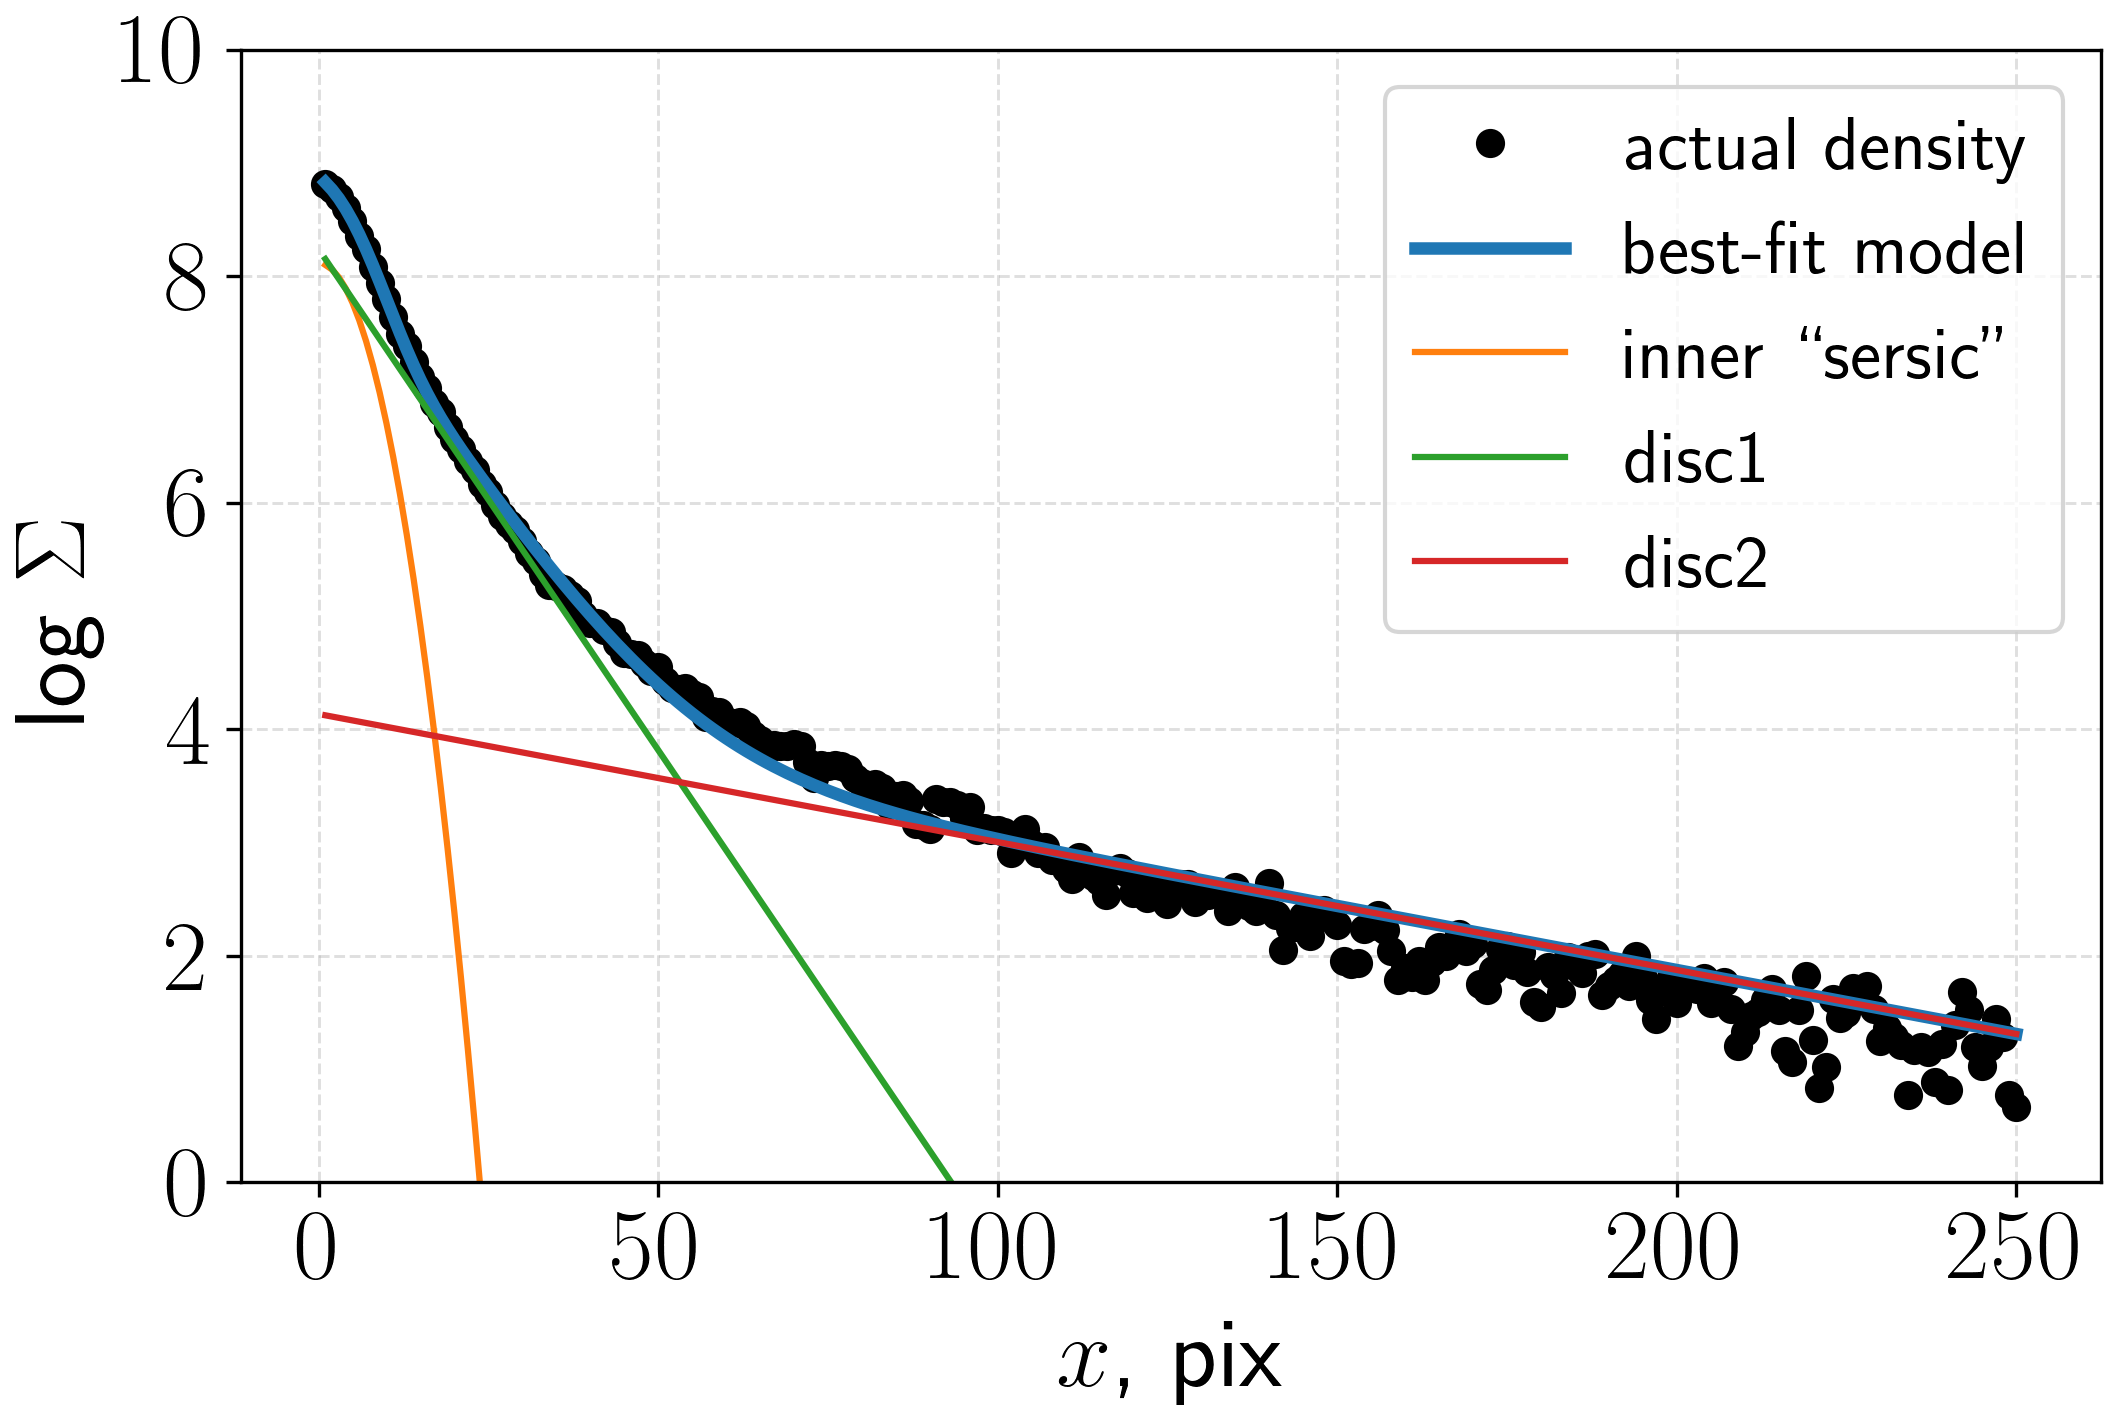
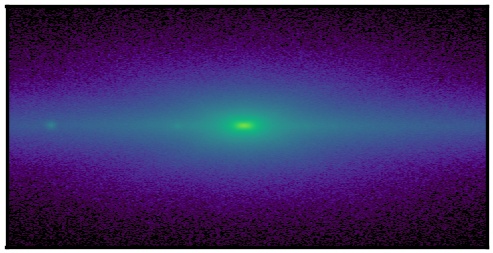
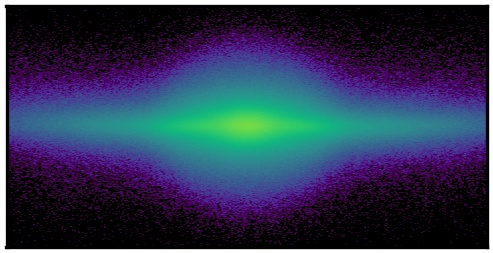
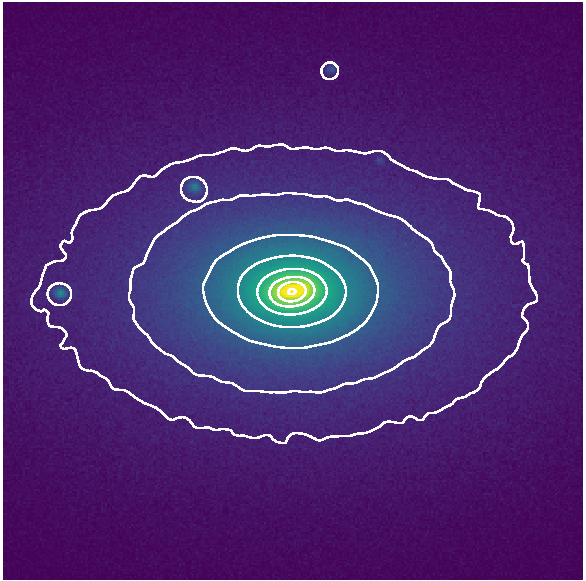
Fig. 23 shows an image of a model galaxy (, , ) at ( Gyr) with superimposed isophotes. At the top, the model is shown face-on; isophotes in the centre outline a very subtle oval-like distortion. At the bottom, an image is rotated at an angle with P.A. and inclination taken from Laurikainen & Salo (2017) for NGC 5055. It can be seen that with this position of the galaxy, very tiny methods of photometric analysis are needed to reveal the presence of an oval-like distortion.
Perhaps the galaxies under consideration are objects that have survived violent instability from large . At high , they can be observed as objects studied by Lang et al. (2017); Genzel et al. (2017, 2020).
9 Conclusions
We analyzed the THINGS’ and HERACLES’ kinematic data of four barless galaxies with flocculent structure (NGC 2841, NGC 3512, NGC 5055, NGC 7331) and constructed their rotation curves. We decomposed the extracted rotation curves taking into account S4G photometric models of galaxies, modern calibrations, the contribution of the atomic and molecular gas, reliable distance to galaxies from Cepheids, and several models for the dark halo.
As a result of the analysis, it was found that the mass of the baryonic matter in galaxies studied, within four exponential scales of the disc, is not less than the mass of dark matter, and sometimes even exceeds it.
In an attempt to understand the phenomenon of galaxies without bars, we have constructed several -body models of a galaxy with . It turned out that the bar is an inevitable consequence of the evolution of such models, although the forming bar is rather faint. In models that evolve from marginally stable states, even in the case of a light halo, the formation of an oval-like distortion cannot be completely avoided.
Dynamically hot and/or fairly thick models also end up with a very weak bar, although the entire model resembles rather a lenticular galaxy. The addition of a small compact bulge does not lead to the destruction of the bar, but to the formation of a barlens. However, in galaxies NGC 2841, NGC 3521, NGC 5055, NGC 7331 even a weak bar is not observed. This creates a dynamic puzzle.
We see the following solution to this problem. Such galaxies in the past could have gone through a stage of violent instability, which could lead to the formation of a featureless disc. The decisive factor for the formation of a disc without structural features is the low mass of the dark halo. Otherwise, a small bar might still survive. However, only a reduced content of the dark halo is not enough. For the formation of a galaxy without features in its structure, a start from strongly unstable conditions is also necessary. In this case, the bar does not survive. Flocculent spirals in such galaxies can be explained by the presence of gas. It is the gas that can lead to the flocculent structure at the stage of violent instability, when many clumps are formed. If they preserved at the stage of passive evolution and galaxies have stored a lot of gas, then star formation concentrated in clumps throughout the disc could lead to the appearance of multiple scraps of spirals due to differential rotation.
Data availability
The data underlying this article will be shared on reasonable request to the corresponding author.
Acknowledgements
We thank the referee for the comments that helped to improve the presentation of the results. We thank the anonymous referee for his/her review and appreciate the comments. The authors thank THINGS’ and HERACLES team for available data. This research made use 3DBBarolo. The authors express gratitude for the grant of the Russian Foundation for Basic Researches number 19-02-00249.
References
- Aguerri et al. (2009) Aguerri J. A. L., Méndez-Abreu J., Corsini E. M., 2009, A&A, 495, 491
- Athanassoula (2003) Athanassoula E., 2003, MNRAS, 341, 1179
- Athanassoula & Misiriotis (2002) Athanassoula E., Misiriotis A., 2002, MNRAS, 330, 35
- Athanassoula & Sellwood (1986) Athanassoula E., Sellwood J. A., 1986, MNRAS, 221, 213
- Barazza et al. (2008) Barazza F. D., Jogee S., Marinova I., 2008, ApJ, 675, 1194
- Blumenthal et al. (1986) Blumenthal G. R., Faber S. M., Flores R., Primack J. R., 1986, ApJ, 301, 27
- Burkert (1995) Burkert A., 1995, ApJ, 447, L25
- Cappellari et al. (2012) Cappellari M., et al., 2012, Nature, 484, 485
- Cappellari et al. (2013) Cappellari M., et al., 2013, MNRAS, 432, 1709
- Casertano (1983) Casertano S., 1983, MNRAS, 203, 735
- Casertano & van Gorkom (1991) Casertano S., van Gorkom J. H., 1991, AJ, 101, 1231
- Dehnen (2002) Dehnen W., 2002, Journal of Computational Physics, 179, 27
- Di Teodoro & Fraternali (2015) Di Teodoro E. M., Fraternali F., 2015, MNRAS, 451, 3021
- Di Teodoro & Peek (2021) Di Teodoro E. M., Peek J. E. G., 2021, ApJ, 923, 220
- Dutton et al. (2007) Dutton A. A., van den Bosch F. C., Dekel A., Courteau S., 2007, ApJ, 654, 27
- Elmegreen & Elmegreen (1987) Elmegreen D. M., Elmegreen B. G., 1987, ApJ, 314, 3
- Eskridge et al. (2000) Eskridge P. B., et al., 2000, AJ, 119, 536
- Frank et al. (2016) Frank B. S., de Blok W. J. G., Walter F., Leroy A., Carignan C., 2016, AJ, 151, 94
- Freeman (1970) Freeman K. C., 1970, ApJ, 160, 811
- Fujii et al. (2018) Fujii M. S., Bédorf J., Baba J., Portegies Zwart S., 2018, MNRAS, 477, 1451
- Genzel et al. (2017) Genzel R., et al., 2017, Nature, 543, 397
- Genzel et al. (2020) Genzel R., et al., 2020, ApJ, 902, 98
- Hernquist (1990) Hernquist L., 1990, ApJ, 356, 359
- Kataria & Das (2018) Kataria S. K., Das M., 2018, MNRAS, 475, 1653
- Katz et al. (2014) Katz H., McGaugh S. S., Sellwood J. A., de Blok W. J. G., 2014, MNRAS, 439, 1897
- Kormendy & Freeman (2004) Kormendy J., Freeman K. C., 2004, in Ryder S., Pisano D., Walker M., Freeman K., eds, IAU Symposium Vol. 220, Dark Matter in Galaxies. p. 377 (arXiv:astro-ph/0407321)
- Kroupa (2001) Kroupa P., 2001, MNRAS, 322, 231
- Lang et al. (2017) Lang P., et al., 2017, ApJ, 840, 92
- Laurikainen & Salo (2017) Laurikainen E., Salo H., 2017, A&A, 598, A10
- Leroy et al. (2008) Leroy A. K., Walter F., Brinks E., Bigiel F., de Blok W. J. G., Madore B., Thornley M. D., 2008, AJ, 136, 2782
- Leroy et al. (2009) Leroy A. K., et al., 2009, AJ, 137, 4670
- Leroy et al. (2013) Leroy A. K., et al., 2013, AJ, 146, 19
- Macciò et al. (2008) Macciò A. V., Dutton A. A., van den Bosch F. C., 2008, MNRAS, 391, 1940
- Mancera Piña et al. (2022) Mancera Piña P. E., Fraternali F., Oosterloo T., Adams E. A. K., di Teodoro E., Bacchini C., Iorio G., 2022, MNRAS, 514, 3329
- Marinova & Jogee (2007) Marinova I., Jogee S., 2007, ApJ, 659, 1176
- McMillan & Dehnen (2007) McMillan P. J., Dehnen W., 2007, MNRAS, 378, 541
- Menéndez-Delmestre et al. (2007) Menéndez-Delmestre K., Sheth K., Schinnerer E., Jarrett T. H., Scoville N. Z., 2007, ApJ, 657, 790
- Mo et al. (1998) Mo H. J., Mao S., White S. D. M., 1998, MNRAS, 295, 319
- Navarro et al. (1996) Navarro J. F., Frenk C. S., White S. D. M., 1996, ApJ, 462, 563
- Navarro et al. (1997) Navarro J. F., Frenk C. S., White S. D. M., 1997, ApJ, 490, 493
- Noordermeer (2008) Noordermeer E., 2008, MNRAS, 385, 1359
- Ostriker & Peebles (1973) Ostriker J. P., Peebles P. J. E., 1973, ApJ, 186, 467
- Querejeta et al. (2015) Querejeta M., et al., 2015, ApJS, 219, 5
- Rogstad et al. (1974) Rogstad D. H., Lockhart I. A., Wright M. C. H., 1974, ApJ, 193, 309
- Saburova et al. (2016) Saburova A. S., Kasparova A. V., Katkov I. Y., 2016, MNRAS, 463, 2523
- Saha & Cortesi (2018) Saha K., Cortesi A., 2018, ApJ, 862, L12
- Saha et al. (2018) Saha K., Graham A. W., Rodríguez-Herranz I., 2018, ApJ, 852, 133
- Salo et al. (2015) Salo H., et al., 2015, ApJS, 219, 4
- Salpeter (1955) Salpeter E. E., 1955, ApJ, 121, 161
- Sandstrom et al. (2013) Sandstrom K. M., et al., 2013, ApJ, 777, 5
- Sellwood et al. (2019) Sellwood J. A., Shen J., Li Z., 2019, MNRAS, 486, 4710
- Sérsic (1968) Sérsic J. L., 1968, Technical report, Atlas de Galaxias Australes - English Translation of the chapter “Photometric Analysis”, doi:10.5281/zenodo.2562394.
- Sheth et al. (2010) Sheth K., et al., 2010, PASP, 122, 1397
- Smirnov & Sotnikova (2018) Smirnov A. A., Sotnikova N. Y., 2018, MNRAS, 481, 4058
- Smirnov & Sotnikova (2019) Smirnov A. A., Sotnikova N. Y., 2019, MNRAS, 485, 1900
- Stepanova & Volkov (2013) Stepanova K. V., Volkov E. V., 2013, Astronomy Letters, 39, 405
- Teuben (1995) Teuben P., 1995, in Shaw R. A., Payne H. E., Hayes J. J. E., eds, Astronomical Society of the Pacific Conference Series Vol. 77, Astronomical Data Analysis Software and Systems IV. p. 398
- Toomre (1964) Toomre A., 1964, ApJ, 139, 1217
- Tully et al. (2017) Tully R. B., Courtois H. M., Sorce J. G., 2017, VizieR Online Data Catalog, p. J/AJ/152/50
- Walter et al. (2008) Walter F., Brinks E., de Blok W. J. G., Bigiel F., Kennicutt Jr. R. C., Thornley M. D., Leroy A., 2008, AJ, 136, 2563
- Young (1980) Young P., 1980, ApJ, 242, 1232
- Zasov & Khoperskov (2003) Zasov A. V., Khoperskov A. V., 2003, Astronomy Letters, 29, 437
- de Blok et al. (2008) de Blok W. J. G., Walter F., Brinks E., Trachternach C., Oh S.-H., Kennicutt Jr. R. C., 2008, AJ, 136, 2648
Appendix A Data, rotation curves and surface densities
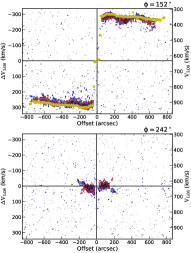
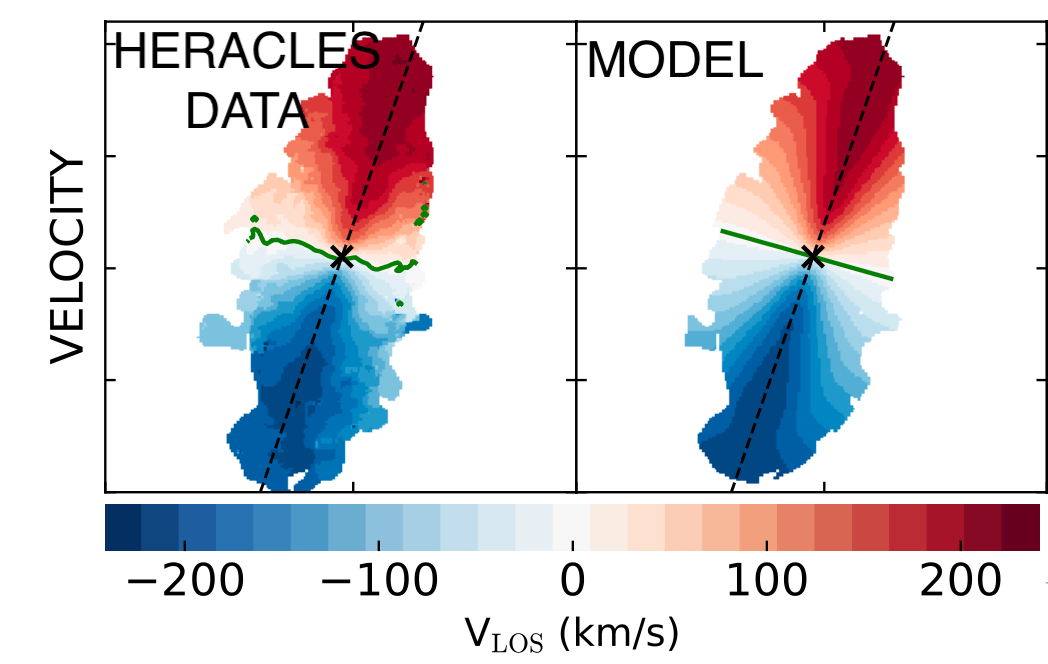
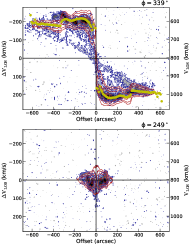
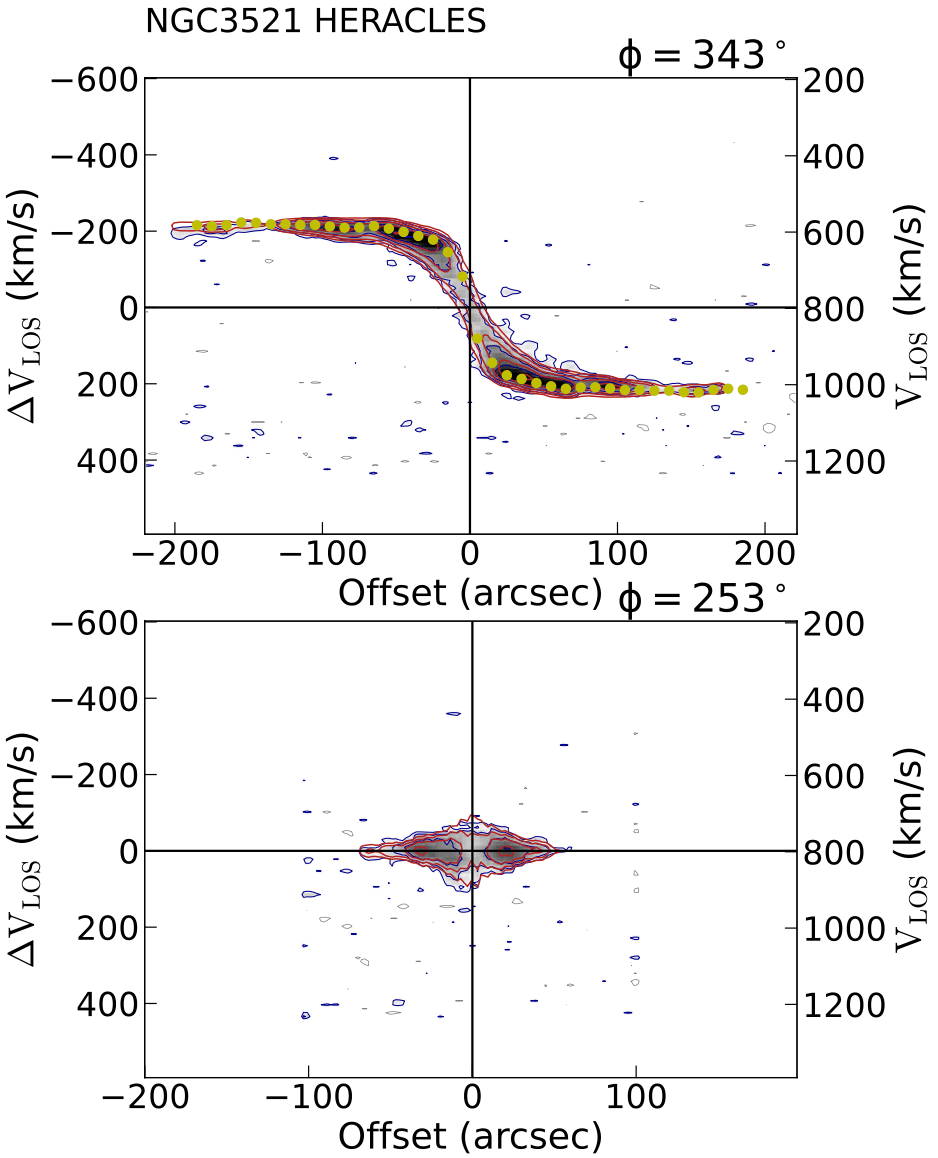
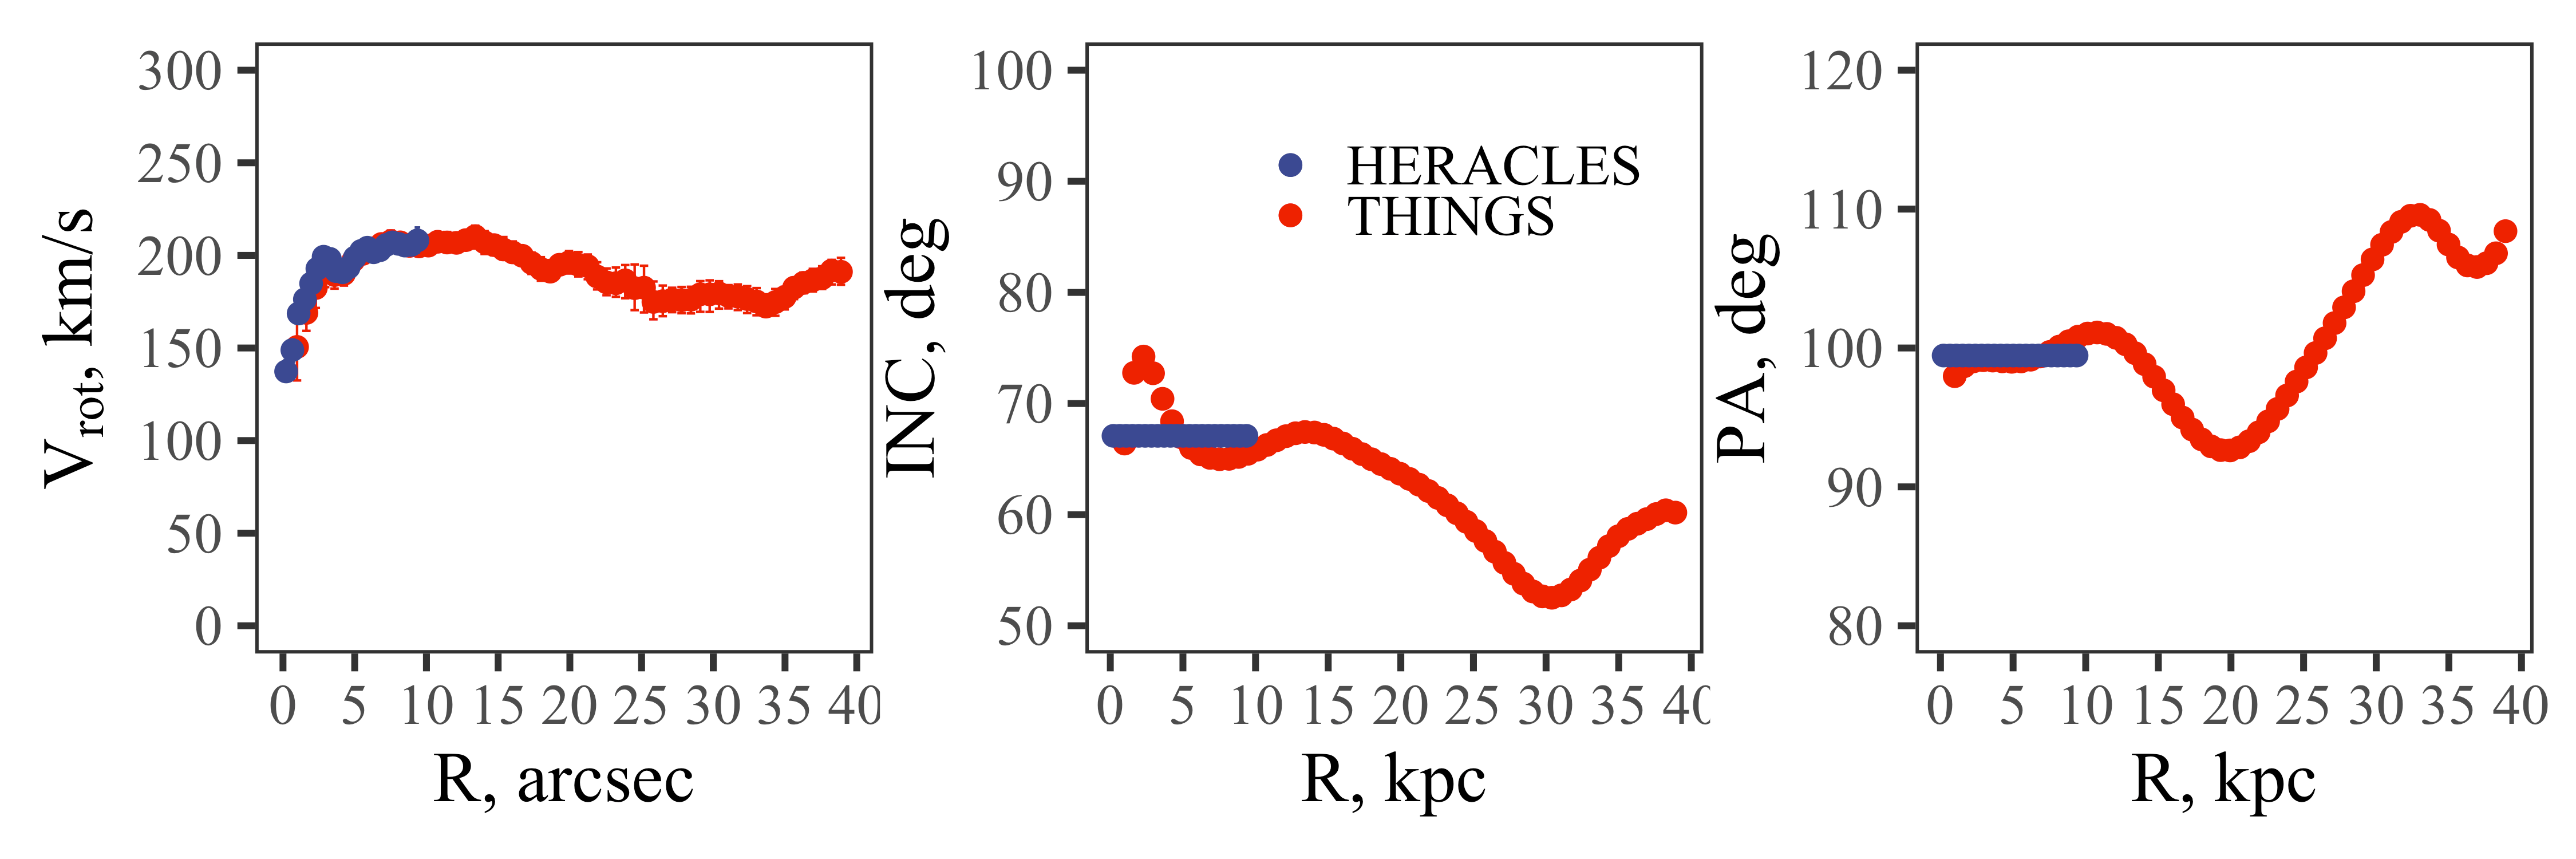
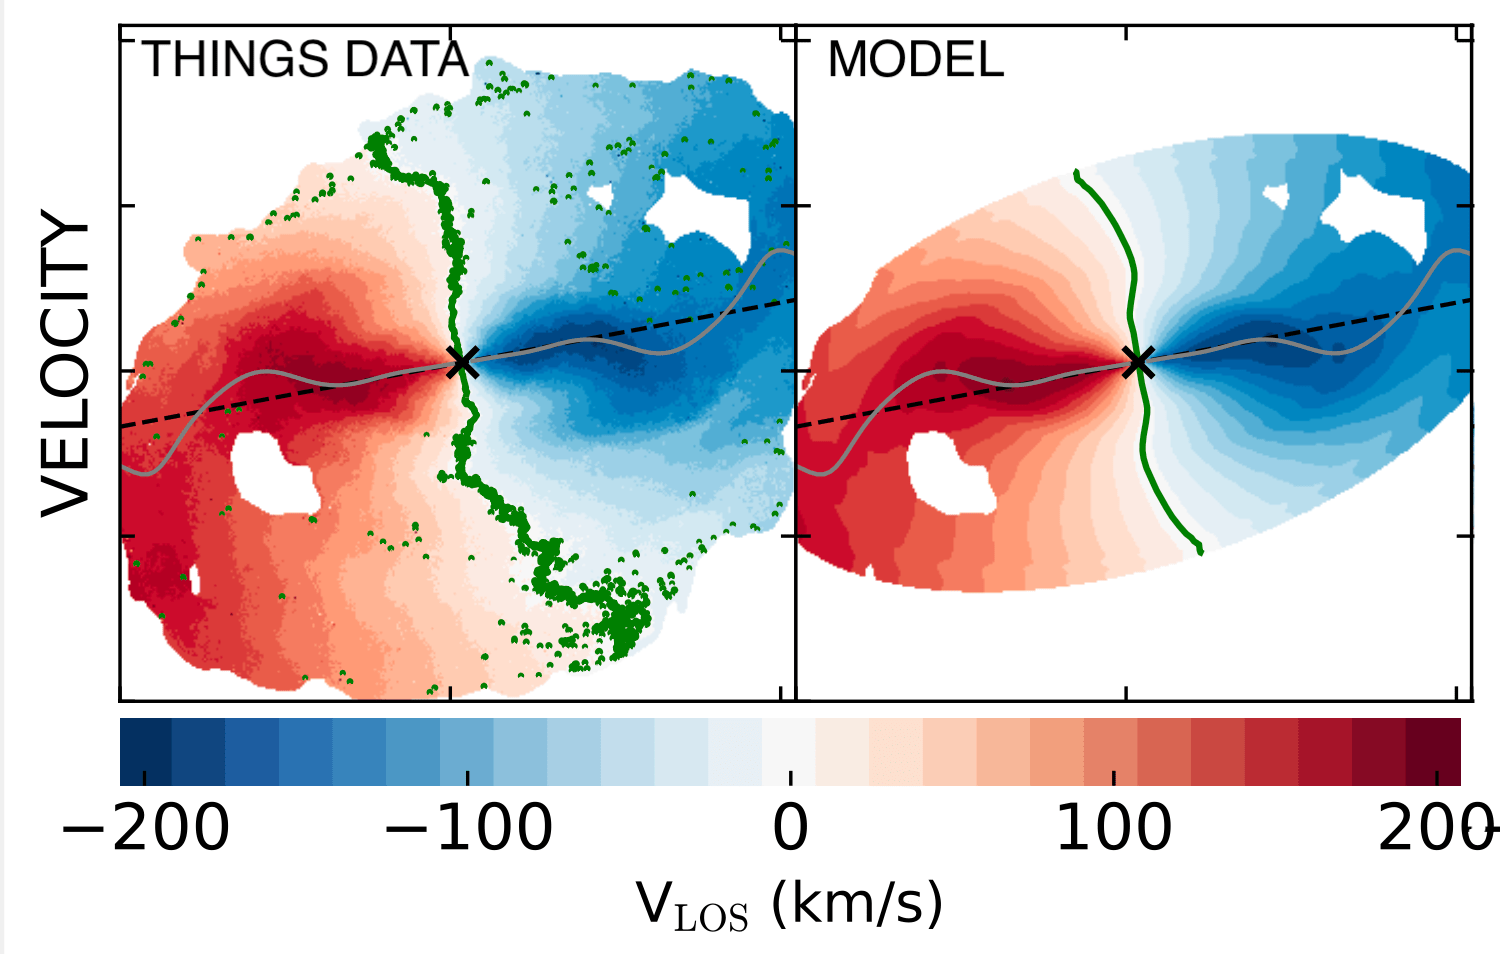
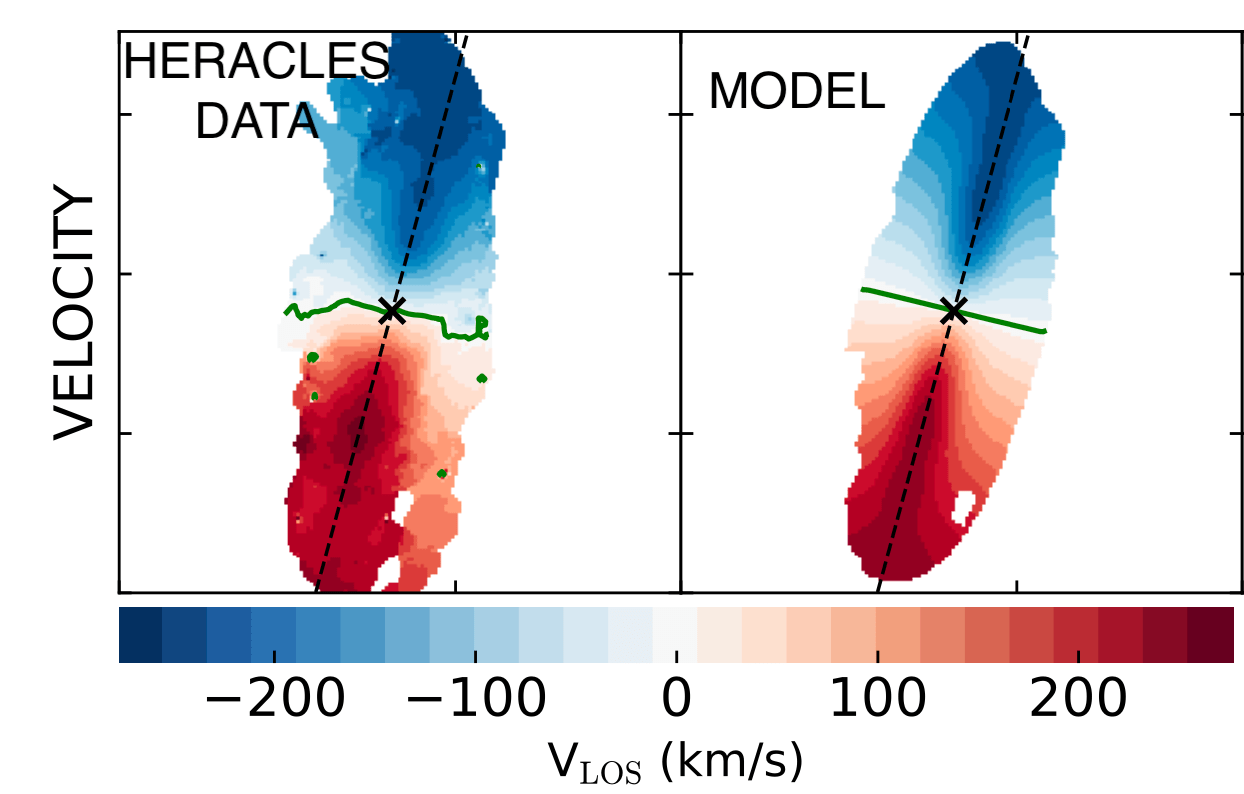
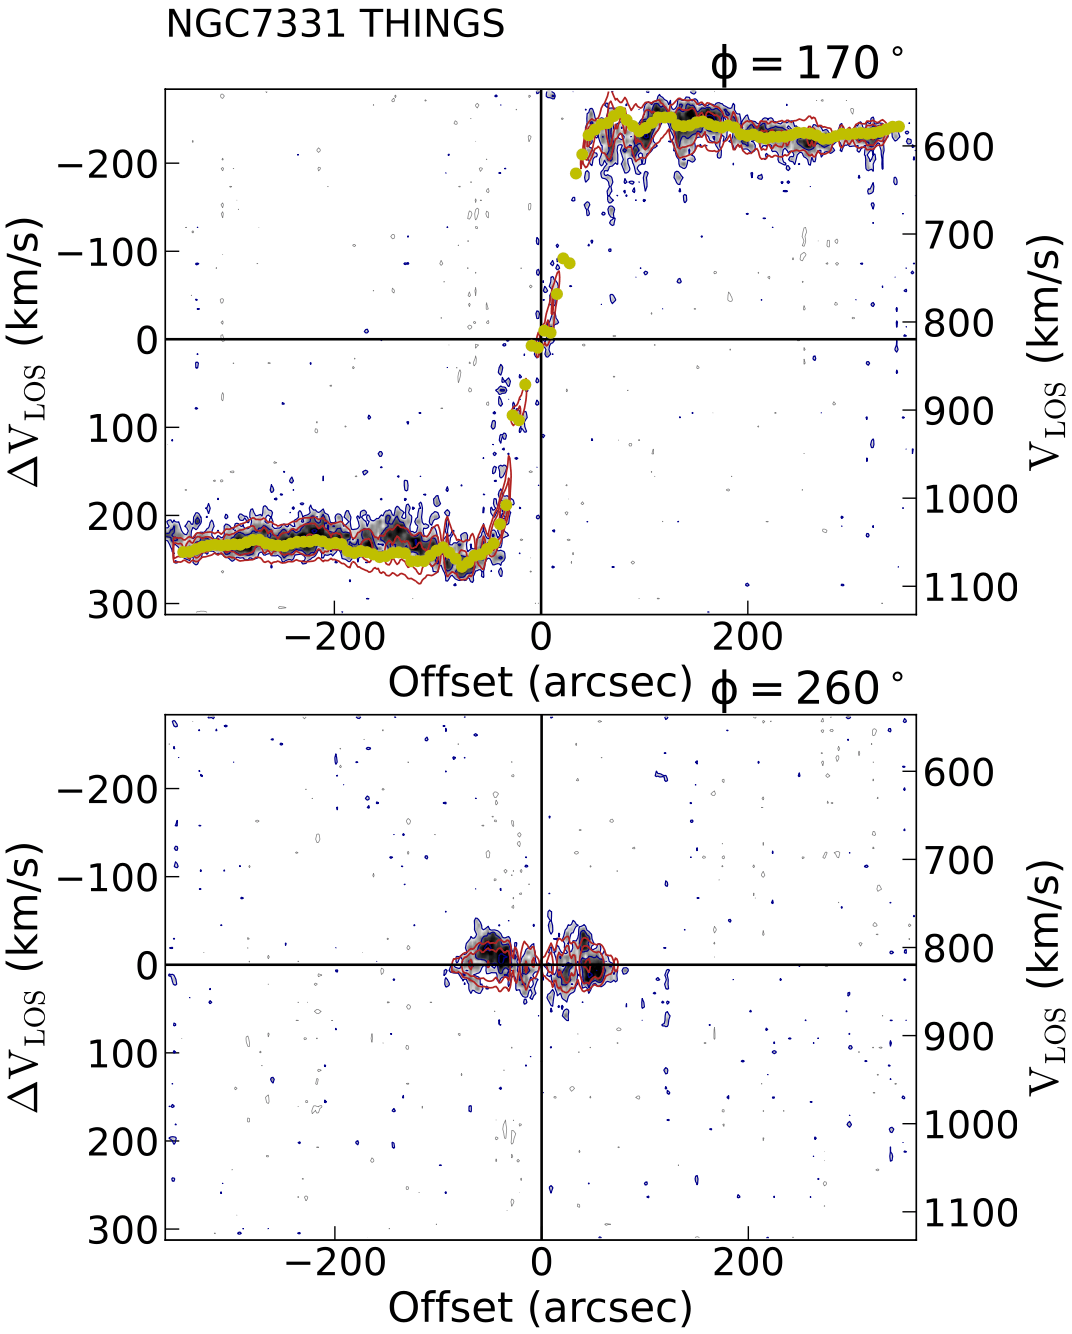
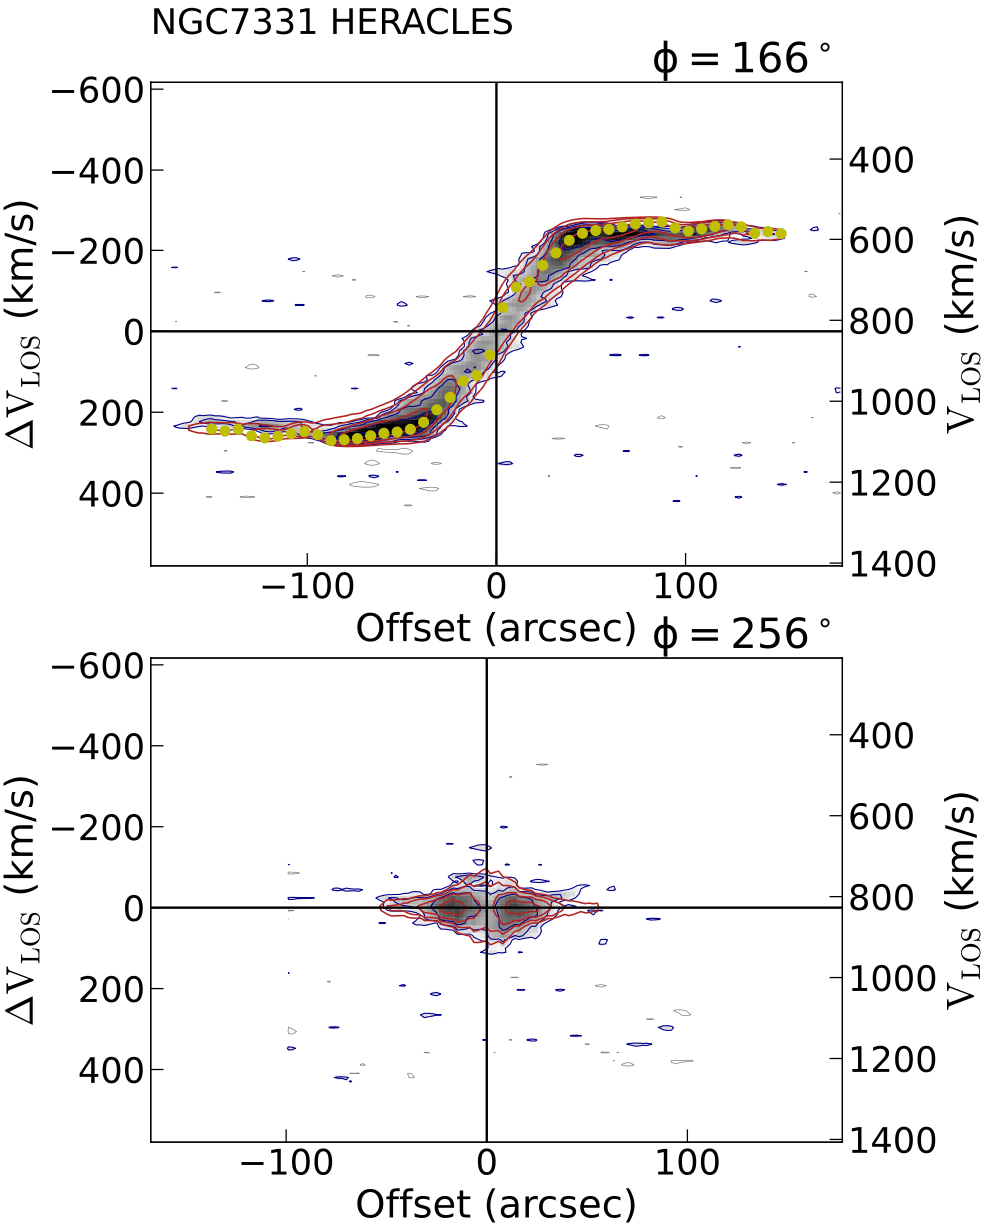
In this appendix, for all investigated galaxies, we plot the results of 3D tilted-ring modeling of THINGS and HERACLES data (by 3DBBarolo): rotation curves, inclination and PA profiles, the velocity fields and the best-field model, the P-V diagrams for major and minor axes.


Appendix B Monte Carlo simulations
In this appendix, for all investigated galaxies, we plot (Figs. 28–31) the results of Monte Carlo realization of the rotation curves and parameters derived from the subsequent decomposition. Here only parameters for the NFW halo and free are presented.