Statistics of remote regions of networks
Abstract
We delve into the statistical properties of regions within complex networks that are distant from vertices with high centralities, such as hubs or highly connected clusters. These remote regions play a pivotal role in shaping the asymptotic behaviours of various spreading processes and the features of associated spectra. We investigate the probability distribution of the number of vertices located at distance or beyond from a randomly chosen vertex in an undirected network. Earlier, this distribution and its large asymptotics were obtained theoretically for undirected uncorrelated networks [1]. Employing numerical simulations and analysing empirical data, we explore a wide range of real undirected networks and their models, including trees and loopy networks, and reveal that the inverse square law is valid even for networks with strong correlations. We observe this law in the networks demonstrating the small-world effect and containing vertices with degree (so-called leaves or dead ends). We find the specific classes of networks for which this law is not valid. Such networks include the finite-dimensional networks and the networks embedded in finite-dimensional spaces. We notice that long chains of nodes in networks reduce the range of for which the inverse square law can be spotted. Interestingly, we detect such long chains in the remote regions of the undirected projection of a large Web domain.
keywords:
complex networks , statistics , small-world effect[label1]organization=Departamento de Física da Universidade de Aveiro I3N,addressline=Campus Universitário de Santiago, city=Aveiro, postcode=3810-193, country=Portugal
[label2]organization=Ioffe Physico-Technical Institute,city=St. Petersburg, postcode=194021, country=Russia
1 Introduction
The particular focus within the research field of the statistical physics of complex networks is on the exploration and comprehension of the central regions of a network that house vertices with high centralities, such as hubs or highly connected clusters. A large number of various centrality measures are used for discovery and indexing of this important central part [2, 3, 4, 5, 6, 7, 8, 9, 10, 11]. The statistical properties of the remote regions of networks, distant from vertices with high centralities, are far less studied despite their significant role in the asymptotic behaviour of various spreading processes, random walks, and the features of associated spectra [12, 13, 14]. One of the simplest statistical characteristics of the remote regions of networks is the shape of the tail of the distribution of shortest-path lengths [15, 16, 17, 1, 18, 19, 20, 21, 22, 23, 24, 25]. Notably, in the networks demonstrating the small-world effect, this distribution approaches the delta function shape as the network size tends to infinity [26] in contrast to finite-dimensional networks (“large worlds”). Hence, the exploration of remote network regions suggests a focus on networks that are large yet finite in size. In this paper we consider another statistical characteristic of the remote network regions in the giant connected component, namely, the probability distribution of the number of vertices located at distance or beyond from a randomly chosen vertex. This distribution was obtained theoretically in Ref. [1] for the configuration model of undirected uncorrelated networks with an arbitrary degree distribution. It was shown that the large asymptotics of this distribution, for sufficiently large , follows the inverse square law
| (1) |
if an uncorrelated network contains leaves (dead end vertices), that is vertices of degree , while for the uncorrelated networks with the lowest non-zero degree of vertices equal , the asymptotics does not follow this law. In the intermediate case of the uncorrelated networks with the lowest non-zero degree of vertices equal , this asymptotics was obtained theoretically, but the range of its validity turned out to be narrow in reasonably sized networks, and so it is difficult to observe.
One should emphasize that uncorrelated networks are rather special in the sense that they account only complex degree distributions, devoiding of the various correlations and short cycles that are prevalent in the majority of real-world networks. Furthermore, these compact networks, despite their locally tree-like organization, contain cycles, and hence they cannot be proper trees. This is why the theoretical asymptotics, Eq. (1), was obtained only for a narrow class of networks. In this work we reveal that this inverse square asymptotics is actually observed in diverse real-world and synthetic undirected networks including strongly correlated networks, trees and loopy networks, demonstrating the small-world effect. These nets belong to the class of networks that is much wider than the uncorrelated networks. On the other hand, we indicate a set of networks for which this law is not valid. In particular, this set includes the finite-dimensional networks and the networks embedded in finite-dimensional metric spaces.
Each distribution, plotted in each figure of this paper, was measured for one network realization through numerical computation of the number of vertices located at distance or beyond from each (and every) vertex in that specific realization of the network.
The paper is structured as follows. In Section 2 we generate a number of synthetic networks, including an Erdős–Rényi random graph, a random uniform tree, growing trees and loopy networks with various degree distributions and correlations, and measure in these networks the distribution and its asymptotics. In Section 3 we analyze the structure of the remote regions of a set of real-world networks, including social networks, the Internet and the WWW, power grids, and road networks. We classify the networks in which the inverse square law is observed and indicate the networks in which it is not valid. In Section 4 we discuss our results.
2 Inverse square law in synthetic networks
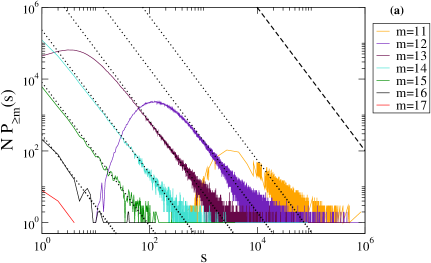
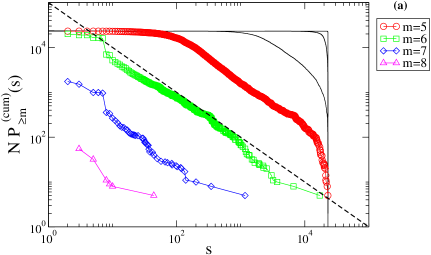
It is natural to start our study with an Erdős–Rényi random graph as the classical paradigm for random networks, being an uncorrelated network with a Poisson degree distribution. Figure 1(a) shows the distributions for different observed in the Erdős–Rényi random graph of vertices, each pair of which is interconnected with a probability , where the average degree of a vertex is . For the sake of comparison, for each in the plot we indicate the corresponding theoretical asymptotics from Ref. [1]:
| (2) |
In this asymptotics,
| (3) |
and
| (4) | |||||
| (5) |
where ( is the relative size of the giant connected component in the network) is the solution of the equation
| (6) |
Finally, the limit of the recursion
| (7) |
where the initial value is , , provides the constant in Eq. (2),
| (8) |
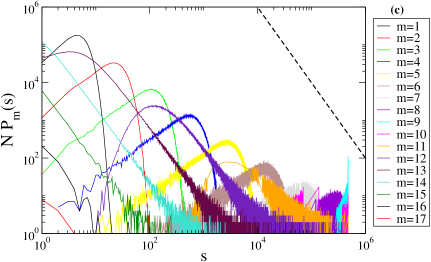
The function in Eq. (2) is the gamma function. Similar formulas describe the asymptotics of for the uncorrelated networks containing vertices of degree . Notice an excellent agreement between the measured distribution and the theoretical one. It will be more convenient to observe the cumulative distribution , for which this law, Eq. (1), corresponds to the asymptotics, see Fig. 1(b). Furthermore, Fig. 1(c) shows the distribution of the number of vertices located at distance from a randomly chosen vertex for different . One can see that for sufficiently large , the distribution is close to .
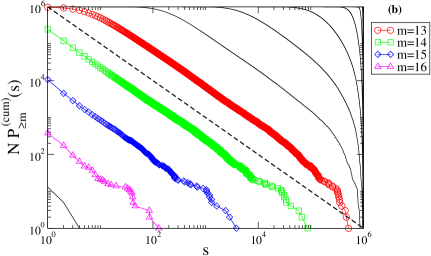
Let us now consider synthetic correlated networks. First we explore three recursive trees: the growth of two of them is driven by the linear preferential attachment algorithm, and hence they are scale-free, with the degree distribution exponents and (Barabási–Albert model—proportional preferential attachment), and the third is the random recursive tree, for which the degree distribution is exponential (). The first random tree has disassortative correlations between the degrees of the neighbouring vertices, the second has weak correlations, and the third has assortative correlations. All these growing random trees are small worlds. Figure 2 demonstrates that the cumulative distributions at sufficiently large decay as .
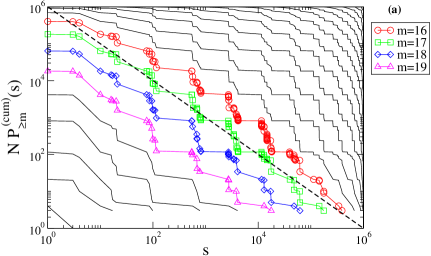
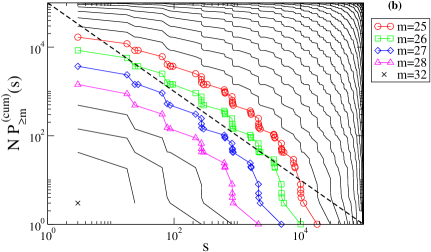
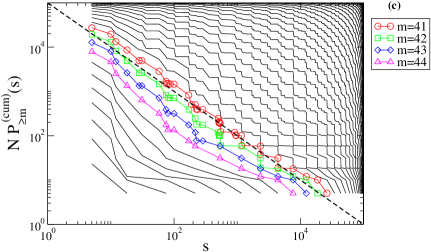
Figure 3 shows the cumulative distribution for a quite different tree, namely, for a connected uniform random tree, whose Hausdorff dimension equals , that is, this random tree is a “large world”. The figure demonstrates that the cumulative distribution does not have a power-law asymptotics.
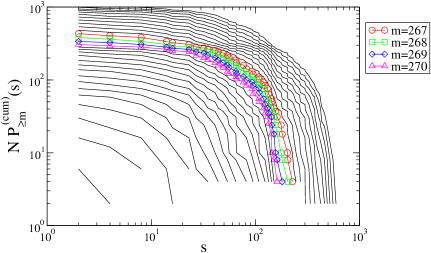
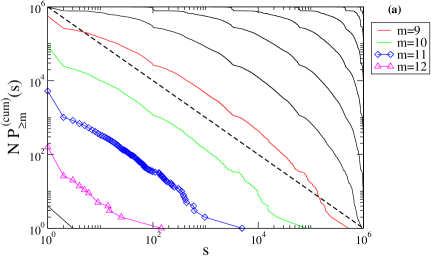
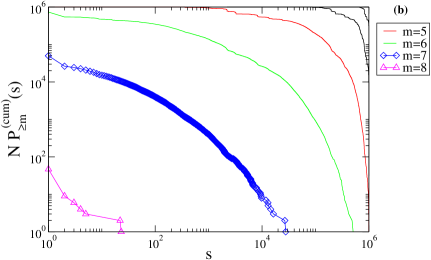
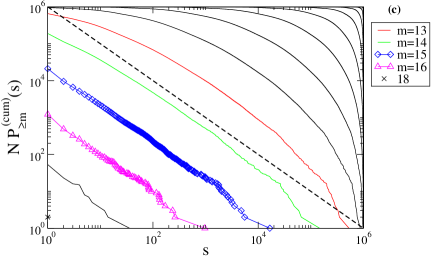
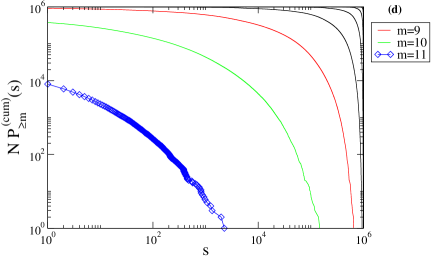
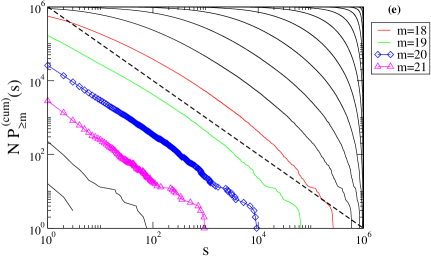
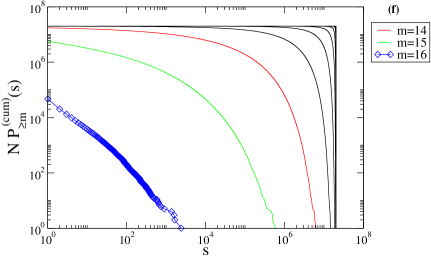
Figure 4 shows the cumulative distributions for loopy recursive networks whose growth is similar to the recursive trees in Fig. 2 with one difference. In contrast to the recursive trees, each new vertex in the networks in Fig. 4(a,c,e) attaches, with equal probability, to one or two existing vertices, and each new vertex in the networks in Fig. 4(b,d,f) attaches to two existing vertices. The existing vertices for attachment are chosen by the rules implemented for the recursive trees in Fig. 1(a,b,c). The degree distributions and correlations of the trees in Fig. 1(a,b,c) and the loopy networks in, respectively, Fig. 4(a,c,e) and Fig. 4(b,d,f) are similar. One can see the asymptotics of the cumulative distributions for the loopy growing networks in Fig. 4(a,c,e), which have vertices of degree , while this asymptotics is not observed in the loopy growing networks in Fig. 4(b,d,f), which have no vertices of degree , despite their large sizes.
In Table 1 we list the basic structural characteristics of the synthetic networks considered in this paper.
| Network | (Fig.) | ||||
|---|---|---|---|---|---|
| Erdős-Rényi | (1) | 20 | 8.76 | 17 | |
| Recursive random 2.2 tree | (2a) | 78,743 | 6.24 | 24 | |
| Recursive BA tree | (2b) | 514 | 12.45 | 32 | |
| Recursive random tree | (2c) | 16 | 20.54 | 51 | |
| Uniform random tree | (3) | 8 | 106.2 | 285 | |
| Recursive 2.2 mixed | (4a) | 119,422 | 4.173 | 13 | |
| Recursive 2.2 to two | (4b) | 178,791 | 3.435 | 8 | |
| Recursive BA mixed | (4c) | 2,241 | 7.66 | 18 | |
| Recursive BA to two | (4d) | 2,647 | 6.73 | 12 | |
| Recursive random mixed | (4e) | 32 | 11.24 | 23 | |
| Recursive random to two | (4f) | 43 | 10.89 | 16 |
3 The statistics of remote regions in real-world networks
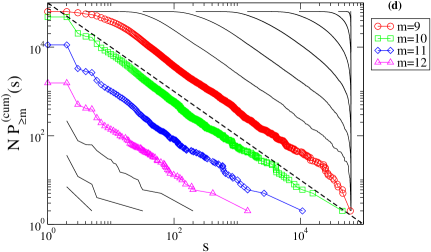
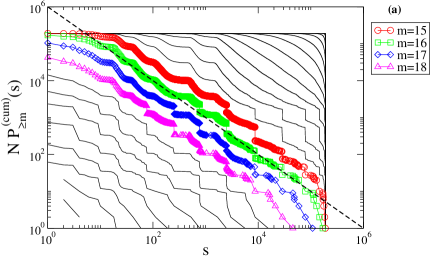
Real-world networks typically have more complicated architectures than synthetic ones, and so one could expect that the observation of the inverse square law in real networks is more difficult. Surprisingly, this is not the case. In Table 2 we list the basic structural characteristics of the real-world networks considered in this paper. Figure 5 shows the cumulative distributions for the maps of the large regions of four collaboration and social networks, namely, the FP5 net, CiteSeer, the Youtube friends network, and Facebook. For all four sets of cumulative distributions we observe the asymptotics.
| Network | (Fig.) | ||||
| FP5 | (5a) | 25,287 | 2,783 | 3.14 | 8 |
| CiteSeer | (5b) | 365,154 | 1,739 | 6.470 | 34 |
| YouTube | (5c) | 1,134,890 | 28,754 | 5.279 | 24 |
| (5d) | 63,392 | 1,098 | 4.322 | 15 | |
| Routers CAIDA | (6a) | 192,244 | 1,071 | 6.98 | 26 |
| AS CAIDA | (6b) | 26,475 | 2628 | 3.876 | 17 |
| US power grid | (7a) | 4,941 | 19 | 18.99 | 46 |
| Road newtork PA | (7b) | 1,087,562 | 9 | 308.0 | 794 |
| Google web | (8a) | 15,763 | 11,401 | 2.517 | 7 |
| Web Stanford | (9) | 255,265 | 38,625 | 6.815 | 164 |
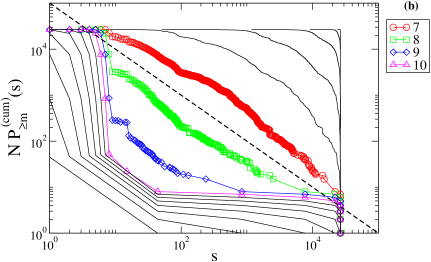
We also observe this asymptotics inspecting the cumulative distributions for the Internet networks [36]: the maps of the routers and the autonomous systems, see Fig. 6. On the other hand, as is natural, the US power grid and the road network of Pennsylvania, which are two-dimensional networks, do not demonstrate the power-law asymptotics of , see Fig. 7.
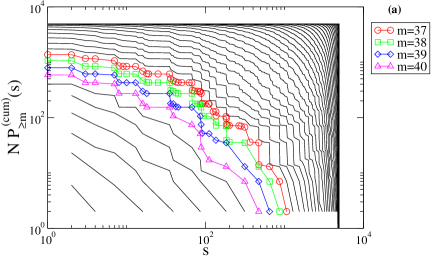
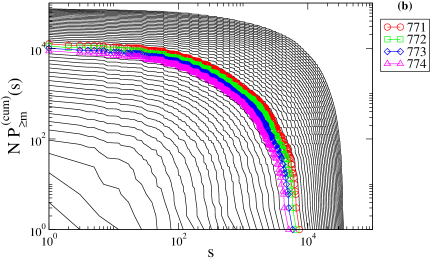
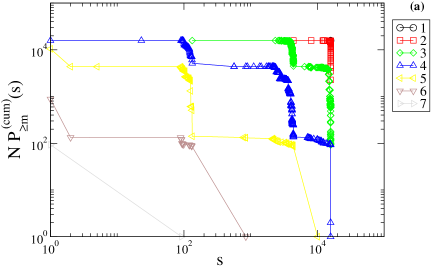
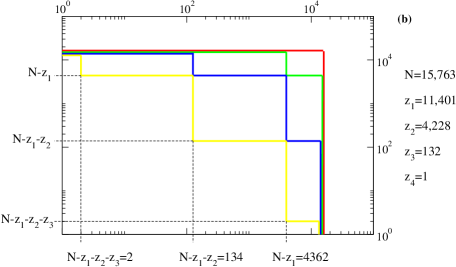
Figure 8(a) shows the cumulative distributions for a real-world network with a very large hub. This is the undirected projection of a network of 171,206 hyperlinks between 15,763 pages within Google’s sites. The largest hub in this network has huge degree 11,401, which shapes the architecture of this specific network. The steps in the empirical cumulative distributions in Fig. 8(a) can be reproduced in a tree-like model network mimicking the structure of the Google net. Imagine a tree-like network with the hub having the same numbers of the first-, second-, third-, etc.-nearest neighbours as the hub in the Google net. For this model network one can easily estimate , see Fig. 8(b), and get a quantitative agreement with the empirical distribution for , , , and . The small size of this network does not allow us to check whether this special network architecture still provides the inverse square law or not.
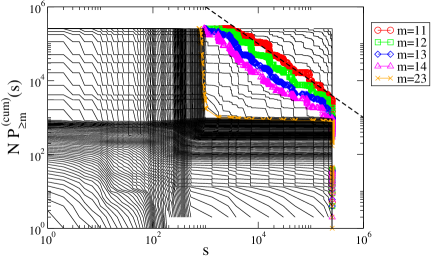
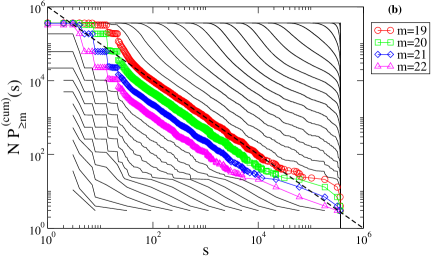
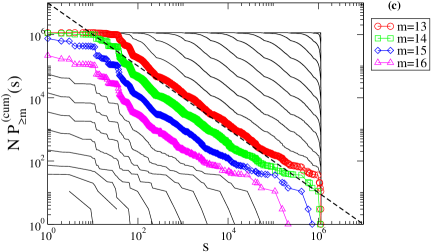
Figure 9 shows an interesting set of the cumulative distributions for the undirected projection of a large Stanford Web domain (notice a similar set of cumulative distributions in Fig. 6(b)). These empirical cumulative distributions have the asymptotics for within the range between and , but for larger , the cumulative distributions become step-like. This step-like shape suggests a specific structure of the remote regions of this network. To understand the organization of the connections between the vertices within the remote regions of the network, we extract the vertices at a distance or beyond from the largest hub in the undirected projection of the giant weakly connected component of the network and edges between them, and visualize the resulting clusters, indicating, for the sake of completeness, the directed edges of the original directed network. In total, there are vertices in these clusters and directed edges. Fig. 10 demonstrates this visualization (see also Ancillary file). Notice that almost all these directed edges are reciprocal. Only directed edges are not reciprocal. This gives the remarkably high fraction of reciprocal edges in these clusters. The same edge number computation performed including the main part of the network gives a total of directed edges, of which are not reciprocal, resulting in a much lower value, , for the fraction of reciprocal edges. We see that in this region the network is a set of long chains. Notably, only of these chains have one of their ends free, and the remaining chains are parts of long cycles. Loosely speaking, the Web in this remote region is one-dimensional.

4 Discussion and conclusions
We have explored one of the basic structural statistical characteristics of the remote regions of complex networks, which previously was known only for uncorrelated networks. We have observed the asymptotics of the distribution of the number of vertices located at distance or beyond from a randomly chosen vertex in a large set of real and synthetic undirected networks—small worlds—with a surprisingly diverse architectures. Such networks include trees and loopy networks, networks with strong and weak correlations, the one-partite projections of bipartite networks (FP5 net), the undirected projections of directed networks (Stanford Web), collaboration and social networks, the Internet and Web networks. This inverse square law is not observed in the networks having no dead ends (vertices of degree ) and in finite dimensional networks (power grids, road networks).
For each of these networks we inspected the product of the cumulative distribution by , , which turned out approximately symmetric for all tested cases in the sense that the - and -axes of the plots can be interchanged.
Moreover, we have revealed that the organization of connections between vertices within the remote regions of networks differs dramatically from the main part of the network, see Fig. 10 and Ancillary file. In particular, we have observed a surprisingly high reciprocity of directed edges in the remote region of the Stanford domain of the Web, while the reciprocity equals only in the entire domain.
One should emphasize that the theoretical results of Ref. [1] for uncorrelated network still do not offer a compelling explanation for the consistent observation of the inverse square law across such a wide spectrum of networks. The explanation of this law is a challenge for the future work. Note that if we assume that the distribution has a power-law asymptotics, then, for the divergence of the first moment of this distribution (average number of vertices at distance or beyond from a randomly chosen vertex), the exponent of this power law must be not greater that . Hence the observed exponent of the asymptotics is the maximum possible value.
Other challenging directions for the future work are the exploration of remote regions of directed networks and examining the role of the chain structures observed in this work in network processes.
CRediT authorship contribution statement
J.G. Oliveira: Planning and revision of the manuscript, Designed the study, Carried out numerical simulations, Writing original draft. S.N. Dorogovtsev: Planning and revision of the manuscript, Designed the study, Carried out analytical and numerical calculations, Writing original draft. J.F.F. Mendes: Planning and revision of the manuscript.
Declaration of Competing Interest
The authors declare that they have no known competing financial interests or personal relationships that could have appeared to influence the work reported in this paper.
Acknowledgments
This work was developed within the scope of the project i3N, UIDB/50025/2020 and UIDP/50025/2020, financed by national funds through the FCT/MEC. J. G. O. acknowledges fruitful discussions with M. Argollo de Menezes and A. Vázquez.
References
- Dorogovtsev et al. [2003] S. N. Dorogovtsev, J. F. F. Mendes, A. N. Samukhin, Metric structure of random networks, Nucl. Phys. B 653 (2003) 307.
- Perra and Fortunato [2008] N. Perra, S. Fortunato, Spectral centrality measures in complex networks, Phys. Rev. E 78 (2008) 036107.
- Katz [1953] L. Katz, A new status index derived from sociometric analysis, Psychometrika 18 (1953) 39.
- Brin and Page [1998] S. Brin, L. Page, The anatomy of a large-scale hypertextual web search engine, in: Proceedings of the Seventh International World Wide Web Conference, Elsevier, Amsterdam, 1998, pp. 107–117.
- Page et al. [1999] L. Page, S. Brin, R. Motwani, T. Winograd, The PageRank citation ranking: Bringing order to the web, Technical Report, Stanford InfoLab, 1999.
- Freeman [1977] L. C. Freeman, A set of measures of centrality based on betweenness, Sociometry 40 (1977) 35.
- Newman [2005] M. E. J. Newman, A measure of betweenness centrality based on random walks, Social Networks 27 (2005) 39.
- Newman [2010] M. E. J. Newman, Networks: An Introduction, Oxford University Press, Oxford, 2010.
- Martin et al. [2014] T. Martin, X. Zhang, M. E. J. Newman, Localization and centrality in networks, Phys. Rev. E 90 (2014) 052808.
- Newman and Girvan [2004] M. E. J. Newman, M. Girvan, Finding and evaluating community structure in networks, Phys. Rev. E 69 (2004) 026113.
- Estrada and Rodriguez-Velazquez [2005] E. Estrada, J. A. Rodriguez-Velazquez, Subgraph centrality in complex networks, Phys. Rev. E 71 (2005) 056103.
- Levin and Peres [2017] D. A. Levin, Y. Peres, Markov Chains and Mixing Times, volume 107, American Mathematical Society, Providence, RI, 2017.
- Samukhin et al. [2008] A. N. Samukhin, S. N. Dorogovtsev, J. F. F. Mendes, Laplacian spectra of, and random walks on, complex networks: Are scale-free architectures really important?, Phys. Rev. E 77 (2008) 036115.
- Vukadinović et al. [2002] D. Vukadinović, P. Huang, T. Erlebach, On the spectrum and structure of Internet topology graphs, in: International Workshop on Innovative Internet Community Systems, Lecture Notes in Computer Science, volume 2346, Springer, Berlin, 2002, pp. 83–95.
- Dorogovtsev and Mendes [2022] S. N. Dorogovtsev, J. F. F. Mendes, The Nature of Complex Networks, Oxford University Press, Oxford, 2022.
- Krapivsky and Redner [2001] P. L. Krapivsky, S. Redner, Organization of growing random networks, Phys. Rev. E 63 (2001) 066123.
- Dorogovtsev and Mendes [2002] S. N. Dorogovtsev, J. F. F. Mendes, Evolution of networks, Adv. Phys. 51 (2002) 1079.
- Fronczak et al. [2004] A. Fronczak, P. Fronczak, J. A. Hołyst, Average path length in random networks, Phys. Rev. E 70 (2004) 056110.
- van der Hofstad et al. [2005] R. van der Hofstad, G. Hooghiemstra, P. Van Mieghem, Distances in random graphs with finite variance degrees, Random Struct. Algorithms 27 (2005) 76.
- van der Hofstad et al. [2007] R. van der Hofstad, G. Hooghiemstra, D. Znamenski, Distances in random graphs with finite mean and infinite variance degrees, Electron. J. Probab. 12 (2007) 703.
- Dorogovtsev et al. [2006] S. N. Dorogovtsev, J. F. F. Mendes, J. G. Oliveira, Degree-dependent intervertex separation in complex networks, Phys. Rev. E 73 (2006) 056122.
- Morohosi [2010] H. Morohosi, Measuring the network robustness by Monte Carlo estimation of shortest path length distribution, Math. Comput. Simul. 81 (2010) 551.
- Katzav et al. [2015] E. Katzav, M. Nitzan, D. Ben-Avraham, P. L. Krapivsky, R. Kühn, N. Ross, O. Biham, Analytical results for the distribution of shortest path lengths in random networks, Europhys. Lett. 111 (2015) 26006.
- Katzav et al. [2018] E. Katzav, O. Biham, A. K. Hartmann, Distribution of shortest path lengths in subcritical Erdős–Rényi networks, Phys. Rev. E 98 (2018) 012301.
- Tishby et al. [2022] I. Tishby, O. Biham, R. Kühn, E. Katzav, The mean and variance of the distribution of shortest path lengths of random regular graphs, J. Phys. A: Mathematical and Theoretical 55 (2022) 265005.
- Dorogovtsev et al. [2008] S. N. Dorogovtsev, J. F. F. Mendes, A. N. Samukhin, A. Y. Zyuzin, Organization of modular networks, Phys. Rev. E 78 (2008) 056106.
- Aldous [1990] D. J. Aldous, The random walk construction of uniform spanning trees and uniform labelled trees, SIAM J. Discret. Math. 3 (1990) 450.
- Broder [1989] A. Z. Broder, Generating random spanning trees, in: 30th Annual Symposium on Foundations of Computer Science (Research Triangle Park, North Carolina, 30 Oct.—1 Nov. 1989), IEEE, New York, 1989, pp. 442–447.
- Almendral et al. [2007a] J. A. Almendral, J. G. Oliveira, L. López, J. F. F. Mendes, M. A. Sanjuán, The network of scientific collaborations within the European Framework Programme, Physica A: Statistical Mechanics and its Applications 384 (2007a) 675–683.
- Almendral et al. [2007b] J. A. Almendral, J. G. Oliveira, L. López, M. A. F. Sanjuán, J. F. F. Mendes, The interplay of universities and industry through the FP5 network, New Journal of Physics 9 (2007b) 183 – 183.
- Kunegis [2013] J. Kunegis, Konect: the koblenz network collection, Proceedings of the 22nd International Conference on World Wide Web (2013). URL: https://api.semanticscholar.org/CorpusID:15005100.
- Mislove et al. [2007] A. Mislove, M. Marcon, K. P. Gummadi, P. Druschel, B. Bhattacharjee, Measurement and Analysis of Online Social Networks, in: Proceedings of the 5th ACM/Usenix Internet Measurement Conference (IMC’07), San Diego, CA, 2007.
- Viswanath et al. [2009] B. Viswanath, A. Mislove, M. Cha, K. P. Gummadi, On the evolution of user interaction in facebook, in: Proceedings of the 2nd ACM SIGCOMM Workshop on Social Networks (WOSN’09), 2009.
- cai [2013] CAIDA Skitter Router-Level Topology and Degree Distribution, from April 21 to May 8, 2003, https://www.caida.org/catalog/datasets/router-adjacencies/, 2013.
- as_[2013] The dataset contains 122 CAIDA AS graphs, from January 2004 to November 2007, http://www.caida.org/data/active/as-relationships/, 2013.
- Pastor-Satorras and Vespignani [2004] R. Pastor-Satorras, A. Vespignani, Evolution and Structure of the Internet: A Statistical Physics Approach, Cambridge University Press, Cambridge, 2004.
- Watts and Strogatz [1998] D. J. Watts, S. H. Strogatz, Collective dynamics of ’small-world’ networks, Nature 393 (1998) 440–442.
- Leskovec et al. [2009] J. Leskovec, K. J. Lang, A. Dasgupta, M. W. Mahoney, Community structure in large networks: Natural cluster sizes and the absence of large well-defined clusters, Internet Math. 6 (2009) 29–123.
- Palla et al. [2007] G. Palla, I. J. Farkas, P. Pollner, I. Derényi, T. Vicsek, Directed network modules, New J. Phys. 9 (2007) 186.
- Batagelj [1998] V. Batagelj, Mrvar: Pajek - program for large network analysis, Connections 21 (1998) 47–57.