The evolution of the cold gas fraction in nearby clusters ram-pressure stripped galaxies
Abstract
Cluster galaxies are affected by the surrounding environment, which influences, in particular, their gas, stellar content and morphology. In particular, the ram-pressure exerted by the intracluster medium promotes the formation of multi-phase tails of stripped gas detectable both at optical wavelengths and in the sub-mm and radio regimes, tracing the cold molecular and atomic gas components, respectively. In this work we analyze a sample of sixteen galaxies belonging to clusters at redshift showing evidence of an asymmetric H\scaleto1.2ex morphology (based on MeerKAT observations) with and without a star forming tail. To this sample we add three galaxies with evidence of a star forming tail and no H\scaleto1.2ex detection. Here we present the galaxies gas content from APEX observations of the CO(2-1) emission. We find that in most galaxies with a star forming tail the global content is enhanced with respect to undisturbed field galaxies with similar stellar masses, suggesting an evolutionary path driven by the ram-pressure stripping. As galaxies enter into the clusters their H\scaleto1.2ex is displaced but also partially converted into , so that they are enriched when they pass close to the pericenter, i. e. when they develop the star forming tails that are visible in UV/B broad bands and in H emission. An inspection of the phase-space diagram for our sample suggests an anticorrelation between the H\scaleto1.2ex and gas phases as galaxies fall into the cluster potential. This peculiar behaviour is a key signature of the ram-pressure stripping in action.
1 Introduction
Cluster galaxies are well known to display global properties which are different from those exhibited by galaxies located in the field: their integrated colors are redder, at fixed morphology; the distribution of morphological types is skewed toward a preponderance of early-type galaxies, at least where the local density is higher (Dressler, 1980; Fasano et al., 2015; Vulcani et al., 2023); their Star Formation History often shows signatures of quenching, both on long (the so-called starvation) and short timescales (Guglielmo et al., 2015; Paccagnella et al., 2016, 2017, 2019). All these properties are obviously correlated, but which transformation happens first and when is still a matter of debate. Various physical mechanism can shape galaxy properties in dense environments (Boselli & Gavazzi, 2006; Cortese et al., 2021), among which we recall the galaxy interaction through multiple encounters and interaction with the cluster potential (Byrd & Valtonen, 1990; Moore et al., 1999), the thermal evaporation of the cold interstellar medium (ISM) at the interface with the hot intracluster medium (Cowie & Songaila, 1977), the exhaustion of the atomic gas fuel (starvation) caused by the removal of the circum-galactic hot corona due to the interaction with the intracluster medium (Larson et al., 1980), the removal of the gas from the star forming disk of late-type galaxies due to the viscosity momentum transfer with the intracluster medium (Nulsen, 1982) or due to their infall toward the central region of the cluster. This last mechanism is called ram-pressure stripping (hereafter RPS) (Gunn & Gott, 1972), and it has been extensively studied first through the radio continuum and 21-cm emission of the cold atomic gas (Gavazzi, 1978). More recently, thanks to the availability of Integral Field Units operating at optical wavelengths, the ionized gas emission (sometimes associated with the ongoing star formation) in the stripped gaseous tails originated from this mechanism has started to be studied in local and intermediate redshifts environments (Merluzzi et al., 2013; Fumagalli et al., 2014; Fossati et al., 2016; Poggianti et al., 2017a; Moretti et al., 2022) .
In particular, the GASP111https://web.oapd.inaf.it/gasp/ survey (Poggianti et al., 2017a) used MUSE integral field data of a large sample of galaxies in low redshift clusters showing evidences of RPS, allowing a statistically significant view on this mechanism. The GASP sample of cluster galaxies has been selected on the basis of the optical morphology, i. e. mostly relying on the asymmetries evidenced by the B-band emission in WINGS/OmegaWINGS images (Poggianti et al., 2016), and is therefore biased towards galaxies with an optical star forming tail. In fact, most GASP galaxies have star forming tails, where the star formation takes place in knots, recently resolved by HST data (Gullieuszik et al., 2023; Giunchi et al., 2023). MUSE data have also confirmed that, together with the appearance of the optical tail, galaxies experience an enhanced star formation in the disk (Vulcani et al., 2018). At the same time, GASP galaxies with an H\scaleto1.2ex mass determination (Ramatsoku et al., 2019, 2020; Deb et al., 2022) have shown a short H\scaleto1.2ex depletion time in the disk. Unfortunately, the spatial resolution of our H\scaleto1.2ex VLA data does not allow a mapping of the depletion time, but only the derivation of a global value. Before the advent of MUSE, in fact, RPS was already a well known mechanism, as H\scaleto1.2ex dedicated studies of nearby clusters already demonstrated how this phenomenon is able to produce galaxies with asymmetric disks, sometimes leading to cold gas tails and to almost completely stripped disks (Kenney & Young, 1989; Kenney et al., 2004; Chung et al., 2007; Cortese et al., 2010; Hess et al., 2022). Further evidence of stripping have been also detected using X-ray emission (Sun et al., 2010; Jachym et al., 2017; Campitiello et al., 2021; Bartolini et al., 2022) and low frequency data (Gavazzi, 1978; Gavazzi et al., 1995; Roberts et al., 2021; Ignesti et al., 2022). In fact, the ability to detect RPS in action selecting galaxies on the basis of their optical appearance was somewhat unexpected until the advent of the MUSE IFU, able to detect all the optical emission lines needed to identify star forming regions in the gaseous tails. In the last 20 years, therefore, the RPS studies shifted from searching for peculiar objects with asymmetric H\scaleto1.2ex morphologies in nearby clusters to characterizing their overall incidence, and to study the complex interplay between the various gas phases (Poggianti et al., 2019). The first of these studies were carried out in the nearby Virgo Cluster (Corbelli et al., 2012; Boselli et al., 2014), and it is recently the subject of a dedicated observational effort to detect both the ionized gas properties (Boselli et al., 2018) and the molecular gas distribution and properties with ALMA data (Brown et al., 2021, VERTICO survey), coupling them with resolved H\scaleto1.2ex from the VIVA survey (Chung et al., 2009; Yoon et al., 2017). Resolved and deep observations on Virgo are being complemented nowadays with the ViCTORIA survey with MeerKAT (Boselli et al., 2023). Virgo galaxies have been confirmed to be subject to H\scaleto1.2ex and depletion, albeit with different efficiency: when looking at the spatially resolved properties, it turns out that while the H\scaleto1.2ex gets more easily displaced, the seems to be more centrally concentrated, suggesting that it is stripped as well in the disk outskirts (Zabel et al., 2022; Villanueva et al., 2022). However, in Virgo galaxies the overall molecular gas content is not dramatically different from field galaxies, but galaxies showing evidence of ram pressure stripping seem to be slightly enriched in (Zabel et al., 2022).
Besides Virgo, the multiphase ISM is being studied in the other two nearest clusters Fornax (Loni et al., 2021; Kleiner et al., 2021; Morokuma-Matsui et al., 2022; Serra et al., 2023; Kleiner et al., 2023) and Coma (Roberts & Parker, 2020; Molnár et al., 2022), using datasets with an homogeneous observational coverage over a wide field of view, finding results that bear a dependence on the hosting cluster mass. Fornax shows a slight H\scaleto1.2ex deficiency corresponding to a slight SFR decrease, whereas in Coma galaxies seem to be simultaneously H\scaleto1.2ex deficient and SFR enhanced. In both cases, though, the molecular gas content of cluster galaxies is not yet firmly established.
However, APEX/ALMA data do exist for some of the GASP galaxies and they show the global content to be enhanced with respect to field galaxies having a comparable stellar mass (Moretti et al., 2018, 2020a), leading to the suggestion that the part of the H\scaleto1.2ex gas is efficiently converted into . In fact, an increase in the gas pressure, adding to the hydrostatic midplane one, is expected to be observed where the RP hits the galaxy disk, and may cause such an efficient conversion of the atomic cold gas in the molecular phase (Elmegreen, 1993; Wong & Blitz, 2002; Leroy et al., 2008; Krumholz et al., 2009; Sun et al., 2020). Alternatively, the gas compression could follow the gas motion induced by the RP favoring the conversion along the direction of the stripping. Both these effects will be strongly dependent on the geometry of the stripping, and could only be analyzed using spatially resolved observations.
It is worth noticing, though, that GASP galaxies analyzed so far are all in the so called ”peak stripping” phase, i.e. they have been caught at their pericentric passage, where the optical star forming tail is more evident. Their molecular gas content may be enhanced for a correspondingly short timescale (i.e. for the short period they are at the pericenter). The question which naturally arises is whether the different gas phases trace an evolutionary sequence in the ram pressure mechanism, which implies that mapping together galaxies with a different degree of stripping in optical/H\scaleto1.2ex/, is possibly evidencing the typical signature of this effect. We therefore analyze in this paper a sample of 19 galaxies showing evidence of stripping in H\scaleto1.2ex/optical, with the aim of deriving the temporal sequence of the ram pressure stripping. We describe the target selection in Sec.2, we then analyze APEX data in Sec.3 and report on the cold gas content of these galaxies in Sec.4. We then analyze the cold gas components (H\scaleto1.2ex and ) in Sec. 5 and we draw our conclusions in Sec.6.
Throughout this paper we make use of the standard cosmology , and and we express stellar masses using the Chabrier Initial Mass Function (IMF, Chabrier, 2003).
2 Targets selection
In order to select our targets we needed a good H\scaleto1.2ex and optical coverage with a wide field of view. We therefore matched the OmegaWINGS cluster catalog (Gullieuszik et al., 2015; Moretti et al., 2017) with the MeerKAT Galaxy Cluster Legacy Survey (MGCLS; Knowles et al., 2022) and we ended up with the three clusters A85, A3376 and A3558 for which we possess the H\scaleto1.2ex emission datacubes and the spectroscopic coverage. The analysis of the MeerKAT data will be described in Sec. 3.1. We selected all galaxies in these 3 clusters whose H\scaleto1.2ex contours were asymmetric, as, given the low physical resolution (30 kpc), we consider these asymmetries as candidate tails of stripped gas. For simplicity, in the rest of this paper we refer to the asymmetries at all wavelengths, including those at 21 cm, as tails. A posteriori, we checked whether there was evidence for a coincident stellar tail either in the B-band (from Gullieuszik et al., 2015; Poggianti et al., 2016) or in the UV (from George et al., 2023, and George et al. in prep., using UVIT on AstroSat observations), when available.
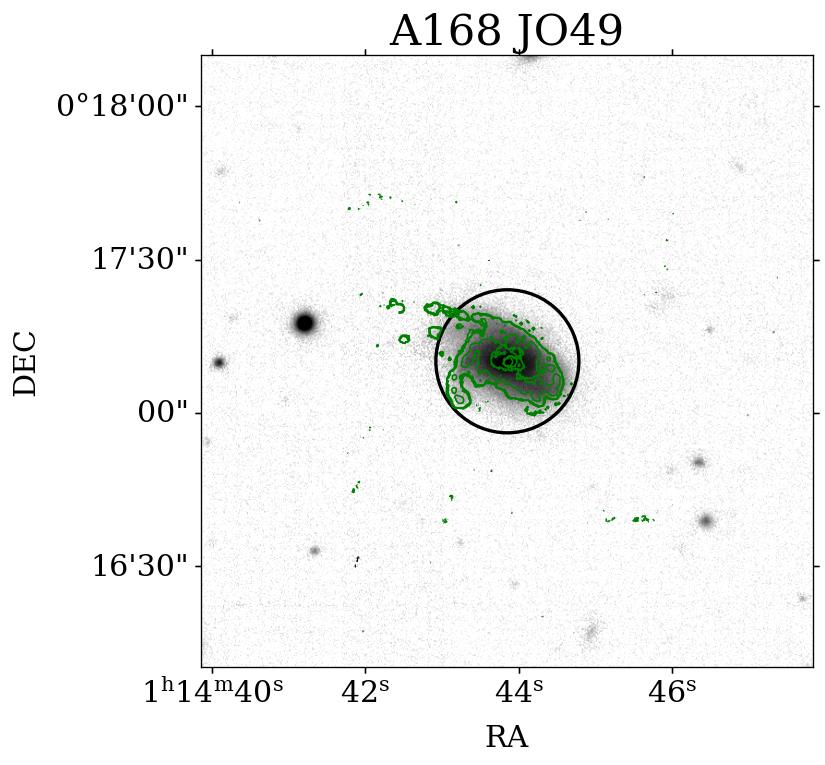
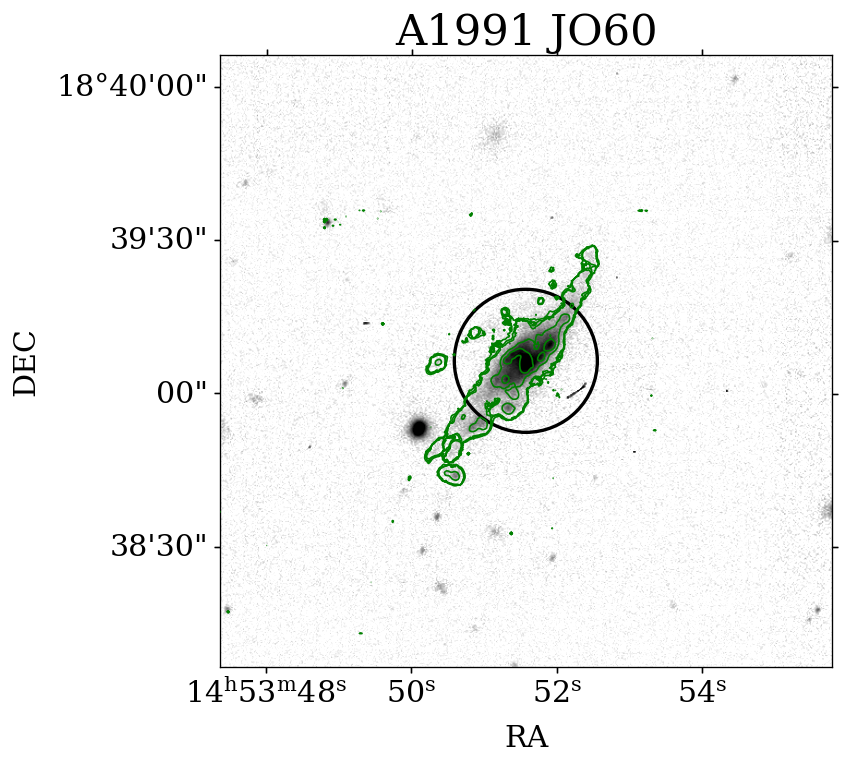
We finally excluded from the sample those galaxies having a stellar mass below 1010 , as they would require much deeper observations to detect a possible deficiency. We ended up with a sample of 16 targets. To this we added one galaxy showing a truncated disk morphology from the H emission (A3376_JW108) and two more galaxies belonging to clusters not yet covered by MeerKAT observations, which we selected because of their clear star-forming tails based on GASP MUSE data. These two galaxies are JO49 in A168 and JO60 in A1991 and have been both classified as jellyfishes by GASP, meaning that they have an ionized gas tail at least as long as the stellar disk. For them, our analysis is limited to the molecular gas content, but cannot include the H\scaleto1.2ex content.
Tab. 1 contains the list of the observed targets as well as their optical coordinates, spectroscopic redshifts, and stellar masses. The stellar masses have been derived from the existing optical spectroscopy either as fiber spectroscopy from the WINGS/OmegaWINGS spectra, corrected for aperture effects to a total mass, or from the IFU integral within the galaxy disks for the galaxies that possess MUSE data from GASP Vulcani et al. (2018). When none of these information were available we used the stellar masses derived in Vulcani et al. (2022) using the optical photometry. We also give in Col. 6 of Tab.1 the flag indicating whether the galaxy possess a star forming tail or not: we defined as star forming any tail with UV/H or B-band emission (where the H comes from the GASP data, when available), while we tagged as non star-forming those asymmetric H\scaleto1.2ex emission without any evidence of young stars in the tail direction. Tab.1 also contains the GASP name, when available, the classification of the galaxy according to the MUSE optical data (Poggianti+, in prep.) and the MeerKAT identification and H\scaleto1.2ex mass. Finally, the last column refers to the H\scaleto1.2ex morphology classified according to Yoon et al. (2017), that we will discuss in Sec.5 where we relate the properties of the two cold gas phases.
=3.5cm {rotatetable} . The last column shows the H\scaleto1.2ex classification according to (Yoon et al., 2017).
| Galaxy | RA | DEC | z | log(M⋆) | SF | GASP ID/Stripping stage | MKTCS-HI id | log(MHI) | H\scaleto1.2ex class |
|---|---|---|---|---|---|---|---|---|---|
| tail | |||||||||
| A168_JO49 | 01:14:43.85 | +00:17:10.1 | 0.0453 | 10.7 | y | JO49, Peak (Jellyfish) | |||
| A1991_JO60 | 14:53:51.57 | +18:39:06.4 | 0.0621 | 10.4 | y | JO60, Peak (Jellyfish) | |||
| A3376_JW108 | 06:00:47.96 | -39:55:07.4 | 0.0479 | 10.5 | y | JW108, Advanced (Trunc. disk) | None | ||
| A3376_S45 | 06:02:41.30 | -40:14:57.2 | 0.0454 | 10.3 | y | J060241.16-401458.5 | 9.6 | I | |
| A3376_S49 | 06:00:54.17 | -39:39:54.7 | 0.0465 | 10.3 | y | J060053.89-393954.9 | 9.2 | II | |
| A3376_S55 | 06:02:55.44 | -40:22:11.0 | 0.0469 | 10.3 | y | J060255.77-402211.0 | 9.6 | I | |
| A3376_S54 | 05:59:58.37 | -40:00:34.8 | 0.0469 | 10.0 | y | J055958.48-400039.0 | 8.8 | IV | |
| A3376_S58 | 06:01:42.91 | -39:56:39.7 | 0.0473 | 10.5 | y | J060142.83-395642.5 | 9.0 | IV | |
| A3376_S64 | 06:01:06.96 | -39:55:01.8 | 0.0480 | 10.1 | y | J060107.48-395458.7 | 9.4 | II | |
| A3376_S74 | 06:02:07.09 | -39:42:30.4 | 0.0504 | 10.7 | n | J060207.27-394226.5 | 9.2 | II | |
| A3376_S75 | 06:00:13.66 | -39:34:48.4 | 0.0509 | 11.0 | n | A3376_B_0261, Control | J060013.80-393449.6 | 9.6 | I |
| A3376_S84 | 06:00:47.32 | -40:19:45.0 | 0.0533 | 11.0 | n | J060047.86-401953.1 | 9.2 | III | |
| A3558_S167 | 13:26:49.75 | -31:23:44.5 | 0.0506 | 11.0 | y | JO147, Peak (Jellyfish) | J132649.98-312336.6 | 9.1 | II |
| A3558_S60 | 13:28:18.24 | -31:48:17.1 | 0.0449 | 10.1 | y | JO157, Initial | J132817.83-314814.0 | 9.5 | I |
| A3558_S124 | 13:26:35.67 | -30:59:36.3 | 0.0482 | 10.2 | y | JO159, Initial | J132635.48-305935.6 | 9.5 | I |
| A3558_S134 | 13:29:28.54 | -31:39:25.4 | 0.0481 | 10.1 | y | JO160, Peak (Jellyfish) | J132927.44-313922.8 | 9.3 | II |
| A85_S57 | 00:40:31.65 | -09:13:19.8 | 0.0512 | 11.2 | n | J004031.89-091318.2 | 9.5 | II | |
| A85_S64 | 00:42:05.03 | -09:32:04.0 | 0.0529 | 10.9 | n | JO200, Unwinding/face-on | J004205.02-093206.5 | 9.8 | I |
| A85_S90 | 00:42:31.94 | -09:17:50.4 | 0.0076* | 10.4 | n | J004231.46-091746.1 | 9.2 | II |
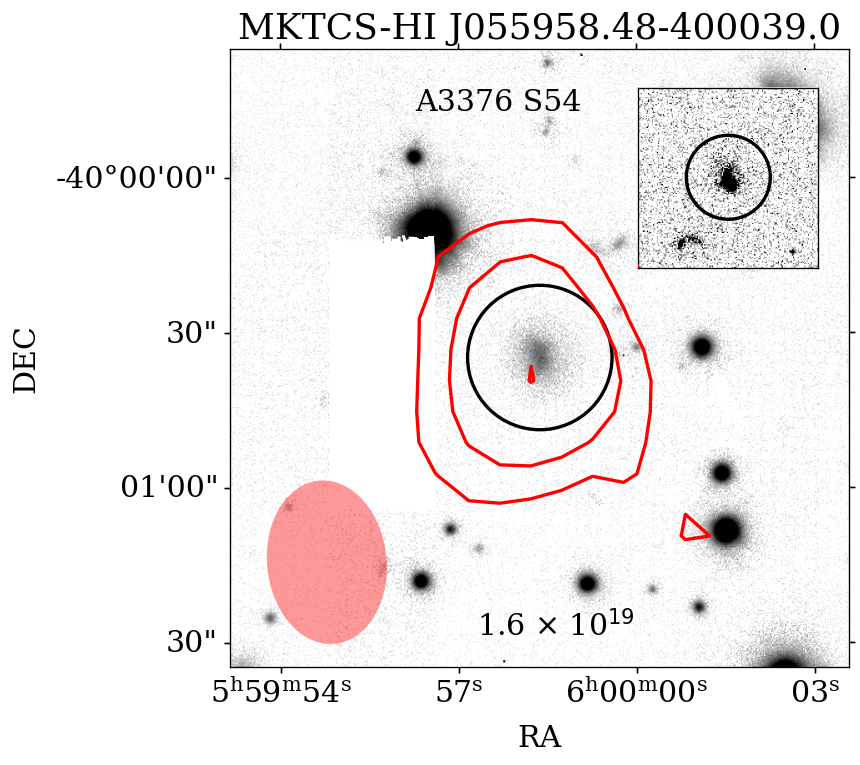
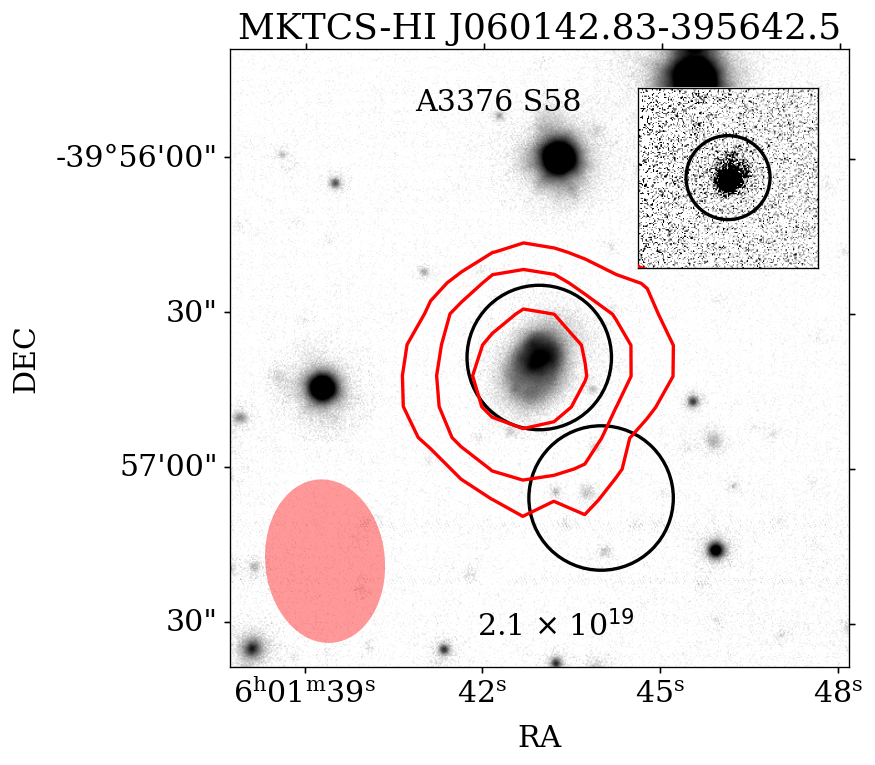
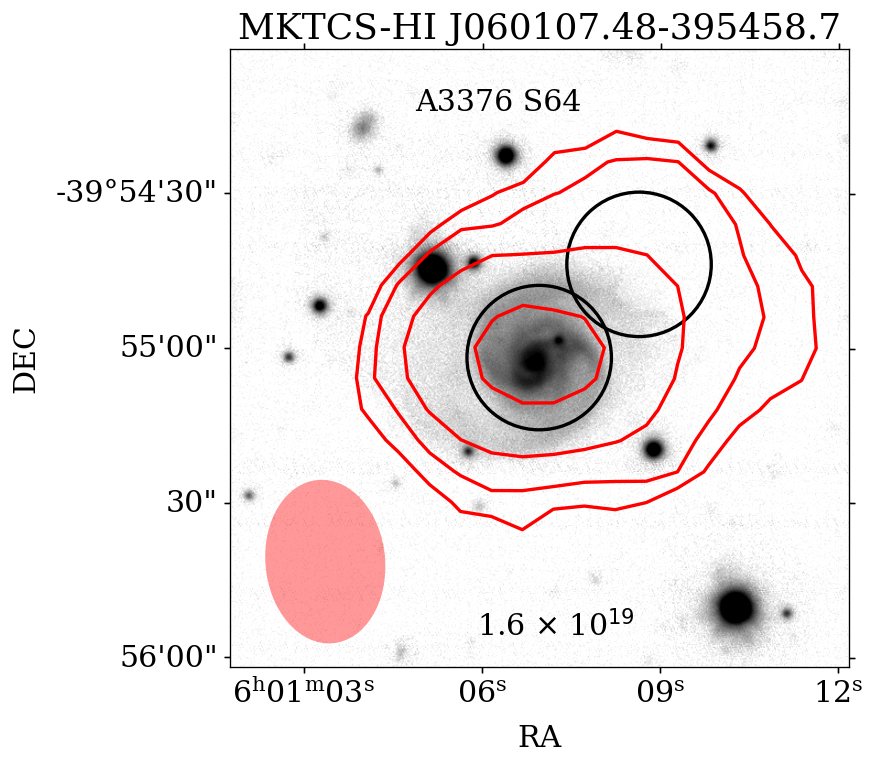
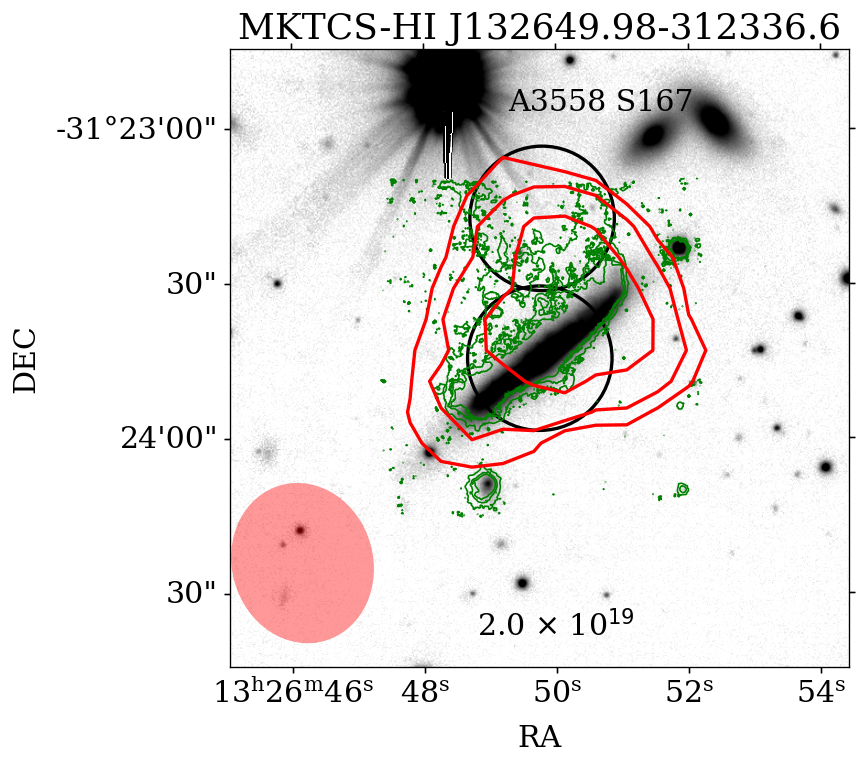
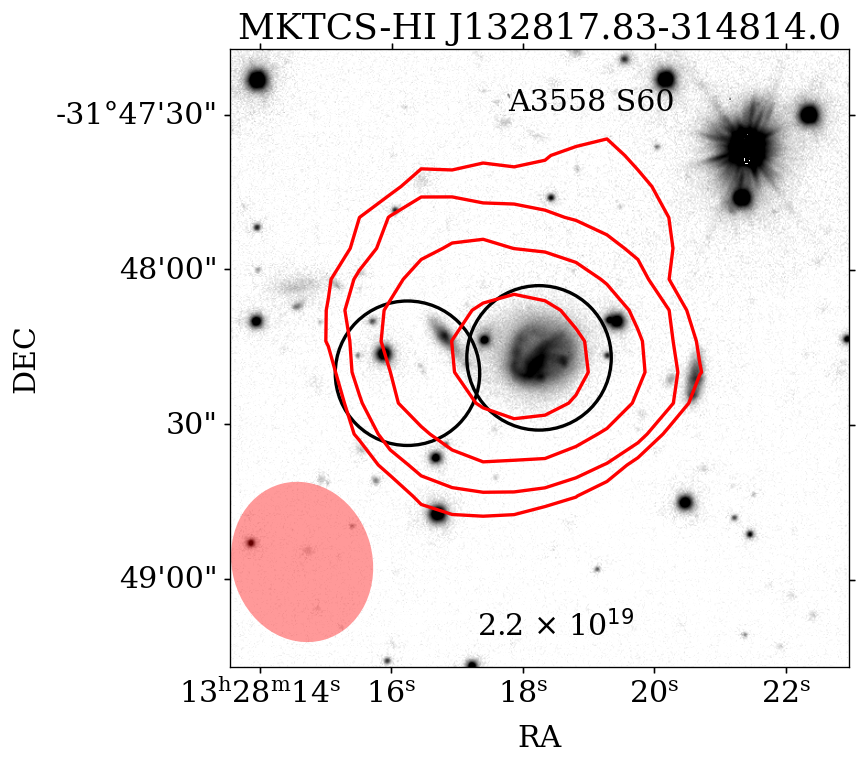
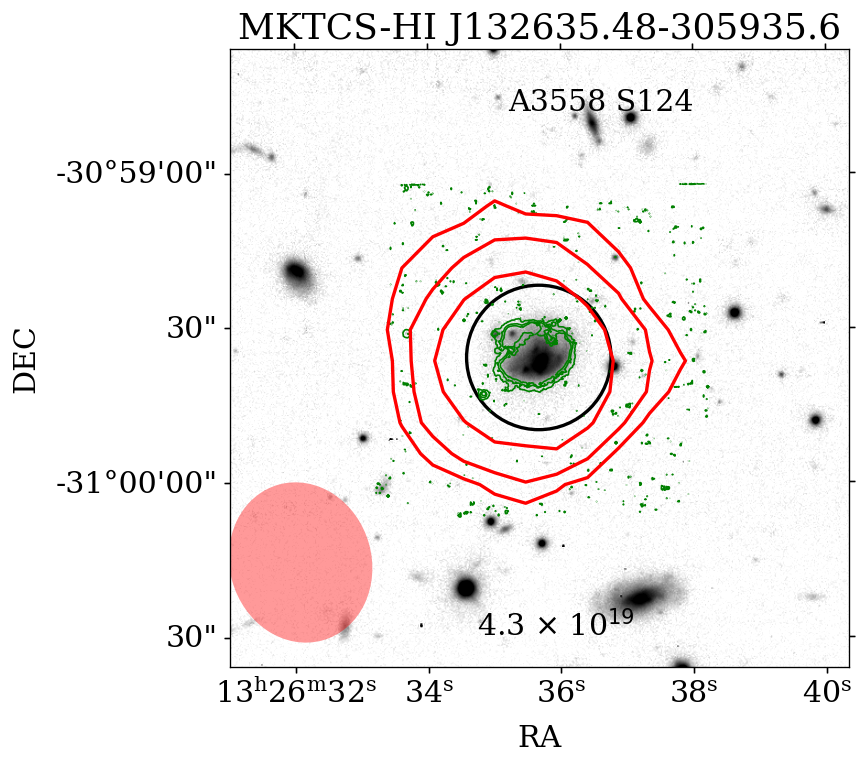
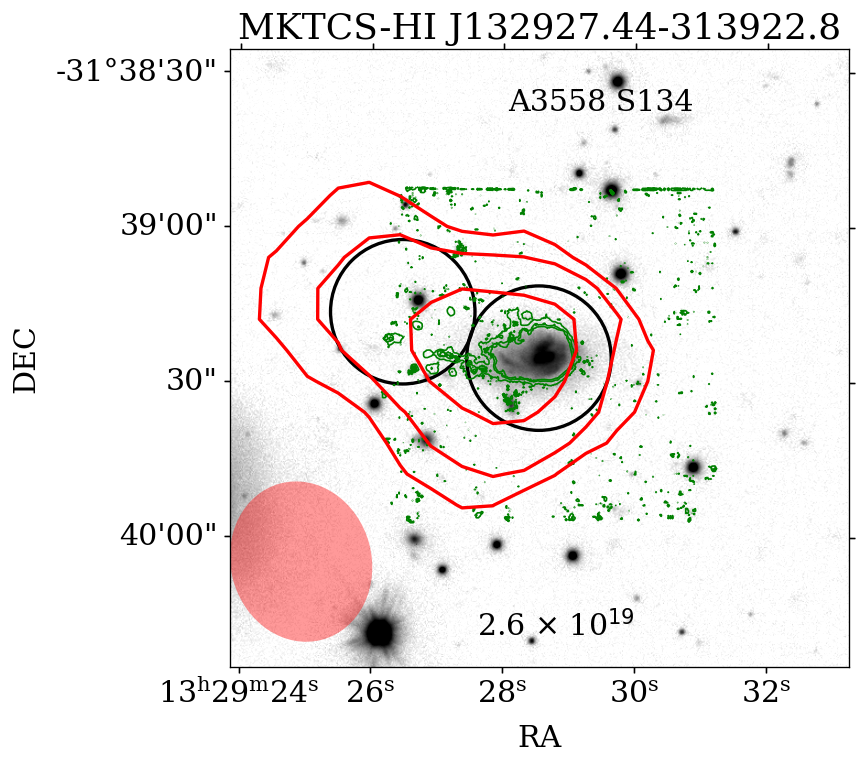
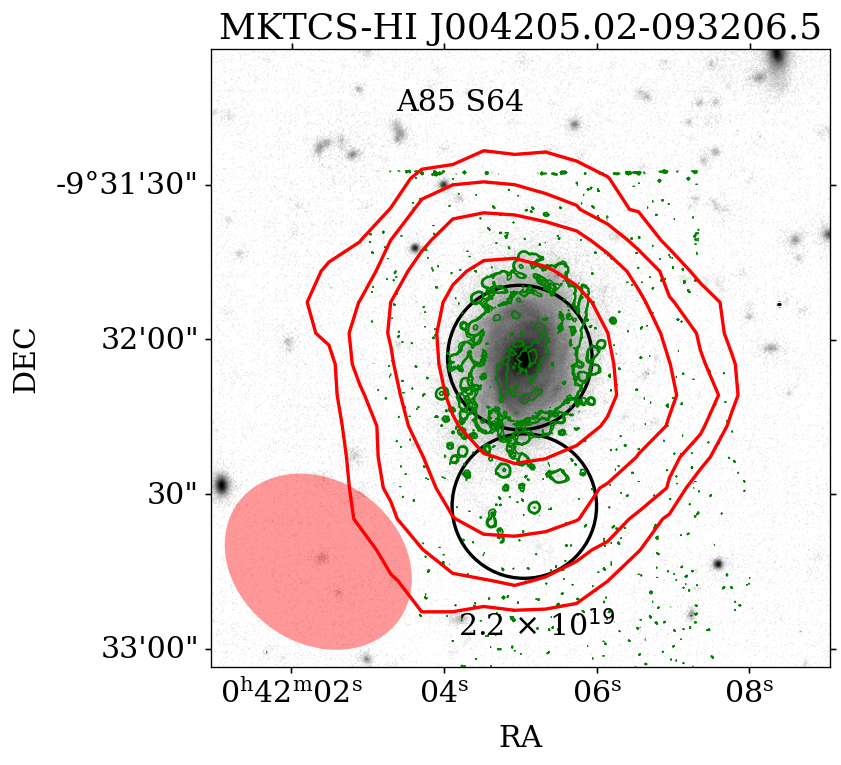
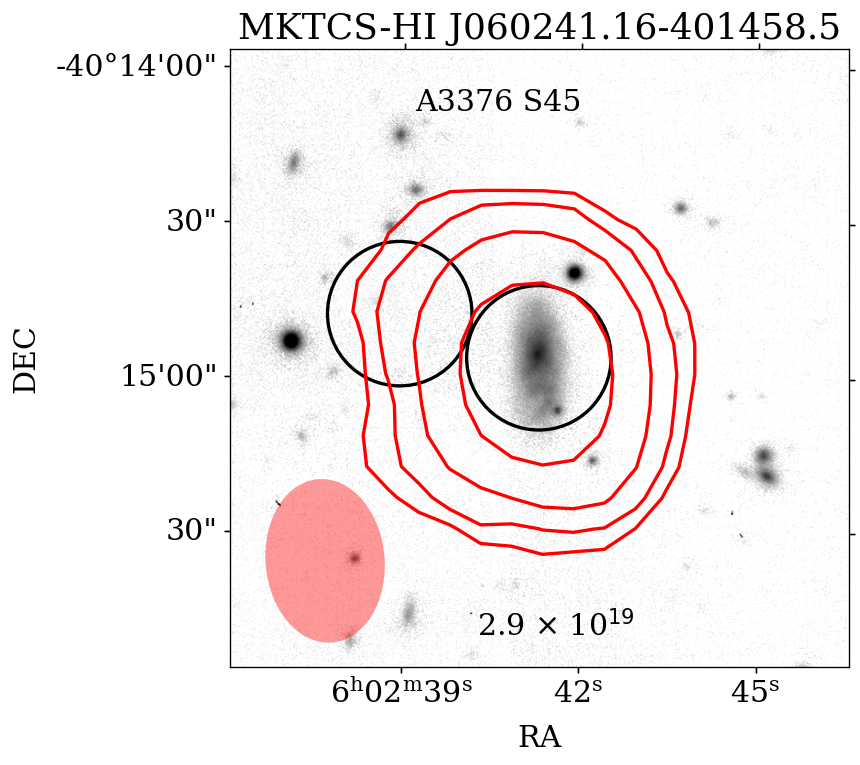
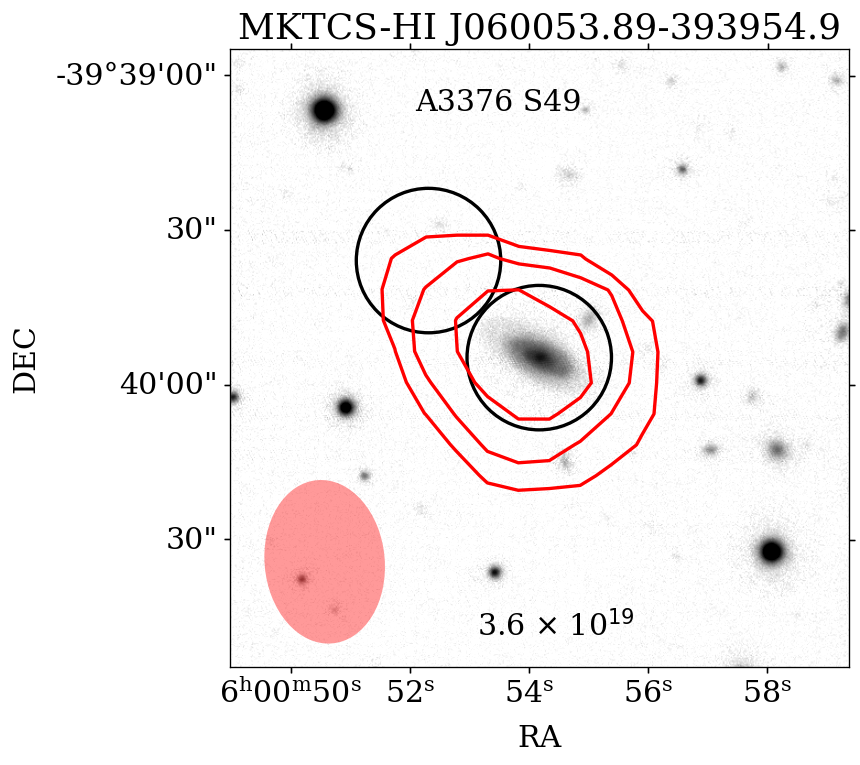
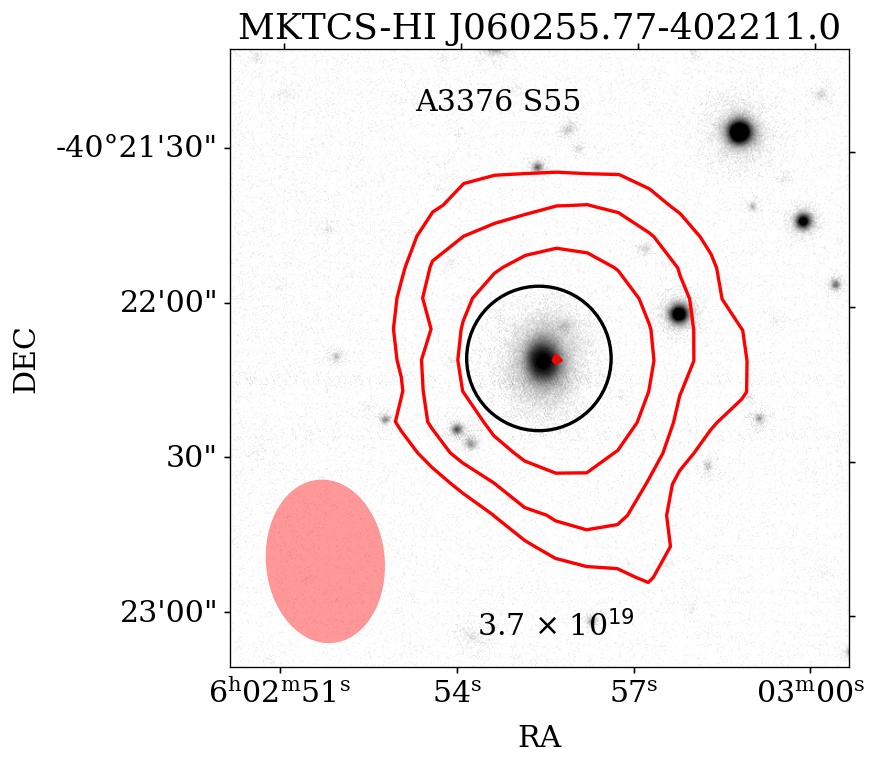
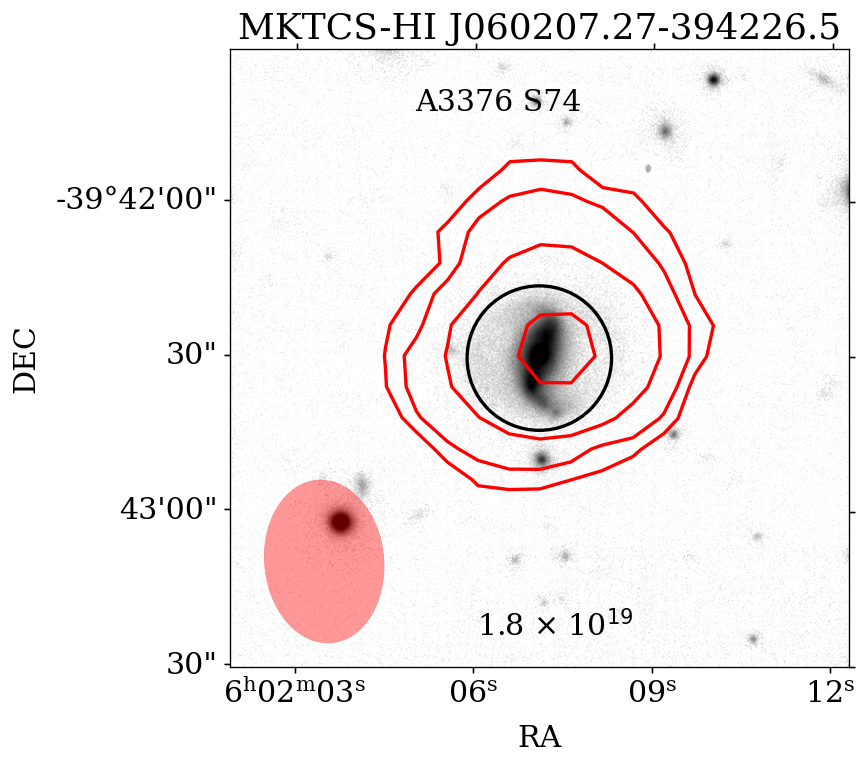
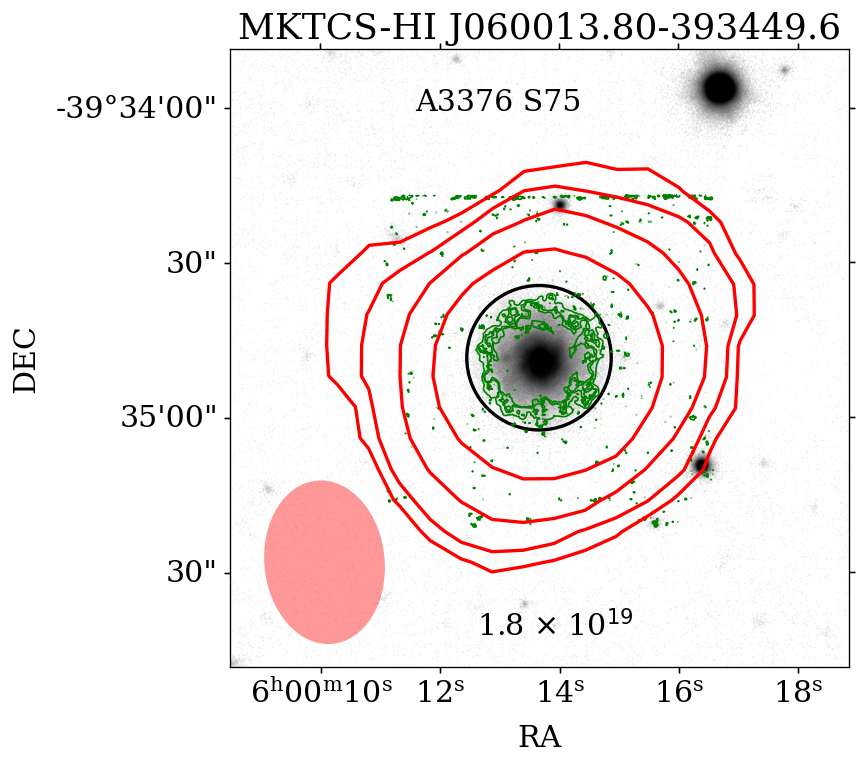
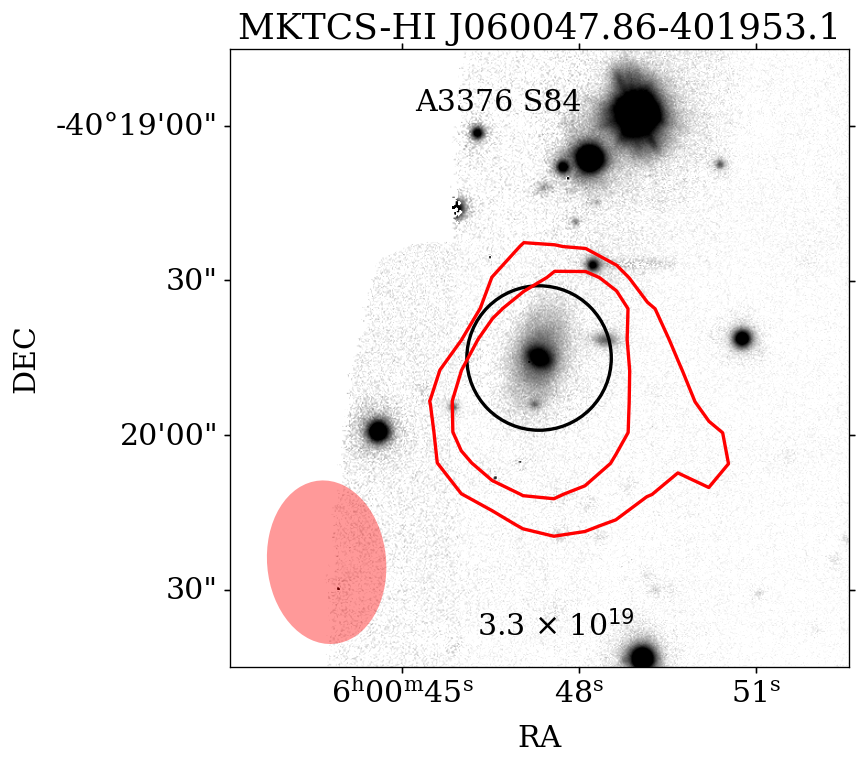
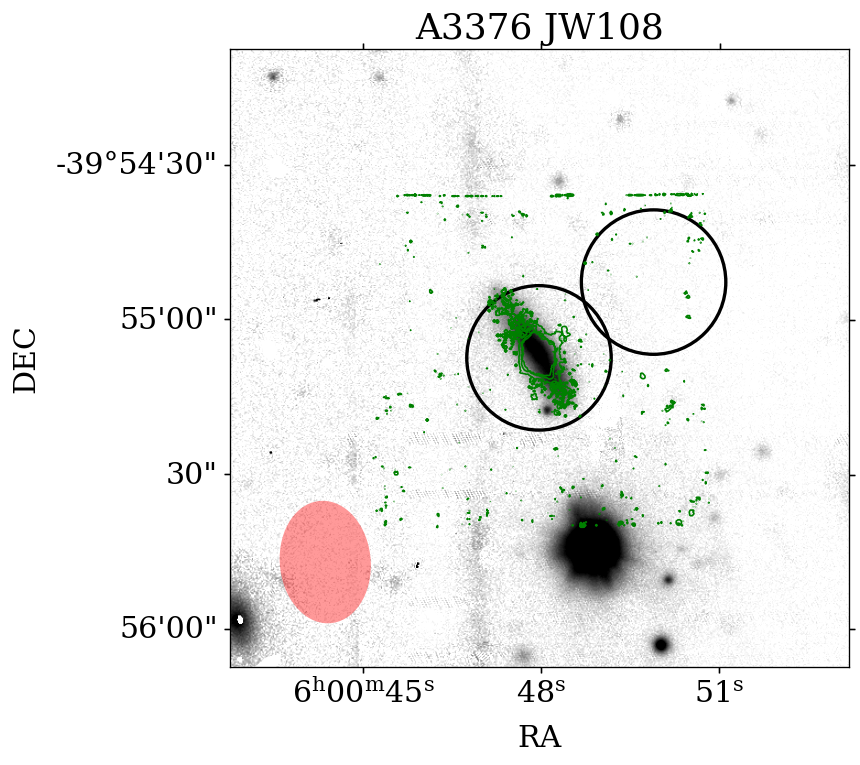
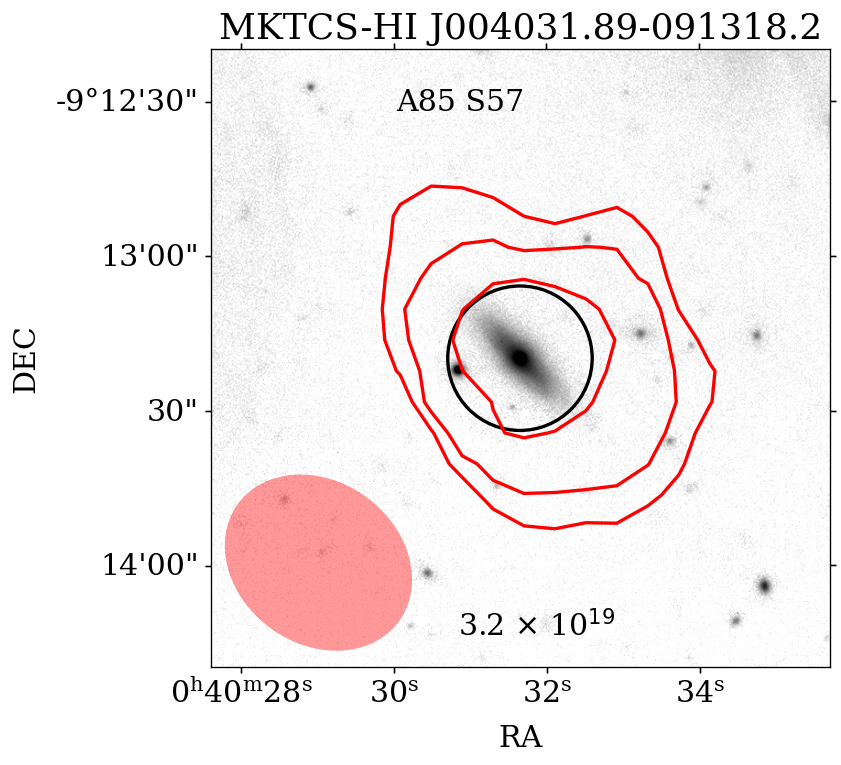
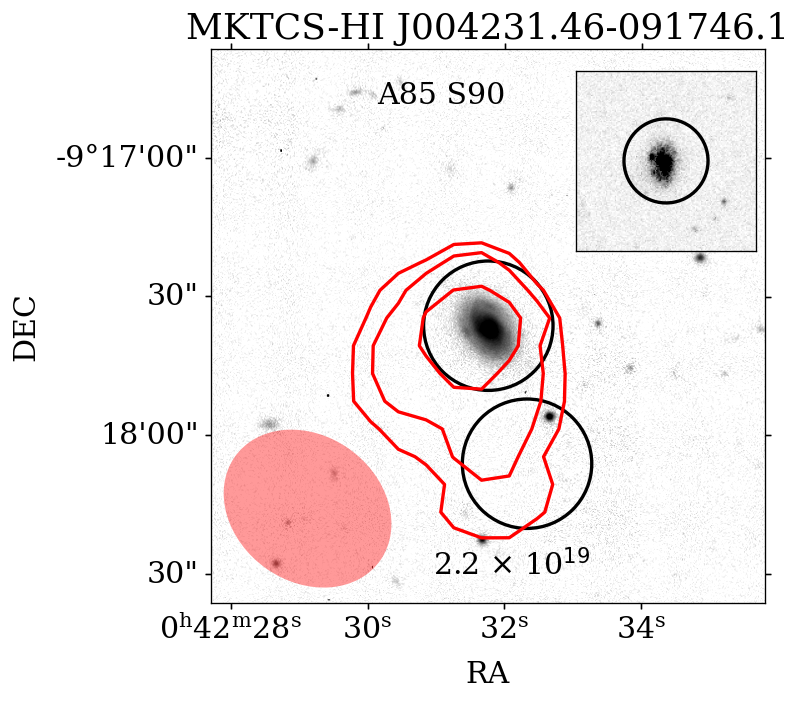
The optical maps (2′x 2′) of all our targets are shown in Fig. 1 and Fig. 2, representing galaxies with and without a star forming tail, respectively. Black circles in Fig. 1 and Fig. 2 show the APEX pointings. At the observed frequencies (220 GHz) the FWHM of the APEX primary beam is 28 ″, which corresponds to scales from 25 to 30 kpc for the different targets. For 8 targets out of the 19 observed we also have a dedicated APEX pointing centred on the supposed emitting gas tail, which is also shown in Fig. 1 and Fig. 2.
3 Data
3.1 HI data
We used the MeerKAT observations from the MeerKAT Galaxy Cluster Legacy Survey (MGCLS; Knowles et al., 2022). The MGCLS consists of long-track (6–10 hour) observations of 115 galaxy clusters in the Southern Sky using the L-band receiver (900 – 1670 MHz). The observed band was sampled with the 4k mode of the SKARAB correlator with 4096 channels that are 209 kHz (44 ) wide in total polarisation.
We processed the data over the frequency range, covering clusters A85, A3376 and A3558, and their background, 1300 MHz - 1410 MHz, centred at 1356 MHz. The uv-data were reduced using the standard procedure with the Containerised Automated Radio Astronomical Calibration (CARAcal; Jozsa et al., 2020) pipeline222https://caracal.readthedocs.io. It is built using a radio interferometry framework, stimela333https://github.com/SpheMakh/Stimela (Makhathini, 2018), which is based on container technologies and Python. Various open-source radio interferometry software packages within this framework are available in the same script, such as CASA (McMullin, 2007), WSclean (Offringa et al., 2014; Offringa & Smirnov, 2017), AOFlagger (Offringa et al., 2012), Cubical (Kenyon et al., 2018), SoFiA (Serra et al., 2015; Westmeier et al., 2021), PyBDSF (Mohan & Rafferty, 2015), MeqTrees (Noordam & Smirnov, 2010) and Crystalball444https://github.com/caracal-pipeline/crystalball.
The uv-data were Fourier transformed into a final H\scaleto1.2ex cube with a pixel size of 6″ and a field of view (FOV) of 2 deg2. We used natural weighting with Briggs robust parameter, r = 0.5 and a uv-tapering of 20″ to optimise the surface brightness sensitivity. The resulting cubes have a rms of 0.2 mJy/beam. The sidelobes of the synthesised beam were removed by iteratively using SoFiA to produce 3D clean masks and imaging with WSclean while cleaning within the masks down to 0.5. The restoring Gaussian PSF of each cube has an average FWHM of () 30″ 33″ with a position angle, PA 150 deg. With these data we reach a column density sensitivity of n atoms cm-2 at 3 assuming a linewidth of 44 .
We then explored the final H\scaleto1.2ex cube using the SoFiA source finder (Serra et al., 2015) with the smooth and clip (S+C) SoFiA method, searching for H\scaleto1.2ex emission brighter than 3.
The H\scaleto1.2ex masses of detected galaxies were calculated using the following:
| (1) |
where the total integrated flux, Svdv is expressed in Jy , and D is the distance to the galaxy in Mpc. We adopt the luminosity distance using the optical velocities of the clusters, i.e. Mpc for A85, A3558 and A3376, respectively. The derived H\scaleto1.2ex masses are shown in the 8th column of Tab.1.
3.2 APEX data
The APEX data have been collected during ESO P108 under the program 0108.A-0511A (P. I. Moretti), that was awarded 184 hours of observational time in priority B. Observations have been carried out during the period from August 2021 to December 2021, and the total observational time spent on the requested targets was 88.7 hours. Each source has been observed to the requested noise level limit which is dependent on the galaxy stellar mass, and goes from 0.14 mK for the low mass galaxies to 0.25 mK for the high mass ones. These limits correspond to molecular gas fractions 0.5 dex lower than typical field galaxies (Saintonge et al., 2017). We observed the transition ( GHz), using the nFLASH230 Instrument tuned to the CO line redshifted frequencies for each target. The observations have been performed in a symmetric Wobbler switching mode, with maximum separation between the ON and OFF-beam of 100 arcsec.
The spectra calibrated by the APEX on-line calibration pipeline (in antenna temperature scale; T), have been checked and analysed using different spectral resolutions, going from 10 to 150 km/s. First-order baselines, defined in a line-free band about 2000 km/s wide, have been subtracted from the spectra. The antenna temperatures have been converted to main-beam brightness temperatures (Tmb=T/), using =0.75.
As shown in Fig. 1 and Fig. 2, the APEX pointing is encompassing the entire galaxy stellar extent in most cases, and we therefore are confident that with our measurements we are not missing any significant cold gas detection within the stellar disk.
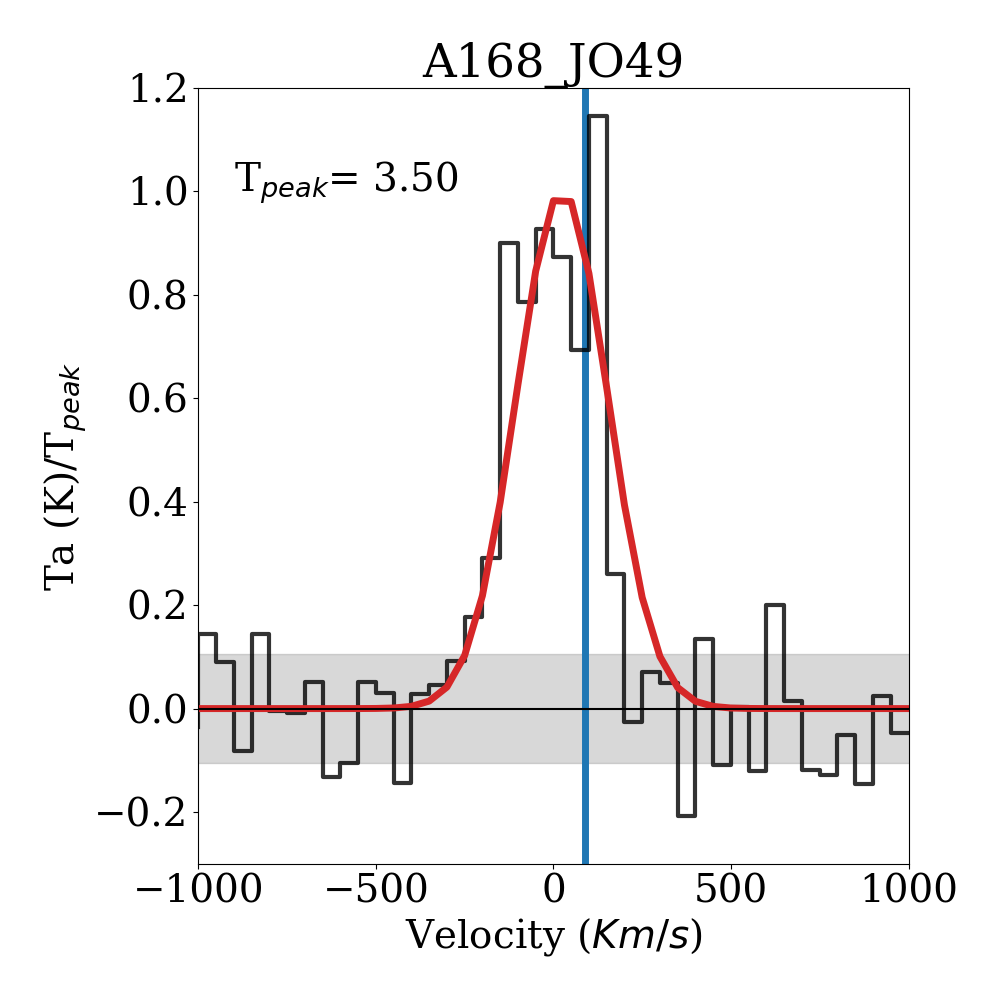
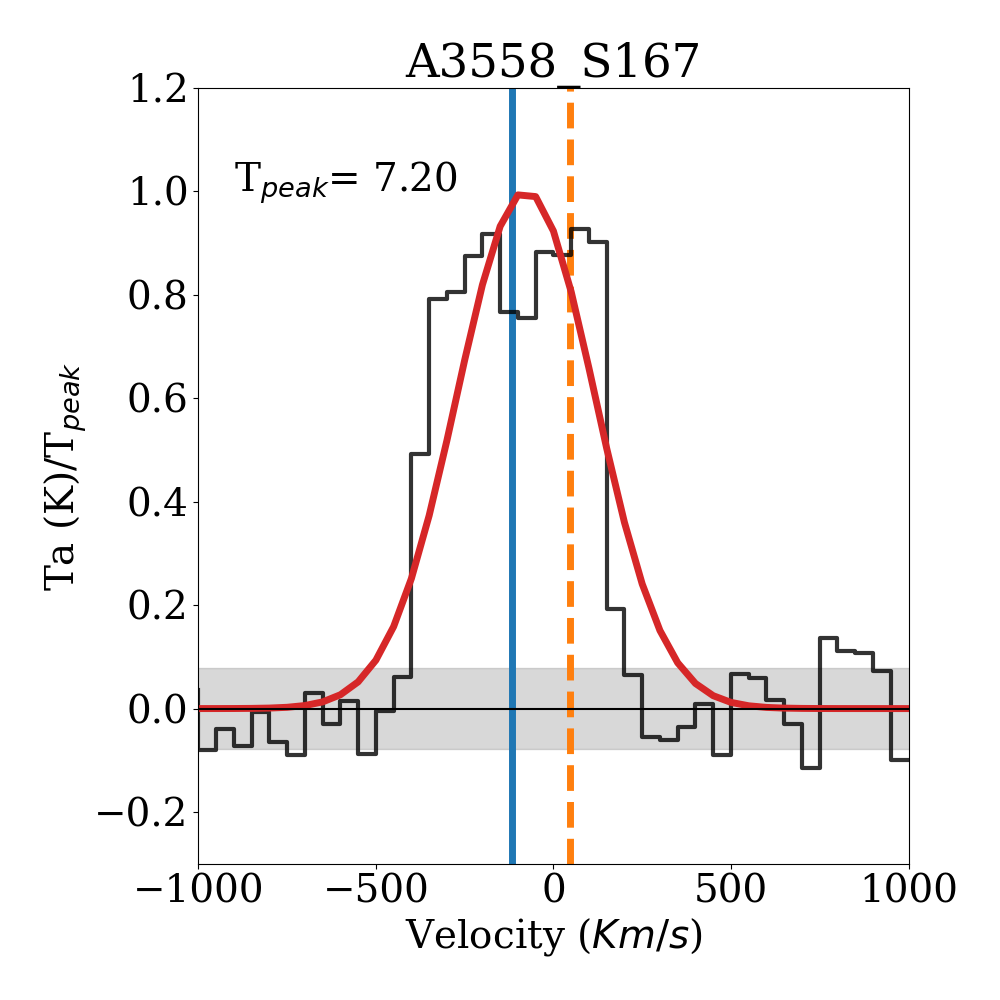
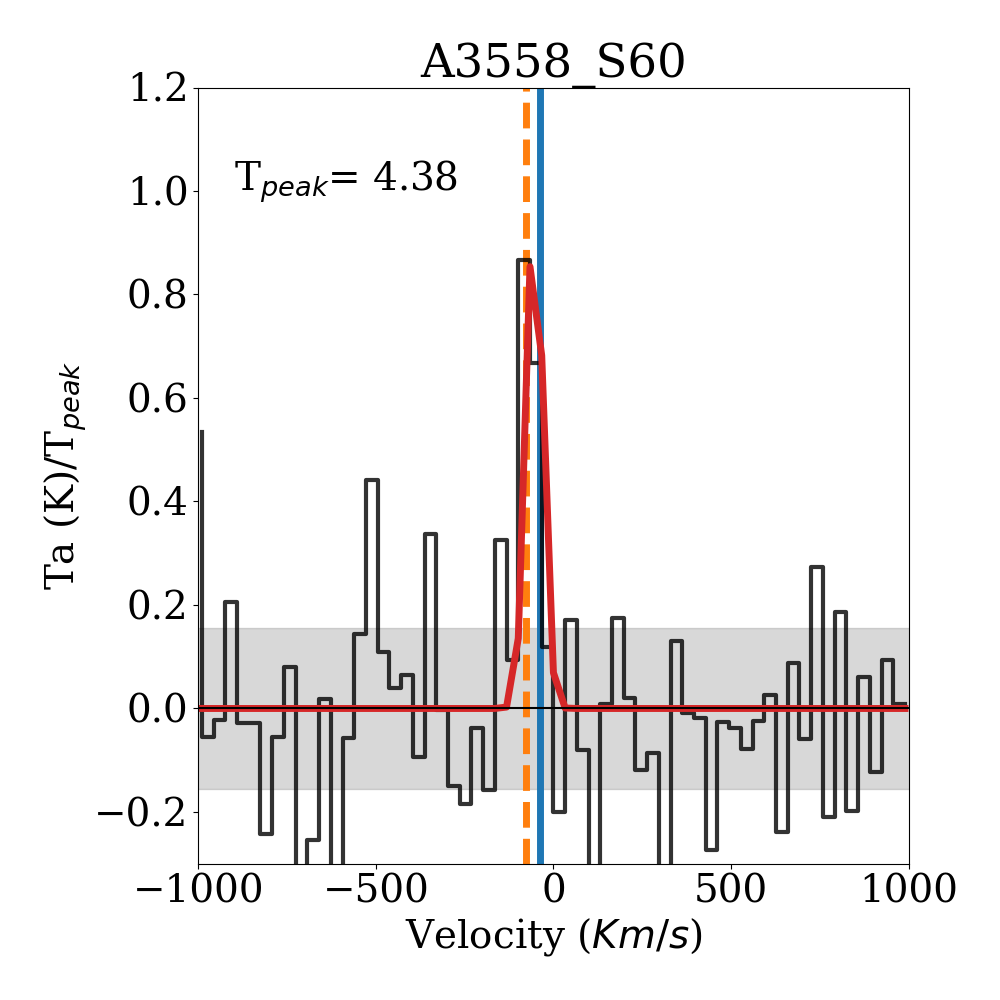
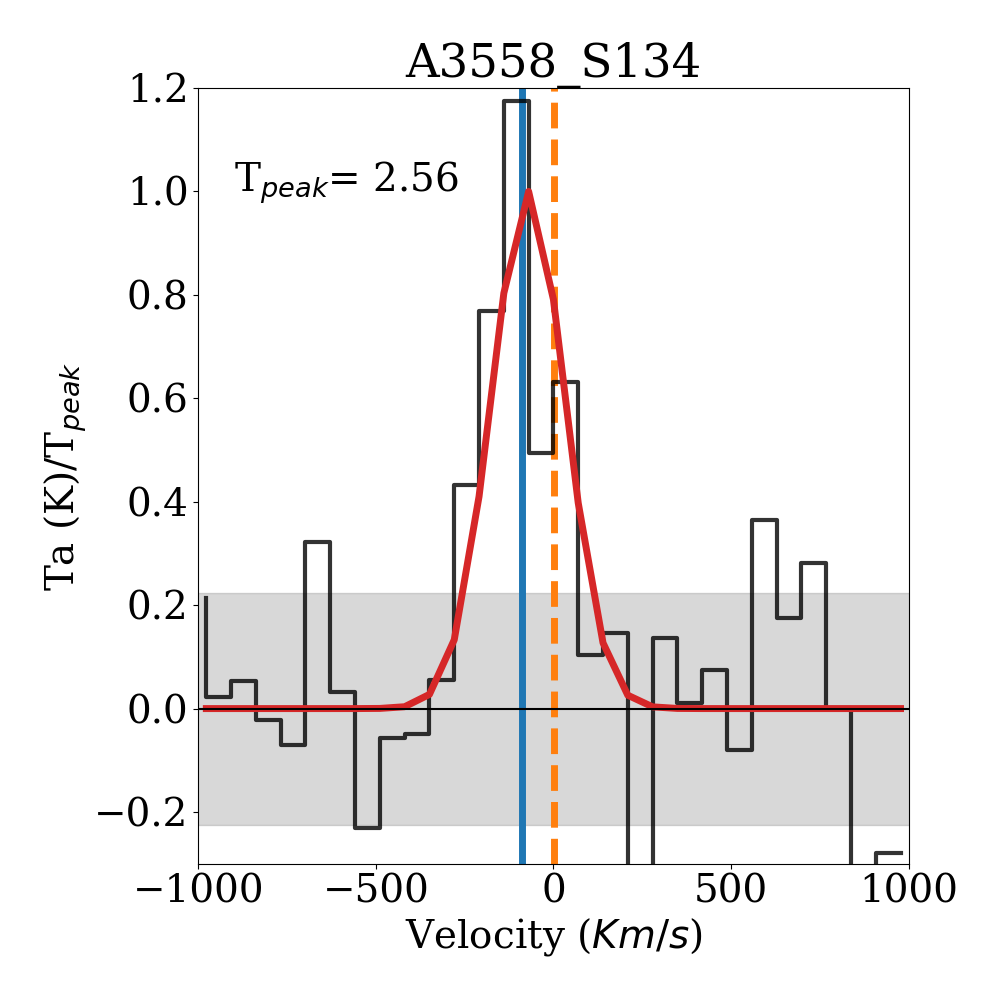
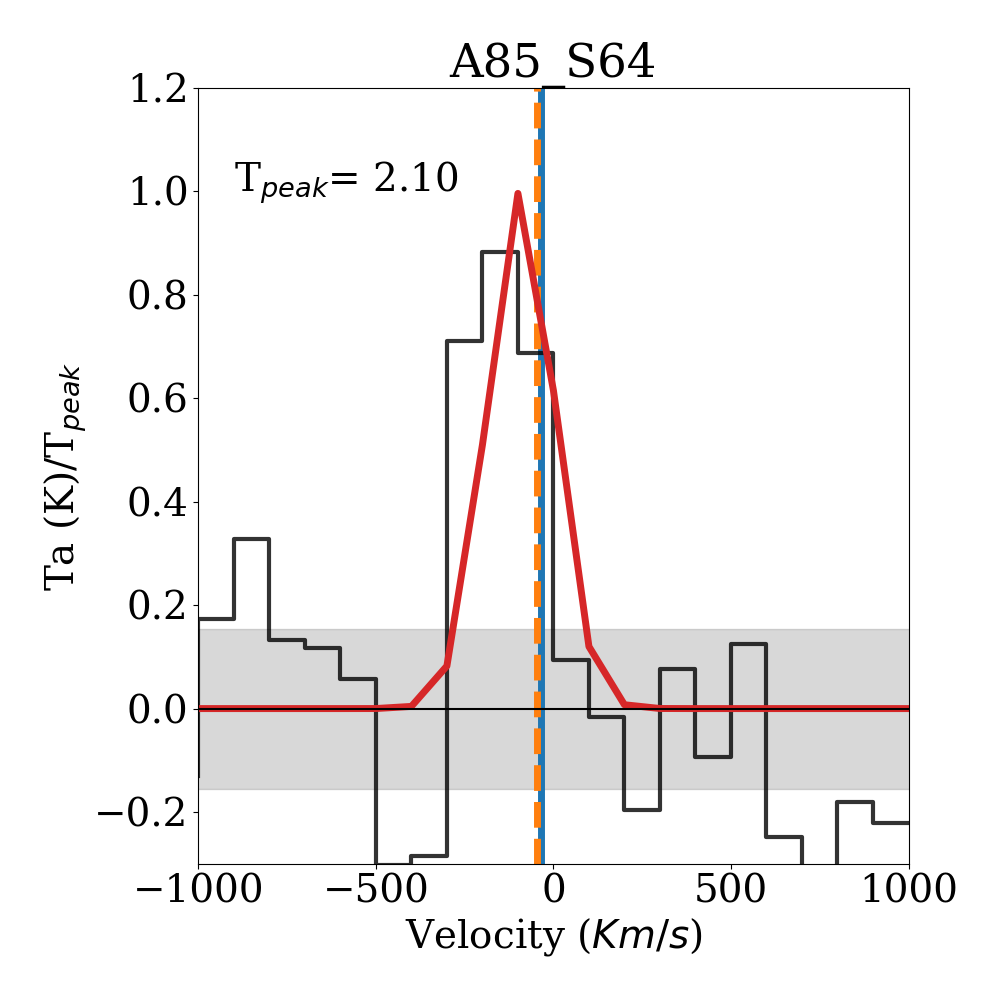
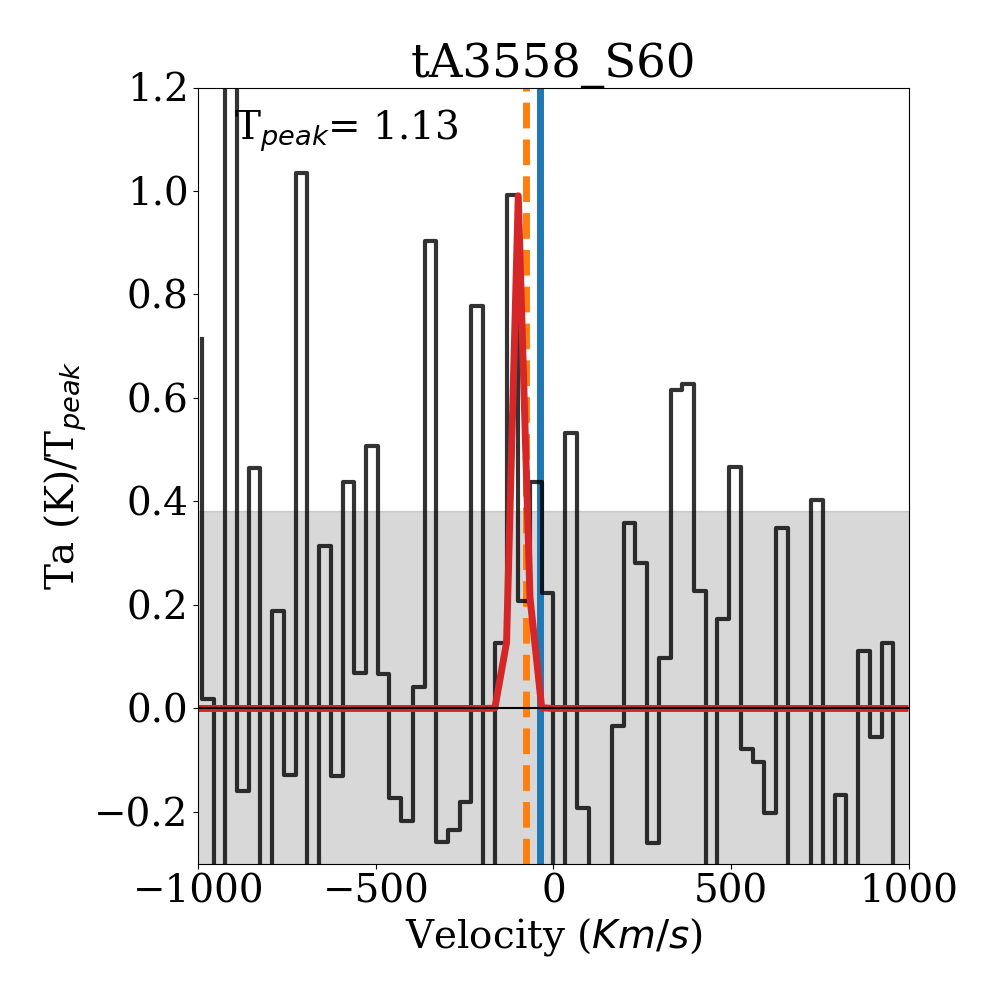
For each source and each spectral resolution we derived the peak temperature (main-beam brightness temperature, ), the linewidth and the position of the CO line relative to the velocity derived from the optical redshift with a single Gaussian fit, as we are here mostly interested in the integrated line flux. Some of our spectra show, though, hints for a double-horn profile, typical of rotating discs. The extracted CO(2-1) spectra for the central pointing of 14/19 targets with S/N3 are shown in Fig. 3, black lines, with the gaussian fit superimposed in red. The grey shaded region indicates the rms of the measurement, and has been derived from a 2000 km/s wide spectral range, after excluding the 1.5 region centered on the gaussian.
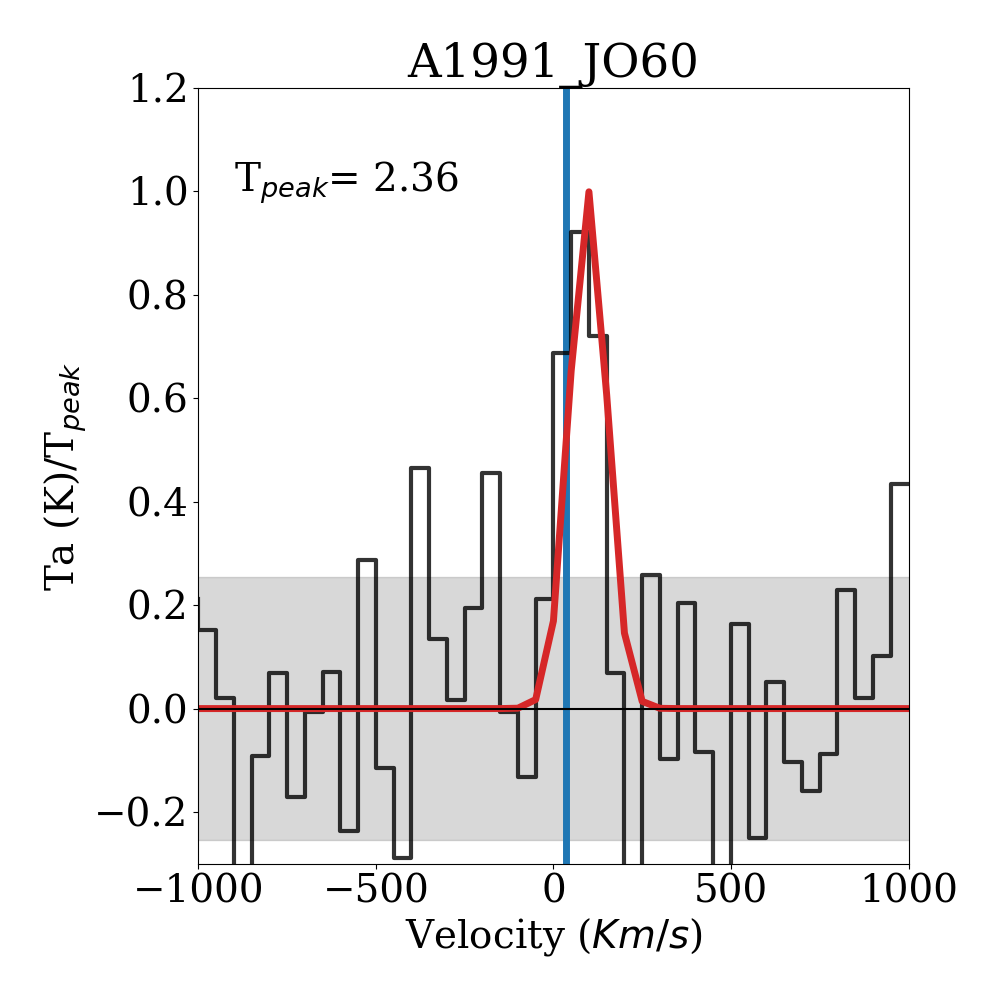
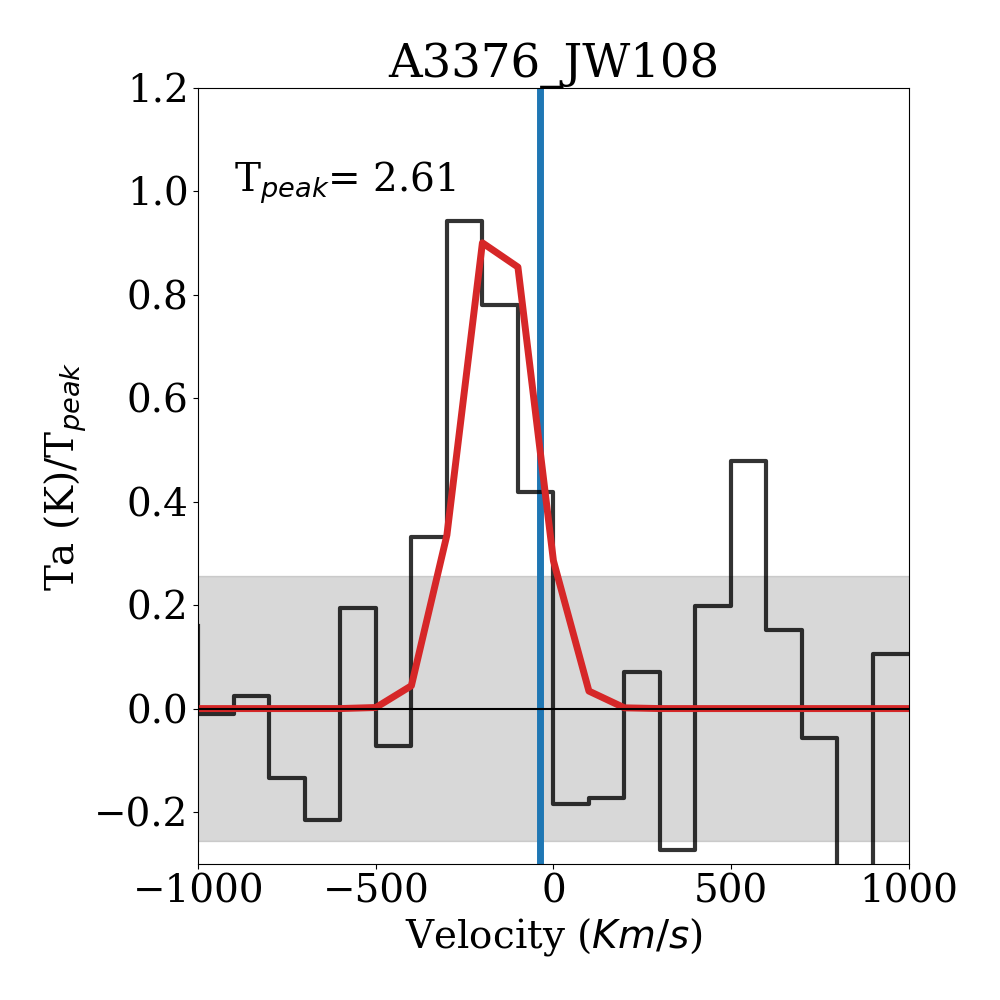
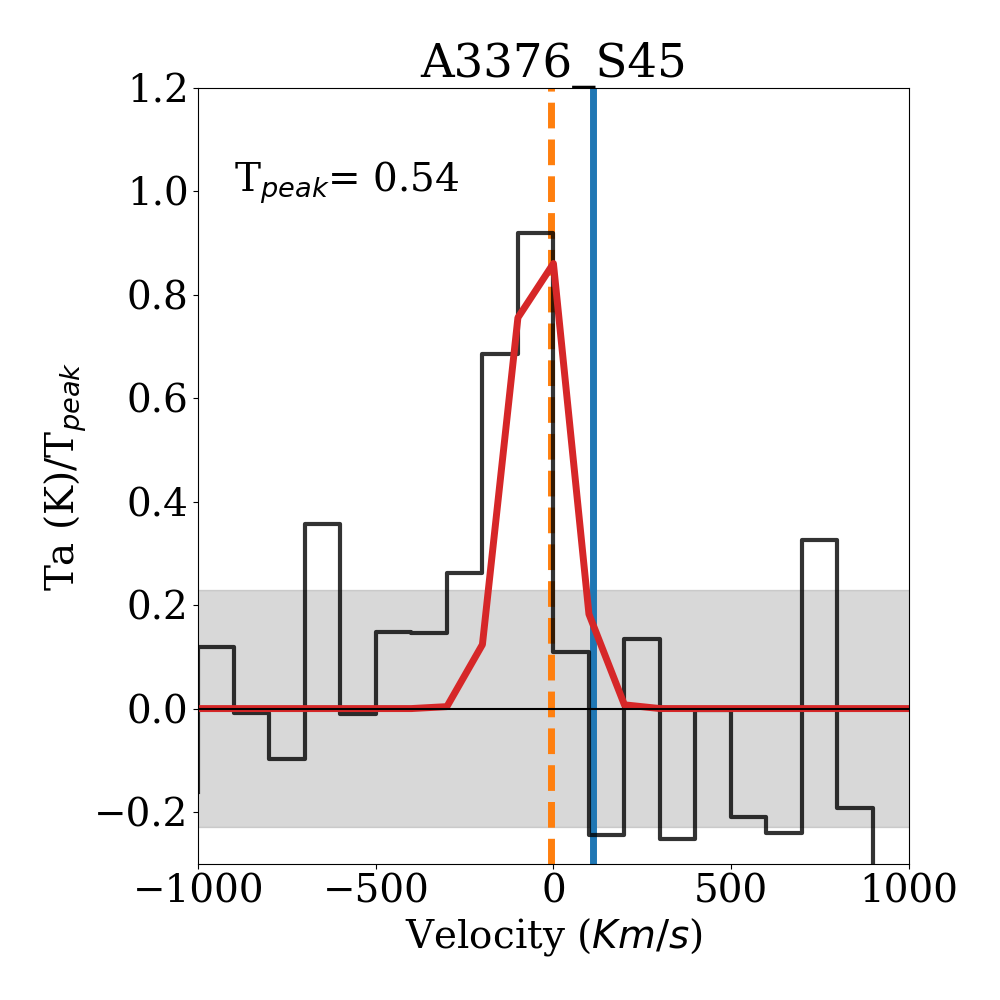
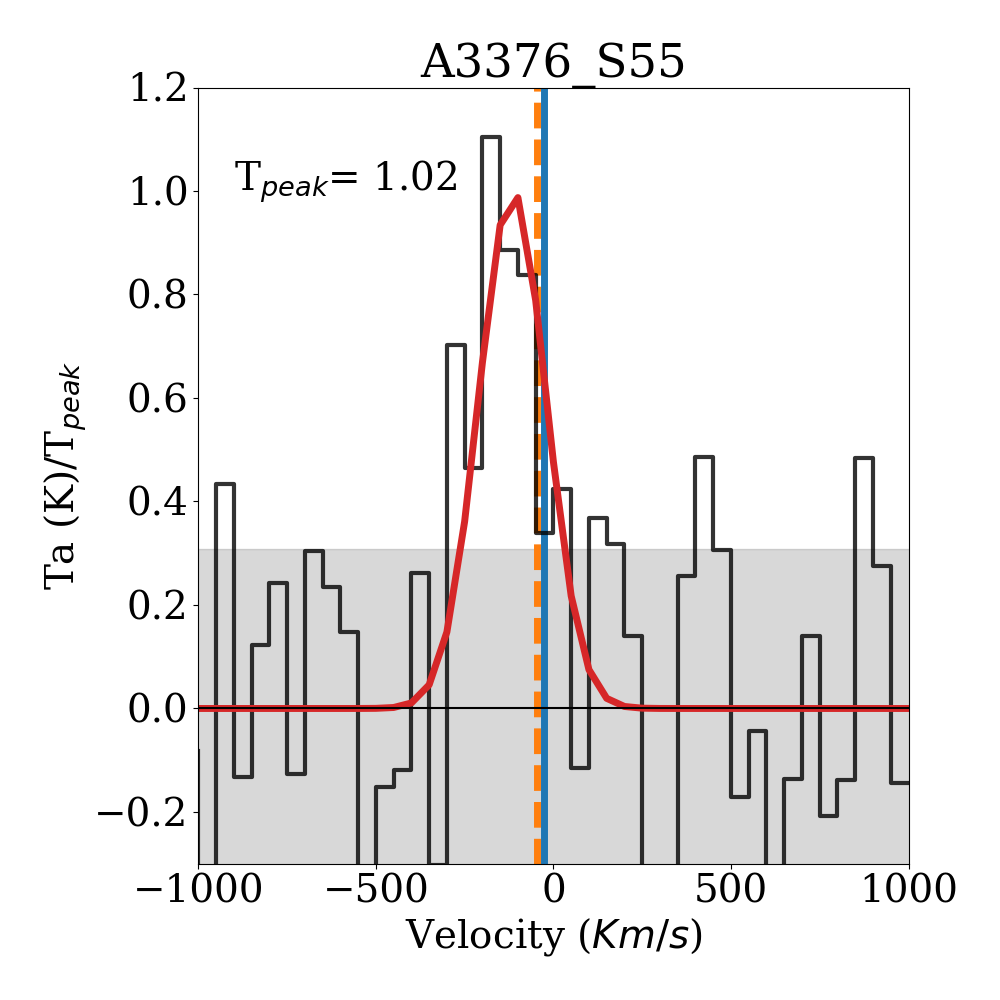
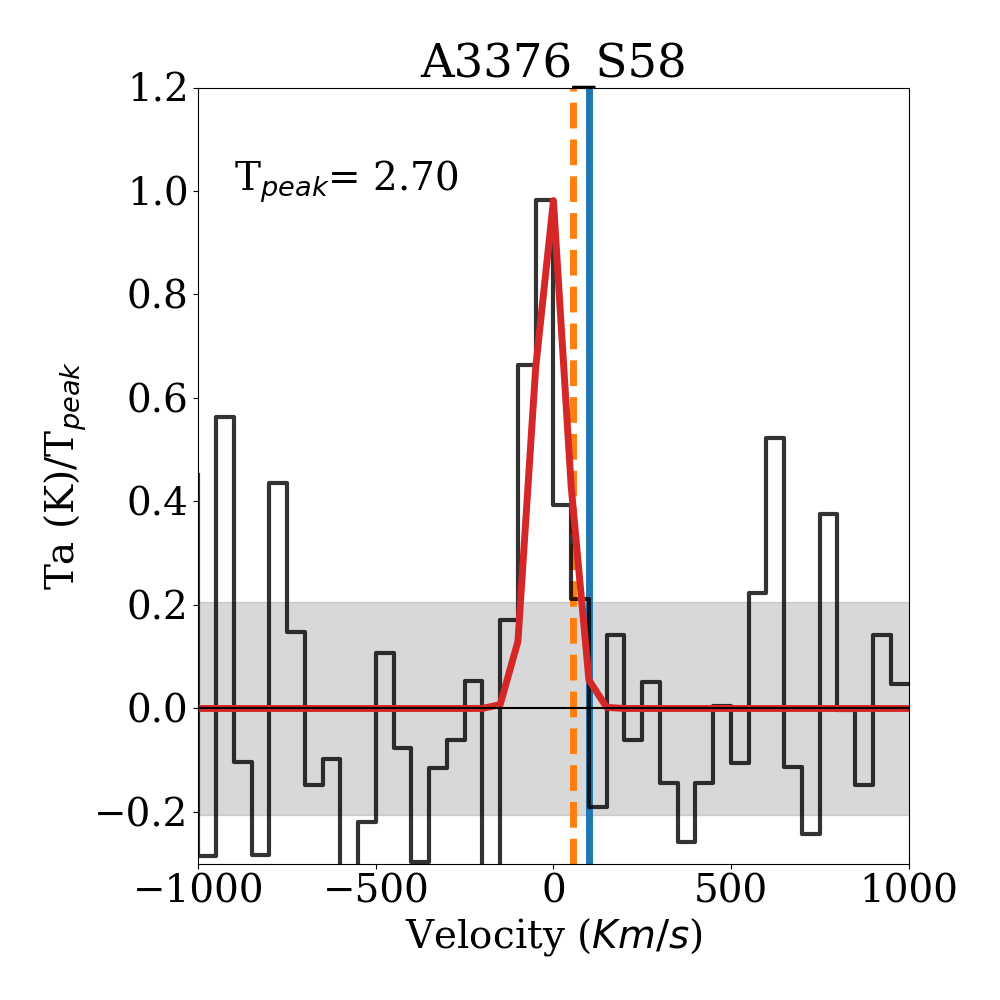
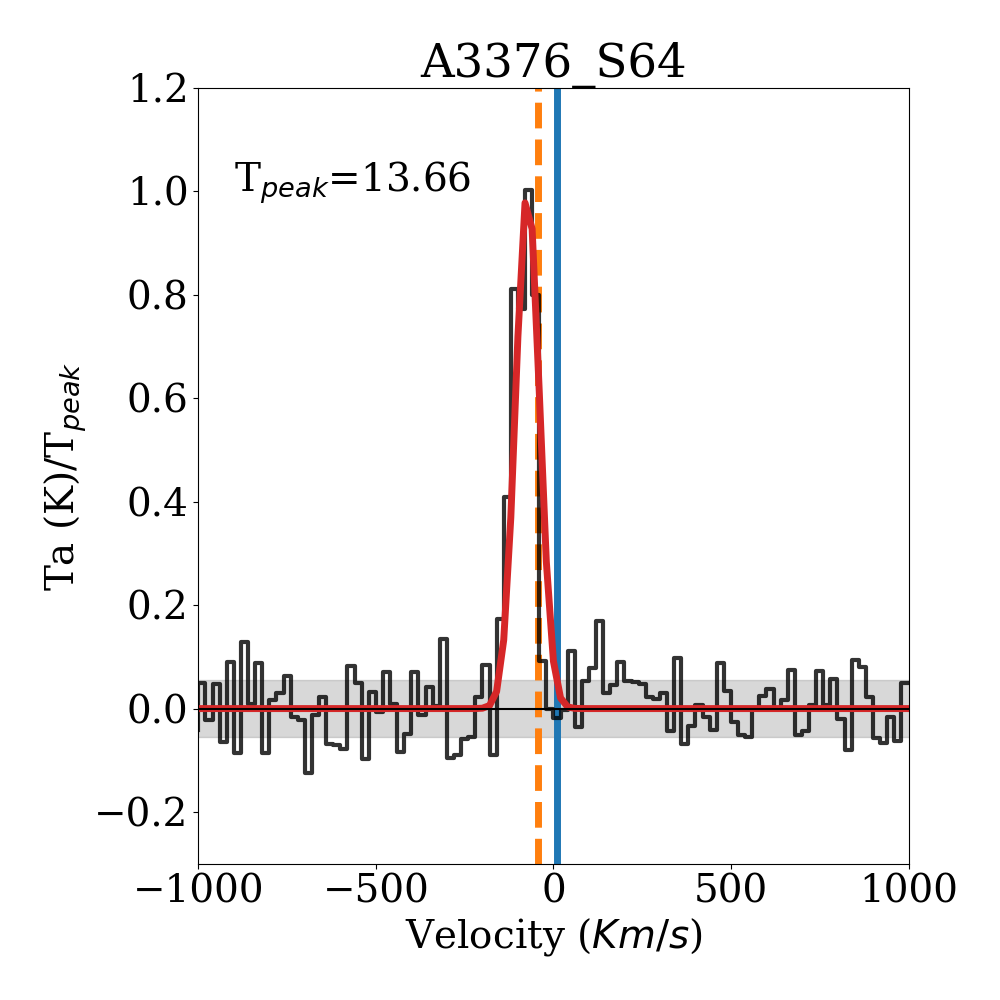
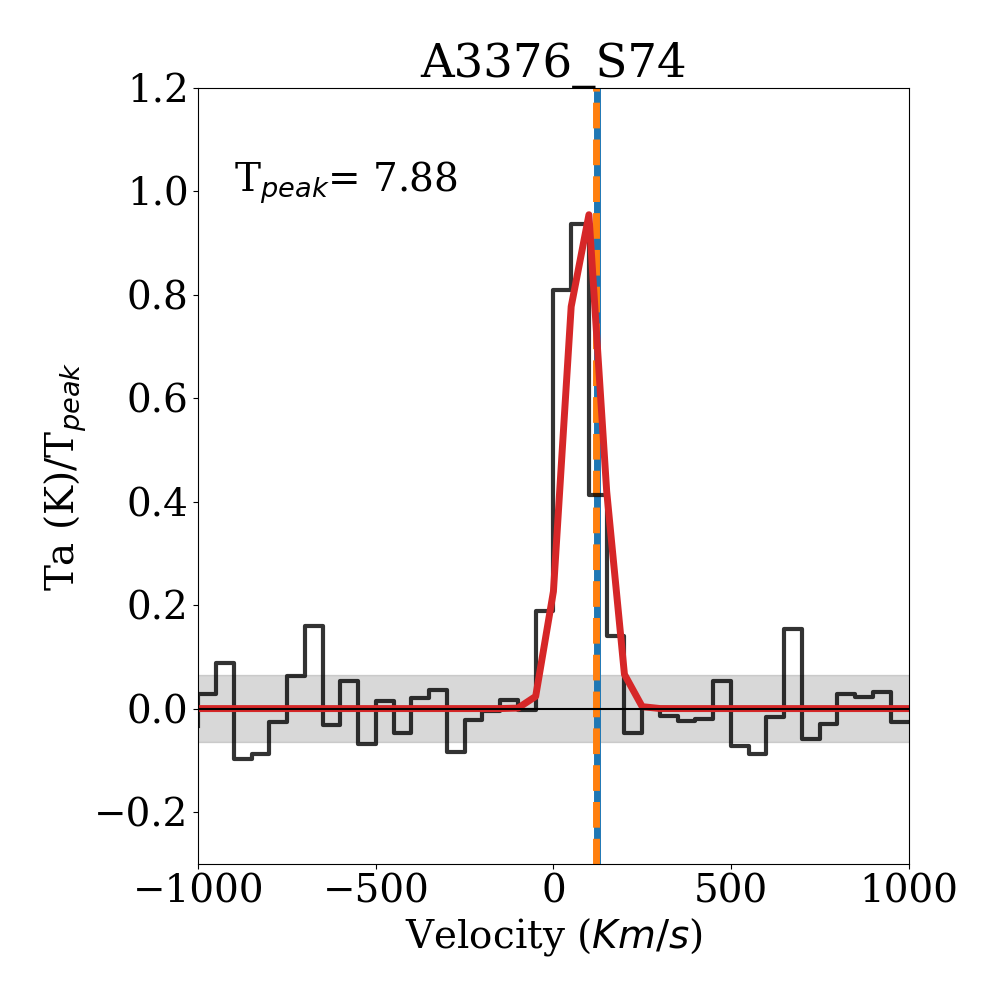
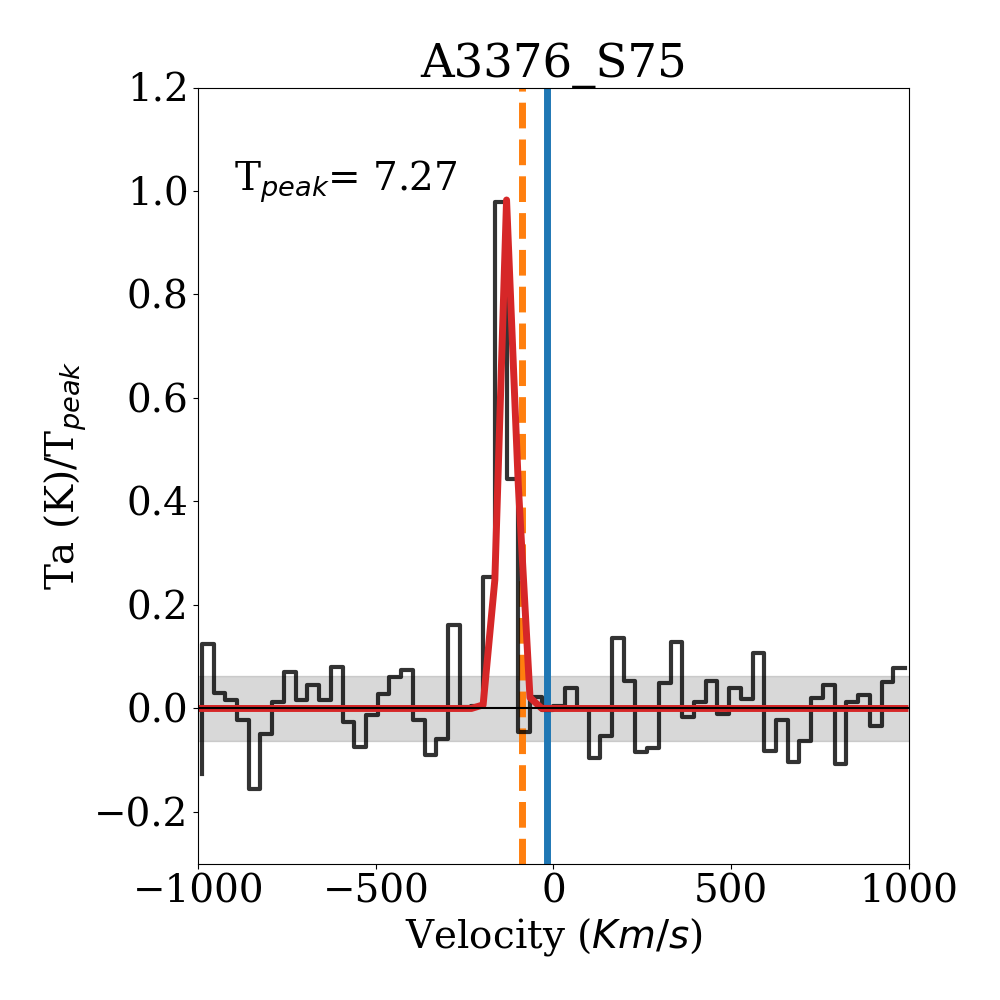
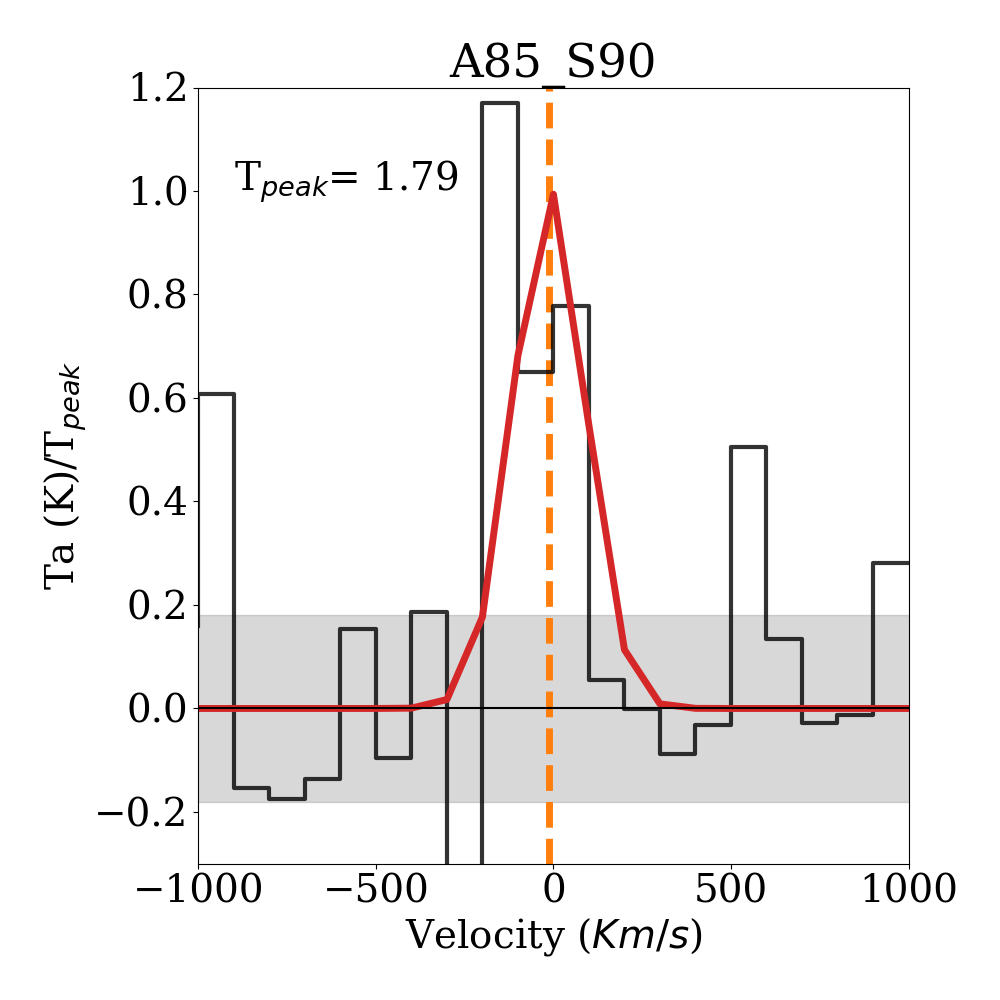
. The grey shaded region is the rms of the observations in the plot range, after excluding the line emission.
The CO fluxes have been calculated assuming a conversion factor of Sν/Tmb = 39 Jy beam-1 K-1 for the APEX telescope. The Precipitable Water Vapour (PWV), the on–source time, and the results of the fitting procedure of the observations are given in Tab. 2. When multiple observations were present with significantly different conditions we included in the final dataset the ones that, combined, were giving the highest signal-to-noise and we list in this case the median PWV. The fourth column of the table indicates the velocity resolution (channel width) of the fitted spectrum. The errors on the fluxes have been calculated taking into account both the rms of the spectrum and the linewidth (FWHM) determined with the given velocity resolution , as
| (2) |
To this term we added a % error due to the spectral calibration.
One of the nineteen target galaxies (A3376_S84) did not show any significant detection at the expected frequency, and we therefore estimated only an upper limit to its CO flux, and to the corresponding molecular gas mass. We calculated these quantities by using the rms of the observation and a linewidth of 300 km/s, which is the value predicted by the Tully-Fisher relation (Gnedin et al., 2007) for a galaxy with stellar mass of 1011 and seen at 60 deg in the sky-plane.
| Galaxy | PWV | TON | RMS | Tpeak | S/N | Res. | Vopt-VCO | LW | Flux | M |
| mm | min | mK | mK | Jy | 1e9 | |||||
| A168_JO49 | 0.6 | 30.7 | 0.43 | 3.52 | 8.1 | 33 | 46 | 301 | 44.0 | 5.8 |
| A1991_JO60 | 2.1 | 30.7 | 0.60 | 2.36 | 3.9 | 50 | 98 | 122 | 12.0 | 2.7 |
| A3376_JW108 | 3.3 | 17.5 | 0.67 | 2.61 | 3.9 | 100 | -155 | 231 | 25.0 | 3.4 |
| tA3376_JW108 | 0.9 | 53.7 | 0.18 | 0.33 | 1.8 | 100 | -104 | 195 | 2.7 | 0.4 |
| A3376_S45 | 1.9 | 145.9 | 0.12 | 0.54 | 4.4 | 100 | -42 | 182 | 4.1 | 0.6 |
| tA3376_S45 | 2.3 | 130.5 | 0.07 | 0.16 | 2.4 | 150 | -38 | 166 | 1.1 | 0.2 |
| A3376_S49 | 2.5 | 80.7 | 0.16 | 0.28 | 1.7 | 100 | -288 | 523 | 6.0 | 0.8 |
| tA3376_S49 | 1.3 | 66.8 | 0.13 | 0.27 | 2.1 | 100 | 3 | 151 | 1.7 | 0.2 |
| A3376_S55 | 3.6 | 69.0 | 0.31 | 1.02 | 3.2 | 50 | -115 | 223 | 9.4 | 1.3 |
| A3376_S54 | 3.6 | 69.0 | 0.24 | 0.35 | 1.4 | 50 | -67 | 481 | 7.0 | 1.0 |
| A3376_S58 | 1.0 | 11.5 | 0.55 | 2.70 | 4.9 | 50 | -9 | 106 | 11.9 | 1.6 |
| A3376_S64 | 1.0 | 11.5 | 0.76 | 13.7 | 18.1 | 20 | -73 | 79 | 44.6 | 6.1 |
| tA3376_S64 | 3.9 | 84 | 0.23 | 0.81 | 3.6 | 100 | -83 | 269 | 9.0 | 1.0 |
| A3376_S74 | 1.0 | 15.3 | 0.51 | 7.89 | 15.6 | 50 | 85 | 116 | 38.0 | 5.2 |
| A3376_S75 | 1.0 | 30.7 | 0.46 | 7.27 | 15.8 | 33 | -128 | 52 | 15.8 | 2.2 |
| A3376_S84 | 1.0 | 65.2 | 0.35 | - | - | 33 | - | - | 4.34 | 0.6 |
| A3558_S167 | 1.0 | 11.5 | 0.63 | 7.20 | 11.5 | 50 | -77 | 457 | 136.6 | 20.7 |
| tA3558_S167 | 1.0 | 38.4 | 0.29 | 1.03 | 3.6 | 50 | 75 | 134 | 5.7 | 0.9 |
| A3558_S60 | 1.0 | 11.5 | 0.66 | 4.38 | 6.6 | 33 | -53 | 54 | 9.8 | 1.5 |
| tA3558_S60 | 1.0 | 25.5 | 0.42 | 1.13 | 2.7 | 33 | -97 | 41 | 1.9 | 0.3 |
| A3558_S124 | 1.0 | 19.2 | 0.53 | 0.75 | 1.4 | 33 | -61 | 82 | 2.6 | 0.4 |
| A3558_S134 | 1.0 | 8.9 | 0.51 | 2.56 | 5.0 | 70 | -71 | 244 | 26.0 | 3.9 |
| tA3558_S134 | 1.0 | 58.4 | 0.16 | 0.25 | 1.6 | 150 | 73 | 94 | 0.97 | 0.1 |
| A85_S57 | 0.4 | 23.1 | 0.18 | 0.35 | 1.9 | 150 | 27 | 289 | 4.2 | 0.8 |
| A85_S64 | 0.2 | 7.7 | 0.43 | 2.10 | 4.9 | 100 | -92 | 219 | 19.1 | 3.9 |
| tA85_S64 | 0.2 | 27.0 | 0.36 | 1.27 | 3.5 | 33 | 35 | 89 | 4.7 | 0.9 |
| A85_S90 | 1.2 | 13.4 | 0.33 | 1.79 | 5.4 | 100 | -11 | 239 | 17.7 | 3.6 |
Among the other 18 galaxies 4 have an emission detected with a low S/N ().
The derived CO velocities of the target galaxies are very close to those inferred from the optical redshift, indicated in Fig. 3 by a blue vertical solid line. The difference between the two velocities are indicated in Col. 8 of Tab.2, and are mostly below the velocity resolution. For the galaxies having a MeerKAT detection we also show the H\scaleto1.2ex velocity as a dashed line, which is often closer to the molecular gas velocity with respect to the optical stellar one. The largest differences in systemic velocity are found in galaxies that appear nearly face-on. For the massive galaxy A3558_S167 (GASP JO147) the double horn profile indicates that the disk rotation is resolved in velocity. All the galaxies that have a GASP counterpart (i.e. signs of stripped H-emitting gas) except the low mass A3558_S124 (JO159), have a significant emission of molecular gas, with S/N ranging from 4 to 16. When a signal was detected, the observations reached the desired S/N level using a significantly lower integration time, with respect to what we could predict assuming that cluster galaxies were poor, i.e. having a molecular gas content 3 below the average content of galaxies with a similar stellar mass. This immediately confirms that in most cases our H\scaleto1.2ex/optical selected sample of candidate ram-pressure stripped galaxies are not deficient.
. The grey shaded region is the rms of the observations in the plot range, after excluding the line emission.
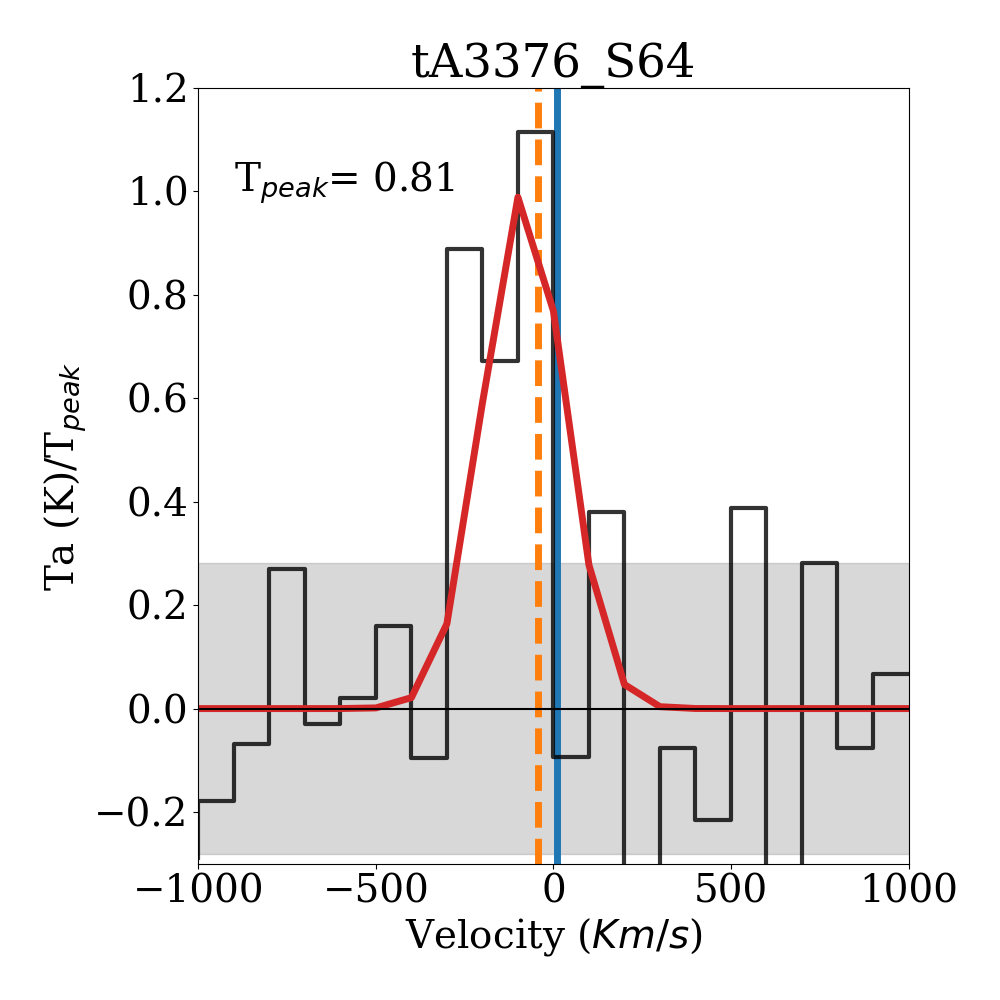
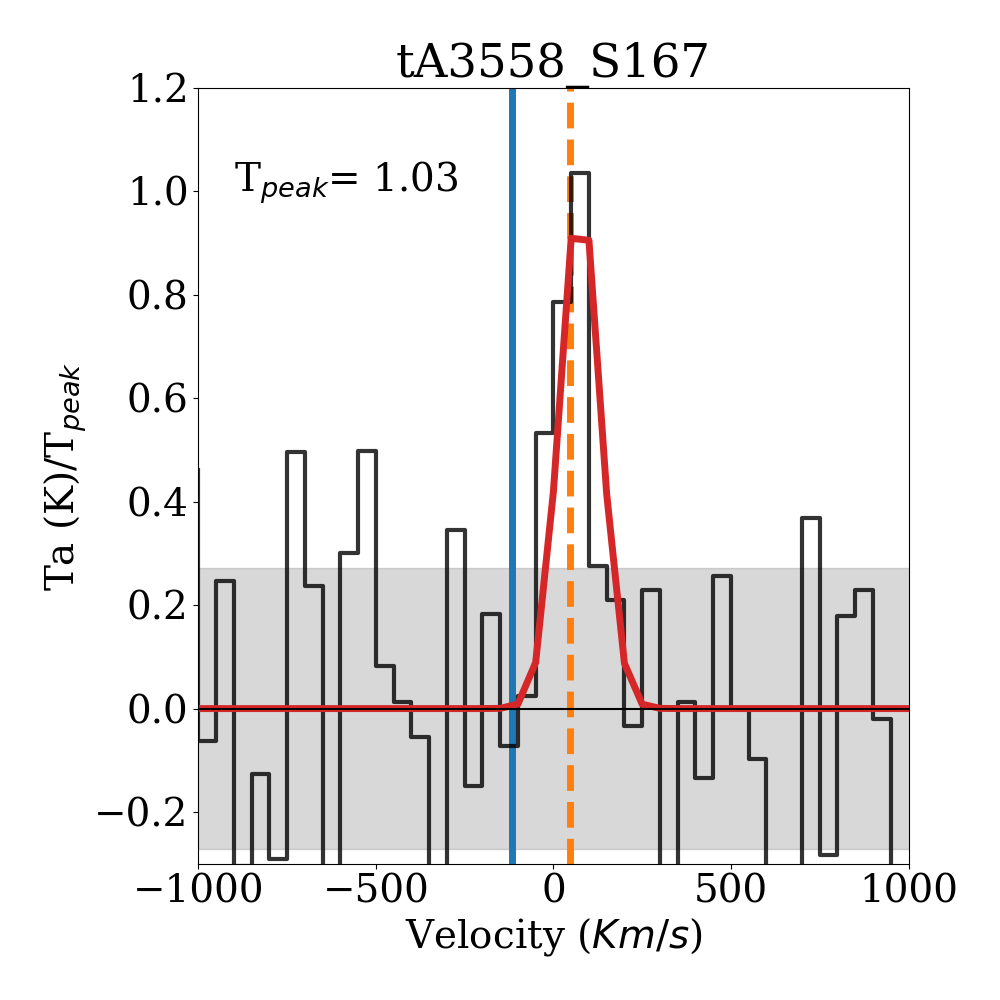
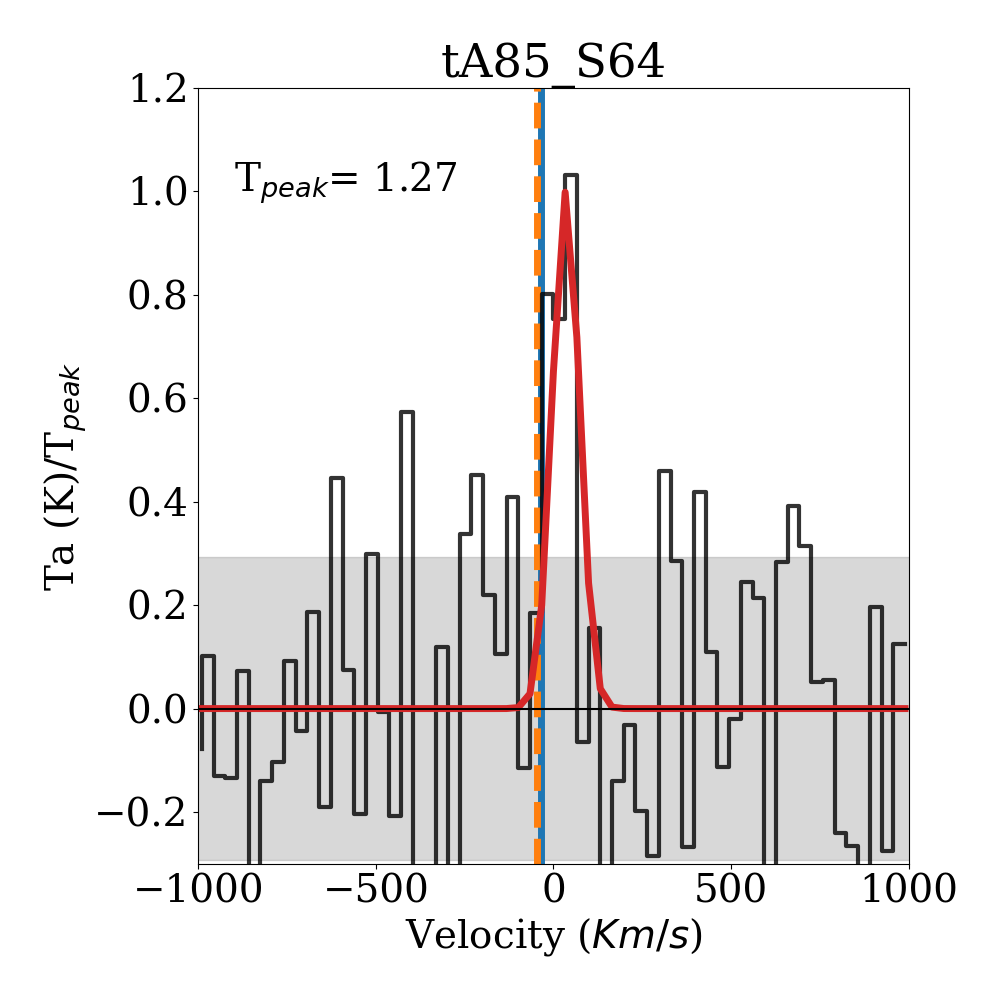
For the APEX pointings centered on the supposed gas tails identified either following the H\scaleto1.2ex extension or the H tail, we obtained a significant detection in 3/8 pointings, namely A3376_S64, A3558_S167 (JO147) and A85_S64 (JO200), shown in Fig. 4, together with the marginal emission in the tail of A3558_S60 (JO157), which has S/N=2.7. All the other tail pointings have a low S/N (from 1.6 to 2.4) and are characterized by a relatively narrow linewidth.
4 The molecular gas content
In order to be consistent with our previous works (Moretti et al., 2018, 2020a), we used the measured line fluxes to calculate then the mass using the following equation from Watson & Koda (2017):
| (3) |
where is the CO-to- conversion factor expressed in (K km s-1)-1 (Bolatto et al., 2013), is the CO(2-1)-to-CO(1-0) flux ratio, is the CO integrated line flux in Jy and DL is the luminosity distance in Mpc. As done in Moretti et al. (2018) we used , i.e. the standard Milky Way value corresponding to a conversion factor of cm-2(K km s-1)-1 including the helium correction. As for the , we adopted the same value (0.79) that we used in our APEX (Moretti et al., 2018) and ALMA (Moretti et al., 2020b, a) data analysis for the sake of comparison. To take into account the systematic uncertainty on the factor, we calculated a lower limit on the mass obtained by assuming that its value is 50% lower than the canonical Milky Way factor, while higher values are less probable in massive, metal-rich galaxies (Bolatto et al., 2013). Errors calculated in this way are shown in the last column of Tab.2. The molecular gas content of the sample galaxies varies between 109 and 21010 in galaxies where the line is measured with sufficient S/N.
The molecular gas masses calculated in this way are systematically 5% larger than those calculated using the Solomon & Vanden Bout (2005) equation, which explicitly takes into account the dependence on redshift, being
| (4) |
where is the velocity integrated flux in Jy , is the observed line frequency at the source redshift z, and is the corresponding luminosity distance. In this formulation the major source of uncertainty comes from the conversion value, which includes both the CO-to- conversion factor and the line ratio, and is typically assumed to be equal to 5.5 (Jáchym et al., 2014). These values are, in any case, within the errors of our measurements.
This allows a straightforward comparison with the recent determination of the molecular gas content/fraction in Virgo galaxies by Brown et al. (2021), who also uses the Chabrier (2003) IMF to determine galaxy stellar masses.
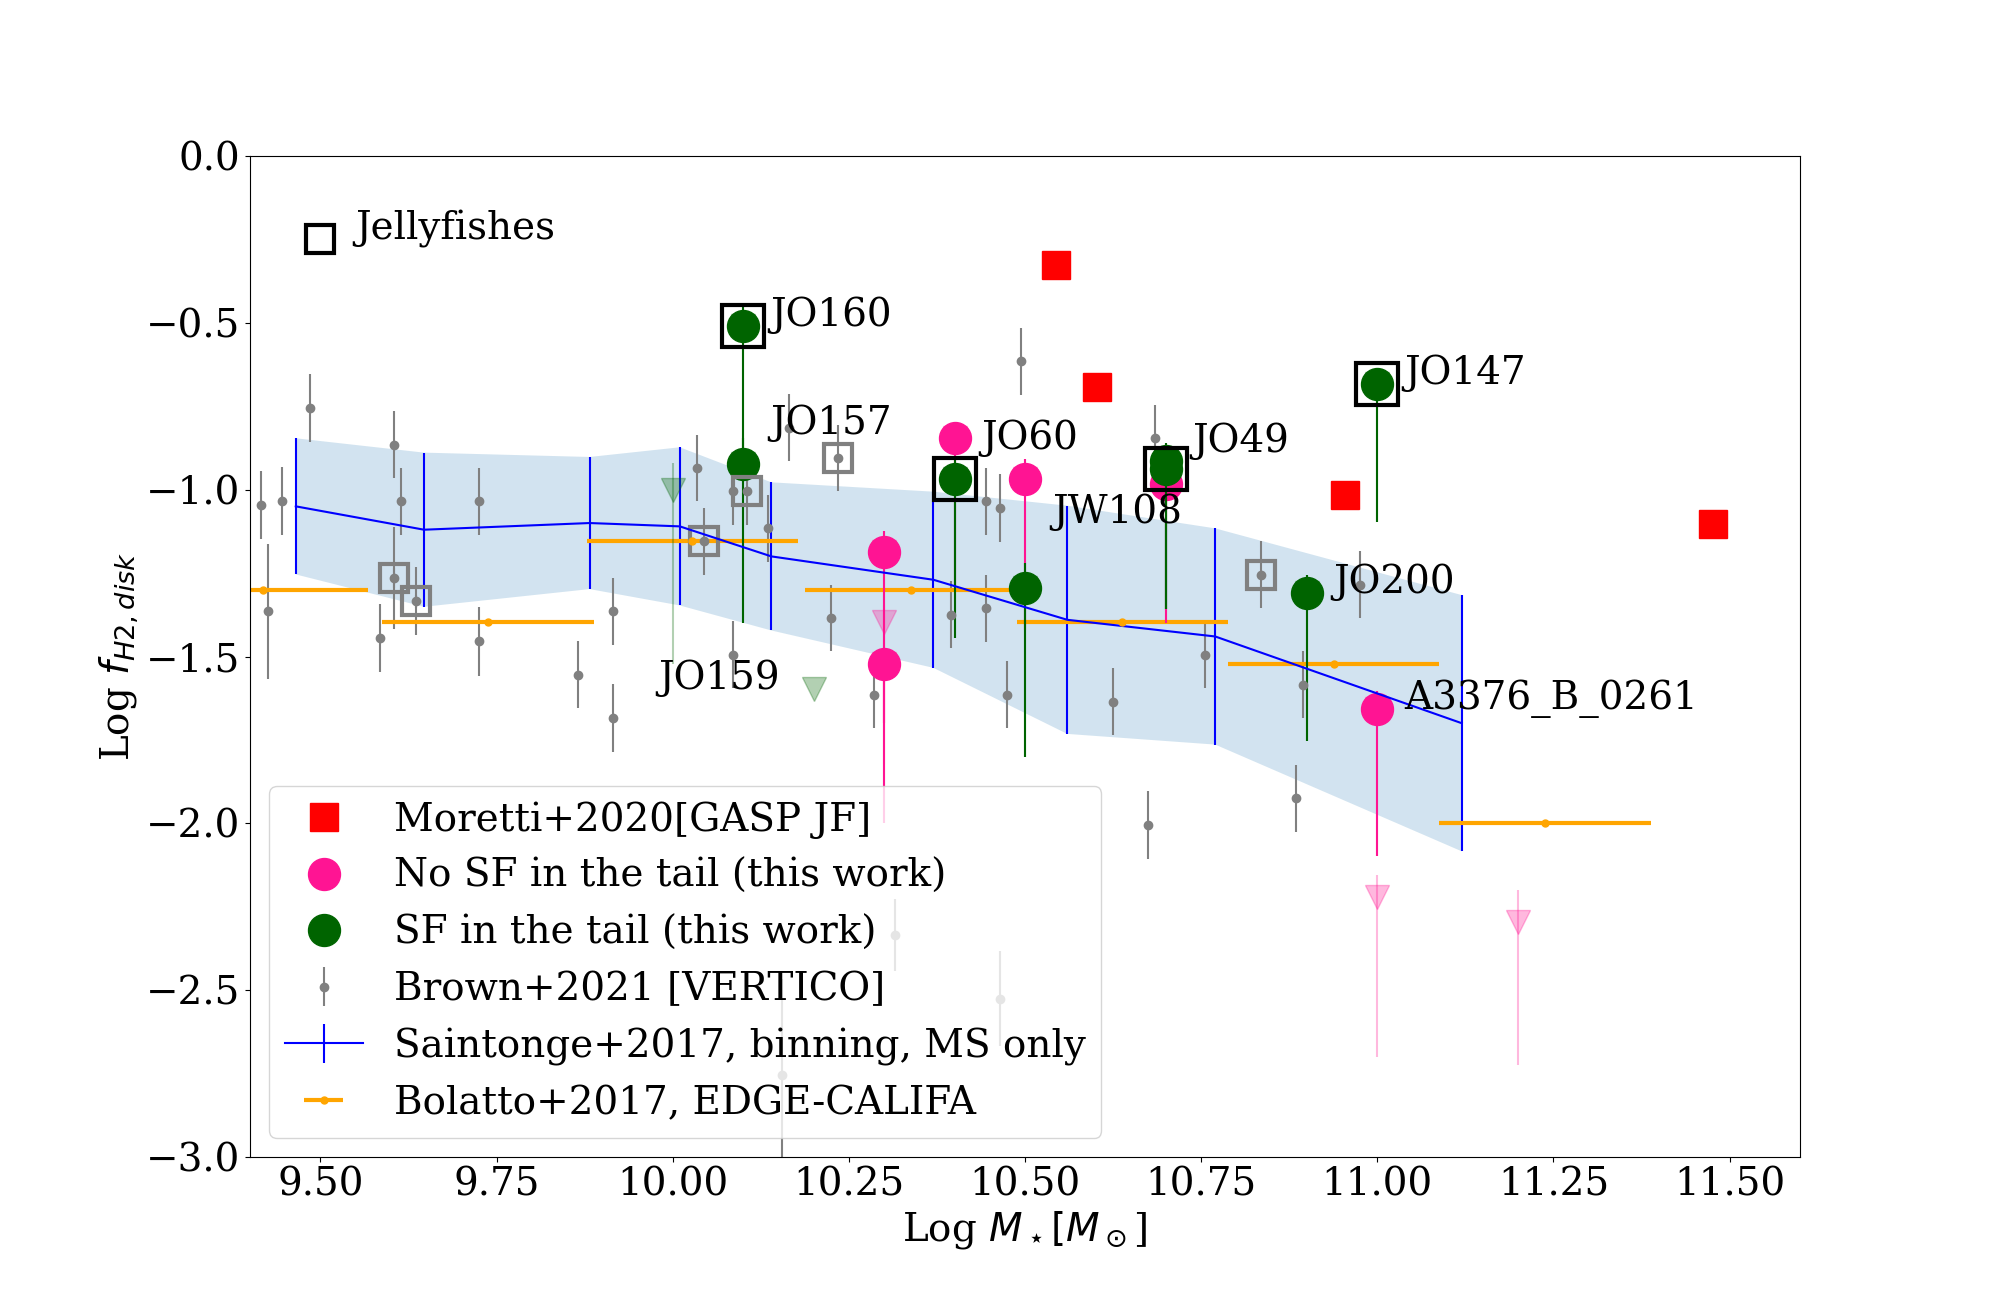
Fig. 5 shows the position of our targets in the molecular gas fraction versus stellar mass plane, where we indicated with different colors galaxies with (green) and without (magenta) star formation in the tail. The red squares refer to the 4 GASP galaxies undergoing strong RPS analyzed in Moretti et al. (2020a). It can be immediately seen that % of the observed sample of H\scaleto1.2ex selected galaxies (9/19) with asymmetries lie above the relation found for normal star forming galaxies in the field (blue dashed region from Saintonge et al. 2017) and in Virgo (grey dots). Among the galaxies closer to the relation for field galaxies, A85_S64 (JO200) possesses a MUSE H counterpart, which follows its spiral arms. We covered this emission with a second APEX pointing, which reveals the presence of molecular gas. The H morphology of this galaxy closely resembles the one of the JO201 GASP galaxy (Bellhouse et al., 2017), which shows unwinding spiral arms possibly caused by the RPS (Bellhouse et al., 2021). If we include the molecular gas mass in the tail in the global budget, then the point would move even closer to the upper edge of the distribution of field galaxies in the M⋆-f plane (see Fig. 5).
Among the galaxies located below the relation in Fig. 5, only one has a clear detection (A3376_S45) indicating that this galaxy is deficient. This galaxy also shows no emission from the tail region. The other galaxies located below the Saintonge et al. (2017) relation are characterized by a low signal-to-noise (shaded triangles), irrespective of their stellar mass. One of these, the GASP galaxy JO159, has been classified as an initial stripping phase (Poggianti+, in prep.).
It is clear that when the H\scaleto1.2ex asymmetry is coupled with having SF in the tail, then in 75% (6/8) of the cases with S/N3 the content is enhanced within the stellar body (83% = 10/12 if we include the Moretti et al. 2020a galaxies). In particular, galaxies classified by GASP as jellyfishes (red squares and green dots surrounded by a black square in Fig. 5), i.e. those having an ionized gas tail at least as long as the stellar disk and therefore being at their peak stripping phase, show a strongly enhanced molecular gas fraction. Among these, A3558_S167(GASP JO147) is the -richest massive galaxy (see also Merluzzi et al. 2013) and, together with the galaxy JO49, also rich, it hosts an active nucleus, as the other massive jellyfishes in GASP (Poggianti et al., 2017b; Peluso et al., 2022). Noticeably, also the GASP galaxy JW108, which has been classified as a truncated disk, i. e. a galaxy where the ionized gas emission comes from a region smaller than the extent of the stellar disk, typical of the latest stage of gas stripping, lies above the relation. In fact, because of the more advanced stage of stripping of this galaxy, most of the H\scaleto1.2ex gas is probably removed or got converted into , resulting in a very faint H\scaleto1.2ex emission (below the detection threshold) in this galaxy, while still showing an increased amount of cold molecular gas in its disk (while the detection in the tail has a low S/N). In fact, besides JO159, the only GASP galaxy not lying above the field relation is A3376_S75 (A3376_B_0261) which is a control sample galaxy in GASP and thus shows a pretty normal molecular gas content.
On the other hand, when the H\scaleto1.2ex asymmetry manifests in galaxies without SF in the tail the content within the stellar body tend to be normal/low in 50% (3/6) of the cases (magenta dots in Fig. 5, representing detections with S/N3). If we include the low S/N detections, this percentage increases to 67% (6/9).
Our result seems to suggest that the different gas proportion and displacement follow a temporal evolution: first the galaxy is hit by the ram pressure and starts developing the H\scaleto1.2ex asymmetry, possibly losing molecular gas as well (at least the more diffuse component). At the same time, in the regions of the disc compressed by ram pressure the H\scaleto1.2ex is efficiently converted in molecular gas in the disk, and by the time we see the ionized gas tail the molecular gas fraction of the galaxy is significantly enhanced. This increase in the molecular gas fraction seems to be preserved also in galaxies in advanced stripping stage, as is the case of A3376_JW108. This result is perfectly in agreement with the detection of large cold gas reservoir in post-starburst (PSB) galaxies (French et al., 2015; Rowlands et al., 2015; Alatalo et al., 2016), under the hypothesis that these objects belong to the evolutionary sequence caused by the RPS (Vulcani et al., 2020; Werle et al., 2022). In fact, in PSB galaxies the cold gas is thought to be present in a diffuse phase not contributing to the star formation.
4.1 Molecular gas in the stripped tails
The molecular gas content measured in the pointings covering the expected gaseous tail amount to 109 in all the three sources with S/N3, namely A3376_S64, A3558_S167 (JO147) and A85_S64 (JO200). Interestingly, two of these tails belong to very massive GASP galaxies (JO200 and JO147) and exhibit a narrow CO linewidth (90 and 130 , respectively), while the third one is a low-mass galaxy showing a broad linewidth. All the low S/N tail detections, instead, are related to galaxies with low stellar masses (logM⋆=10.1-10.5 ). This result suggests that in our sample, when the ram-pressure is able to produce a long gas tail visible at optical/UV wavelengths, a cold molecular gas counterpart is detectable. In low mass galaxies the amount of cold gas in the tail is proportionally lower implying a more difficult detection.
The nFLASH APEX detector, though, can only observe the CO(2-1) line emission, usually associated with the dense gas, while the less dense phase could be more easily stripped and found along the tails. Unfortunately, APEX can not observe this transition, and further data (e.g. ALMA) are needed to evaluate the diffuse molecular gas content in ram-pressure stripped tails.
5 Cold gas balance
For the majority (16/19) of the galaxies having a molecular gas mass determination from APEX, we also have the H\scaleto1.2ex cold gas content, as derived from MeerKAT data555Two galaxies in the sample are not covered by MeerKAT observations (A169_JO49 and A1991_JO60). As already shown in Moretti et al. (2022), in case a galaxy is massive and at its peak stripping, such as the four ones observed with ALMA, its cold gas fraction /HI is significantly enhanced with respect to normally star forming field galaxies not subject to the cluster dense environment and/or ram pressure stripping. More recently, Zabel et al. (2022) compared the atomic and molecular gas content in Virgo galaxies, which were divided into different classes based on their H\scaleto1.2ex morphology and content, following the classification criteria proposed by Yoon et al. (2017). Zabel et al. (2022) found a weak correlation between the H\scaleto1.2ex and H2 deficiencies, albeit with a large scatter, suggesting that the H\scaleto1.2ex deficiency does not always predict H2 deficiency. This was interpreted as an indication that ram pressure stripping is not effective at reducing global molecular gas fractions on the timescales in which such features are still clearly visible.
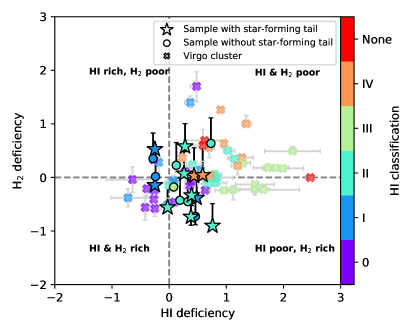
With the aim of comparing our galaxies with those in Virgo, we used both the visual asymmetries and the cold gas content (H\scaleto1.2ex and ) to classify our galaxies using the definitions in Yoon et al. (2017) (classification given in the last column of Tab.1). More in detail, we calculated the H\scaleto1.2ex and deficiencies using the definition based on the stellar mass (Zabel et al., 2022)
| (5) |
where HI and , is the H\scaleto1.2ex or mass expected given the galaxy stellar mass, and is the observed H\scaleto1.2ex or mass. In particular, is the median H\scaleto1.2ex () mass calculated in bins of stellar mass using the xGASS (xCOLD-GASS) control sample (Saintonge et al., 2017; Catinella et al., 2018). We used ten bins of stellar mass equally spaced in logarithmic scale.
Based on our classification, galaxies showing no or very mild H\scaleto1.2ex deficiency and asymmetries (i.e. class I) have normal or slightly high H2 content compared to field galaxies (see Fig. 6). Class IV galaxies, which have low H\scaleto1.2ex surface densities without clear signs of ongoing or past stripping are usually both H\scaleto1.2ex and poor, as shown by the Virgo galaxies (transparent symbols in Fig. 6). Class IV galaxies in our sample, instead, have a normal content. Galaxies displaying clear signs of ongoing ram pressure stripping (class II and III) have normal or enhanced H2 content. Clearly, our sample is dominated by class I-II-III, which is expected given the selection criteria. The comparison between our galaxies and those analyzed in Virgo (Zabel et al., 2022) is shown in Fig. 6. In general, the APEX galaxies are slightly H\scaleto1.2ex poor but relatively H2 rich compared to field galaxies (Moretti et al., 2020a), following the same behavior as the class II galaxies in the Virgo sample. This result is consistent with the results by Zabel et al. 2022, who concluded that H\scaleto1.2ex deficiency does not necessarily mean H2 deficiency and that the molecular gas content is affected by ram pressure on different timescales than the atomic gas. This suggests that the stripping is less severe on H2 than on H\scaleto1.2ex, which is likely because the former is denser and more gravitationally bound to the galaxy than the latter (Lee et al., 2017; Boselli et al., 2022; Bacchini et al., 2023).
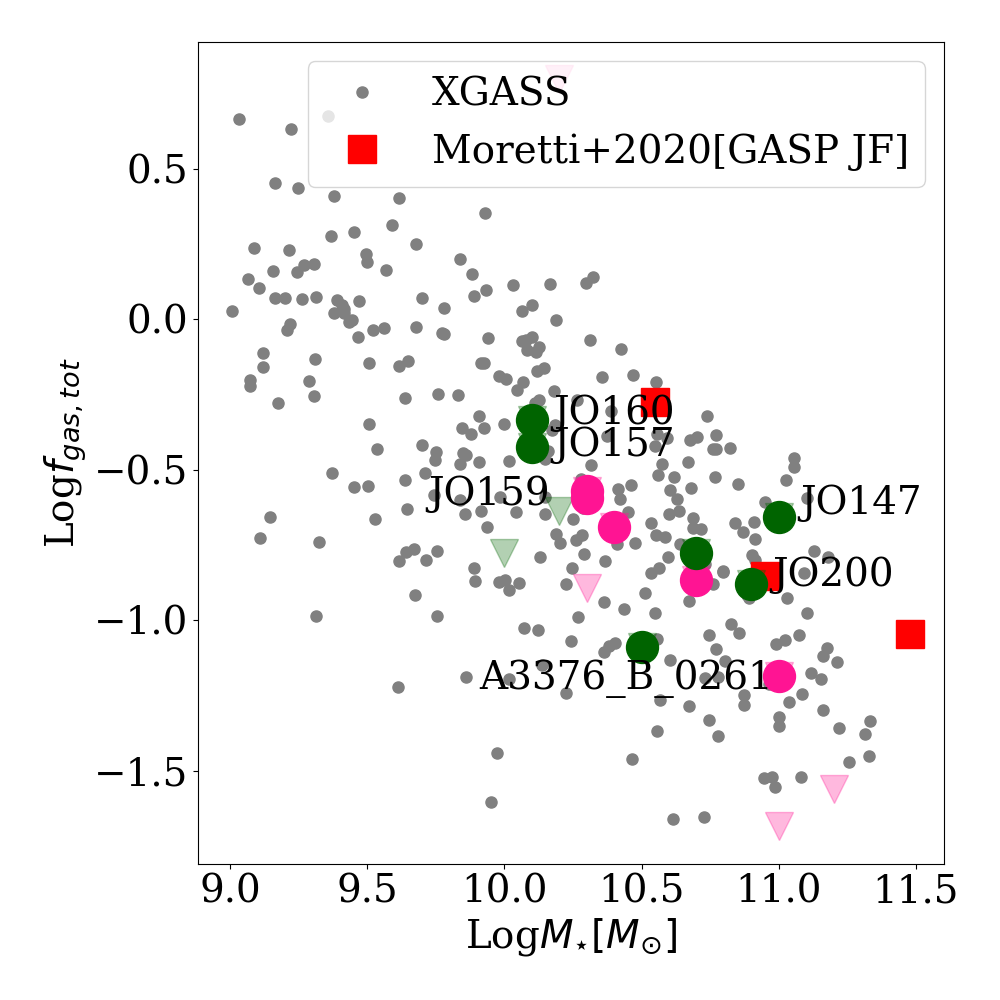
However, if we now compute the global gas fraction summing up the contributions of H\scaleto1.2ex and , both corrected for the helium content, and compare it with the XGASS sample of field galaxies, we find again (as in Moretti et al. 2020a) that the global cold gas content of ram pressure stripped galaxies is pretty normal, as shown in Fig. 7. We stress that our cold gas mass evaluation refers to the global gas mass of each galaxy both for the atomic and the molecular phase, and is therefore minimizing the effects due to the different spatial distribution of the two phases, which can in principle affect the results (Cortese et al., 2016). This finding strongly suggests that, for galaxies selected as in this paper based on the presence of H\scaleto1.2ex asymmetry, and thus going through a specific phase of their transformation in a cluster, an important effect of RPS is the formation of new molecular gas from the H\scaleto1.2ex that is not stripped.
Combining Figs. 5 and 7, we can see that this conversion of H\scaleto1.2ex into within the stellar body (and therefore the simultaneous H\scaleto1.2ex deficiency and enhancement) is strongly enhanced when the interaction with the cluster environment leads to having star formation in the tail of stripped gas.
6 Discussion
If the interpretation proposed in the previous section is correct, then our results should be broadly consistent with the position of the galaxies in the projected phase-space diagram, which is the best observational representation of the galaxy orbital histories within a cluster. Despite the fact that this diagram is severely affected by projection effects, still it has been used in the past to infer galaxy properties as a function of their infall history within their host cluster (Rhee et al., 2017; Jaffé et al., 2018; Gullieuszik et al., 2020; Franchetto et al., 2021). We therefore exploit the phase space diagram for the three clusters containing most of the galaxies here described, i. e. A3558, A85 and A3376 with the purpose of testing this hypothesis.
In building this diagram we used all the galaxies confirmed to be cluster members on the basis of the redshift measurements from Moretti et al. (2017). The position of each galaxy in the y-axis of the phase-space is given by the projected velocity of each galaxy with respect to the cluster velocity. The position on the x-axis is given by the relative distance of each galaxy with respect to the cluster BCG. In order to build a single phase-space for the three clusters, we normalized the y-axis to the cluster velocity dispersion () and the x-axis to the cluster r200, where both values come from Moretti et al. (2017). We plot in Fig. 8 the galaxies number density as greyscale contours.
In Fig. 8 galaxy colors reflect the deficiency in the top panel, and the H\scaleto1.2ex deficiency in the bottom panel: in both cases green symbols represent gas poor galaxies, and pink symbols gas rich galaxies. Dots are the galaxies discussed in the present paper, while squares refer to the four jellyfish galaxies in Moretti et al. (2020a). When present, the black triangles within the dots indicate low S/N measurements.
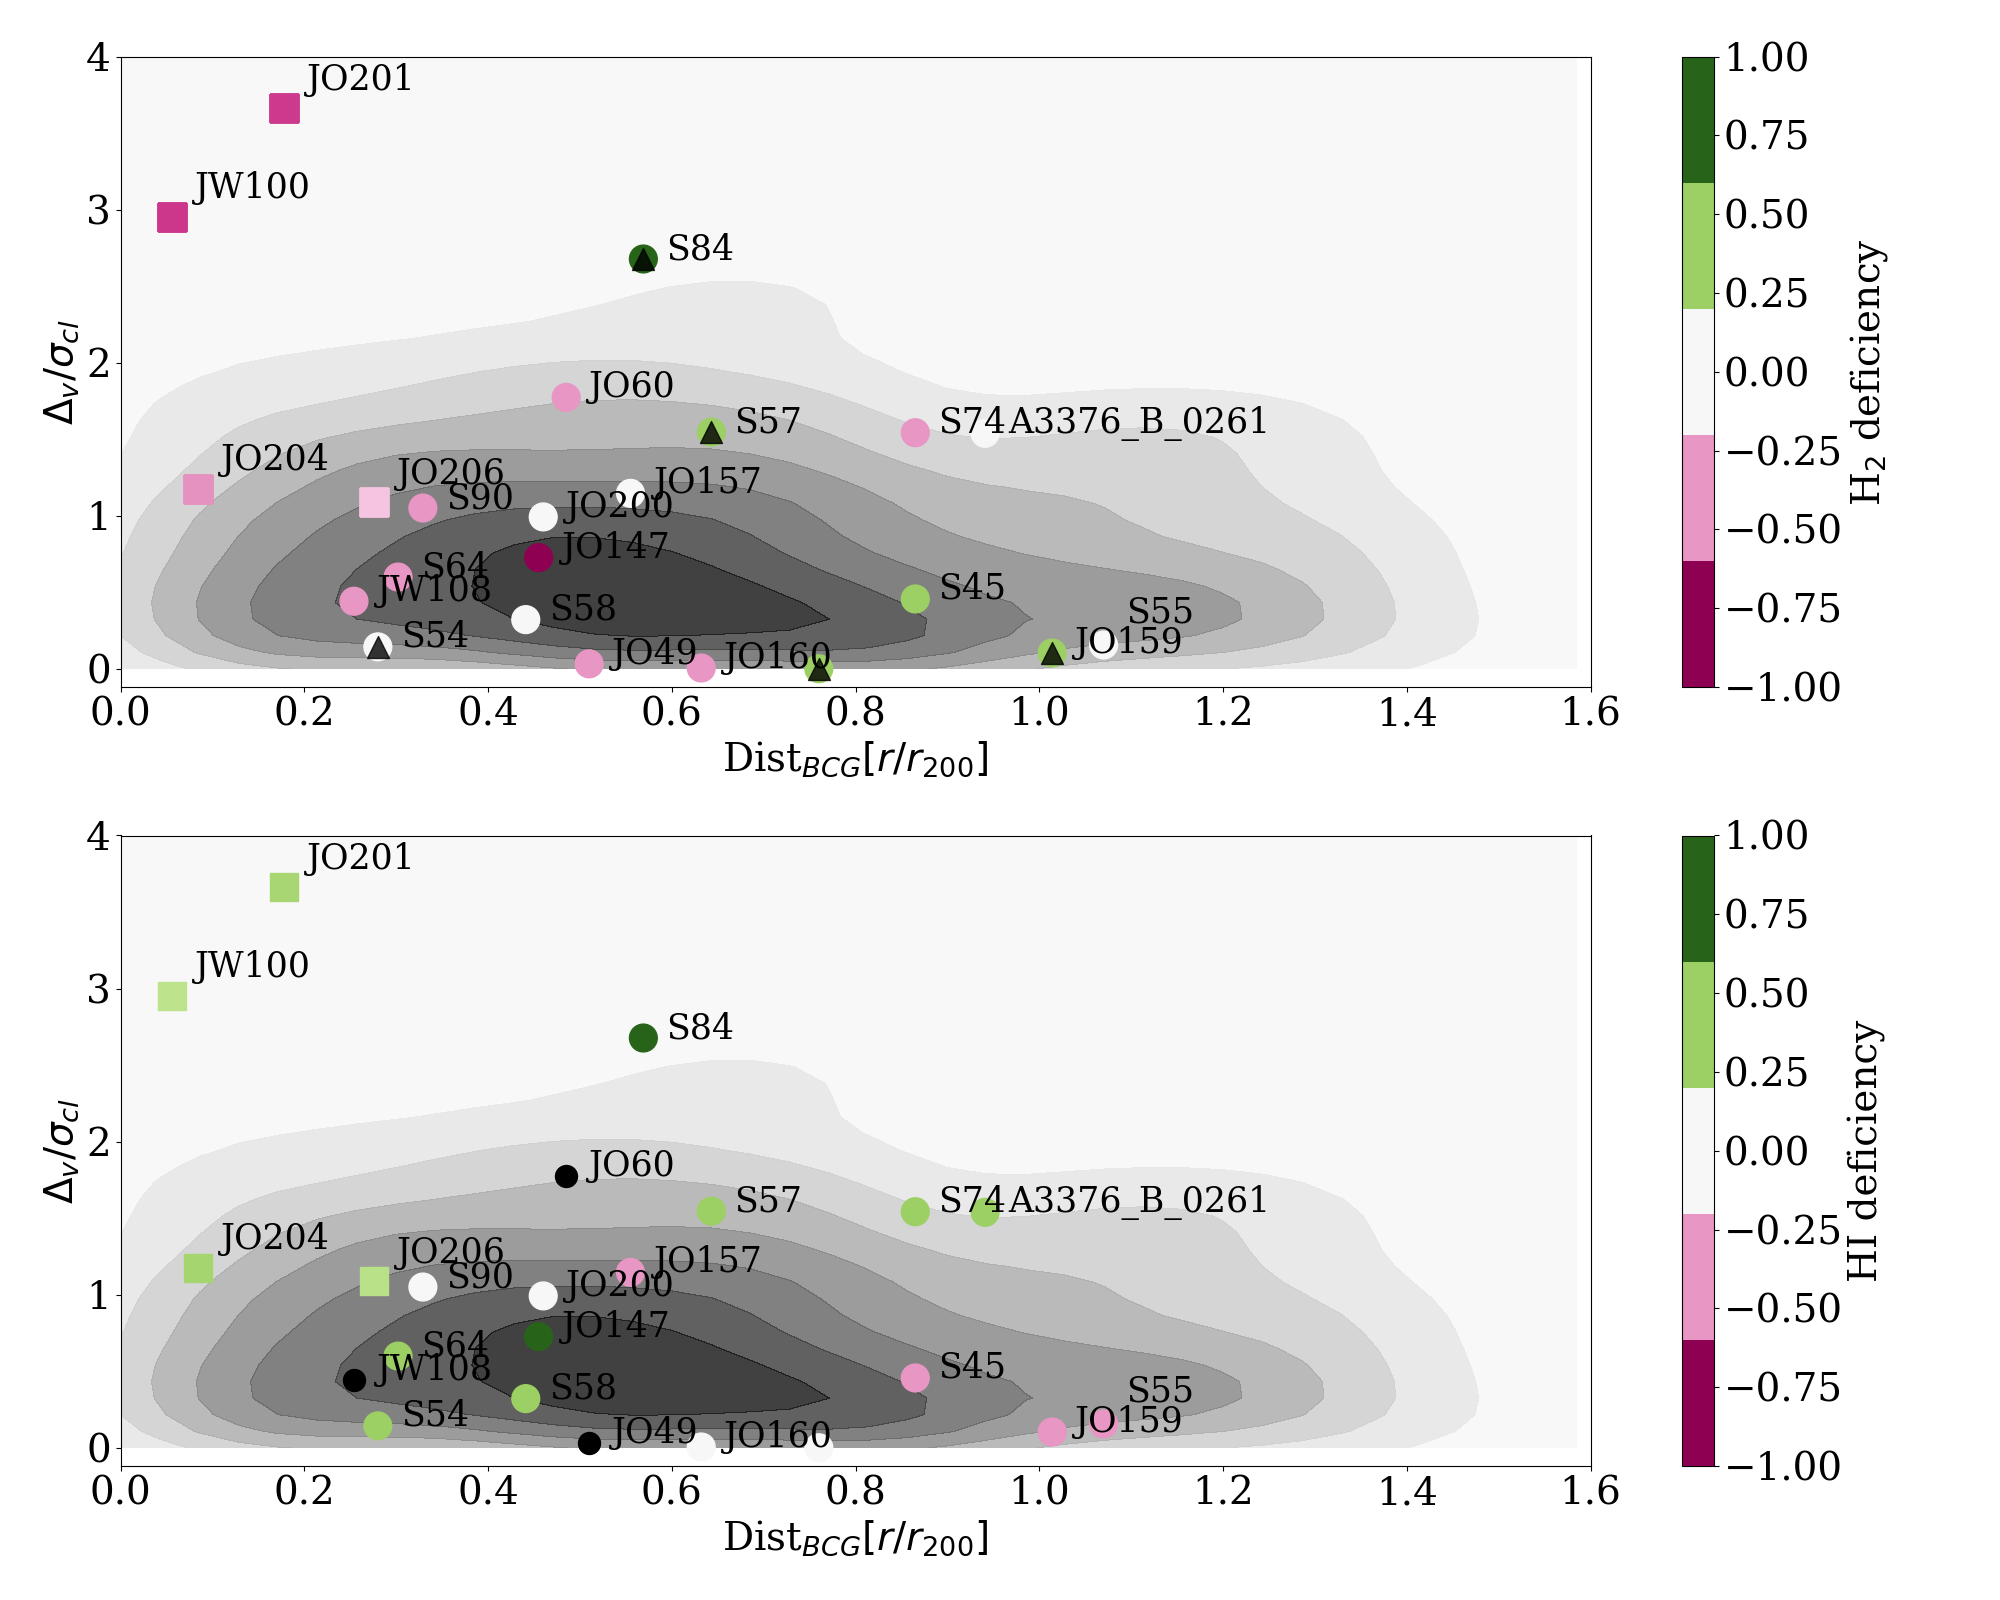
As already shown in Fig. 5, galaxies with an H\scaleto1.2ex asymmetry in MeerKAT for which a clear APEX detection is present are also enriched (pink-ish colors in the top panel) and, at the same time, H\scaleto1.2ex-poor (green colors in the bottom panel). Their position in the phase-space diagram is consistent with the scenario in which galaxies closer to the cluster center appears to show a lower H\scaleto1.2ex content. The coupling of this effect with the relative enrichment strongly support the hypothesis that together with some stripping the H\scaleto1.2ex gas gets also, at least partially, efficiently converted into , making these objects also rich.
We notice that this result is compatible with the recent findings for Coma, where the atomic phase of cluster galaxies is characterized by a star formation efficiency that is higher than the one shown by their field counterpart (Molnár et al., 2022). In Fornax and Virgo the situation is less clear, as most galaxies do follow normal relations for what concerns the cold gas content and the SFR, with a small percentage of galaxies characterized by a lower H\scaleto1.2ex content and a higher SFE(H\scaleto1.2ex) (Loni et al., 2021; Kleiner et al., 2021; Brown et al., 2021; Morokuma-Matsui et al., 2022).
Our findings are therefore implying that the galaxies showing this enhanced efficiency SFE(H\scaleto1.2ex) are exactly those showing a clear asymmetry in H\scaleto1.2ex and a star forming tail.
7 Summary
By analyzing single dish APEX data for a large sample of galaxies with H\scaleto1.2ex asymmetries, we find that those showing star formation in the tail, either traced by the optical broad band UV, B or H emission, possess within the stellar body an content which exceeds the value expected for normally star forming field galaxies with the same mass. On the other hand, those not showing star formation in the tail exhibit a normal/low content of . This result can be explained by an evolutionary sequence in the RPS: first galaxies start losing a negligible amount of their cold atomic gas, and then, when star formation manages to take place in the tail, part of the H\scaleto1.2ex reservoir in the disk gets efficiently converted in .
In fact, since their global (H\scaleto1.2ex ) gas content is not significantly different from the predicted one, then this strongly suggests an anti-correlation between these two gas phases, during the specific phase of galaxy transformation probed by our selection: i.e., that when galaxies possess both an H\scaleto1.2ex asymmetry, and host SF in the tail of stripped gas.
This finding is evidenced also when the cold gas (atomic and molecular) properties are connected to the infall history of galaxies in the cluster potential, as shown by the evolution of the H\scaleto1.2ex and deficiencies in the phase-space diagram.
Although our results are derived from single-dish observations, which do not possess the spatial resolution needed to disentangle the impact of the ram-pressure on the galaxy disks (as done in Virgo by Watts et al. 2023 and in GASP galaxies with ALMA data in Moretti et al. 2020b, a) they still provide a first consistent view on the evolution of the cold gas reservoir in a statistically significant sample of galaxies subject to this environmental effect.
References
- Alatalo et al. (2016) Alatalo, K., Lisenfeld, U., Lanz, L., et al. 2016, The Astrophysical Journal, 827, 106, doi: 10.3847/0004-637X/827/2/106
- Astropy Collaboration et al. (2022) Astropy Collaboration, Price-Whelan, A. M., Lim, P. L., et al. 2022, 935, 167, doi: 10.3847/1538-4357/ac7c74
- Bacchini et al. (2023) Bacchini, C., Mingozzi, M., Poggianti, B. M., et al. 2023, The Astrophysical Journal, 950, 24, doi: 10.3847/1538-4357/acc9b9
- Bartolini et al. (2022) Bartolini, C., Ignesti, A., Gitti, M., et al. 2022, The Astrophysical Journal, 936, 74, doi: 10.3847/1538-4357/ac866a
- Bellhouse et al. (2017) Bellhouse, C., Jaffé, Y. L., Hau, G. K. T., et al. 2017, The Astrophysical Journal, 844, 49, doi: 10.3847/1538-4357/aa7875
- Bellhouse et al. (2021) Bellhouse, C., McGee, S. L., Smith, R., et al. 2021, Monthly Notices of the Royal Astronomical Society, 500, 1285, doi: 10.1093/mnras/staa3298
- Bolatto et al. (2013) Bolatto, A. D., Wolfire, M., & Leroy, A. K. 2013, Annual Review of Astronomy and Astrophysics, vol. 51, issue 1, pp. 207-268, 51, 207, doi: 10.1146/annurev-astro-082812-140944
- Bolatto et al. (2017) Bolatto, A. D., Wong, T., Utomo, D., et al. 2017, The Astrophysical Journal, 846, 159, doi: 10.3847/1538-4357/aa86aa
- Boselli et al. (2014) Boselli, A., Cortese, L., Boquien, M., et al. 2014, Astronomy & Astrophysics, 564, A67, doi: 10.1051/0004-6361/201322313
- Boselli et al. (2022) Boselli, A., Fossati, M., & Sun, M. 2022, The Astronomy and Astrophysics Review, 30, 3, doi: 10.1007/s00159-022-00140-3
- Boselli & Gavazzi (2006) Boselli, A., & Gavazzi, G. 2006, Publications of the Astronomical Society of the Pacific, 118, 517, doi: 10.1086/500691
- Boselli et al. (2018) Boselli, A., Fossati, M., Ferrarese, L., et al. 2018, Astronomy & Astrophysics, 614, A56, doi: 10.1051/0004-6361/201732407
- Boselli et al. (2023) Boselli, A., Serra, P., de Gasperin, F., et al. 2023, Astronomy & Astrophysics, 676, A92, doi: 10.1051/0004-6361/202346812
- Brown et al. (2021) Brown, T., Wilson, C. D., Zabel, N., et al. 2021, The Astrophysical Journal Supplement Series, 257, 21, doi: 10.3847/1538-4365/ac28f5
- Byrd & Valtonen (1990) Byrd, G., & Valtonen, M. 1990, The Astrophysical Journal, 350, 89, doi: 10.1086/168362
- Campitiello et al. (2021) Campitiello, M. G., Ignesti, A., Gitti, M., et al. 2021, The Astrophysical Journal, 911, 144, doi: 10.3847/1538-4357/abec82
- Catinella et al. (2018) Catinella, B., Saintonge, A., Janowiecki, S., et al. 2018, Monthly Notices of the Royal Astronomical Society, 476, 875, doi: 10.1093/mnras/sty089
- Chabrier (2003) Chabrier, G. 2003, The Publications of the Astronomical Society of the Pacific, Volume 115, Issue 809, pp. 763-795., 115, 763, doi: 10.1086/376392
- Chung et al. (2009) Chung, A., van Gorkom, J. H., Kenney, J. D. P., Crowl, H., & Vollmer, B. 2009, The Astronomical Journal, 138, 1741, doi: 10.1088/0004-6256/138/6/1741
- Chung et al. (2007) Chung, A., van Gorkom, J. H., Kenney, J. D. P., & Vollmer, B. 2007, The Astrophysical Journal, 659, doi: 10.1086/518034
- Corbelli et al. (2012) Corbelli, E., Bianchi, S., Cortese, L., et al. 2012, Astronomy & Astrophysics, 542, A32, doi: 10.1051/0004-6361/201117329
- Cortese et al. (2021) Cortese, L., Catinella, B., & Smith, R. 2021, Publications of the Astronomical Society of Australia, 38, e035, doi: 10.1017/pasa.2021.18
- Cortese et al. (2010) Cortese, L., Davies, J. I., Pohlen, M., et al. 2010, Astronomy and Astrophysics, 518, L49, doi: 10.1051/0004-6361/201014550
- Cortese et al. (2016) Cortese, L., Bekki, K., Boselli, A., et al. 2016, Monthly Notices of the Royal Astronomical Society, Volume 459, Issue 4, p.3574-3584, 459, 3574, doi: 10.1093/mnras/stw801
- Cowie & Songaila (1977) Cowie, L. L., & Songaila, A. 1977, Nature, 266, 501, doi: 10.1038/266501a0
- Deb et al. (2022) Deb, T., Verheijen, M. A. W., Poggianti, B. M., et al. 2022, Monthly Notices of the Royal Astronomical Society, 516, 2683, doi: 10.1093/mnras/stac2441
- Dressler (1980) Dressler, A. 1980, The Astrophysical Journal, 236, 351, doi: 10.1086/157753
- Elmegreen (1993) Elmegreen, B. G. 1993, The Astrophysical Journal, 411, 170, doi: 10.1086/172816
- Fasano et al. (2015) Fasano, G., Poggianti, B. M., Bettoni, D., et al. 2015, Monthly Notices of the Royal Astronomical Society, Volume 449, Issue 4, p.3927-3944, 449, 3927, doi: 10.1093/mnras/stv500
- Fossati et al. (2016) Fossati, M., Fumagalli, M., Boselli, A., et al. 2016, Monthly Notices of the Royal Astronomical Society, 455, 2028, doi: 10.1093/mnras/stv2400
- Franchetto et al. (2021) Franchetto, A., Mingozzi, M., Poggianti, B. M., et al. 2021, The Astrophysical Journal, 923, 28, doi: 10.3847/1538-4357/ac2510
- French et al. (2015) French, K. D., Yang, Y., Zabludoff, A., et al. 2015, The Astrophysical Journal, 801, 1, doi: 10.1088/0004-637X/801/1/1
- Fumagalli et al. (2014) Fumagalli, M., Fossati, M., Hau, G. K. T., et al. 2014, Monthly Notices of the Royal Astronomical Society, 445, 4335, doi: 10.1093/mnras/stu2092
- Gavazzi (1978) Gavazzi, G. 1978, Astronomy & Astrophysics, 69, 355
- Gavazzi et al. (1995) Gavazzi, G., Contursi, A., Carrasco, L., et al. 1995, Astronomy & Astrophysics, 304, 325
- George et al. (2023) George, K., Poggianti, B. M., Tomičić, N., et al. 2023, Monthly Notices of the Royal Astronomical Society, 519, 2426, doi: 10.1093/mnras/stac3593
- Gildas Team (2013) Gildas Team. 2013, GILDAS: Grenoble Image and Line Data Analysis Software, Astrophysics Source Code Library, record ascl:1305.010
- Giunchi et al. (2023) Giunchi, E., Gullieuszik, M., Poggianti, B. M., et al. 2023, The Astrophysical Journal, 949, 72, doi: 10.3847/1538-4357/acc5ee
- Gnedin et al. (2007) Gnedin, O. Y., Weinberg, D. H., Pizagno, J., Prada, F., & Rix, H.-W. 2007, The Astrophysical Journal, Volume 671, Issue 2, pp. 1115-1134., 671, 1115, doi: 10.1086/523256
- Guglielmo et al. (2015) Guglielmo, V., Poggianti, B. M., Moretti, A., et al. 2015, Monthly Notices of the Royal Astronomical Society, 450, 2749, doi: 10.1093/mnras/stv757
- Gullieuszik et al. (2015) Gullieuszik, M., Poggianti, B., Fasano, G., et al. 2015, Astronomy & Astrophysics, Volume 581, id.A41, 17 pp., 581, 41, doi: 10.1051/0004-6361/201526061
- Gullieuszik et al. (2020) Gullieuszik, M., Poggianti, B. M., McGee, S. L., et al. 2020, The Astrophysical Journal, 899, 13, doi: 10.3847/1538-4357/aba3cb
- Gullieuszik et al. (2023) Gullieuszik, M., Giunchi, E., Poggianti, B. M., et al. 2023, The Astrophysical Journal, 945, 54, doi: 10.3847/1538-4357/acb59b
- Gunn & Gott (1972) Gunn, J. E., & Gott, J. Richard, I. 1972, The Astrophysical Journal, 176, 1, doi: 10.1086/151605
- Hess et al. (2022) Hess, K. M., Kotulla, R., Chen, H., et al. 2022, Astronomy & Astrophysics, 668, A184, doi: 10.1051/0004-6361/202243412
- Ignesti et al. (2022) Ignesti, A., Vulcani, B., Poggianti, B. M., et al. 2022, The Astrophysical Journal, 937, 58, doi: 10.3847/1538-4357/ac8cf6
- Jáchym et al. (2014) Jáchym, P., Combes, F., Cortese, L., Sun, M., & Kenney, J. D. P. 2014, The Astrophysical Journal, 792, 11, doi: 10.1088/0004-637X/792/1/11
- Jachym et al. (2017) Jachym, P., Sun, M., Kenney, J. D. P., et al. 2017, The Astrophysical Journal, Volume 839, Issue 2, article id. 114, 15 pp. (2017)., 839, doi: 10.3847/1538-4357/aa6af5
- Jaffé et al. (2018) Jaffé, Y. L., Poggianti, B. M., Moretti, A., et al. 2018, Monthly Notices of the Royal Astronomical Society, 476, 4753, doi: 10.1093/mnras/sty500
- Jozsa et al. (2020) Jozsa, G. I. G., White, S. V., Thorat, K., et al. 2020, CARACal: Containerized Automated Radio Astronomy Calibration pipeline
- Kenney et al. (2004) Kenney, J. D. P., van Gorkom, J. H., & Vollmer, B. 2004, The Astronomical Journal, 127, 3361, doi: 10.1086/420805
- Kenney & Young (1989) Kenney, J. D. P., & Young, J. S. 1989, The Astrophysical Journal, 344, 171, doi: 10.1086/167787
- Kenyon et al. (2018) Kenyon, J. S., Smirnov, O. M., Grobler, T. L., & Perkins, S. J. 2018, 478, 2399, doi: 10.1093/mnras/sty1221
- Kleiner et al. (2021) Kleiner, D., Serra, P., Maccagni, F. M., et al. 2021, Astronomy & Astrophysics, 648, A32, doi: 10.1051/0004-6361/202039898
- Kleiner et al. (2023) —. 2023, Astronomy & Astrophysics, 675, A108, doi: 10.1051/0004-6361/202346461
- Knowles et al. (2022) Knowles, K., Cotton, W. D., Rudnick, L., et al. 2022, Astronomy & Astrophysics, 657, A56, doi: 10.1051/0004-6361/202141488
- Krumholz et al. (2009) Krumholz, M. R., McKee, C. F., & Tumlinson, J. 2009, 699, 850, doi: 10.1088/0004-637X/699/1/850
- Larson et al. (1980) Larson, R. B., Tinsley, B. M., & Caldwell, C. N. 1980, The Astrophysical Journal, 237, 692, doi: 10.1086/157917
- Lee et al. (2017) Lee, B., Chung, A., Tonnesen, S., et al. 2017, Monthly Notices of the Royal Astronomical Society, 466, 1382, doi: 10.1093/mnras/stw3162
- Leroy et al. (2008) Leroy, A. K., Walter, F., Brinks, E., et al. 2008, The Astronomical Journal, 136, 2782, doi: 10.1088/0004-6256/136/6/2782
- Loni et al. (2021) Loni, A., Serra, P., Kleiner, D., et al. 2021, Astronomy & Astrophysics, 648, A31, doi: 10.1051/0004-6361/202039803
- Makhathini (2018) Makhathini, S. 2018, PhD thesis, Rhodes University, South Africa
- McMullin (2007) McMullin, J.P.; Waters, B. S. D. Y. W. G. K. 2007, in Astronomical Data Analysis Software and Systems XVI, ed. F. H. Richard A. Shaw & D. J. Bell (ASP Conf. Series, 376), 127. http://aspbooks.org/custom/publications/paper/376-0127.html
- Merluzzi et al. (2013) Merluzzi, P., Busarello, G., Dopita, M. A., et al. 2013, Monthly Notices of the Royal Astronomical Society, 429, 1747, doi: 10.1093/mnras/sts466
- Mohan & Rafferty (2015) Mohan, N., & Rafferty, D. 2015, PyBDSF: Python Blob Detection and Source Finder, Astrophysics Source Code Library, record ascl:1502.007
- Molnár et al. (2022) Molnár, D. C., Serra, P., van der Hulst, T., et al. 2022, Astronomy & Astrophysics, 659, A94, doi: 10.1051/0004-6361/202142614
- Moore et al. (1999) Moore, B., Ghigna, S., Governato, F., et al. 1999, The Astrophysical Journal Letters, 524, L19, doi: 10.1086/312287
- Moretti et al. (2017) Moretti, A., Gullieuszik, M., Poggianti, B., et al. 2017, Astronomy & Astrophysics, Volume 599, id.A81, 11 pp., 599, doi: 10.1051/0004-6361/201630030
- Moretti et al. (2018) Moretti, A., Paladino, R., Poggianti, B. M., et al. 2018, Monthly Notices of the Royal Astronomical Society, 480, 2508, doi: 10.1093/mnras/sty2021
- Moretti et al. (2020a) —. 2020a, The Astrophysical Journal Letters, 897, L30, doi: 10.3847/2041-8213/ab9f3b
- Moretti et al. (2020b) —. 2020b, The Astrophysical Journal, 889, 9, doi: 10.3847/1538-4357/ab616a
- Moretti et al. (2022) Moretti, A., Radovich, M., Poggianti, B. M., et al. 2022, The Astrophysical Journal, 925, 4, doi: 10.3847/1538-4357/ac36c7
- Morokuma-Matsui et al. (2022) Morokuma-Matsui, K., Bekki, K., Wang, J., et al. 2022, The Astrophysical Journal Supplement Series, 263, 40, doi: 10.3847/1538-4365/ac983b
- Noordam & Smirnov (2010) Noordam, J. E., & Smirnov, O. M. 2010, Astronomy & Astrophysics, 524, A61, doi: 10.1051/0004-6361/201015013
- Nulsen (1982) Nulsen, P. E. J. 1982, Monthly Notices of the Royal Astronomical Society, 198, 1007, doi: 10.1093/mnras/198.4.1007
- Offringa & Smirnov (2017) Offringa, A. R., & Smirnov, O. 2017, 471, 301, doi: 10.1093/mnras/stx1547
- Offringa et al. (2012) Offringa, A. R., van de Gronde, J. J., & Roerdink, J. B. T. M. 2012, Astronomy & Astrophysics, 539, A95, doi: 10.1051/0004-6361/201118497
- Offringa et al. (2014) Offringa, A. R., McKinley, B., Hurley-Walker, N., et al. 2014, 444, 606, doi: 10.1093/mnras/stu1368
- Paccagnella et al. (2019) Paccagnella, A., Vulcani, B., Poggianti, B., et al. 2019, Monthly Notices of the Royal Astronomical Society, 482, doi: 10.1093/mnras/sty2728
- Paccagnella et al. (2016) Paccagnella, A., Vulcani, B., Poggianti, B. M., et al. 2016, The Astrophysical Journal Letters, Volume 816, Issue 2, article id. L25, 6 pp. (2016)., 816, doi: 10.3847/2041-8205/816/2/L25
- Paccagnella et al. (2017) —. 2017, The Astrophysical Journal, 838, 148, doi: 10.3847/1538-4357/aa64d7
- Peluso et al. (2022) Peluso, G., Vulcani, B., Poggianti, B. M., et al. 2022, The Astrophysical Journal, 927, 130, doi: 10.3847/1538-4357/ac4225
- Poggianti et al. (2016) Poggianti, B. M., Fasano, G., Omizzolo, A., et al. 2016, Astronomical Journal, 151, doi: 10.3847/0004-6256/151/3/78
- Poggianti et al. (2017a) Poggianti, B. M., Moretti, A., Gullieuszik, M., et al. 2017a, The Astrophysical Journal, 844, 48, doi: 10.3847/1538-4357/aa78ed
- Poggianti et al. (2017b) Poggianti, B. M., Jaffé, Y. L., Moretti, A., et al. 2017b, Nature, 548, 304, doi: 10.1038/nature23462
- Poggianti et al. (2019) Poggianti, B. M., Ignesti, A., Gitti, M., et al. 2019, The Astrophysical Journal, 887, 155, doi: 10.3847/1538-4357/ab5224
- Price-Whelan et al. (2018) Price-Whelan, A. M., Sipőcz, B. M., Günther, H. M., et al. 2018, The Astronomical Journal, 156, 123, doi: 10.3847/1538-3881/aabc4f
- Ramatsoku et al. (2019) Ramatsoku, M., Serra, P., Poggianti, B. M., et al. 2019, Monthly Notices of the Royal Astronomical Society, 487, 4580, doi: 10.1093/mnras/stz1609
- Ramatsoku et al. (2020) —. 2020, Astronomy & Astrophysics, 640, doi: 10.1051/0004-6361/202037759
- Rhee et al. (2017) Rhee, J., Smith, R., Choi, H., et al. 2017, The Astrophysical Journal, 843, 128, doi: 10.3847/1538-4357/aa6d6c
- Roberts & Parker (2020) Roberts, I. D., & Parker, L. C. 2020, Monthly Notices of the Royal Astronomical Society, 495, doi: 10.1093/mnras/staa1213
- Roberts et al. (2021) Roberts, I. D., van Weeren, R. J., McGee, S. L., et al. 2021, Astronomy & Astrophysics, 652, doi: 10.1051/0004-6361/202141118
- Robitaille et al. (2013) Robitaille, T. P., Tollerud, E. J., Greenfield, P., et al. 2013, Astronomy and Astrophysics, 558, doi: 10.1051/0004-6361/201322068
- Rowlands et al. (2015) Rowlands, K., Wild, V., Nesvadba, N., et al. 2015, Monthly Notices of the Royal Astronomical Society, 448, 258, doi: 10.1093/mnras/stu2714
- Saintonge et al. (2017) Saintonge, A., Catinella, B., Tacconi, L. J., et al. 2017, The Astrophysical Journal Supplement Series, 233, 22, doi: 10.3847/1538-4365/aa97e0
- Serra et al. (2015) Serra, P., Westmeier, T., Giese, N., et al. 2015, Monthly Notices of the Royal Astronomical Society, doi: 10.1093/mnras/stv079
- Serra et al. (2023) Serra, P., Maccagni, F. M., Kleiner, D., et al. 2023, Astronomy & Astrophysics, 673, A146, doi: 10.1051/0004-6361/202346071
- Solomon & Vanden Bout (2005) Solomon, P., & Vanden Bout, P. 2005, Annual Review of Astronomy and Astrophysics, 43, 677, doi: 10.1146/annurev.astro.43.051804.102221
- Sun et al. (2020) Sun, J., Leroy, A. K., Ostriker, E. C., et al. 2020, The Astrophysical Journal, 892, 148, doi: 10.3847/1538-4357/ab781c
- Sun et al. (2010) Sun, M., Donahue, M., Roediger, E., et al. 2010, The Astrophysical Journal, 708, 946, doi: 10.1088/0004-637X/708/2/946
- Villanueva et al. (2022) Villanueva, V., Bolatto, A. D., Vogel, S., et al. 2022, The Astrophysical Journal, 940, 176, doi: 10.3847/1538-4357/ac9d3c
- Vulcani et al. (2022) Vulcani, B., Poggianti, B. M., Smith, R., et al. 2022, The Astrophysical Journal, 927, 91, doi: 10.3847/1538-4357/ac4809
- Vulcani et al. (2018) Vulcani, B., Poggianti, B. M., Gullieuszik, M., et al. 2018, The Astrophysical Journal Letters, 866, L25, doi: 10.3847/2041-8213/aae68b
- Vulcani et al. (2020) Vulcani, B., Fritz, J., Poggianti, B. M., et al. 2020, The Astrophysical Journal, 892, 146, doi: 10.3847/1538-4357/ab7bdd
- Vulcani et al. (2023) Vulcani, B., Poggianti, B. M., Gullieuszik, M., et al. 2023, The Astrophysical Journal, 949, 73, doi: 10.3847/1538-4357/acc5e2
- Wang et al. (2020) Wang, J., Catinella, B., Saintonge, A., et al. 2020, The Astrophysical Journal, 890, 63, doi: 10.3847/1538-4357/ab68dd
- Watson & Koda (2017) Watson, L. C., & Koda, J. 2017, in Outskirts of Galaxies, ed. L. J. C. Knapen, J. H. & G. de Paz A. (Astrophysics and Space Science Proceedings), 175–207. http://arxiv.org/abs/1612.05275
- Watts et al. (2023) Watts, A. B., Cortese, L., Catinella, B., et al. 2023, Publications of the Astronomical Society of Australia, 40, e017, doi: 10.1017/pasa.2023.14
- Werle et al. (2022) Werle, A., Poggianti, B., Moretti, A., et al. 2022, The Astrophysical Journal, 930, 43, doi: 10.3847/1538-4357/ac5f06
- Westmeier et al. (2021) Westmeier, T., Kitaeff, S., Pallot, D., et al. 2021, 506, 3962, doi: 10.1093/mnras/stab1881
- Wong & Blitz (2002) Wong, T., & Blitz, L. 2002, The Astrophysical Journal, 569, 157, doi: 10.1086/339287
- Yoon et al. (2017) Yoon, H., Chung, A., Smith, R., & Jaffé, Y. L. 2017, The Astrophysical Journal, 838, 81, doi: 10.3847/1538-4357/aa6579
- Zabel et al. (2022) Zabel, N., Brown, T., Wilson, C. D., et al. 2022, The Astrophysical Journal, 933, 10, doi: 10.3847/1538-4357/ac6e68