11email: rbarrena@iac.es 22institutetext: Universidad de La Laguna, Departamento de Astrofísica, E-38206 La Laguna, Tenerife, Spain 33institutetext: Universitäts-Sternwarte München, Fakultät für Physik, Ludwig-Maximilian-Universität München, Scheinerstr. 1, D-81679 München, Germany 44institutetext: Max-Planck-Institut für extraterrestrische Physik, D-85748 Garching, Germany 55institutetext: Dipartimento di Fisica, Sapienza Università di Roma, Piazzale Aldo Moro 5, I-00185 Roma, Italy
RXCJ1111.6+4050 galaxy cluster: the observational evidence of a transitional fossil group
We present a detailed kinematical and dynamical study of the galaxy cluster RXCJ1111.6+4050 (RXCJ1111), at using 104 new spectroscopic redshifts of galaxies observed at the Telescopio Nazionale Galileo and SDSS DR16 public archive. Our analysis is performed in a multiwavelength context in order to study and compare mainly optical and X-ray properties using XMM-Newton data. We find that RXCJ1111 is a galaxy cluster showing a velocity distribution with clear deviations from Gaussianity, that we are able to explain by the presence of a substructure within the cluster. The two cluster components show velocity dispersions of km s-1 and km s-1, which yield dynamical masses of M200= M⊙ and M⊙ for the main system and substructure, respectively. The 2D spatial distribution of galaxies and X-ray surface brightness of RXCJ1111 presents an elongation in the North-South direction. These observational facts, together with a gradient of 250-350 km s-1 Mpc-1 in the velocity field, following the NNE-SSE direction, suggest that the merger axis between the main system and substructure is slightly tilted with respect to the line-of-sight. The substructure is characterized by a magnitude gap , so it fits the ”fossil-like” definition of a galaxy group. From the X-ray observations, we estimate a M M⊙, which is in good agreement with the dynamical masses when two galaxy components are considered separately. This suggests that the mass estimates obtained from X-ray and velocity dispersion are compatible even for non-relaxed clusters, at least when we are able to identify and separate galaxy clumps and derive masses by considering the virialized regions. We propose a 3D merging model and find that the fossil group is in an early phase of collision with the RXCJ1111 main cluster and placed at from line-of-sight. This merging model would explain the slight increase found in the TX with respect to what we would expect for relaxed clusters. Due to the presence of several brightest galaxies, after this collision, the substructure would presumably lose its fossil condition. Therefore, RXCJ1111 represents the observational evidence that the fossil stage of a system can be temporary and transitional.
Key Words.:
Galaxies: clusters: individual: RXCJ1111.6+4050. X-rays: galaxies: clusters1 Introduction
In recent decades, it has been well established that galaxy clusters are very dynamic structures in constant evolution that increase their mass in collision processes, either with low-mass systems or with massive clusters. Large mergers between high-mass clusters are among the most energetic events in the Universe. However, numerical simulations show that the accretion of small groups of galaxies is the main mechanism of evolution in clusters (e.g. Berrier et al. 2009; McGee et al. 2009). Today, much observational evidence supports this hypothesis, such as the optical detection of substructures in the galaxy member distribution, inhomogeneities in the gas distribution by the study of X-ray and radio diffuse emission, or even the presence of complex dark matter halos in weak lensing data (Feretti 2002; Martinet et al. 2016). In fact, studying mergers in low-mass systems is much more challenging than that in massive clusters. This requires hundreds of spectroscopic redshifts per cluster and X-ray observations with long exposures to obtain data with sufficient signal-to-noise from the weak diffuse emission.
The study of collisions involving small galaxy groups, and in particular the dynamical and kinematical properties, is a fundamental step in understanding the cluster evolution. One important question still unclear is to understand the nature of fossil groups (hereafter FGs) and how these peculiar structures are formed and evolve. Fossil systems (groups and galaxy clusters) are dominated by a single luminous elliptical galaxy, similar to brightest cluster galaxies (hereafter BCGs) or even to cD galaxies, at the centre of the extended X-ray emission. Today, there exist several scenarios to explain the evolutionary picture in which FGs became fossils in the early Universe. One proposes that FGs grow through minor mergers alone, only accreting a few galaxies at , leaving FGs enough time to merge galaxies in one very massive and luminous object (Ponman et al. 1994; D’Onghia et al. 2005). Another scenario proposes that FGs could be a transitional status for some systems. In this sense, fossil systems could become non-fossil ones in the end due to the accretion of nearby galaxy systems, or even FGs could be swallowed by other more massive systems (von Benda-Beckmann et al., 2008). An alternative evolutionary scenario suggests that FGs could be formed in the very early Universe but with a primordial deficiency of mid- and low-luminous galaxies (Mulchaey & Zabludoff, 1999).
RXCJ1111.6+4050 (hereafter RXCJ1111) was identified by G. O. Abell in 1958 and catalogued as Abell 1190 (Abell, 1958), a galaxy cluster with richness R=2. RXCJ1111 was also detected in the ROSAT All Sky Survey (NORAS; Böhringer et al. 2000) and designated as J1111.6+4050 as part of the MCXC catalogue (Piffaretti et al., 2011). And very recently, this cluster has also been observed using XMM-Newton X-ray satellite under the CHEX-MATE Heritage programme (Arnaud et al., 2021). In optical, this cluster was also detected in the SDSS-DR6 and SDSS-DR8 photometric samples as a galaxy overdensity using the redMaPPer algorithm (Wen et al. 2009, Rykoff et al. 2016). It has also been covered by the Pan-STARRS1 footprint and the Legacy Surveys DR9 images. In addition RXCJ1111 has been identified through its Sunyaev-Zeldovich (SZ) signal in the first and second Planck cluster catalogues and named as PSZ1 G172.64+65.29 (Planck 2013 results. XXIX, 2014) and PSZ2 G172.88+65.32 (Planck 2015 results. XXVII, 2016). The FIRST VLA Survey also covered this target region (Becker et al., 1995) in the 300 square degree initial observations.
In this work, we analyze the RXCJ1111 cluster of galaxies using optical, X-ray and radio data in order to disentangle the dynamical state and the main physical properties of this system which shows clear signs of substructure. Intra-cluster medium (ICM) and galaxy component react with different time scales to cluster evolution showing many observational effects at numerous spectral frequencies. Thus, multi-wavelength analysis of galaxy clusters is the ideal approach to investigate merging processes. Our main aim is to find a coherent dynamical scenario in agreement with the effects observed in different wavelengths. Only the combination of spectroscopic information, X-ray and radio observation will help us to obtain a satisfactory answer for questions such as, is this a merging cluster?, in that case, are we looking at pre- or a post-merger phase?, what kind of structures are involved?, are X-ray and dynamic mass estimate in good agreement?, … Here, we will explore the dynamics of RXCJ1111 with the aim of answering all these questions.
This paper is organized as follows. In Sect. 2 we describe the new spectroscopic observations as well as the X-ray data. We analyse the optical and galaxy properties of RXCJ1111 in Sect. 3 and 4, and compare them with X-ray properties in Sect. 5. In Sect. 6 we present the main dynamical features and propose a plausible 3D merging model for the cluster in Sect. 6.2. We conclude this paper summarising our results in Sect. 7.
In this paper, we assumed a flat cosmology with , and H km s-1 kpc-1. Under this cosmology, 1 arcmin corresponds to 87 kpc at the redshift of RXCJ1111 ().
2 Data sample
2.1 Optical spectroscopy
Despite RXCJ1111 having been observed in radio frequencies, X-ray and several broad-band photometric data, the spectroscopic information in the literature and databases is relatively poor. We selected 43 spectroscopic redshifts from the SDSS-DR16 database within a region of radius with respect to the centre of the cluster, which is too sparse a sample to investigate this low redshift cluster. Therefore, in June 2020 we carried out spectroscopic observations at the 3.5m Telescopio Nazionale Galileo (TNG) telescope at Roque de los Muchachos Observatory.
One of the most used techniques to obtain a large number of galaxy redshifts in a limited field is multi-object spectroscopic (MOS) observations. In June 2020, we carried out MOS observations of RXCJ1111 covering a region of about . We mapped this region with 5 MOS masks including 198 slitlets. The masks were designed in order to avoid overlaps with the SDSS redshift sample and maximise the number of new redshifts. We used the 3.5m TNG telescope and its spectrograph DOLORES. The instrumental set-up was used with the LR-B grism111See http://www.tng.iac.es/instruments/lrs and slits of width, which offers a dispersion of 2.75 Å per pixel between 370 and 800 nm of wavelength coverage. We acquire a single 1800 s exposure per mask.
The spectra were extracted using standard IRAF packages and calibrated in wavelength using Helium, Neon and Mercury lamps. The spectroscopic redshifts of galaxies were obtained by correlating the scientific spectra with those assumed to be templates (from Kennicutt Spectrophotometric Atlas of Galaxies; Kennicutt 1992) using the technique by Tonry & Davis (1979) and implemented as the task RVSAO.XCSAO in IRAF environment. This method detects and correlates the main features present in the acquired spectra (i.e. Ca H and K doublet, Hδ, G band, and MgI in absorption, and OII, OIII doublet, Hα and Hβ in emission) with that present in the template ones. We used five templates corresponding to different galaxy morphologies (Elliptical, Sa, Sb, Sc and Irr types). At the end of the process we obtained a radial velocity estimate and the corresponding correlation error for 109 galaxies in the field of RXCJ1111. We added to this sample 43 redshifts retrieved from SDSS-DR16 spectroscopic database. So, our spectroscopic sample (see table 4) includes 152 redshifts in a region of (see Fig. 1). The full redshift sample presents a median SNR of 7 and a median error in of 91 km s-1, respectively. We detected 37 star forming galaxies, characterized by the presence of OII, OIII and/or Hα emission lines with equivalent widths Å.
Twelve target galaxies were observed in two different masks. These double redshift measurements allow us to estimate realistic errors (including systematic ones) by comparing the two redshifts obtained with the XCSAO correlation procedure. We find that both redshift estimates are in agreement and their corresponding errors are similar. So, we confirm that XCSAO provides, in this case, not only statistical errors, but also realistic uncertainties.
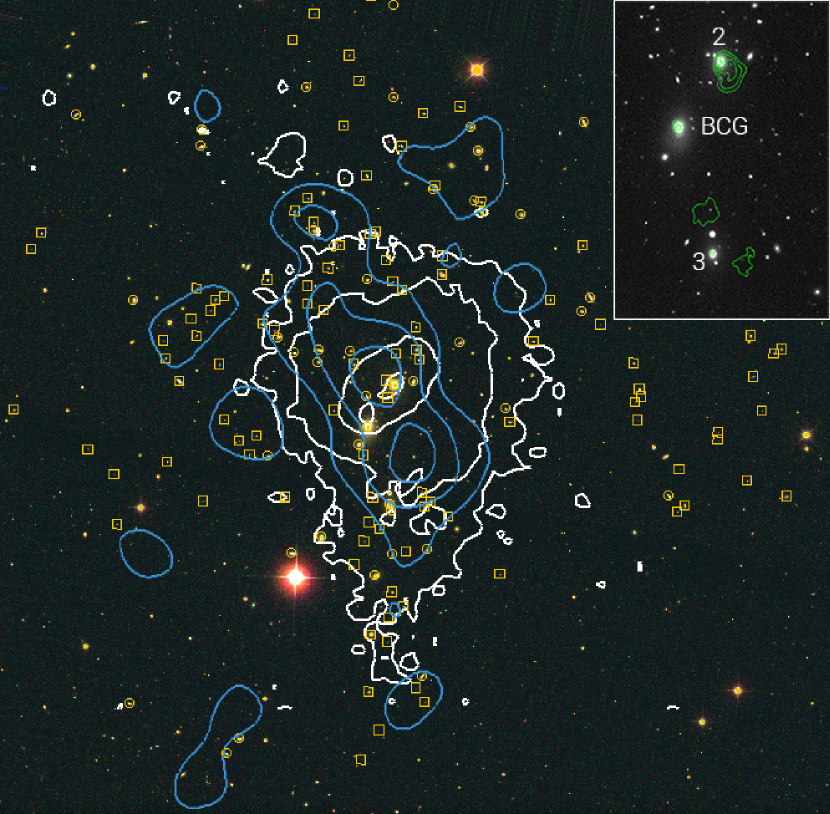
Table 4 lists the complete spectroscopic sample considered in this work (see also Fig. 1). Col. 1 lists an ID number (cluster members are marked), Cols. 2 and 3 show the J2000 equatorial coordinates of galaxies, Col. 4 the heliocentric radial velocity () with their corresponding errors (), and Cols. 5 and 6, the complementary and magnitudes, respectively. The last column includes some comments regarding particular features of some galaxies. Fig. 2 shows the velocity distribution of galaxies around the cluster main redshift.
2.2 Optical photometry
We also work with the SDSS DR16 photometric data in order to complement our spectroscopic MOS TNG observations. We consider the extinction-corrected magnitudes and , that assume the Schlegel et al. (1998) reddening maps, within a circular region of radius. The mean depth (at 90% completeness) of this photometric sample is , which is in agreement with SDSS DR12 estimates222see https://www.sdss.org/dr12/imaging/other_info/. Comparing the photometric and spectroscopic samples in that regions covered by the MOS masks, we find that the completeness of the spectroscopic sample is % for galaxies down to magnitude . However, this completeness increases up to % for galaxies with magnitude in an inner region of arcmin radius from the center of the cluster. The quality of the spectra allows us to obtain redshifts even for some faint galaxies with .

2.3 X-ray data
The XMM-Newton observation, with ID 0827031101, of the RXCJ1111 galaxy cluster, were obtained from the XMM-Newton data archive. This target was observed as part of the CHEX-MATE Cluster Heritage project (PIs: M. Arnaud and S. Ettori; A&A 650, A104). We used SAS v20.0 to perform the X-ray imaging and spectroscopic data reduction closely following the scheme described in Chon & Böhringer (2015). After cleaning the data from times of X-ray flares, the usable exposure amounts to 34 ks for both MOS instruments and to 26 ks for pn.
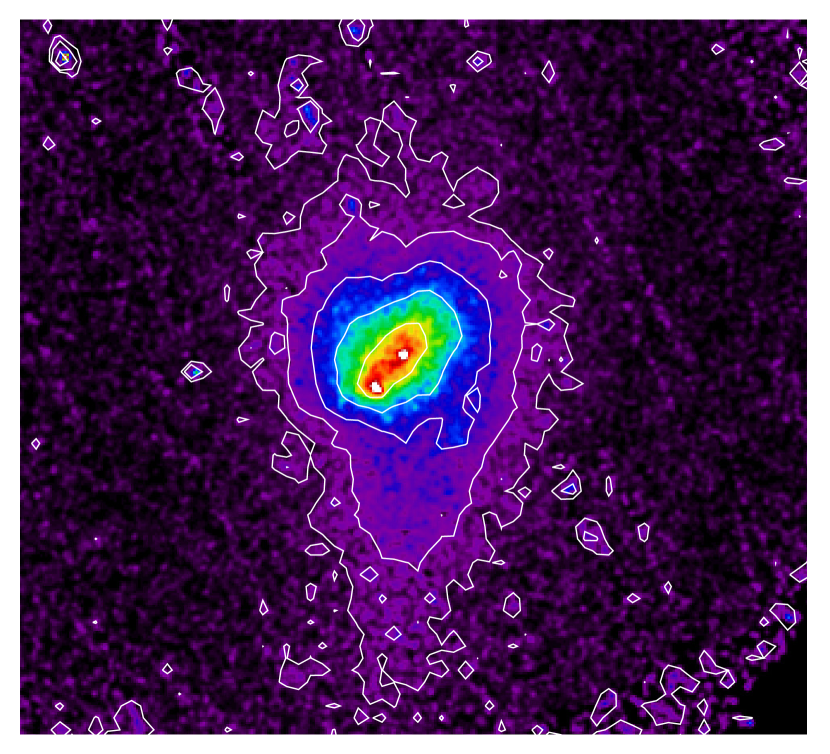
We removed point sources and the background-subtracted and exposure-corrected images from all three detectors were combined in the 0.5 to 2 keV band, which is shown in Fig. 3. RXCJ1111 has on intermediate scales a round appearance, but it shows a bright extension to the south and seems to be embedded in a larger north-south filament with a length of about 1.8 Mpc as far as it can be traced in X-rays. The centre is disturbed with a bar-like feature oriented in northwest-southeast direction with two small X-ray peaks inside.
For the spectral analysis, the contribution from the particle background was removed by rescaling the filter wheel closed (FWC) spectrum to the spectrum of the corner events of the observation. We considered three X-ray background components representing the unresolved point sources, the Local Hot Bubble and a cool absorbed thermal model when fitting an APEC cluster model to the spectroscopic data in XSPEC.
3 The RXCJ1111 optical properties
3.1 Member selection and global properties
In order to analyse the internal dynamics of RXCJ1111, it is essential to carry out a good selection of member galaxies. For this purpose, one of the most suitable methods is the one that uses the velocity ”caustics”, which is related to the escape velocity from the cluster (Diaferio et al. 2005; Lemze et al. 2009) allowing to separate cluster members from foreground and background galaxies. However, this method works well with large spectroscopic samples, typically with more than 300 redshifts, and we do not find reliable results applying this procedure to our sample. Thus, we use a similar but more simple technique, based on the galaxy position in the projected (, ) space, where is the projected cluster-centric distance and is the galaxy line-of-sight (LOS) velocity (see Fig. 4, top panel). We apply an iterative 2.7 clipping in the coordinate, considering a radial profile of the expected velocity dispersion (Mamon et al., 2010). So, we first find the mean velocity and estimate initial velocity dispersion using the estimator. In successive steps we obtain stable and converging values of and . This method yields a selection of 104 cluster members, 3 and 45 foreground and background galaxies, respectively. Fig. 2 shows the redshift distribution of the galaxies in the range listed in table 4.
The selection of 104 galaxy members shows a mean velocity km s-1 () and a of km s-1 (errors at 95% c.l.) in the cluster rest frame. In order to estimate a robust velocity dispersion, , we use the bi-weight scale estimator (Beers et al., 1990), which is a procedure that offers satisfactory results for samples showing possible inhomogeneities. Applying this method to the 104 redshifts we obtain km s-1. This result is in contrast with that obtained by Lopes et al. (2018), who report a km s-1 using the bi-weight estimator. In our case, both and bi-weight estimations are in agreement within errors. However, in order to check the stability of and discard possible deviations from the mean along the cluster, we study the variation of this magnitude with the distance to the cluster center (assumed as BCG position).
Fig. 4, bottom panel, shows that the integral profile is almost completely flat for the whole cluster. This fact suggests that estimations of the are stable and robust even for radii as small as Mpc, which reveals that there are no obvious inhomogeneities in the velocity field (Girardi et al., 1996). This fact is also supported by the agreement between values obtained using the and bi-weight estimators, as we see in the previous paragraph. However, in the following analyses we assume as more reliable value that km s-1, obtained using the bi-weight estimator given the robustness of this method in cases where the statistics clearly departs from the Gaussian distribution. The constancy of variations in the velocity distribution, in particular it rules out a dependence of the mean velocity with the cluster-centric distance (see Fig. 4, middle panel). We only notice a mild increase by about 650 km s-1 for radius Mpc region. This fact may suggest that the dynamics of the cluster could be disturbed in its central region. We will analyze this fact in detail in following sections.

The BCG of RXCJ1111 (the ID 83) presents a velocity of 234285 km s-1 (according to the SDSS spectroscopic database), which is almost 800 km s-1 higher with respect to the mean velocity of the cluster. Lopes et al. (2018) obtained a similar offset, 704 km s-1. In addition to BCG, which shows a magnitude , we identify two further bright galaxies more (IDs 60 and 67, with magnitudes and 15.21), that we label as BCG2 and BCG3, respectively. These two galaxies are located at 1′.30 and 2′.25 toward the north and south of BCG, respectively, configuring almost an alignment in the North-South direction. The X-ray surface brightness shows a double peak inside a SE-NW elongated inner region, and the BCG2 position coincides completely with the NW maximum of this double peaked emission (see Fig. 1 and Fig. 8 left panel). On the other hand, the main BCG is shifted about 20 arcsec with respect to the SE X-ray peak, while BCG3 is placed to the south, where the X-ray profile shows an elongation in the external part. Therefore, the BCGs configuration is somehow linked to the X-ray diffuse emission of the cluster. This means that galaxies and the hot gas of the intra-cluster medium are interacting in some way. We analyse this interaction in sections 4.2 and 6.
We also detect 37 galaxies showing [OII] emission lines, labeled in table 4 as ELG (Emission Line Galaxy). The spectral resolution and SNR of our data allow us to detect [OII] emission lines with equivalent width ¿8 Å. 10 out of 37 ELG galaxies are cluster members, 2 are placedkey in the cluster foreground (with v km s-1), while the rest (25 galaxies) are in the background (showing v km s-1). So, the ELG members represent the 9.6% of the cluster members in our sample. This is a typical fraction of ELGs in a cluster environment, which indicates that star-forming processes have been quenched in RXCJ1111, as expected in high galaxy density environments and ICM showing high TX (Laganá et al., 2008).
3.2 Velocity field
In general, any departure of the global velocity distribution along the LOS from a Gaussian is a reliable indicator that reveals the systems are dynamically disturbed or the presence of substructure (Ribeiro et al. 2011; de Carvalho et al. 2017). We measure skewness and kurtosis in order to investigate the shape of the velocity distribution of RXCJ1111. The skewness is related with the asymmetry of the velocity distribution, while the kurtosis indicates distributions presenting thinner/fatter tails. In our case, RXCJ1111 presents a velocity distribution which shows a skewness and kurtosis of and , respectively. Accordingly with our sample, we perform a Markov chain Monte Carlo (MCMC) method with 10000 simulations assuming a Gaussian profile with an average centre equal to zero and a standard deviation equal to one, sampled with 104 points. Errors were computed from the standard deviation of the values obtained. The positive skewness suggests that the velocity distribution is skewed to the right, while the kurtosis is almost compatible with zero. So, the global velocity distribution of RXCJ1111 is slightly asymmetric, with a skewness difference from zero. That is, the velocity distribution shows a small asymmetry relative to the normal Gaussian shape. This suggests that RXCJ1111 presents a dynamically disturbed state, probably dominated by two or more interacting substructures (see following sections).
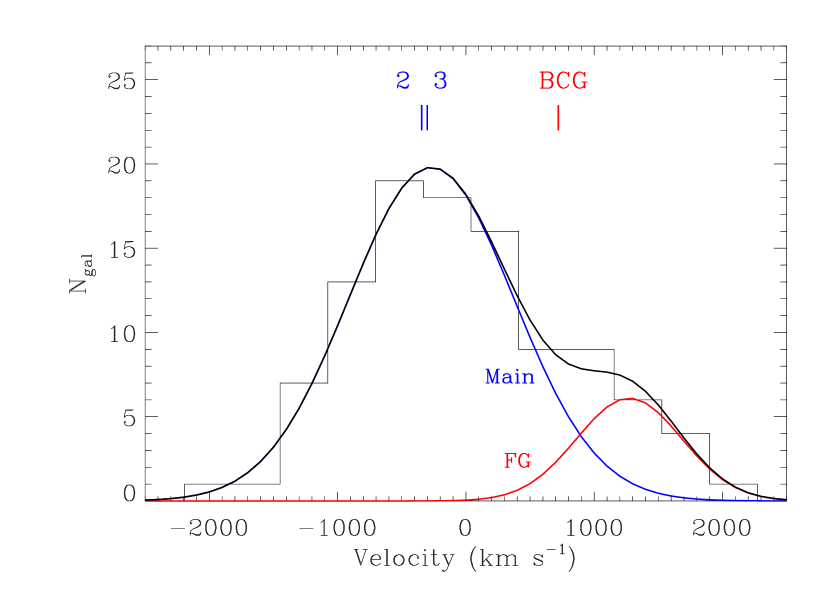
The skewness obtained for the velocity distribution of RXCJ1111 support the hypothesis that the cluster may be composed of two galaxy clumps, each of them showing its Gaussian velocity distribution and both contributing to introduce distortions in the global velocity distribution. With this idea in mind, we fit two Gaussian profiles to the global velocity distribution. The result is shown in Fig. 5. Table 1 lists the main parameters obtained for this two-component fit. The best fit corresponds to two substructures with a difference in mean velocity of km s-1, one of them at km s-1 with respect to the main velocity of RXCJ1111 with a km s-1, which would constitute the ”main system”. Additionally, we find a secondary substructure at km s-1 with respect to the cluster main velocity, with a km s-1, that we label as ”FG”333We justify the name of this label in Sect. 4.1. As it is shown in Fig. 5, BCG presents a velocity offset of about km s-1 with respect to the main system, while only km s-1 with respect to the secondary substructure. On the other hand, BCG2 and BCG3 are almost centred on the main system velocity distribution, showing only a velocity offset of about km s-1. Briefly, the velocity field of RXCJ1111 is consistent with a double cluster, where the secondary substructure contains a very bright galaxy, BCG. On the other hand, BCG2 and BCG3 are part of the most populated component, the main body of the cluster. The membership relations between BCGs and the different substructures will be discussed in detail in Sect. 4.
3.3 2D galaxy distribution
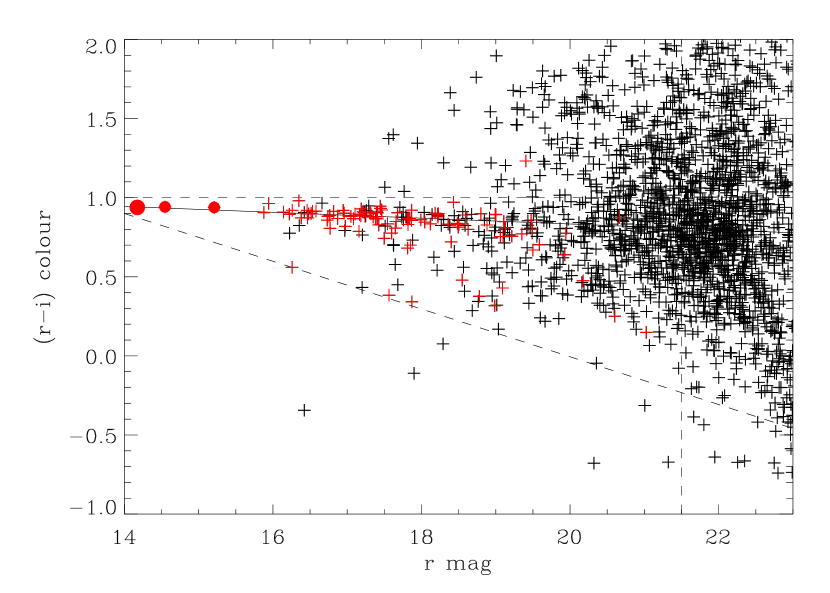
Spectroscopic samples suffer, in practice, from magnitude incompleteness. So, in order to get information of the galaxy distribution of the whole cluster, we adopt the photometric SDSS DR16 catalogues. Using the and magnitudes, we construct the ( vs ) colour-magnitude diagram (CMD) and we select likely members from the red sequence (RS) (see Fig. 6) and ”blue cloud” (Gavazzi et al., 2010) following the technique detailed in Barrena et al. (2012). The RS fitted follows the expression and we select both likely early-type and late-type galaxy members, residing in the RS and blue-cloud (below the RS), respectively. This locus is defined by as magnitude completeness, the RS as upper limit, and as lower limit in colour, respectively. This selection yields 926 likely members.
We use the likely members in order to explore the galaxy distribution. With this aim in mind, we construct the contour levels of the isodensity galaxy distribution of the RXCJ111 likely member shown in Fig. 1 (blue contours). This map has been obtained by computing the cumulative contribution of 926 small Gaussian profiles (with arcsec width) positioned on each individual members over a grid of points. The contour map obtained reveals a double peak distribution clearly elongated in the NNE-SSW direction, which is oriented (see Sect. 3.4) with respect to the North-South direction. The most significant peak is very close to BCG2. It is important to note that both BCG2 and BCG3 galaxies are surrounded by many members and likely members, while BCG is placed in a region where the galaxy distribution is not so high. We remark that RXCJ1111 presents a galaxy distribution and X-ray surface brightness profile almost coincident and following similar elongation and orientation. We will discuss this in detail in Sect. 6.1.
3.4 Spatial-velocity correlations
In the past, many techniques have been developed to study the existence of substructures in clusters. One of the most successful procedures is the combined study of positions and velocities of galaxy members. The presence of different sub-clusters modifies the velocity field of galaxies, thus, by analyzing the space-velocity correlations, we can explore the internal kinematics of galaxy clusters.
In a first step, and given the evidence of bimodality exposed in Sect. 3.3, we divide the galaxy members in two subsamples. The interaction between two substructures could induce inhomogeneities in the velocity distribution. Therefore, we look for significant gaps in the velocity histogram of RXCJ1111, which separates the galactic population of the two clumps. The most significant gap is detected around 600 km s-1 (see Fig. 5). The existence of two substructures with v km s-1 and v km s-1 is supported by the fact that BCG2 and BCG3 would be associated to the low-velocity clump, while BCG would be the brightest galaxy of the high-velocity one. We analysed the spatial distribution of these two galaxy samples and found no evidence of spatial bimodality. This study suggests that the two galactic populations are intermingled at least in projection. However, the results found in Sect. 3.2 and the two Gaussian fit shown in Fig. 5 strongly support the existence of two interacting substructures.
We perform a second test to check the existence of possible spatial-velocity segregation. We combine galaxy positions and velocities by applying the classical -statistics Dressler & Schectman (DS) test (Dressler & Schectman, 1988), which identifies substructure searching for subsystems whose mean velocities and/or dispersion deviate from the global cluster values. After running this procedure using 1000 Monte Carlo simulations, we do not find any converging result. Fig. 7 shows the -statistics test over a central region of size, which includes 78 cluster members. The outer regions are not considered in this test because they are not well enough sampled, and a lack of spatial sampling may introduce a biased result. We find a mean deviation of , with a -value statistics of 0.15, which is very low and means that there is not significant deviations. Thus, substructures are not spatially segregated significantly, and both galaxy populations are spatially mixed in the plane of the sky. However, note that galaxies in the south part of the cluster present higher respect the mean, while the northern area shows systematically lower deviations. Thus this test reveals an evidence of a clear velocity gradient in the North-South direction.
In order to analyze the velocity gradient we fit a plane in the space-velocity frame. In a first step, we consider the full cluster member sample, obtaining the expression =9.77x-26.91y+43.6, where ”x” and ”y” are positions (following R.A. and Dec. coordinates, in arcmin respect to BCG; positive values correspond to the north and west directions), which shows a gradient of 325() km s-1 Mpc-1 in a angle (counterclockwise, from West to the North; takes positive values toward the south). In a second step, similarly, we only take into account the 78 cluster members inside the region of well sampled, and we find =8.11x-20.54y+61.3, which presents a gradient of 254() km s-1 Mpc-1 in a angle. Therefore, velocity gradients are consistent in both cluster member samples, and this analysis confirms a slight increase of radial velocities toward the south part of the cluster and following the NNE-SSW direction.
Fig. 7 also shows the orientations of the 2D spatial galaxy distribution of likely members and the X-ray surface brightness. We fit ellipses to the blue and white contours shown in Fig. 1, between and from BCG to avoid the inner regions where we detect double peak profiles. This study reveals that galaxy distribution isocontours present a mean orientation444The West-East orientation corresponds to while point to North-South line. of (see magenta line in Fig. 7), while X-ray contours are oriented (green line in Fig. 7). Therefore, the velocity gradient, the likely member distribution and the X-ray surface brightness are all oriented within angles, so the cluster shows a clear elongation in the NNE-SSW direction, produced by the overlapping galaxy populations showing slightly different velocity distributions. This finding support the fact that the cluster contains two galaxy clumps, one main body toward the north and a second substructure almost aligned in the line-of-sight, but slightly shifted toward the south.
We try to associate individual galaxies to each substructure using 3D version of the Kaye’s (KMM) Mixture Model algorithm (Ashman et al., 1994). This procedure separates the different components in velocity space, providing a probability that a given galaxy belongs to an individual component. The KMM algorithm needs a starting input configuration, so we provide two input lists. First, a list of galaxies associated with the southern cluster region. That is, the galaxies marked with red squares in Fig. 7, which correspond to galaxies showing slightly higher in the DS-test. Second, a list of galaxies with v km s-1 with respect to the mean velocity of the cluster. Our findings, running the KMM procedure on this two galaxy lists are not conclusive, and after running this algorithm iteratively we do not find a reliable result. The -value to obtain this KMM result by chance is always higher than 0.23 (23% probability). KMM procedure and DS-test are in agreement: none significant spatial segregation is detected for the main and secondary substructure. So, both galaxy populations are mixed in the plane of the sky. Thus, both populations seem to be almost completely aligned in the LOS.
4 The BCG membership and substructure
The three brightest galaxies of RXCJ1111 are also aligned in the North-South direction. However, the analysis of their radial velocities reveals that these three galaxies are not part of a single mass halo. They follow very different kinematics. BCG2 and BCG3 are well centred on the velocity distribution of the main body of the cluster, while BCG presents a velocity offset of about km s-1. In contrast, BCG shows a velocity offset of about km s-1 with respect to the secondary substructure. So, from the dynamical point of view, BCG seems to be linked to the secondary substructure. This evidence is supported by the KMM analysis performed in the previous section. In every KMM run, using different input configurations, we find that KMM always estimate a probability that BCG belongs to a secondary substructure, while for BCG2 and BCG3 we obtain a likelihood for these two galaxies are part of main body of RXCJ1111.
By studying a sample of 72 galaxy clusters showing SZ and X-ray emissions, L18 (see figure 6 therein) found that only a negligible fraction (%) of clusters may contain a BCG showing velocity offset as high as 1000 km s-1 with respect to the main cluster velocity. Even for disturbed galaxy systems, this fraction is lower than %. In agreement with this result, Lauer et al. (2014), on a sample of 178 clusters, also find that systems containing BCGs with peculiar velocities km s-1 represent only a 2% fraction (4 over 178), while the mean velocity offset of BCGs is about 150 km s-1 for clusters showing a velocity dispersion km s-1. However, the velocity offset observed in the BCG with respect to the secondary substructure of RXCJ1111, is quite high, km s-1, which suggests that this galaxy is greatly affected by other gravitational effects. One possibility is that BCG could be suffering interaction with another mass halo, such as the BCG2 halo. In this way, BCG and BCG2 could be orbiting each other, which is supported by the presence of a bar-like structure observed in X ray inner region.
To summarise, given the velocity offset observed in BCG of RXCJ111, the most likely scenario would be that BCG belongs to the secondary substructure. However, the substructure seems to be starting to interact with the main body of the cluster. On the other hand an interaction between BCG and BCG2 haloes may explain the velocity offset observed in BCG with respect its galaxy clump, the secondary substructure.
4.1 The likely fossil substructure
According to Jones et al. (2003) and Dariush et al. (2010), a galaxy system is considered fossil when it shows a magnitude gap between the most and the second brightest galaxy members greater than two, , within . This magnitude gap arises naturally in undisturbed systems which have avoided infall into clusters, but where galaxy merging of the most luminous galaxies produces a extremly bright galaxy that dominates the core of the system. However, the precise value () of the threshold in is quite arbitrary. The chance to find a value of in a typical Schechter function is very small. For instance, Zarattini et al. (2014) checked this definition using spectroscopic information and only confirm five fossil groups showing in a sample of 34 systems previously identified as fossil systems by Santos et al. (2007) using photometric samples. Anyway, despite the arbitrary definition of a fossil group, the observable is highly correlated with the evolutionary state of the system. This is confirmed by Zarattini et al. (2021). They find that radial orbits of galaxies as the cause of an increasing in groups. While relaxed systems show a large population of early-type galaxies with radial orbits (see Biviano & Katgert 2003; Biviano & Mamon 2023), except in the central regions, where dissipative friction may affect the dynamics of the brightest galaxies, clusters with smaller magnitude gap, showing more disturbed dynamical state and substructures, present more isotropic orbits. In other words, fossil systems are very relaxed structures, and this relaxation state is reflected in a large .
In the case of RXCJ1111 and accordingly to the membership distribution discussed in Sect. 4, BCG is part of the secondary substructure, while BCG2 is the brightest galaxy of the main body of the cluster. Consequently, the of the main body is estimated as . On the other hand, in agreement with the velocity distribution, the fourth brightest galaxy, the ID 76, which shows a radial velocity of 219685 km s-1, would be part of the main body, because it shows a velocity difference of km s-1 with respect to the main velocity of the secondary substructure. So, the of the secondary substructure could be only estimated with respect to the fifth brightest galaxy, the ID 103, which shows a similar velocity to BCG one. In this way, can only be estimated as a minimum value, because there is a not negligible possibility that the ID 103 galaxy is part of the main body of RXCJ111. Therefore, in the secondary substructure.
From this analysis we can conclude that the secondary substructure is a fossil group, or at least an almost fossil system (), which is now interacting with a more massive structure, the main body of the cluster. In Sect. 6, we will discuss the dynamics of this system. We will estimate the intervening dynamical masses and discuss a possible merging scenario.
4.2 The interplay between BCGs and ICM
Cluster mergers are characterized by the presence of disturbed ICMs, but galaxies and ICM interact at different time-scales, each one revealing different dynamical properties. The hot gas component of the interacting systems often shows the presence of discontinuities in surface brightness and temperature that may not correlate with the most massive galaxies. Fig. 8, left panel, shows the SDSS r-band image of the cluster core of RXCJ1111. Superimposed to this image are the innermost X-ray contours around BCG and BCG2. This inner contours show an elongated profile in the SE-NW direction, showing a double peak X-ray emission (marked with crosses in that figure), that connects BCG2 and BCG. However, it is important to remark that, while the NW peak of the X-ray is the main one and perfectly coincide with BCG2 centre, the SE X-ray peak is substantially shifted with respect to BCG position. This kind of missmatching between BCG positions and X-ray peaks is typically observed in cluster mergers (see i.e. Lopes et al. 2018). A clear and extreme case is seen most vividly in the case of the Bullet Cluster (Barrena et al. 2002, Clowe et al. 2004), where the gas has been separated from the galaxies during the core passage. A similar scenario can be taking place in RXCJ1111. The hot gas associated to the secondary structure, which is more concentrated around BCG, has been shifted away, probably by ram pressure-stripping. In this way, the innermost hot gas of the secondary structure is starting to interact with the main body of RXCJ1111, producing a small displacement of the gas toward the outer regions of BCG. We do not detect any evidence of the presence of shocks and cold fronts in the X-ray images, which could be an indication that the merger takes place close to the line-of-sight (see Sect. 6.1).
4.2.1 The BCGs radio emission
An interesting phenomenon observed in cluster merging processes is the presence of strong diffuse radio emission, forming extended halos and radio relics. So, with the aim of studying the radio emission in RXCJ1111, we inspect the public radio data archive. One of the few images available for this cluster is that obtained as part of the the VLA FIRST (Faint Images in the Radio Sky at Twenty-cm) survey (Becker et al., 1995) in the frequency 1.4 GHz, with a exposure time of 180 sec and using a beam size of 5.4 arcsec.
The contour levels of the VLA radio image are shown in Fig. 1, upper right corner, which only reveals radio emission from the three brightest galaxies. The same three radio sources were reported in Owen et al. (1993) and Owen & Ledlow (1997), where no trace of diffuse emission was detected from a cluster halo. The emission observed corresponds to classical radio galaxies with lobes created by jets filled with relativistic plasma (Begelman et al., 1984). BCG presents a very weak central emission, while that from BCG2 and BCG3 is more extended. The emission corresponding to the BCG2 resembles a classical head and tail source. That is, we see central emission and lobes dragged to the south-west. On the other hand, the BCG3 presents lobes that are still on both sides of the galaxy, but are not strictly aligned with the galaxy centre. This fact suggests that BCG3 is moving with respect to its surrounding medium.
The fact that no diffuse and extended emission has been detected implies that the energy contribution of potential relativistic electrons in the ICM is not large enough to be detected. In consequence, we may infer that the merging process is still in a very early phase. However, more deep radio observations would be necessary in order to completely confirm this hypothesis.
[t] Structure Ngal M200 M500 r200 (km s-1) (km s-1) ( M⊙) ( M⊙) (Mpc) Global 104 Main FG
-
•
Note: Ngal of the main system and FG subcluster have to be taken as guide values. Galaxies with and km s-1 are assumed to belong to the main clump and FG substructure, respectively. The masses are dynamical ones.
4.2.2 BCG photometric structure
We performed a two-dimensional photometric decomposition of BCG using the GAlaxy Surface Photometry 2 Dimensional algorithm (GASP2D, Méndez-Abreu et al., 2008, 2014). To this aim, we used the SDSS r-band image. We modelled the surface brightness distribution of the galaxy assuming both a single Sérsic (Sersic, 1968) and a Sérsic+Exponential distributions. GASP2D returns the best-fitting values of the structural parameters of each morphological component by minimizing the after weighting the surface brightness of the image pixels according to the variance of the total observed photon counts due to the contribution of both galaxy and sky (see also Méndez-Abreu et al., 2017). We obtained a best fit in terms of the when using the Sérsic+Exponential model. In principle, this would allow us to fit the low surface-brightness and extended component that BCGs could present (e.g., Nelson et al., 2002; Méndez-Abreu et al., 2012). However, according to the Bayesian Information Criterion (BIC, Schwarz, 1978) we found that adding an extra component to the Sérsic fit did not statistically improve our results.
The right panel of Fig. 8 shows the residuals after subtracting our best Sérsic model to the original SDSS r-band image. One can clearly see the presence of two non-axysimmetric structures. The first one is surrounding the galaxy core and the second one, more extended, resemble the presence of a tidal tail towards the southern region of the galaxy. It is worth noticing that both non-axysimmetric structures likely share the same north-south direction and they were also present when modelling the surface brightness with a Sérsic+Exponential model.
We argue that the residuals observed in BCG of RXCJ1111 are likely due to the merger with one or two galaxies. The presence of double nucleii due to the merger of galaxies is common fact that can be studied using photometric (Komossa et al., 2003; Benítez et al., 2013) and spectroscopic (Patton et al., 2016) methods. Our model generated by GASP2D does not reveal signs of a double nucleus in BCG core. However, the excess of light (over the Sérsic model) right to the south of the galaxy center resembles what would be the final stages of a merger with a relatively massive and concentrated companion (Hendel & Johnston, 2015). The outer non-axysimmetric structure has a different apparent shape in its northern and southern part with respect to the galaxy center. The former resembles the typical shells formed during a minor merger with a relatively gas-poor companion (Mancillas et al., 2019). The southern part shows a tidal tail shape, which could also have been created by a minor merger, but on a less radial orbit with respect to the shells. In summary, even if the details of the past mergers suffered by BCG are difficult to unveil using only the available images, it is clear that BCG shows several signs of recent and past interactions with other galaxies. The structures described in this section cannot be produced due to interactions with the ICM, fast encounters with other cluster galaxies (harassment), nor are the result of a merger with another bright galaxy. Therefore, within the context described in this paper of the BCG being the central galaxy of a transitional FG, we suggest that it is the result of several galaxy mergers that might be leading to observed the system as a FG.
5 X-ray properties
We extracted X-ray surface brightness profiles after the subtraction of the X-ray sky and instrumental background. For RXCJ1111 we determined one surface brightness profile for the entire cluster assuming approximate spherical symmetry. We fitted the profiles with - and double -models. We found that single -models provide a good fit to the outer parts of the profiles, from which we determined the gas density and gas mass profiles. Only for the southern part of RXCJ1111 the double -model provides an interesting alternative. The fit parameters for the profiles are given in Table 2. M500 is the mass inside , Mgas is the gas mass inside the same radius. We do not detect any evidence of the presence of shocks and cold fronts in the X-ray images, which could be taken as an indication of an advanced merger stage. But we show below that the merger occurs probably close to the line-of-sight and in this case it is extremely difficult to see the signatures of shocks and to draw conclusions from the present data. is the gas mass fraction of the total mass, is the radius projected in the sky, LX is total X-ray luminosity, ML is the mass estimated from the LM relation, TX the measured X-ray temperature for the cluster region inside , the core radius, and the slope parameter of the electron density profile.
The temperature of the ICM was also determined from the analysis of the background-subtracted X-ray spectrum. We determined the temperature in nine concentric radial bins for the cluster RXCJ1111. The bins were constructed with a minimum number of 2000 photons per bin. The resulting temperature profile is shown in Fig 9. The sudden temperature drop of the fitted profile at the centre is an artifact caused by the peculiar location of the innermost data points and is certainly not real and ignored in the following analysis. The outer temperature profile of RXCJ1111 can be approximated by a polytropic model with a parameter of . We also use the fitting formula of Vikhlinin et al. (2006) to approximate the temperature profile. In this formula we drop the part which describes the central temperature decrease which is an effect of a cool-core, which is not relevant for RXCJ1111. The equation applied has thus the form.
| (1) |
In addition, we determined temperatures from spectra extracted over the entire region inside and with results provided in Table 3. In Col. 1, A and B regions correspond to and circles, respectively, while AX and BX are annuli where the central region (Core), inside r=0.15, was cut out. ”Z” is the Fe abundance (in solar units with abundances from Asplund et al. 2009), ”Norm” is the APEC (Astrophysical Plasma Emission Code; Smith et al. 2001) normalisation, and fX and LX are the flux and luminosity in the [0.5–2.0] keV band, respectively.
| Single beta model | |
| M500 M⊙) | |
| Mgas M⊙) | 1.97 |
| fgas | 11.3% |
| r500 (arcmin) | 9.07 |
| LX ( erg s-1) | 0.5 |
| M M⊙) | 2.5 |
| TX (keV) | |
| (cm-3) | 3.6 |
| rc | 1.77 |
| 0.673 |
| Reg. | TX | Z | Norm | fX () | LX () |
|---|---|---|---|---|---|
| (keV) | ) | (erg/s/cm2) | (erg/s) | ||
| A | 3.635 | 0.291 | 6.43 | 3.3 | 5.02 |
| AX | 3.323 | 0.227 | 4.59 | 2.26 | 3.45 |
| B | 3.74 | 0.305 | 6.25 | 3.16 | 4.81 |
| BX | 3.360 | 0.224 | 4.05 | 1.99 | 3.03 |
| Core | 4.489 | 0.443 | 2.14 | 1.11 | 1.68 |
Based on the density and temperature profile, we determined the gas mass and total mass profile, assuming hydrostatic equilibrium for the derivation of the latter. We find a cluster mass inside for RXCJ1111 of M M⊙. The results based on the temperature profile given by Eq. 1 and by the polytropic model agree within the error bars. Mass and gas mass profiles determined from the best fit for RXCJ1111 are shown in Fig. 10. For the X-ray luminosity of the cluster in the 0.5 to 2 keV energy band, we obtain a value of erg s-1. Based on the mass-luminosity relation proposed by Pratt et al. (2009), we expect for this value a cluster mass of about M M⊙. For the mean temperature derived for the entire cluster inside of 3.6 keV we would expect a cluster mass of about M M⊙ (e.g. M-T relation of Arnaud et al. 2005). The mass implied by the temperature and X-ray luminosity of the intra-cluster medium for the case of a more relaxed cluster is therefore higher than the mass determined from the detailed X-ray analysis. This discrepancy can, for example, be explained by the merger state of the cluster.
6 Dynamics of RXCJ1111
As it has been argued in previous sections, we can conclude that RXCJ1111 is formed by one main body and one likely fossil substructure, almost completely aligned in the LOS. Their galactic population are superimposed in the plane of the sky, but from the velocity analysis we can affirm that the brightest galaxy, BCG, can only be part of the secondary substructure, while BCG2 and BCG3 belong the main body. The X-ray surface brightness map suggests that they are starting to interact. In this section we estimate the dynamical masses and virial radii in order to characterize this complex.
RXCJ1111 shows a velocity distribution (see Fig. 5) that allows us to distinguish between the two galaxy clumps. On the other hand, we detect a 30% discrepancy in the mass estimates derived from the temperature profile and the M-T relation (see previous section), which could be due to a X-ray temperature increase. Taking into account these two facts, is reasonable to assume that the fossil substructure has not yet completely merged into the cluster and both galaxy haloes still keep a roughly dynamical equilibrium. That is, velocity distribution of galaxies are not so disturbed, but the gas temperature starts to increase. In this scenario, it is possible to estimate virial dynamical masses and radii, and compute the mass of the whole cluster as the sum of the individual masses. Table 1 lists the main properties of RXCJ1111 and summarises the main velocities and dispersions detailed in Sect. 3.2.
Galaxies are embedded in the gravitational potential of the cluster, thus their velocities can be used to estimate the dynamical mass of galaxy clumps. In this way, we use the velocity dispersion, , and its relation with the virial mass, M200, to estimate the dynamical mass of the components of RXCJ1111. One of the most common ways to determine dynamical masses of clusters from their velocity dispersion is using scaling relations. In the literature, there are many examples offering M200 relations555Notice that dynamical masses derived from velocity dispersion always present high errors due to the fact that is cubed in the M relation. (see e.g. Evrard et al. 2008; Saro et al. 2013; Munari et al. 2013; Ferragamo et al. 2020). All of them provide similar values, however we follow the Ferragamo et al. (2020) relation. This procedure is calibrated using the Munari et al. (2013) simulations, which consider not only dark matter particles but also subhalos, galaxies and AGN feedback. Ferragamo et al. (2020) go one step further and consider statistical and physical effects in samples containing small numbers of cluster members. Following this prescription, we find dynamical masses of M M⊙ and M⊙ for the main cluster and the secondary substructure, respectively. In order to compare these values with that obtained using X-ray emission, we convert M200 into M500 following the relation given by Duffy et al. (2008). That is, rescaling M500 from M200 assuming a concentration parameter (a suitable value for clusters at and M M⊙), integrating a Navarro-Frenk-White (NFW) profile (Navarro et al., 1997) and interpolating to obtain M500. So, we obtain M M⊙ and M⊙ for the main body of the cluster and the substructure, respectively. Therefore, taking into account these values, we can conclude that RXCJ1111 presents a total dynamical mass of M M⊙ and M M⊙, estimated as the sum of the individual masses of the two clump components.
Quasi-virialised regions can be determined by evaluating the virial radius of each galaxy clump. This radius is usually estimated as the radius of a sphere of mass M200 inside which the matter density is 200 times the critical density of the Universe at the redshift of the system, . Therefore, MrG. So, following this expression, we obtain r and 0.8 Mpc, for the main body and the substructure, respectively. We compile virial masses and radii in Table 1.
As an exercise, we could compare the total dynamical mass of RXCJ1111 above obtained with that determined assuming the cluster as a single galaxy clump, neglecting its substructured composition. In this way, in Sect. 3.1 we saw that RXCJ1111 presents a global velocity dispersion . Applying the M200 relation proposed by Ferragamo et al. (2020), we obtain a global dynamical mass M M⊙ and MM⊙. Comparing these values with that above obtained assuming substructure, we see that both numbers agree within error. However, the results derived from a global velocity dispersion seems to be slightly higher. This fact may be an indication that dynamical masses derived from a global velocity dispersion is overestimated for clusters whith evident substructure.
6.1 Explaining the optical and X-ray properties
By analysing X-ray data (see Sect. 2.3), we find an elongated configuration. The main X-ray emission comes from the north part of the cluster, while a bright extension to the south is also observed. Therefore, on the one hand, X-ray analyses confirm that RXCJ1111 presents an unrelaxed state, and on the other, the mean X-ray emission matches with the north part of the cluster, which includes a emission maximum centred on BCG2. However, the fact that we do not see a strong X-ray peak in the centre and rather a smeared peak could also be due to the orbiting central galaxies with their DM halos. In the optical, this scenario would explain the large offset ( km s-1) of BCG respect the main velocity distribution of its corresponding clump, the secondary substructure. Two mechanisms can help to retard the BCG. The first is dynamical friction (Merritt 1983; 1984; 1985), which is generally strong for a massive BCG, but has most impact when the galaxy is near the center of the primary cluster. The second mechanism is simply deflection of the BCG in its orbit as the result of a nonzero impact parameter. In the latter case, there is no loss of orbital energy, but the component of the BCG’s velocity projected onto the line of sight is reduced. Neither effect (dynamical friction or deflection) can be significant early in the merger. However, the velocity offset of BCG provides a strong argument that this merger has advanced at least close to core passage.
Once the point-like sources are removed, the rest of the X-ray diffuse emission on small scales is consistent with statistical fluctuations, which is difficult to observe if the merger happens in a direction close to the line-of-sight. However, more interesting is the agreement between X-ray shape emission from hot gas and galaxy spatial distributions. Both galaxy distribution and X-ray morphology suggest that the merging is happening almost along the LOS, maybe with a small impact parameter to the south (see Sect. 6.2).
We find that M500 derived from mass-Xray luminosity relation and from TX, M and M are about and M⊙, respectively. These values are slightly higher respect M500,X and M500,dyn. Probably, the reason behind this discrepancy is that RXCJ1111 is in a early phase of a merging (see Sect. 6.2). Thus, an on-going merging may be producing a small increase in the temperature of the hot gas of the ICM. Similarly, the LX is also enhanced due to effect produced by the collision of substructures and gas compression.
One of the most interesting question arises from the comparison between masses derived from X-ray and galaxy dynamics. Assuming two separate galaxy clumps, we obtain M M⊙ and M M⊙ from X-ray and galaxy dynamics, respectively, which are in quite good agreement within errors. However, assuming RXCJ1111 to be composed by only one galaxy population, we obtain M M⊙ that seems to be slightly higher, but within , respect to M500,X. This fact confirms that the most appropriate way to estimate realistic dynamical masses, even in not so relaxed clusters, is to identify the cluster components and consider each galaxy clump separately, so estimating masses within regions showing a more relaxed state. This method validates similar techniques to determine dynamical masses in a more accurate way, which have been successfully applied for merging clusters in the past (e.g. Girardi et al. 2008; Boschin et al. 2012).
Summarizing, the mass estimates derived from global dynamics of galaxies, the mass from global TX and LX are somehow overestimated, probably due to the unrelaxed state of RXCJ1111. Hence the importance of estimating dynamical masses in non-virialised clusters taking into account galaxy clumps separately. In addition, a good knowledge of the dynamical state is crucial in order to derive realistic X-ray properties in this sort of clusters.
6.2 A 3D merging model
As we pointed out above, both the main cluster and the fossil substructure can be separated in the velocity field, but not in the spatial distribution. The on-going collision will involve two mass halos with a mass ratio of 3:1. On the other hand, typical X-ray temperatures of relaxed clusters with M M⊙ are about 2.1 keV (see e.g. Fig.9 in Kettula et al. 2013) and references therein), however, we measure a global T keV. Thus, we measure a T keV enhancement in the X-ray temperature of the ICM that may also be explained by the fact that the main cluster and the fossil substructure are starting to collide. Galaxy clusters showing mergings in advanced states present an ICM much more disturbed with very high X-ray temperature (see e.g. Boschin et al. 2006; Barrena et al. 2002). In the following we propose a merging model in order to explain the 3D dynamics of this two-body collision.
The relative dynamics of RXCJ1111 is relatively simple and basically described by a interacting main body and substructure with mass ratio about 3:1. We analyze this interaction from different approaches, based in an energy integral formalism and considering a flat space-time and Newtonian gravity (see e.g. Beers et al., 1982). The three most important observables in a two-body interaction are: the total mass of the two systems computed as the sum of the individual components, M M⊙ (see Sect. 6); the relative LOS velocity in the cluster rest frame, km s-1; and the projected physical distance. This last term is quite undefined because both galaxy clumps seem to be superimposed in the plane of the sky. However, we may assume a projected distance of 82 arcsec Mpc, which is the separation between the two intervening brightest galaxies, BCG2 and BCG, assumed to be the gravitational centres of the main cluster and the substructure, respectively.

The Newtonian criterion for the gravitational binding follows the expression , where is the projection angle between the line connecting the centres of the two clumps and the plane of the sky. Beers et al. (1982) and Thompson (1982) (see also Lubin et al., 1998) developed the formalism but it suffers from several constraints: first, the components interact radially, so only head-on collisions with zero angular momentum (no rotation) are possible; Second, the evolution starts at with a separation of , and the clumps are moving apart or coming together for the first time in the history in the model considered; and third, the inequation above exposed implicitly excludes unbound solutions. In addition to these limitations, we remark that the two clusters are treated as point masses, which is an assumption that clearly fails when the two cluster mass distributions overlap.
The solutions for this model are shown in Fig. 11, which shows a mass-angle representation of the model. Considering the value of Msys, we only find bound and incoming solutions. No bound outgoing solutions are found. So the main cluster and the substructure would be completely tied by mutual pull of gravity. That is, we find that we are seeing the cluster in a first interaction (at Gyr at the redshift of RXCJ1111). Two possible bound solutions are found but they are degenerated due to the ambiguity in the projection angle . These are BIa and BIb, which correspond to and degrees, respectively. Assuming for simplicity that BI and BI, we estimate the actual de-projected (3D) relative distances and velocities between both clumps. In the first case, BI, both galaxy clumps would be separated by a distance of d Mpc, but the fossil substructure would be colliding with a relative 3D velocity of km s-1. In the second case, BI, the main cluster and substructure would be separated by d Mpc and would show a km s-1. Thus, in the first case, we find that the substructure would be very close to the main cluster, almost completely merged, as close as , showing a very high speed, km s-1. In the second scenario, the substructure would be separated from the main cluster, and colliding with a 3D velocity of km s-1.
The first scenario corresponds to a collision in a quite advanced stage, where halos and ICMs of both components would be almost completely fussed. With a so high relative velocity and both ICMs so mixed, we would expect to measure a high gas temperature, which is not observed in the X-ray maps. Nevertheless, the second scenario correspond to merging a whith a substructure at Mpc from the main cluster centre with a still moderate velocity. This scenario is in agreement with an early stage merging, where ICMs are starting to interact, with a no so high X-ray temperature and no shock fronts observed. In fact, taking into account this geometry, we are viewing these systems from almost along the merger axis, in which case, if a shock front is present, we see it from within the Mach cone. In other words, we cannot see a sharp shock front because our line of sight is not tangent to the front.
It is not easy to find a unique and satisfactory explanation for all the observables (BCG velocity, velocity distributions, velocity gradients, X-ray properties, spatial distributions, cluster morphology, …), and given the limitations of the Beers formalism, above exposed, it would be a mistake to completely rule out a more advanced merger on the basis of the Beers model. However, we find that the second scenario here proposed for the merging, represented by a bound incoming solution with a projection angle would be the preferred model to explain the merging state of RXCJ1111. In addition, we have to take into account that the substructure and BCG show higher velocities with respect to the main cluster, thus the substructure is falling in from the front. At Gyr, the model predicts that the fossil substructure would be completely merged with the main cluster.
7 Summary and conclusions
We present a detailed study of the kinematical and dynamical state of the galaxy cluster RXCJ1111+4050. Our analysis is based on new spectroscopic observations acquired at the 3.5m TNG telescope and complementary SDSS-DR16 spectroscopic redshifts in a region of . We select 104 cluster members around . The study of the velocity field confirms the presence of significant deviations from Gaussianity, which have been explained by the presence of a substructure in the cluster. The galaxy membership reveals that the secondary substructure is a a fossil-like group, with a magnitude gap , merging with the main cluster.
X-ray surface brightness map shows a clear elongated shape in the North-South direction, which is in agreement with the 2D spatial distribution of galaxies and a velocity gradient of about 250-350 km s-1 Mpc-1, also close to that direction. These facts, together with an indistinguishable galaxy populations projected onto the plane of the sky, indicate that the main cluster and substructure of RXCJ1111 lie almost aligned along the LOS, showing a small misalignment toward the south.
We use the velocity dispersion to estimate dynamical masses, and obtain M M⊙ and M⊙ for the main cluster and the secondary substructure, respectively. The total mass of RXCJ1111 derived from X-ray is in very good agreement with the dynamical estimates when individual galaxy clumps are considered, but not when the cluster is assumed to be composed by a single component. This clearly suggests that the most appropriated way to estimate dynamical masses in non-relaxed galaxy clusters is by identifying galaxy clumps and computing the total mass as the sum of the different components, which should be more virialised than the whole cluster. In the end, the methodology followed here represents an example to obtain realistic dynamical masses, which is crucial, for instance, to establish scaling relations from different approaches (X-ray, optical, weak lensing, …).
The observed excess in the X-ray temperature agrees with the fact that the substructure is starting to collide. This merger is characterized by a mass ratio of 3:1. We propose a possible merger model consistent with a two body configuration where cluster and substructure are aligned with from the LOS, with an impact velocity of km s-1. This model also predicts that main cluster and fossil substructure will be completely joined in about 0.15 Gyr.
To summarise, RXCJ1111 represents an observational evidence that the fossil feature of galaxy systems is a transitional stage, which supports the results by von Benda-Beckmann et al. (2008) using simulations. The dynamical analysis here exposed demonstrates that a fossil-like group is falling into the RXCJ1111 main cluster. The on-going collision might accelerate the interaction between the three BCGs observed, making the cluster to show a smaller in the near future (in Gyr), by fully incorporating BCG and its corresponding galaxy population into the dynamics of the whole cluster and so losing its fossil condition.
Acknowledgements.
R. Barrena acknowledges support by the Severo Ochoa 2020 research programme of the Instituto de Astrofísica de Canarias. G. Chon acknowledges support by the DLR under the grant n∘ 50 OR 2204. H. Böhringer acknowledges support from the Deutsche Forschungsgemeinschaft through the Excellence cluster ”Origins”. J.M.A. acknowledges the support of the Viera y Clavijo Senior program funded by ACIISI and ULL. J.M.A. acknowledges support from Spanish Ministerio de Ciencia, Innovación y Universidades through grant PID2021-128131NB-I00.This article is based on observations made with the Italian Telescopio Nazionale Galileo operated by the Fundación Galileo Galilei of the INAF (Istituto Nazionale di Astrofisica). This facility is located at the Spanish del Roque de los Muchachos Observatory of the Instituto de Astrofísica de Canarias on the island of La Palma.
Funding for the Sloan Digital Sky Survey (SDSS) has been provided by the Alfred P. Sloan Foundation, the Participating Institutions, the National Aeronautics and Space Administration, the National Science Foundation, the U.S. Department of Energy, the Japanese Monbukagakusho, and the Max Planck Society.
References
- Abell (1958) Abell, G. O., 1958, ApJS, 3, 211
- Arnaud et al. (2005) Aarnaud, M., Pointecouteau E., Pratt, G. W. 2005, A&A, 441, 893
- Arnaud et al. (2021) Arnaud, M., Ettori, S., Pratt G. W., et al. 2021, A&A, 650, A104
- Ashman et al. (1994) Ashman, K. M., Bird C. M., Zepf S. E., 1994, AJ, 108, 2348
- Asplund et al. (2009) Asplund, M., Grevesse N., Sauval A. J., et al., 2009, ARA&A, 47, 481
- Barrena et al. (2002) Barrena, R., Biviano A., Ramella M., et al., 2002, A&A, 386, 816
- Barrena et al. (2012) Barrena, R., Girardi M., Boschin W., ref??? et al., 2012, A&A, 540, A90
- Becker et al. (1995) Becker, R. H, White, R. L, Helfand, D. J., 1995, ApJ, 450, 559
- Begelman et al. (1984) Begelman, M. C, Blandford, R. D, Rees, M. J., 1984, Rev. Mod. Phys., 56, 225
- Berrier et al. (2009) Berrier, J. C, Stewart, K. R, Bullock, J. S., et al., 2009, ApJ, 690, 1292
- Beers et al. (1982) Beers, T. C., Geller M. J., Huchra J. P, 1982, ApJ, 257, 23
- Beers et al. (1990) Beers, T. C., Flynn K., Gebhardt K., 1990, AJ, 100, 32
- Benítez et al. (2013) Benítez, E., Méndez-Abreu, J., Fuentes-Carrera, I., et al. 2013, ApJ, 763, 136. doi:10.1088/0004-637X/763/2/136
- Biviano & Katgert (2003) Biviano, A., Katgert P., 2003, Ap&SS, 285, 25
- Biviano & Mamon (2023) Biviano, A., Mamon, G., 2023, A&A, 670, A17
- Boschin et al. (2006) Boschin, W., Girardi, M., Spolaor, M., et al. 2012, A&A, 449, 461
- Boschin et al. (2012) Boschin, W., Girardi, M., Barrena, R., et al. 2012, A&A, 540, A43
- Böhringer et al. (2000) Böhringer, H., Voges, W., Huchra, J. P., 2000 ApJS, 129, 435
- Chon & Böhringer (2015) Chon, G.,Böhringer, H., 2015 A&A, 574, 132
- Clowe et al. (2004) Clowe, D., Gonzalez, A., Markevitch, M., 2004, ApJ, 609, 596
- Dariush et al. (2010) Dariush, A. A., Raychaudhury, S., Ponman, T. J., et al. 2010, MNRAS, 405, 1873
- de Carvalho et al. (2017) de Carvalho, R. R., Ribeiro, A. L. B., Stalder, D. H., et al. 2017, AJ, 154, 96
- D’Onghia et al. (2005) D’Onghia, E., Sommer-Larsen, J., Romeo, A. D., et al. 2005, ApJ, 630, 109
- Diaferio et al. (2005) Diaferio, A., Geller, M. J., Rines, K. J., 2005, ApJ, 628, L97
- Dressler & Schectman (1988) Dressler, A., Shectman, S. A., 1988, AJ, 95, 985
- Duffy et al. (2008) Duffy, A. R., Schaye, J., Kay, S. T., et al., 2008, MNRAS, 390, L64
- Evrard et al. (2008) Evrard, A. E., Blalek, J., Busha, M., et al., 2008, ApJ, 672, 122
- Feretti (2002) Feretti, L., IAUS, 199, 133
- Ferragamo et al. (2020) Ferragamo, A, Rubiño-Martín, J. A., Betancort-Rijo, J., et al., 2020, A&A, 641, A41
- Gavazzi et al. (2010) Gavazzi, G., Fumagalli, M., Cucciati, O., et al., 2010, A&A, 517, A73
- Girardi et al. (1996) Girardi, M., Fadda, D., Giuricin, G., et al., 1996, ApJ, 457, 61
- Girardi et al. (2008) Girardi, M., Barrena, R., Boschin, W., 2008, A&A, 471, 379
- Hendel & Johnston (2015) Hendel, D. & Johnston, K. V. 2015, MNRAS, 454, 2472. doi:10.1093/mnras/stv2035
- Jones et al. (2003) Jones, L. R., Ponman, T. J, Horton, A., et al., 2003, MNRAS, 343, 627
- Kennicutt (1992) Kennicutt, R. C., 1992, ApJS, 79, 255
- Kettula et al. (2013) Kettula, K., Finoguenov, A., Massey, R., et al. 2013, ApJ, 778, 74
- Komossa et al. (2003) Komossa, S., Burwitz, V., Hasinger, G., et al. 2003, ApJL, 582, L15. doi:10.1086/346145
- Laganá et al. (2008) Laganá, T. F., Lima Neto, G. B., Andrade-Santos, F., et al., 2008, A&A, 485, 633
- Lauer et al. (2014) Lauer, T. R., Postman, M., Strauss, M. A., et al. 2014, ApJ, 797, 82
- Lemze et al. (2009) Lemze, D., Broadhurst, T., Rephaeli, Y., et al. 2009, ApJ, 701, 1336
- Lopes et al. (2018) Lopes, P. A. A., Trevisan, M., Laganà, T. F., et al. 2018, MNRAS, 478, 5473
- Lubin et al. (1998) Lubin, L. M., Postman, M., Oke, J. B., 1998, AJ, 116, 643
- Markevitch et al. (2002) Markevitch, M., Gonzalez, A. H., David, L., 2002, ApJ, 567, L27
- Martinet et al. (2016) Martinet, N., Clowe, D., Durret, F., et al. 2016, A&A, 590, A69
- Mamon et al. (2010) Mamon, G., Biviano, A., Murante, G. 2010, A&A, 520, A30
- Mancillas et al. (2019) Mancillas, B., Duc, P.-A., Combes, F., et al. 2019, A&A, 632, A122. doi:10.1051/0004-6361/201936320
- McGee et al. (2009) McGee, S. L., Balogh, M. L., Bower, R. G. 2009, MNRAS, 400, 937
- Méndez-Abreu et al. (2017) Méndez-Abreu, J., Ruiz-Lara, T., Sánchez-Menguiano, L., et al. 2017, A&A, 598, A32
- Méndez-Abreu et al. (2014) Méndez-Abreu, J., Debattista, V. P., Corsini, E. M., et al. 2014, A&A, 572, A25
- Méndez-Abreu et al. (2012) Méndez-Abreu, J., Aguerri, J. A. L., Barrena, R., et al. 2012, A&A, 537, A25
- Méndez-Abreu et al. (2008) Méndez-Abreu, J., Aguerri, J. A. L., Corsini, E. M., et al. 2008, A&A, 478, 353
- Merrit (1983) Merrit, D., 1983, ApJ, 264, 24
- Merrit (1984) Merrit, D., 1984, ApJ, 276, 26
- Merrit (1985) Merrit, D., 1985, ApJ, 289, 18
- Mulchaey & Zabludoff (1999) Mulchaey, J. S, Zabludoff, A. I 1999, ApJ, 514, 133
- Munari et al. (2013) Munari, E., Biviano, A., Borgani, S., et al. 2013, MNRAS, 430, 2638
- Navarro et al. (1997) Navarro, J. F., Frenk, C. S., White, S. D. M., 1997, ApJ, 490, 493
- Nelson et al. (2002) Nelson, A. E., Simard, L., Zaritsky, D., et al. 2002, ApJ, 567, 144. doi:10.1086/338221
- Owen et al. (1993) Owen, F. N., White, R. A., Ge, J., 1993, ApJS, 87, 135
- Owen & Ledlow (1997) Owen, F. N., Ledlow, M. J., 1997, ApJS, 108, 41
- Patton et al. (2016) Patton, D. R., Qamar, F. D., Ellison, S. L., et al. 2016, MNRAS, 461, 2589. doi:10.1093/mnras/stw1494
- Peng et al. (2002) Peng, C. Y., Ho, L. C., Impey, C. D., et al. 2002, AJ, 124, 266
- Peng et al. (2010) Peng, C. Y., Ho, L. C., Impey, C. D., et al. 2010, AJ, 139, 2097
- Piffaretti et al. (2011) Piffaretti, R., Arnaud, M., Pratt, G. W., et al. 2011, A&A, 534, A109
- Ponman et al. (1994) Ponman, T. J., Allan, D. J., Jones, L. R., et al., 1994, Nat, 369, 462
- Planck 2013 results. XXIX (2014) Planck Collaboration XXIX, A&A, 571, A29
- Planck 2015 results. XXVII (2016) Planck Collaboration XXVII, A&A, 594, A27
- Pratt et al. (2009) Pratt, G. W., Croston, J. H., Arnaud, M., 2009, A&A, 498, 361
- Ribeiro et al. (2011) Ribeiro, A. L. B., Lopes, P. A. A., Trevisan, M. 2011, MNRAS, 413, L81
- Rykoff et al. (2016) Rykoff, E. S., Rozo, E., Hollowood, D., et al. 2016, ApJS, 224, 1
- Santos et al. (2007) Santos, W. A., Mendes de Oliveira, C., Sodré, L., 2007, AJ, 134, 1551
- Saro et al. (2013) Saro, A., Mohr, J. J, Bazin, G., et al., 2013, ApJ, 772, 47
- Schlegel et al. (1998) Schlegel, D. J., Finkbeiner, D. P., Davis, M., 1998, ApJ, 500, 525
- Sersic (1968) Sersic, J. L. 1968, Cordoba, Argentina: Observatorio Astronomico, 1968
- Smith et al. (2001) Smith, R. K., Brickhouse, N. S., Liedahl, D. A., 2001, ApJ, 556, L91
- Schwarz (1978) Schwarz, G. 1978, Annals of Statistics, 6, 461
- Thompson (1982) Thompson, L. A., 1982, in IAU Symp., 104, Early Evolution of the Universe and the Present Structure, ed. G.O. Abell, & G. Chincarini (Dordrecht: Reidel)
- Tonry & Davis (1979) Tonry, J., Davis, M. 1979, ApJ, 84, 1511
- Vikhlinin et al. (2006) Vikhlinin, A., Kravtsov, A., Forman, W., et al. 2006, ApJ, 640, 691
- von Benda-Beckmann et al. (2008) von Benda-Beckmann, A. M., D’Onghia, E., Gottlöber, S., et al. 2008, MNRAS, 386, 2345
- Wen et al. (2009) Wen, Z. L., Han, J. L., Liu, F. S., 2009, ApJS, 183, 197
- Zarattini et al. (2014) Zarattini, S., Barrena, R., Girardi, M., et al. 2014, A&A, 565, A116
- Zarattini et al. (2021) Zarattini, S., Biviano, A., Aguerri, J. A. L., et al. 2021, A&A, 655, A103
Appendix A Spectroscopic redshifts catalogue
| ID | R.A. & Dec. (J2000) | vv | Notes | ||
|---|---|---|---|---|---|
| R.A.= | (km s-1) | ||||
| Dec.= | |||||
| 1⋆ | 10:43.04 47:20.3 | 24888 142 | 18.21 | 17.87 | |
| 2⋆ | 10:43.78 51:21.9 | 22140 92 | 19.31 | 18.49 | |
| 3 | 10:44.86 51:15.0 | 45551 81 | 19.43 | 18.88 | ELG |
| 4 | 10:46.61 49:40.2 | 107820 83 | 21.24 | 20.55 | ELG |
| 5⋆ | 10:47.91 50:37.1 | 23595 152 | 19.30 | 18.99 | ELG |
| 6 | 10:48.26 51:44.3 | 79047 78 | 19.52 | 18.30 | |
| 7 | 10:48.77 47:46.2 | 58600 117 | 19.51 | 19.05 | ELG |
| 8 | 10:52.98 49:05.4 | 29410 91 | 21.07 | 20.86 | ELG |
| 9⋆ | 10:52.99 48:53.7 | 21300 95 | 21.17 | 21.03 | ELG |
| 10 | 10:57.82 47:05.7 | 46174 41 | 18.80 | 17.77 | ELG |
| 11 | 10:58.58 48:04.4 | 33869 72 | 21.60 | 20.76 | |
| 12 | 10:58.84 46:55.5 | 55360 105 | 20.65 | 20.24 | ELG |
| 13⋆ | 11:00.10 47:21.4 | 22697 6 | 17.79 | 16.97 | |
| 14 | 11:04.03 50:04.8 | 103930 125 | 22.65 | 21.18 | ELG |
| 15 | 11:04.35 50:16.7 | 28460 75 | 18.22 | 17.65 | ELG |
| 16 | 11:04.63 49:25.7 | 60454 95 | 21.14 | 20.17 | |
| 17 | 11:04.96 49:54.8 | 52510 75 | 20.53 | 19.91 | ELG |
| 18 | 11:05.18 50:59.3 | 45709 64 | 19.13 | 18.57 | ELG |
| 19 | 11:09.94 52:03.2 | 51680 109 | 20.91 | 20.58 | |
| 20⋆ | 11:11.40 52:47.6 | 23826 4 | 17.57 | 16.77 | |
| 21⋆ | 11:12.36 57:34.3 | 21454 5 | 17.34 | 16.47 | |
| 22 | 11:12.53 54:12.6 | 107261 67 | 20.05 | 18.39 | |
| 23⋆ | 11:12.70 52:24.5 | 22630 7 | 18.12 | 17.21 | |
| 24⋆ | 11:17.24 52:43.5 | 21620 117 | 19.16 | 18.78 | ELG |
| 25⋆ | 11:19.66 51:35.3 | 22398 85 | 19.43 | 18.63 | |
| 26⋆ | 11:21.46 55:03.6 | 22140 7 | 17.59 | 16.73 | |
| 27⋆ | 11:23.10 49:23.3 | 22241 78 | 18.69 | 17.82 | |
| 28⋆ | 11:23.69 49:44.3 | 22604 10 | 18.51 | 17.66 | |
| 29 | 11:24.51 45:13.7 | 123028 97 | 20.91 | 19.23 | |
| 30⋆ | 11:27.16 55:07.8 | 23037 6 | 17.33 | 16.35 | |
| 31⋆ | 11:27.24 55:24.3 | 22096 91 | 18.95 | 18.12 | |
| 32⋆ | 11:27.65 56:48.4 | 23378 5 | 17.05 | 16.14 | |
| 33⋆ | 11:28.17 55:26.3 | 23096 6 | 18.07 | 17.18 | |
| 34⋆ | 11:28.72 57:27.1 | 22109 12 | 17.65 | 16.77 | |
| 35⋆ | 11:30.25 58:00.6 | 23586 55 | 18.72 | 17.87 | |
| 36⋆ | 11:30.29 51:33.0 | 22051 2 | 17.95 | 17.56 | |
| 37 | 11:31.94 46:48.0 | 109534 90 | 22.06 | 21.24 | |
| 38⋆ | 11:32.78 53:55.8 | 21491 116 | 20.64 | 19.40 | |
| 39⋆ | 11:32.88 53:25.0 | 22290 70 | 17.18 | 16.26 | |
| 40⋆ | 11:32.91 53:25.0 | 22274 33 | 17.12 | 16.22 | |
| 41 | 11:33.87 55:51.0 | 28459 143 | 18.32 | 17.62 | ELG |
| 42⋆ | 11:34.05 55:44.5 | 21046 7 | 18.22 | 17.35 | |
| 43⋆ | 11:34.53 47:12.4 | 22401 63 | 18.24 | 17.50 | |
| 44⋆ | 11:35.07 45:53.7 | 22037 8 | 18.31 | 17.41 | |
| 45 | 11:35.35 41:43.5 | 154103 76 | 21.53 | 19.96 | |
| 46⋆ | 11:35.45 47:03.9 | 21734 73 | 19.10 | 18.22 | |
| 47⋆ | 11:35.55 57:49.3 | 21737 72 | 18.67 | 17.81 | |
| 48⋆ | 11:35.77 47:27.2 | 21888 113 | 19.70 | 18.80 | |
| 49⋆ | 11:35.80 42:26.3 | 22880 5 | 17.95 | 17.08 | |
| 50⋆ | 11:36.17 51:05.1 | 22510 99 | 18.39 | 17.44 | |
| 51⋆ | 11:36.59 51:21.5 | 20389 90 | 18.25 | 17.42 | |
| 52⋆ | 11:36.63 51:58.9 | 22633 55 | 19.11 | 18.22 | |
| 53⋆ | 11:36.64 42:06.7 | 22110 83 | 20.85 | 20.60 | ELG |
| 54⋆ | 11:37.05 50:29.5 | 23545 7 | 17.73 | 16.82 | |
| 55 | 11:38.06 45:50.7 | 56993 119 | 21.98 | 21.20 | |
| 56⋆ | 11:38.43 44:20.4 | 22591 117 | 19.94 | 19.13 | |
| 57⋆ | 11:38.68 52:59.6 | 24479 84 | 18.29 | 17.41 | |
| 58 | 11:38.77 56:55.6 | 34400 105 | 18.97 | 18.68 | ELG |
| 59⋆ | 11:39.54 51:14.9 | 22913 140 | 20.33 | 19.48 | |
| 60⋆ | 11:39.73 50:24.3 | 22283 36 | 15.49 | 14.55 | BCG2 |
| ID | R.A. & Dec. (J2000) | vv | Notes | ||
|---|---|---|---|---|---|
| R.A.= | (km s-1) | ||||
| Dec.= | |||||
| 61⋆ | 11:39.94 58:16.5 | 23173 13 | 18.37 | 17.60 | |
| 62⋆ | 11:39.98 00:46.7 | 21729 7 | 17.93 | 17.05 | |
| 63 | 11:39.99 53:13.7 | 41547 95 | 20.15 | 19.17 | |
| 64⋆ | 11:40.09 45:45.3 | 21669 6 | 18.12 | 17.19 | |
| 65⋆ | 11:40.14 44:44.0 | 24423 60 | 19.08 | 18.18 | |
| 66⋆ | 11:40.20 46:57.8 | 22503 9 | 19.13 | 18.23 | |
| 67⋆ | 11:40.48 47:06.9 | 22329 5 | 16.15 | 15.21 | BCG3 |
| 68 | 11:40.57 44:01.7 | 105740 119 | 21.53 | 20.64 | ELG |
| 69⋆ | 11:40.72 50:02.9 | 24253 192 | 18.85 | 17.99 | |
| 70 | 11:40.75 43:22.2 | 90605 92 | 22.01 | 20.27 | |
| 71⋆ | 11:40.94 50:31.0 | 21270 67 | 19.48 | 18.59 | |
| 72⋆ | 11:41.00 53:48.2 | 23981 150 | 20.72 | 19.94 | |
| 73 | 11:41.85 46:26.6 | 81529 46 | 20.49 | 19.01 | |
| 74 | 11:41.96 40:57.4 | 145220 81 | 22.10 | 21.33 | ELG |
| 75⋆ | 11:42.39 54:35.1 | 21750 199 | 20.29 | 19.49 | |
| 76⋆ | 11:42.49 45:10.7 | 21968 5 | 16.78 | 15.88 | |
| 77⋆ | 11:42.89 47:19.0 | 23074 106 | 18.79 | 17.87 | |
| 78⋆ | 11:43.11 43:33.9 | 22734 31 | 17.38 | 16.46 | |
| 79 | 11:43.13 01:01.3 | 14610 107 | 20.00 | 19.62 | ELG |
| 80⋆ | 11:43.23 54:31.2 | 22331 73 | 18.00 | 17.10 | |
| 81 | 11:43.42 46:38.7 | 86349 65 | 20.95 | 20.58 | |
| 82⋆ | 11:43.48 42:00.3 | 23794 36 | 18.71 | 17.84 | |
| 83⋆ | 11:43.62 49:14.5 | 23428 5 | 15.11 | 14.17 | BCG |
| 84⋆ | 11:43.71 53:16.9 | 22854 8 | 18.39 | 17.46 | |
| 85⋆ | 11:43.76 50:05.3 | 21844 8 | 18.58 | 17.68 | |
| 86⋆ | 11:43.81 56:07.2 | 22871 67 | 18.27 | 17.40 | |
| 87 | 11:44.13 46:07.4 | 124630 145 | 21.53 | 19.93 | ELG |
| 88⋆ | 11:44.24 48:29.1 | 24051 60 | 19.40 | 18.43 | |
| 89 | 11:44.55 40:08.7 | 138350 93 | 22.38 | 21.50 | ELG |
| 90 | 11:44.87 58:42.5 | 13890 107 | 19.84 | 19.60 | ELG |
| 91⋆ | 11:44.93 48:46.3 | 23202 6 | 17.44 | 16.53 | |
| 92⋆ | 11:45.59 45:28.7 | 22372 123 | 21.54 | 20.66 | |
| 93⋆ | 11:45.65 50:57.7 | 22798 91 | 18.68 | 17.82 | |
| 94⋆ | 11:46.13 51:19.6 | 23755 7 | 18.38 | 17.45 | |
| 95 | 11:46.22 01:18.1 | 19159 100 | 20.73 | 20.28 | |
| 96 | 11:46.35 59:24.7 | 70740 78 | 20.33 | 19.13 | |
| 97⋆ | 11:47.19 57:29.6 | 22287 107 | 19.85 | 19.10 | |
| 98 | 11:47.71 54:13.1 | 45950 100 | 19.74 | 19.15 | |
| 99⋆ | 11:48.54 54:10.0 | 22998 6 | 18.21 | 17.32 | |
| 100⋆ | 11:48.55 49:42.2 | 23452 106 | 19.96 | 19.11 | |
| 101⋆ | 11:49.37 53:35.5 | 22650 103 | 19.19 | 18.36 | |
| 102⋆ | 11:50.00 52:26.8 | 22888 114 | 19.89 | 18.99 | |
| 103⋆ | 11:50.35 46:13.5 | 23679 5 | 16.91 | 15.94 | |
| 104⋆ | 11:50.62 51:21.0 | 23365 5 | 17.50 | 16.58 | |
| 105⋆ | 11:50.85 51:01.5 | 23093 8 | 18.38 | 17.54 | |
| 106⋆ | 11:51.36 54:36.5 | 22773 6 | 17.41 | 16.51 | |
| 107 | 11:51.37 00:32.8 | 102542 80 | 20.96 | 20.12 | ELG |
| 108⋆ | 11:51.46 54:50.5 | 21871 91 | 20.12 | 19.35 | |
| 109⋆ | 11:52.32 52:36.9 | 23998 69 | 19.71 | 18.88 | |
| 110⋆ | 11:52.32 55:30.2 | 21548 80 | 19.12 | 18.40 | |
| 111 | 11:52.36 53:06.3 | 70670 55 | 21.28 | 20.60 | ELG |
| 112⋆ | 11:52.52 58:32.8 | 24219 9 | 18.12 | 17.24 | |
| 113 | 11:54.22 55:09.4 | 28475 122 | 19.11 | 18.76 | ELG |
| 114⋆ | 11:54.23 51:15.9 | 22657 6 | 18.15 | 17.24 | |
| 115⋆ | 11:54.55 45:47.5 | 23713 4 | 18.22 | 17.31 | |
| 116 | 11:54.59 59:50.5 | 77484 84 | 21.21 | 19.90 | |
| 117⋆ | 11:55.53 47:19.3 | 22280 78 | 18.55 | 17.85 | ELG |
| 118 | 11:55.53 47:19.6 | 21670 103 | 18.49 | 17.81 | ELG |
| 119⋆ | 11:56.57 51:42.3 | 23790 7 | 17.62 | 16.74 | |
| 120⋆ | 11:57.15 51:52.9 | 23297 145 | 19.89 | 19.00 | |
| 121⋆ | 11:58.08 48:26.8 | 23098 7 | 18.06 | 17.17 | |
| 122 | 11:58.18 53:16.7 | 46207 70 | 19.10 | 18.44 | ELG |
| 123⋆ | 11:58.80 52:03.7 | 22343 54 | 17.74 | 16.87 | |
| 124 | 11:59.75 49:00.2 | 35400 97 | 20.26 | 19.43 | ELG |
| 125⋆ | 12:00.72 48:29.3 | 24336 96 | 19.32 | 18.48 | |
| 126⋆ | 12:02.15 40:43.0 | 22686 8 | 17.86 | 16.96 | |
| 127⋆ | 12:02.23 48:52.3 | 22800 100 | 20.57 | 19.93 | |
| 128⋆ | 12:03.99 40:18.1 | 21845 8 | 18.46 | 17.65 | |
| 129 | 12:04.35 49:26.3 | 55573 76 | 20.50 | 19.84 | |
| 130⋆ | 12:04.42 52:49.6 | 24120 111 | 20.65 | 20.18 | ELG |
| 131 | 12:05.09 50:57.4 | 43900 91 | 20.23 | 19.62 | ELG |
| 132⋆ | 12:05.72 52:43.5 | 22670 34 | 18.65 | 17.82 |
| ID | R.A. & Dec. (J2000) | vv | Notes | ||
|---|---|---|---|---|---|
| R.A.= | (km s-1) | ||||
| Dec.= | |||||
| 133⋆ | 12:06.37 52:25.5 | 22036 93 | 19.97 | 19.22 | |
| 134⋆ | 12:07.42 47:12.7 | 23170 132 | 20.17 | 19.50 | ELG |
| 135⋆ | 12:07.76 57:21.7 | 21126 3 | 16.82 | 16.26 | |
| 136⋆ | 12:07.80 56:54.9 | 21931 3 | 17.86 | 16.94 | |
| 137⋆ | 12:08.35 53:01.9 | 21430 112 | 19.03 | 18.55 | ELG |
| 138⋆ | 12:08.41 51:44.3 | 22540 109 | 19.52 | 19.09 | ELG |
| 139 | 12:09.17 52:11.6 | 53810 89 | 20.97 | 20.54 | ELG |
| 140⋆ | 12:10.87 50:29.8 | 22594 27 | 17.25 | 16.38 | |
| 141 | 12:12.61 48:17.5 | 46487 67 | 19.97 | 19.16 | ELG |
| 142⋆ | 12:12.87 51:07.2 | 22074 49 | 19.33 | 18.50 | |
| 143 | 12:13.20 51:36.0 | 41490 68 | 19.98 | 19.60 | ELG |
| 144⋆ | 12:17.46 52:42.8 | 22191 5 | 17.38 | 16.48 | |
| 145⋆ | 12:18.01 41:40.4 | 21502 7 | 18.25 | 17.38 | |
| 146⋆ | 12:19.87 46:34.2 | 24397 71 | 20.29 | 19.59 | |
| 147 | 12:20.32 47:56.7 | 59000 88 | 21.99 | 20.69 | |
| 148⋆ | 12:24.10 48:37.8 | 22895 114 | 19.82 | 19.06 | |
| 149⋆ | 12:25.98 57:46.4 | 21461 6 | 17.95 | 17.16 | |
| 150 | 12:30.98 54:32.2 | 45420 115 | 19.47 | 18.95 | ELG |
| 151 | 12:32.39 54:06.4 | 45750 80 | 20.60 | 20.19 | ELG |
| 152⋆ | 12:34.82 49:41.8 | 22214 44 | 18.89 | 18.04 |
Note: asterisk in Col. 1 (ID) indicates the galaxies selected as cluster members.