Semi-inclusive direct photon+jet and +jet correlations measured in and central collisions at GeV
Abstract
The STAR experiment at RHIC reports new measurements of jet quenching based on the semi-inclusive distribution of charged-particle jets recoiling from direct photon () and neutral pion () triggers in and central collisions at GeV, for triggers in the range GeV. The datasets have integrated luminosities of 3.9 for and 23 for collisions. Jets are reconstructed using the algorithm with resolution parameters and 0.5. The large uncorrelated jet background in central collisions is corrected using a mixed-event approach, which enables precise charged-particle jet measurements at low transverse momentum and large . Recoil-jet distributions are reported in the range . Comparison of the distributions measured in and collisions reveals strong medium-induced jet yield suppression for , with markedly less suppression for . These data provide new insight into the mechanisms underlying jet quenching, and the angular dependence of medium-induced jet-energy transport.
1 Introduction
Matter under conditions of extreme temperature and density comprises a Quark-Gluon Plasma (QGP), the state of matter in which the predominant degrees of freedom are sub-hadronic [1, 2]. QGP filled the universe a few microseconds after the Big Bang, and is generated and studied today in collisions of heavy atomic nuclei at the Relativistic Heavy Ion Collider (RHIC) and the Large Hadron Collider (LHC). Measurements at these facilities, and their comparison to theoretical calculations, show that the QGP is a fluid with very low specific viscosity [3, 4, 5, 6] that is opaque to the passage of energetic color charges [7].
Jets provide unique and incisive probes of the QGP. In hadronic collisions, jets are generated by hard (high momentum transfer ) interactions of incoming quarks and gluons (partons). The scattered partons are initially highly virtual, and evolve by radiating gluons to produce a collimated parton shower. Quantum interference in this radiative process produces distinctive features, notably angular ordering, whereby the most energetic jet fragments are most closely aligned with the jet axis. Jet reconstruction algorithms have been developed that can be applied to both experimental data and to theoretical calculations based on perturbative Quantum Chromodynamics (pQCD) [8]. Using these algorithms, pQCD calculations are found to be in excellent agreement with jet measurements at hadron colliders [9, 10, 11, 12, 13, 14].
In nuclear collisions at RHIC and the LHC, jets are generated in coincidence with the nascent QGP. Highly-virtual partons from hard scatterings interact with the colored constituents of the QGP, scattering elastically and radiatively [15, 7]. These in-medium interactions modify jet production rates and properties relative to those of jets generated in vacuum, producing several experimentally observable effects (“jet quenching”) [16, 17, 18, 19]: jet energy loss due to transport of energy out of the jet cone, corresponding to yield suppression at fixed transverse momentum (); modification of intra-jet structure; and deflection of the jet centroid (acoplanarity).
Measurements of reconstructed jets in heavy-ion collisions are challenging, due to the large and complex background from uncorrelated processes (see Ref. [7] and references therein). Jet quenching was initially observed in measurements of inclusive production and correlations of high- hadrons, the leading fragments of jets, which are more readily measurable over the large background in heavy-ion collisions [20, 21, 22, 23, 24, 25, 26, 27, 28, 29, 30, 31, 32]. The comparison of high- hadron yield suppression measurements with theoretical calculations provides significant constraints on the QGP transport parameter , which characterizes the momentum exchange of jets with the QGP medium due to interactions [33, 34, 35]. High- hadrons are sensitive primarily to the magnitude of in-medium jet energy loss, however, and more detailed understanding of the mechanisms underlying jet quenching requires measurements based on reconstructed jets [36, 37, 12, 38, 39, 40, 41, 42, 43, 44, 45, 46, 47, 48, 49, 50].
An important channel for such measurements is the coincidence of an isolated direct photon () and recoiling jet [51]. Direct photons are colorless and do not interact significantly with the QGP; their transverse energy () thereby provides a reference scale for precise measurements of jet quenching [52]. In the theoretical description of +jet pair production at RHIC energies, at leading perturbative order (LO) the predominant mechanism is QCD Compton scattering (), in which the direct photon and recoiling quark jet are balanced [52]. However, Next-to-Leading Order (NLO) contributions, which generate photon-jet -imbalance, are sizable even in vacuum [53]. Measurement of the +jet channel is nevertheless a key element of the program for precise jet quenching measurements at RHIC and the LHC.
Coincidence +jet measurements have been carried out for and collisions at the LHC [43, 54, 55]. The measurements exhibit significant imbalance, consistent with NLO calculations [53], while jet quenching is found to generate additional imbalance that is however smaller in magnitude than in-vacuum NLO effects [54, 55]. There are currently no +jet measurements reported at RHIC.
Measurements of the semi-inclusive distribution of jets recoiling from a high- hadron trigger have been carried out for , and collisions at the LHC [40, 56], and for collisions at RHIC [49]. In the semi-inclusive approach, selection bias is induced solely by the choice of trigger. Due to the effects of jet quenching, observed high- hadrons in nuclear collisions are generated predominantly at the surface of the QGP, headed outwards [57]; for semi-inclusive observables with a hadron trigger, the recoiling jet population may therefore have on average larger in-medium path length than an unbiased population [40, 49]. Semi-inclusive measurements incoporating both and triggers can provide direct comparison of recoil-jet populations with different quark/gluon relative populations and different in-medium path-length distributions [58].
This manuscript and the companion Letter [59] report the first +jet and +jet coincidence measurements in and central collisions at GeV. Semi-inclusive distributions of charged-particle jets [40, 49] recoiling from identified and trigger particles are reported, for triggers in the range GeV. The analysis is based on previous developments to discriminate and at high by using calorimetric shower shape [60, 58], and to mitigate the complex jet background in central collisions by means of mixed events (ME) [49]. This manuscript presents the analysis and experimental results in detail, while the companion Letter compares the measurements to theoretical calculations and discusses the constraints that these measurements impose on the physical mechanisms underlying jet quenching.
Jets are reconstructed using the algorithm [61] with resolution parameters and 0.5. In-medium jet energy loss is measured by comparing distributions in and collisions at the same , and intra-jet broadening is measured by comparing the distributions at different in and collisions separately. This manuscript and the companion Letter focus on recoil-jet yield distributions as a function of ; more differential measurements of the angular distribution of recoil jets will be reported in a forthcoming publication.
The manuscript is organized as follows: Sect. 2 presents the detector, dataset, and offline reconstruction; Sect. 3 presents the theoretical model calculations that are compared to data; Sect. 4 presents an overview of the analysis; Sect. 5 presents the photon and measurements; Sect. 6 presents the jet reconstruction; Sect. 7 presents the raw coincidence distributions; Sect. 8 presents the extraction of +jet distributions; Sect. 9 presents trigger-resolution effects; Sect. 10 presents corrections to the recoil distributions; Sect. 11 presents systematic uncertainties; Sect. 12 presents closure tests; Sect. 13 presents the physics results; and Sect. 14 presents a summary and outlook.
2 Dataset, offline analysis, and simulations
The Solenoidal Tracker at RHIC (STAR) detector is described in Ref. [62]. STAR has a large solenoidal magnet with uniform magnetic field of strength of 0.5 T aligned with the beam direction, and detectors for triggering, tracking, electromagnetic calorimetry, and particle identification. This analysis utilizes the Barrel Electromagnetic Calorimeter (BEMC) [63] for triggering and EM shower measurements; the Barrel Shower Maximum Detector (BSMD) [58] for / discrimination; the Time Projection Chamber (TPC) [64] for charged-particle tracking; and the forward Vertex Position Detector (VPD) and Zero-Degree Calorimeter (ZDC) for triggering. The BEMC, BSMD, and TPC have acceptance in pseudo-rapidity ||<1.0, with full azimuthal coverage.
The data for collisions at GeV were recorded during the high luminosity phase of the 2009 RHIC run. The data were selected online using the trigger. The first layer of event selection, after receiving data from the detectors, passes the event to the trigger based on the presence of at least one BEMC “high tower” with transverse energy greater than 4.2 GeV. The selection requires the presence of a contiguous cluster of BEMC towers, whose two most energetic towers have sum GeV. In total, 11.3 million collision events were recorded which satisfy the trigger requirements. After offline cuts for event quality, the integrated luminosity accepted for analysis is 23 .
The data for collisions at GeV were recorded during the 2014 RHIC run, likewise utilizing the selection. In this case, the first layer of triggering is a high-tower threshold of 5.9 GeV. No centrality-specific selection is applied at the online trigger level. Pileup is suppressed offline by comparing two different measurements of the event-vertex position along the beam direction: reconstructed using tracks (see below), and measured by VPD timing. Events are rejected if the difference between the vertex-position measurements is greater than 6 cm along the beam direction, or if the track-based vertex position has distance larger than 70 cm from the nominal center of STAR in the beam direction. Since the Time-of-Flight (TOF) detector has faster readout than the TPC, the fraction of TPC tracks matched to TOF hits is also used to reject uncorrelated events. Additionally, events with noisy trigger towers, defined as those having a hit frequency greater than 5 from the average of all towers, are rejected. After offline cuts for event quality, the integrated luminosity for collisions accepted for the analysis is 3.9 .
Charged-particle tracks are reconstructed offline using hits in the TPC. Global tracks are defined as charged-particle tracks having at least 5 out of the maximum 45 hits possible in the TPC. Primary tracks are a subset of the global tracks, having distance of closest approach to the primary vertex less than 3 cm. The primary vertex position in the beam direction, denoted , is determined as the average position of these tracks extrapolated to the beamline. The primary vertex is then included in the momentum fit for primary tracks.
For collisions, centrality is determined using the multiplicity of global tracks that have at least 10 hits in the TPC; a distance of closest approach to the primary vertex less than 3 cm; and . The luminosity dependence of the centrality determination is accounted for, using the average instantaneous coincidence rate in the ZDCs. The variation in acceptance with vertex position is corrected by weighting to the charged-track multiplicity distribution, to render the average charged-track multiplicity uniform as a function of . In this analysis, “central collisions” refers to the event population with multiplicity in the highest 15% interval of the multiplicity distribution for all hadronic interactions.
Jet reconstruction uses primary tracks. The primary track acceptance is and , over the full azimuth. Additional primary-track selection criteria require the track to have more than 15 TPC hits, and the ratio of the number of its measured hits over the maximum possible (depending upon track geometry) to be greater than 52. The primary-track yield with is negligible for both collision systems. The primary-track efficiency is 60% at and 72% for in central collisions, and 82% for in collisions (see Ref. [65] for details). The primary-track momentum resolution is approximately [], for both central and collisions.
Detector simulations are carried out using GEANT3 [66] with a detailed model of the STAR detector. Simulations based on the PYTHIA Monte Carlo event generator are used both to calculate the instrumental response to correct for detector effects and for physics studies. Events produced by Monte Carlo generation without detector simulations are denoted “particle-level,” whereas such events including detector simulations are denoted “detector-level.”
Several PYTHIA tunes are employed: PYTHIA-6 [67] Perugia 0 [68]; PYTHIA-6 Perugia 2012 STAR tune [69]; and PYTHIA-8 Monash [70]. The reason for using multiple PYTHIA tunes is historical, since different elements of the analysis, such as detector-level simulations, were carried out at different times by different sub-groups. The tune used for each analysis element is specified. Physics studies focus on comparison to PYTHIA-6 Perugia 2012 STAR tune (denoted “PYTHIA-6 STAR tune”).
3 Theoretical calculations
In the companion Letter [59], results are compared to the following theoretical calculations that incorporate jet interactions with the QGP:
-
•
Jet-fluid model [72]: Initial conditions and the jet shower evolution are generated by PYTHIA. The QGP is modeled using 2+1 dimensional VISHNU hydrodynamics [73]. Jet propagation takes into account both elastic and inelastic energy loss, with latter calculated using the Higher Twist (HT) formalism, as well as -broadening. Only the jet shower is modified; jet-induced medium excitation (“back-reaction”) is not considered.
-
•
Linear Boltzmann Transport (LBT) model [74]: Jet generation and shower evolution are calculated using PYTHIA. The QGP is modeled using CLVisc 3+1 dimensional viscous hydrodynamics [75] with AMPT initial conditions [76]. Jet propagation in the QGP includes both elastic and inelastic processes, with the latter calculated using the HT formalism. Back-reaction to the QGP medium arises from rescattering of thermal recoil partons with jet shower partons. The linear approximation corresponds to such rescatterings only occurring between jet and thermal medium partons. Energy and momentum are explicitly conserved.
-
•
Coupled Linear Boltzmann Transport and hydro (CoLBT-hydro) model [77, 78]: modifies the LBT model by including jet-induced medium excitation in the hydrodynamic evolution, thereby relaxing the linear approximation. This extends the applicability of the model to the case in which the medium excitation is similar in magnitude to the local thermal parton density.
-
•
Soft Collinear Effective Theory (SCET) model [53, 79]: Photon-jet distributions are calculated using PYTHIA. The QGP has initial energy density proportional on average to participant number density, with event-by-event fluctuations, and evolves according to 2+1 dimensional viscous hydrodynamics. Jet-medium inelastic interactions are calculated using the GLV approach at first order in opacity, with a soft gluon emission approximation. Elastic interactions are also included. Energy loss is controlled by a variable coupling strength, with relative energy loss of quarks and gluons proportional to their color charges. Excitation of the QGP medium is equated with the jet energy transported beyond the jet cone radius .
-
•
Hybrid model [80, 81]. Hard processes are generated by PYTHIA, with the jet shower evolved by PYTHIA down to a cutoff virtuality GeV. The jet showers are embedded in a hydrodynamically expanding medium and interact with it non-pertubatively, using a holographic expression for energy loss derived from gauge/gravity duality. Energy and momentum lost by the interacting jet are absorbed by the QGP, manifesting as a wake of soft particles surrounding the jet. Generation of the wake can optionally be switched off.
4 Analysis overview
STAR has previously reported measurements of +hadron and +hadron coincidence distributions in and collisions [58, 60], and semi-inclusive distributions of charged-particle jets recoiling from high- charged-hadron triggers in collisions [49], both at GeV. These analyses required the development of new procedures to enable systematically well-controlled measurements in the large-background environment of central collisions.
The analysis reported here combines these new approaches to measure semi-inclusive distributions of charged-particle jets recoiling from high- and triggers in and collisions at GeV. While we follow closely the procedures in Refs. [58, 49], this analysis utilizes different datasets, and its performance and systematic uncertainties must therefore be evaluated in full. This section presents an overview of the analysis strategy and approach, with details provided in subsequent sections.
4.1 Semi-inclusive distributions
Jet measurements in the high-multiplicity environment of a heavy-ion collision are complex, due to the large uncorrelated background. Reconstructed jets in this environment therefore can have contributions from physical jets generated by the hard process of interest (inclusive or triggered-coincidence production); physical jets generated by other hard processes (multiple high- partonic interactions, or MPIs); and a combinatorial component comprising hadrons from soft (low-) interactions. The analysis must remove the jet yield component that is not correlated with the process of interest (which may not include MPIs, depending upon the application), and then correct the smearing due to the residual uncorrelated contribution [40, 49, 82].
Semi-inclusive measurements enable data-driven procedures for such corrections over broad phase space [40, 49]. In this approach, the event selection and jet measurement are carried out in separate steps. Events are first selected using a simple trigger condition, with the trigger particle distribution sampled inclusively. Jet reconstruction is then carried out on the selected events and the number of jets in a defined recoil acceptance is counted, without any requirements on the jet population beyond acceptance.
The measured semi-inclusive distribution, corresponding to the distribution of recoil jets normalized to the number of trigger particles, is equivalent in the absence of background to the ratio of two production cross sections [40, 49]:
| (1) |
where is the recoil-jet transverse momentum; is the azimuthal angular separation between trigger and recoil jet; is the inclusive production cross section for the trigger particle; and is the production cross section for both trigger and recoil jet in the acceptance. Preferred trigger particles satisfy two criteria: they can be measured precisely in central collisions without complex event-wise background corrections; and the cross sections in Eq. 1 can be calculated perturbatively. Preferred trigger particles are therefore charged hadrons, , direct photons, and (at the LHC) -bosons.
Since jets do not play a role in event selection in the semi-inclusive approach, selection bias is induced solely by the choice of trigger [40, 49]. This analysis employs both and triggers, whose event-selection biases are expected to differ. These differences include:
-
•
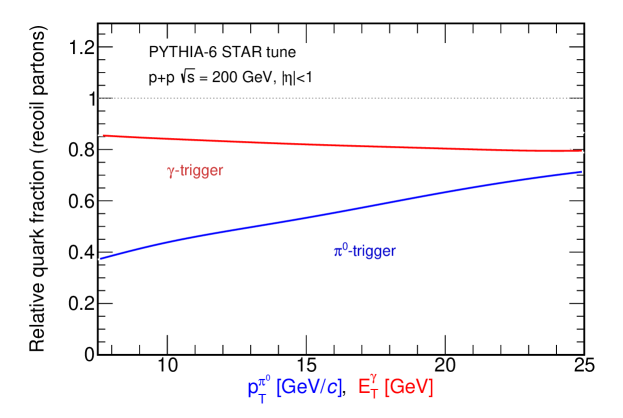
Relative contribution to recoil-jet population: High- and high- are generated by different distributions of partonic scattering processes [83]. Figure 1 shows a calculation illustrating this, using events generated by PYTHIA for collisions at GeV. Events containing a high- and high- are selected and the relative fraction of quarks in the population of recoil partons is determined.111This calculation assumes a LO () production process and identifies the “recoil parton” in each PYTHIA event as the highest-energy parton within the same recoil acceptance as the data analysis. Accounting for additional QCD effects requires theoretical considerations that are beyond the scope of this study. The quark fraction of recoil partons is seen to be significantly larger for than for triggers at the same value of or , for the range considered in this analysis ( GeV, see Sect. 5).
-
•
In-medium path-length distribution of recoil jets: Due to the interplay of the inclusive -distribution, fragmentation function, and energy loss effects, observed high- are expected to arise predominantly from the fragmentation of jets that have experienced little energy loss due to quenching, corresponding predominantly to jets generated at the periphery of the QGP fireball and headed outward [57, 84, 85, 86]. In that case, the in-medium path-length distribution of jets recoiling from triggers is biased towards larger values than that of the inclusive jet population [40, 49]. Since do not lose energy due to jet quenching, jets recoiling from triggers do not have such a path-length bias; their in-medium path-length distribution is the same as that of the inclusive jet population.
-
•
Event-Plane (EP) orientation: A correlation between high- hadron production and EP orientation (observed second-order plane of symmetry constructed from the soft hadron distribution) has been observed in collisions [87]. In this analysis, for triggers such a correlation could generate a dependence of background yield on the relative orientation of the trigger and EP, and possibly an in-medium path-length bias for the recoiling jet population. The EP-orientation dependence of the recoil spectrum was measured in the previous +jet analyses, with negligible dependence found for central collisions at both RHIC and the LHC [40, 49]. No such dependence is expected for triggers.
We note that the selection-bias effects we discuss here are expectations based on model calculations. We return to these expectations in Sect. 13, when comparing the measured recoil-jet distributions for and triggers.
4.2 Recoil-jet measurement
For events accepted by the trigger selection, jet reconstruction is carried out with charged particles using the algorithm [61] with resolution parameters and 0.5. Detailed discussion of jet reconstruction is presented in Sect. 6. Recoil jets are accepted in and , where is the pseudo-rapidity of the jet centroid. Corrections to the two-dimensional distribution, which are a function of and , are applied to account for uncorrelated jet yield and -smearing due to background. These corrections are carried out separately: first a “vertical” correction to subtract uncorrelated-jet yield, followed by a “horizontal” correction for -smearing of the distribution of correlated yield (Sect. 10).
The goal of the analysis is to measure the recoil-jet yield over broad phase space, including low and large where the ratio of trigger-correlated signal and uncorrelated background yield (S/B) is small. The correction for uncorrelated yield must be fully data-driven, in order to achieve high systematic precision in the region of small S/B. Since individual hadrons cannot be attributed uniquely to a trigger-correlated recoil jet or to uncorrelated background, such corrections are carried out statistically, i.e. at the level of ensemble-averaged distributions [40, 49].
Two related but distinct statistical approaches have been developed to determine the uncorrelated recoil-jet yield distribution. The ALICE collaboration utilizes two different ranges of for this purpose (“Signal” and “Reference”) [40] , while the STAR collaboration utilizes a distribution constructed from mixed events in place of the Reference distribution [49]. In both approaches, the raw value of is first shifted by the estimated median level of uncorrelated -density in each event, scaled by the jet area [88]. The resulting distribution, , is peaked near , with approximately half of all jet candidates having [40, 49] (see Sect. 6).
The Signal and Reference (ALICE) or ME (STAR) distributions in the region of large negative are found to have identical shape to high precision, indicating that this region is strongly dominated by uncorrelated yield [40, 49], and is therefore the optimal region for precise normalization of the Reference or ME distribution. After normalization, the correlated recoil-jet yield distribution is determined by subtraction. This difference distribution is subsequently corrected for smearing in and using unfolding techniques. This statistical approach enables systematically well-controlled measurements of recoil-jet yield with small S/B over the entire physically-allowed phase space, without the need to impose a fragmentation bias on the recoil-jet population in order to suppress backgrounds [49].
The ALICE -difference and STAR ME approaches to uncorrelated background correction are compared in Ref. [49]. The key distinction between them is that the trigger-difference approach subtracts all uncorrelated recoil yield, including physical jets generated by MPIs, whereas the ME approach does not subtract jets arising from MPIs. This difference was found to have negligible effect for +jet correlations in central collisions at GeV [49].
4.3 Observables
The trigger-normalized jet yield in the recoil acceptance is defined as
| (2) |
where is the jet reconstruction resolution parameter. The distribution is also differential in jet pseudo-rapidity , which is not specified for clarity. All distributions are normalized to unit interval in . This definition applies for both and collisions, and for both raw and fully corrected distributions. The collision system and level of correction are indicated by superscripts, where needed.
Jet energy loss due to jet quenching is measured by the ratio of corrected trigger-normalized jet yields in central and collisions,
| (3) |
The transverse broadening of jet structure due to quenching is measured by the ratio of trigger-normalized recoil-jet yields at small and larger separately in and collisions,
| (4) |
where refers to either or . This ratio is less than unity for inclusive jets in collisions, reflecting jet shapes in vacuum [89, 90, 40, 91, 92]. To date, no significant medium-induced transverse broadening has been observed in semi-inclusive measurements [40, 49].
We note that interpretation of the ratio in Eq. 4 in terms of jet broadening requires corresponding jet populations in the numerator and denominator, i.e. jet reconstruction does not split a single jet reconstructed with large into multiple jets reconstructed with small at a significant rate. As discussed in Sect. 13.3, that condition may not hold in this analysis for very low- jets, for which .
5 Measurement of and triggers
The measurement of and triggers in this analysis uses the same procedures as in Ref. [58]. Events are selected online using the trigger. Offline analysis further selects events containing electromagnetic showers with GeV measured in one or two adjacent BEMC towers. This range is chosen such that the -decay opening angle is small enough that the two photons are likely to hit the same tower, but not so small that the transverse shower profile measured in the BSMD is indistinguishable from that for a single photon. The threshold value of GeV is optimal for identifying triggers, with efficiency significantly lower for GeV. In addition, the threshold value of 9 GeV is large enough that there is significant recoil-jet yield, while also providing sufficient dynamic range for the measurement of three bins in .
Discrimination of and showers utilizes the transverse-shower shape measured by the BSMD. Although the opening angle for the two decay photons from a is small enough that they typically hit the same or neighboring towers, the resulting electromagnetic shower in the BSMD is broader than that of a single photon.
Each BEMC tower subtends , and each set of 15 and 15 BSMD strips overlapping a BEMC tower subtends . For the shower-shape analysis, BSMD and strips are clustered [58], and clusters whose central strips overlap geometrically with the BEMC trigger tower are identified. The intersection of the central and BSMD strips in a cluster, determined by the strip with the largest energy relative to adjacent strips in both and , localizes the centroid of the shower with spatial resolution of 0.007 radians. The BEMC tower overlapping the centroid is identified as the central tower of the cluster if it also has an energy of at least 6 GeV. If the shower centroid falls within 0.018 radians of the edge of the triggering tower, then the nearest tower is also included in the energy measurement. Charged-particle tracks are projected to the face of the BEMC, and trigger towers that contain the projection of a track with are rejected.
The shower shape is quantified by the Transverse Shower Profile (TSP), defined as , where is the BEMC trigger-tower energy; is the energy of the -th BSMD strip; is the distance between the -th strip and the center of the cluster, and the sum runs over the 15 strips in and which define the BSMD cluster. The value of for the central strip is taken to be half the distance between strips. The value of the exponent, 1.5, was determined by optimizing / discrimination using a GEANT simulation [58].
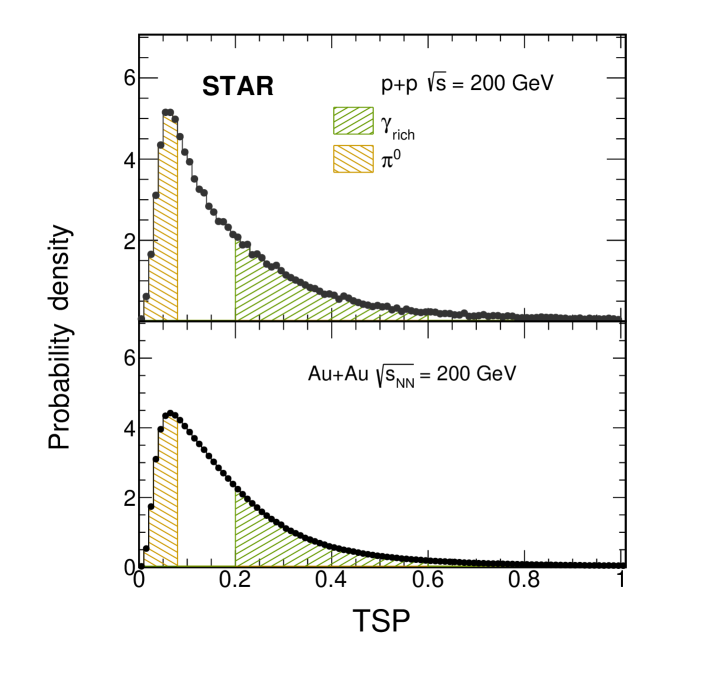
Figure 2 shows the TSP distribution measured in central and collisions. The TSP cut labeled , corresponding to , generates a shower population with purity greater than 95%. However, such high purity cannot be achieved for with a TSP cut. Rather, a population is selected by , which contains a significant admixture of triggers and photons from and decays, whose fraction is measured using the relative rate of near-side hadrons (where proximity is determined from the relative azimuthal angle ) as a function of (Sect. 8).
Based on these TSP cuts, the central dataset contains about 56000 and 134000 triggers, while the dataset contains about 18000 and 24000 triggers. These trigger populations are then divided into bins with in the ranges [9,11], [11,15] and [15,20] GeV. The number of triggers in each bin is shown in Tab. 1.
| [GeV] | central | |||
|---|---|---|---|---|
| [9,11] | 12869 | 15232 | 40437 | 83804 |
| [11,15] | 4918 | 7328 | 14262 | 42279 |
| [15,20] | 699 | 1522 | 1553 | 8353 |
The semi-inclusive recoil-jet distribution corresponding to pure triggers is then determined statistically from the - and -triggered recoil-jet distributions (Sect. 8).
6 Jet reconstruction
Jet reconstruction utilizes the approach described in Ref. [49], for both and central collisions. As discussed in Sect. 4.2, in central collisions the correction for uncorrelated background yield is carried out statistically, i.e. at the level of ensemble-averaged distributions, without discrimination of individual jets as signal or background. The output of the jet reconstruction algorithm is therefore referred to as a population of “jet candidates.”
The analysis is carried out in several steps, each with a different specification of . To distinguish the different types of jet candidate we utilize the notation defined in Ref. [49]: refers to generated by the jet reconstruction algorithm; is adjusted by (Eq. 6), the estimated uncorrelated background contribution ; and is of jet candidates after full correction for the effects of instrumental response and background fluctuations. For the simulation of collisions, is the reconstructed jet energy at the particle-level and is at the detector level.
Jets are reconstructed from accepted charged tracks using the [8] and [61] algorithms with the -recombination scheme [8]. Jet area is measured using the FastJet active-area approach with ghost-particle area of 0.01 [93].
In both and central collisions, jet reconstruction is carried out twice. The first reconstruction pass uses the algorithm with = 0.2 and 0.5 to estimate the background transverse-momentum density in the event [88],
| (5) |
where labels the jets in the event, and and are the transverse momentum and area of jet . The median is calculated by excluding the hardest jet in the event for collisions, and the two hardest jets for central collisions [49].
The second jet reconstruction pass is then carried out using the algorithm with and 0.5. Jet candidates from the second pass are accepted for further analysis if their centroid satisfies . The value of from this pass is adjusted for the estimated background transverse-momentum density according to
| (6) |
In collisions, for the most probable value of is zero, while for the term is rarely greater than 1 . For central collisions the value of varies between 15 and 40 (Fig. 3), largely independent of the choice of for calculating .
6.1 Event mixing
Correction for the uncorrelated jet yield in central collisions is carried out by subtracting the normalized ME distribution from that of the same-event (SE) population, following the procedure described in [49]. In brief, event mixing creates synthetic events made up of tracks from real events, but with no two tracks in each mixed event originating from the same real event. The ME population therefore reproduces the detailed features of real events at the ensemble-averaged level but does not contain any multi-hadron correlations, including jets. The analysis is then carried out on the ME population, with the resulting distributions of “jets” providing the measurement of the contribution of purely combinatorial jet candidates to the jet candidate population in the analysis of real data.
In this analysis, event mixing utilizes 5 bins in multiplicity, 18 bins in , 2 bins in event-plane orientation, and three bins in run-averaged luminosity, for a total of 540 distinct mixing classes. As in Ref. [49], no jet candidates are excluded from the calculation for ME events.
6.2 alignment
At low the uncorrelated background is a large fraction of the total yield, and the ME subtraction therefore corresponds to taking a small difference of two large numbers. Since the recoil-jet distribution varies rapidly as a function of , it is therefore crucial that the scales of the SE and ME distribution are well-aligned [49].
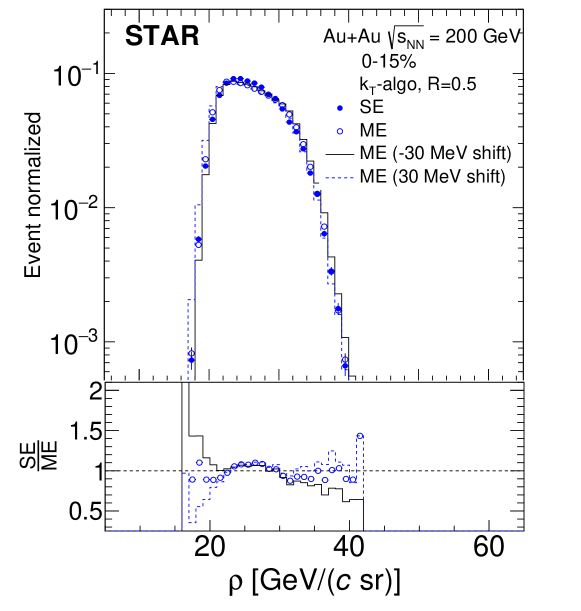
The definition of (Eq. 5) contains arbitrary choices, and is not absolutely defined. In addition, the distributions for SE and ME may differ, since the hard jet components of the SE and ME events populations differ. As shown in Ref. [49], precise alignment of the scale for the SE and ME populations can be achieved in a data-driven way, by shifting the ME distribution horizontally by a small amount. Figure 3 shows the distribution of for SE and ME events in -triggered central collisions, for -shift values of zero and MeV. The figure shows that, in practice, a -shift value of zero is close to optimal for this event selection, with a precision of MeV.
6.3 Jet area
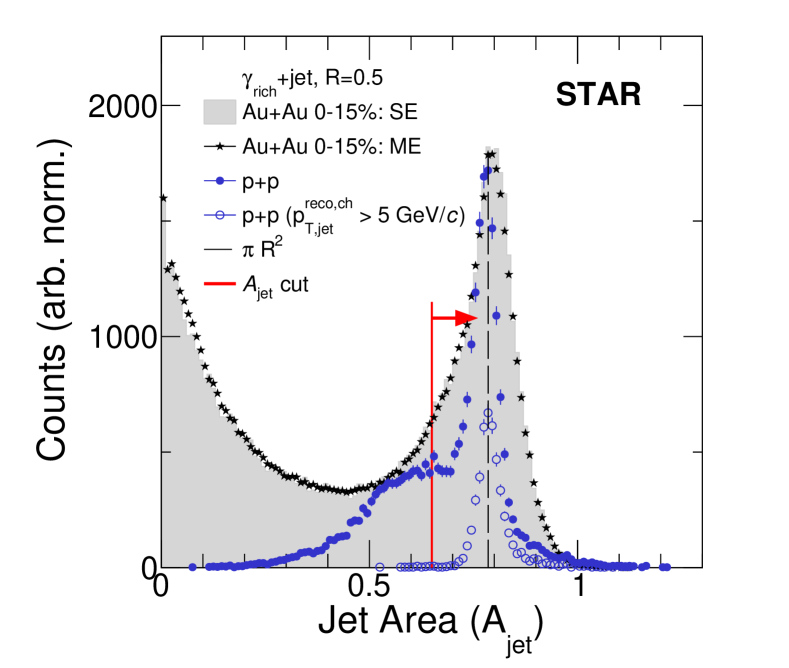
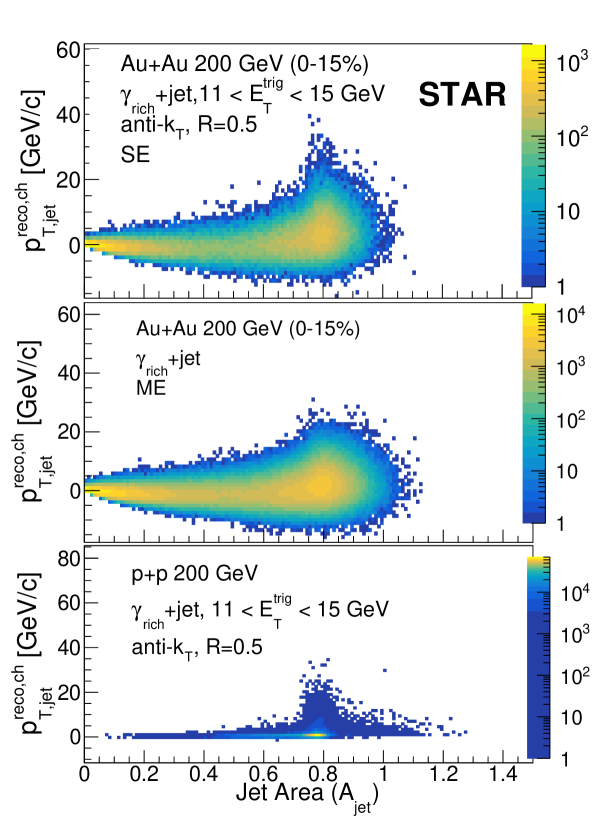
Figure 4 shows the distribution of vs. jet area for SE and ME events in central collisions, and for collisions. Figure 5 shows the projection of the distributions in Fig. 4 onto the axis for the -triggered populations with . The SE and ME distributions for central collisions agree in detail, consistent with [49]. Both distributions, as well as those for collisions, are peaked close to the value . Small-area clusters predominantly have , as shown in Fig. 4, and largely do not correspond to physical jets [49]. This background is suppressed by imposing a cut for and for , with the latter shown in Fig. 5.
7 Raw distributions and Mixed Events
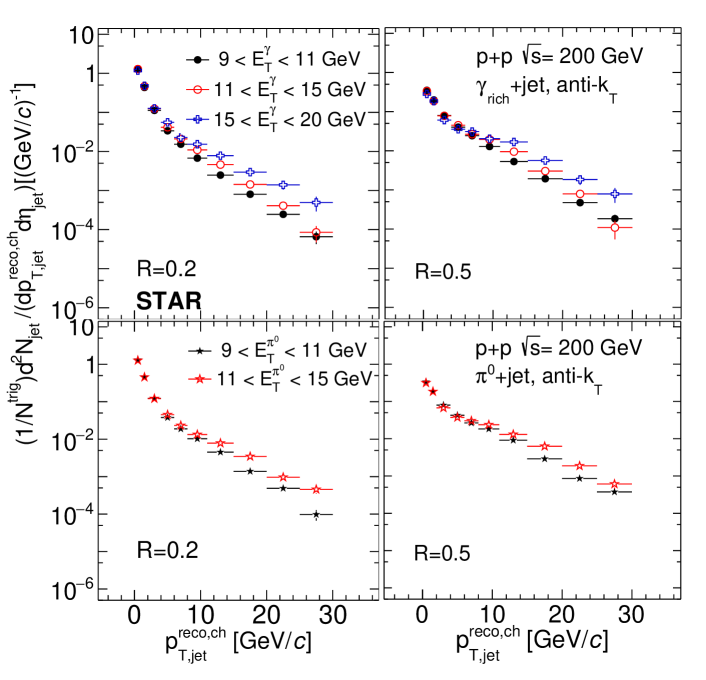
Figure 6 shows uncorrected semi-inclusive recoil-jet distributions for and 0.5 as a function of , for -triggered and -triggered collisions at GeV in the defined bins. Larger corresponds to a harder recoil-jet spectrum, as expected. For triggers with =15-20 GeV, the recoil-jet spectra are not shown because, due to limited trigger statistics (Tab. 1) the unfolding does not converge, and results for this bin are not presented in Sect. 13.1.
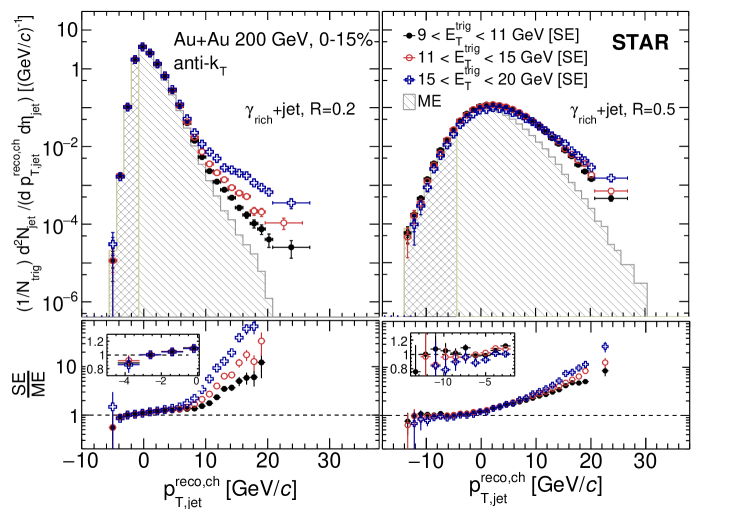
Uncorrected semi-inclusive recoil-jet distributions for central collisions are shown in Fig. 7 for triggers and in Fig. 8 for triggers. In all cases the recoil-jet yield at large positive is larger for higher values, as expected for correlated jet yields, while at lower the distributions are very similar for the different intervals. These features were also observed in Ref. [40, 49].
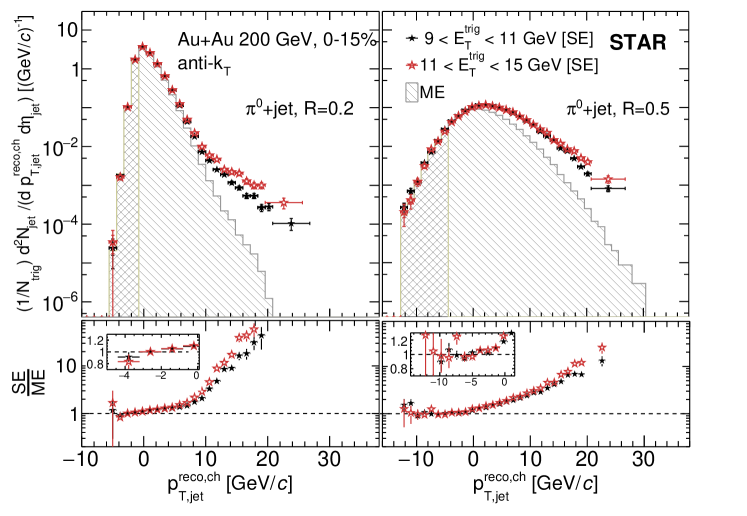
Figures 7 and 8 also show distributions for ME populations, with the hatched region showing the ME normalization range. Figures 7 and 8, bottom panels, show that the yield ratio SE/ME in the far negative region has weak (for ) or negligible (for ) dependence on , as expected if this region is dominated by uncorrelated background yield [40, 49]. This region is therefore used to normalize the ME distribution. The ensemble-averaged distribution of trigger-correlated recoil-jet yield is given by the difference of the SE and normalized ME distributions [40, 49].
| Trigger | [GeV] | Integral | ME norm [] | |||
| SE | ME | |||||
| 0.2 | [9,11] | 12.72 | 12.60 | [-10,2] | ||
| [11,15] | 12.73 | 12.60 | [-10,2] | |||
| [15,20] | 12.73 | 12.60 | [-10,2] | |||
| 0.5 | [9,11] | 1.22 | 1.18 | [-20,-5] | ||
| [11,15] | 1.23 | 1.19 | [-20,-5] | |||
| [15,20] | 1.23 | 1.18 | [-20,-5] | |||
| 0.2 | [9,11] | 12.73 | 12.64 | [-10,2] | ||
| [11,15] | 12.72 | 12.64 | [-10,2] | |||
| 0.5 | [9,11] | 1.23 | 1.17 | [-20,-5] | ||
| [11,15] | 1.23 | 1.17 | [-20,-5] | |||
Table 2 gives the recoil-jet yield integrals of the SE and ME distributions prior to normalization, which agree within . Such invariance of the recoil-jet yield integral (or equivalently, jet density) has been observed in other high-multiplicity analyses [40, 49]. This invariance is consistent with the resilience of jet reconstruction against distortion by large backgrounds [61], and it plays an important role in this analysis approach. Table 2 also gives the values of the ME normalization factor , which are similar to those in Ref. [49].
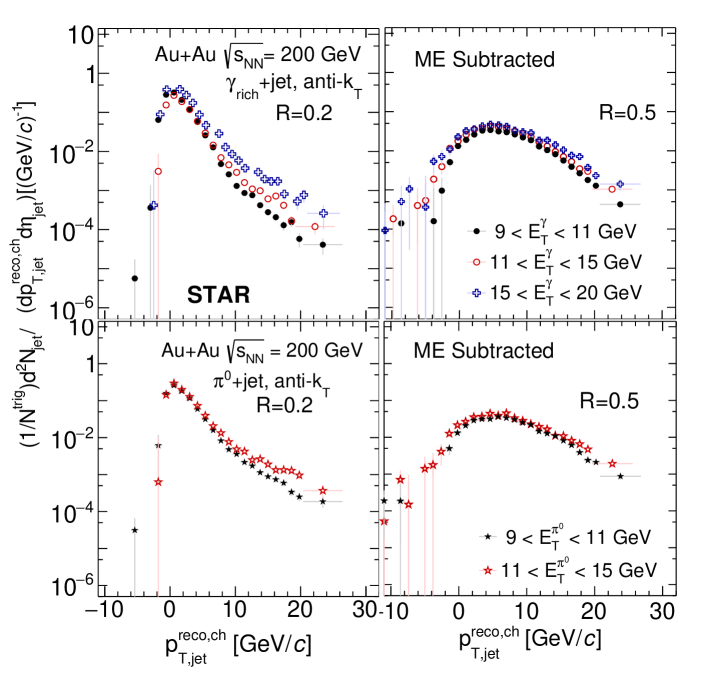
Figure 9 shows the result of subtracting the normalized ME distributions from the SE distributions in Figs. 7 and 8. These are distributions after correction for uncorrelated background yield, and used in the further analysis. Because the vertical axes have logarithmic scale, bins with negative values from the subtraction cannot be shown; however, these bins all have values consistent with statistical fluctuations.
Since the subtraction at low and negative values of corresponds to taking a small difference of two large numbers, large oscillations can arise if the two distributions are not aligned precisely. However, all difference distributions in Fig. 9 are seen to be well-behaved, without large oscillations or other non-monotonic features at low , which provides independent validation of the alignment discussed in Sect. 6.2.
8 Extraction of +jet distributions
The -trigger population is an admixture of direct photons, decay photons from asymmetrically decaying and from decays, and fragmentation photons. As mentioned in Sect. 5, the ansatz that direct photons have no near-side correlated hadron yield is used to correct +jet to +jet distributions, with the +jet yield used as a measure of the jets recoiling from background triggers. This is the same method as was used in Ref. [58].
The -triggered semi-inclusive recoil-jet yield, (), is defined as
| (7) |
Here (), (), and () represent the trigger-normalized recoil-jet yield as a function of for , , and triggers, respectively. The factor (1-) represents the purity of in the sample. The purity of the -trigger sample is estimated from simulation to be greater than % for all bins, satisfying the high-purity condition necessary for this correction procedure. Systematic studies show negligible dependence of the fully corrected recoil-jet spectrum on the value of purity between 95 and 100%.
The calculation of () can be performed both on the corrected (unfolded) recoil-jet spectra, and on the raw spectra before unfolding. If statistics are limited, subtraction before unfolding is preferable because unfolding may not converge. For collisions, the default method is to subtract the unfolded -triggered spectrum from the unfolded +jet spectrum, for all bins except =15-20 GeV. For =15-20 GeV, the -triggered recoil-jet spectrum is not statistically precise enough for unfolding to converge reliably, so subtraction is carried out before unfolding. For collision, the default method for all bins is to subtract before unfolding. Where possible, the alternate method was checked for consistency with the default method.
The purity of triggers in the population is determined by applying the ansatz that triggers do not have a correlated near-side yield of charged hadrons within relative azimuthal angle . The fraction of background triggers is then determined statistically for each bin using the near-side correlated charged-hadron yields, as was done in Ref. [58].
The ratio of correlated yields is defined as
| (8) |
where is the near-side ( rad) yield of charged hadrons per trigger and is the near-side yield per trigger, after subtracting the uncorrelated background of charged hadrons. The value of is determined for different ranges of , for and . The uncorrelated background is determined from the measured yield outside of the near-side peak region in , where this region is varied to determine the systematic uncertainty in the uncorrelated background subtraction. At low , where the relative uncorrelated yield is high, this is the dominant uncertainty, while at high the statistical error dominates. For each selection, the value of is determined from averaging the ratios (Eq. 8) for the different ranges. The uncertainty in includes the uncertainty in the uncorrelated background subtraction.
All correlated charged tracks for triggers are attributed to background (, photons from and decays, and fragmentation photons) in the trigger sample. The subtraction of the recoil-jet yield due to background triggers (Eq. 7) is carried out assuming that the correlated yield and the recoil-jet distribution associated with the background triggers is the same as that measured for triggers.
We assume that the recoil-jet distribution for high- -meson triggers is the same as that for -meson triggers, based on both simulation and measurements at RHIC [94, 95]. This assumption also applies to photons from and decays because the trigger requirement biases towards asymmetric decay, such that the decay photon carries most of the parent-meson energy. This was verified in simulation by comparing the mean of the parent meson, for which the decay photon falls within a given selection, to the mean of the symmetrically decaying that passes the TSP cut and falls into the same selection. For and GeV, the difference is approximately 5%, while it is % for GeV. However, the associated-hadron yield for fragmentation photons is not well known. Therefore, the fragmentation photons are only subtracted to the extent that their near-side correlated hadron yields are similar to those of .
For central collisions, the purity of in the sample varies between % and %, from lowest to highest . For collisions, the purity of varies between % and %, from lowest to highest . The higher value of purity in the central data compared to data arises from the suppression of yield due to jet quenching in collisions [96].
9 resolution
The and -trigger particles are measured using the BEMC and BSMD detectors (Sect. 5). The measurement of is affected by the intrinsic energy resolution of the BEMC and by energy leakage to neighboring towers that is not accounted for by the clustering algorithm. To quantify this distortion, the Trigger Energy Scale (TES) and Trigger Energy Resolution (TER) are determined using the STAR GEANT3 simulation.
This study utilizes a simple particle gun simulation, in which single and particles are generated with a uniform distribution in the range GeV, and with uniform spatial distribution on a regular grid in (), with spacing of 0.6 radians (12 towers) and 0.3 radians (6 towers) for and particles, respectively. This approach enables multiple particles to be simulated per event without overlapping signals in the BEMC. The larger spacing for prevents overlap of decay photons from other . The generated events are then passed through the STAR GEANT3 simulation with the detector configuration corresponding to the 2009 run.
The simulated BEMC showers for and particles are clustered with the same algorithm as is used for data, applying the same TSP cuts. Clusters are matched to the simulated particles in () phase space, based on the projected position of the particle on the face of the BEMC towers.
We denote of the and at the generated level as and ; at the reconstructed level as and ; and at the matched level as and . Note that the matched-level is the generated-level for a particle reconstructed within our selection ranges.
| TES | TER | TES | TER | |||
| (%) | (%) | (%) | (%) | |||
| 9 - 11 | 10.5 | 10.2 | ||||
| 11 - 15 | 11.8 | 12.7 | ||||
| 15 - 20 | 16.8 | |||||
The values of the TES and TER are determined from the ratio of the reconstructed to the generated for matched clusters,
| (9) |
similarly for . The distribution is calculated by weighting the uniformly-generated particles by a physical distribution. The resulting distribution is fit with a Gaussian function, the mean of which is the TES and the RMS of which is the TER.
Table 3 gives the values of TES and TER for and in the bins of this analysis. The TES values for are smaller than those for , due to larger probability of energy leakage into neighboring towers that is not recovered by the clustering algorithm. Table 3 also gives values of for different trigger selections, calculated using the smearing weights, assuming the trigger spectrum shape for is that generated by PYTHIA-6 STAR tune. For triggers with GeV, the mean is higher than the mean of the physical spectrum (9.8 GeV) in the interval GeV. However, for with GeV, the mean is lower than the mean of the physical spectrum (12.2 GeV) due to the TSP selection bias toward wider showers. The TSP selection biases the population to lower , which has larger opening angle on average.
The trigger resolution arises from the intrinsic responses of the BEMC and BSMD, which at high experience negligible influence from the overall event environment. The values of TES and TER should therefore be similar for and central collisions. This was studied by comparing distributions for and found in PYTHIA-6 STAR tune di-jet events, embedded in the 2009 and the 2014 data and analysed using the algorithm described in Sect. 5. For triggers the event background does not significantly shift or broaden the distribution. For triggers, there is a small (1–3%) broadening of the resolution in the events compared to events, but no significant shift in the scale.
No correction for TES and TER is applied in the data analysis. For precise comparison of theoretical calculations to the measurements, the calculated distributions should therefore be smeared to account for the TES and TER effects. Weight factors are provided here for that purpose, to be applied bin-wise in to a theoretically calculated recoil-jet distribution. In order to be able to apply the weighting, the theory calculation should record recoil jets for triggers with between 6 and 30 GeV, storing the recoil-jet spectrum in 1 GeV increments of . The weights are defined as the relative probability of a photon with calculated value to contribute to a bin in measured ,
| (10) |
where the last expression uses Bayes’s Theorem.
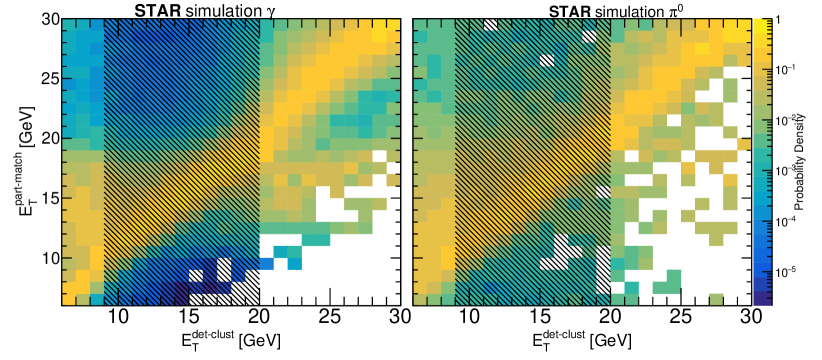
Figure 10 shows the 2-D correlation of matched (generated) vs. reconstructed (detector-level) , with a uniform (flat) distribution in . Vertical slices in this distribution represent the probability distribution for a bin of generated-level () to contribute to the bin of detector-level (). The weight factors are calculated from the 2-D distribution in using the last expression in Eq. 10, by projecting out the distributions for a given selection of (e.g. 11–15 GeV). This selection interval in corresponds to the factor in Eq. 10.
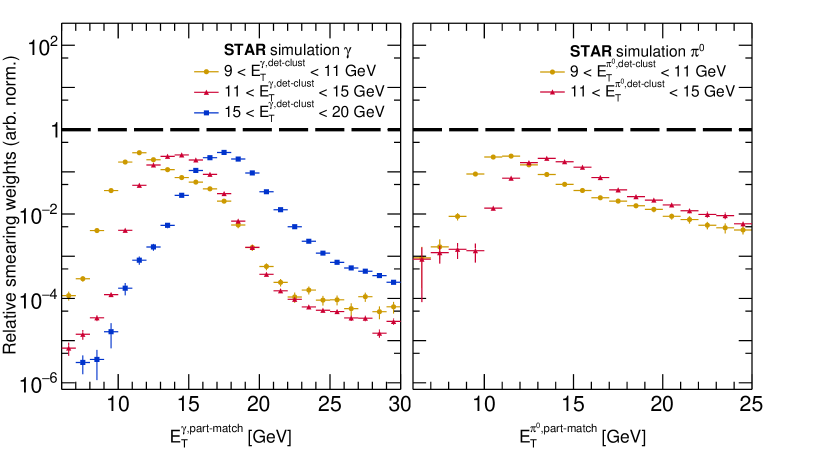
Since a uniform distribution is used to generate Fig. 10, the factor is simply a scaling factor that has no effect on the relative weighting. The integral of for each selection in is therefore arbitrarily normalized to unit integral. This distribution is the relative weight factor to be applied as a function of for a given selection in . The distributions for both trigger types and all ranges are shown in Fig. 11.
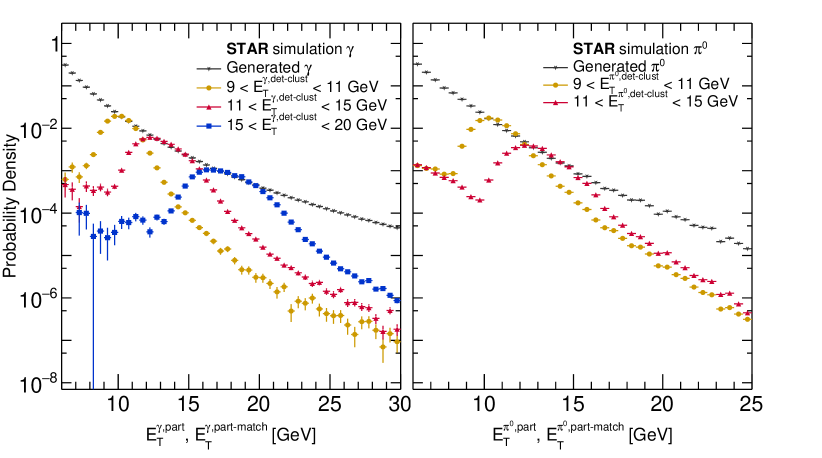
As an example, Fig. 12 shows the effect of scaling a physical trigger- spectrum generated by PYTHIA by from Fig. 11. The generated trigger spectra for photons (left) and (right) are shown as black stars. The other markers show the resulting distributions of for the different bins of , with the weight factors from Fig. 11 applied to the . These distributions have been normalized to conserve the number of triggers. For example, for the detector-level selection GeV, the integral over GeV is equal to the integral over GeV.
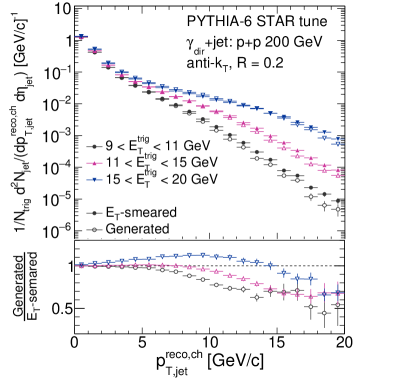
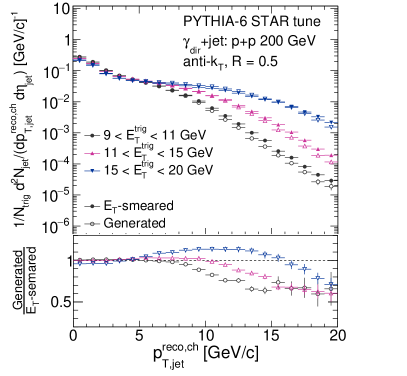
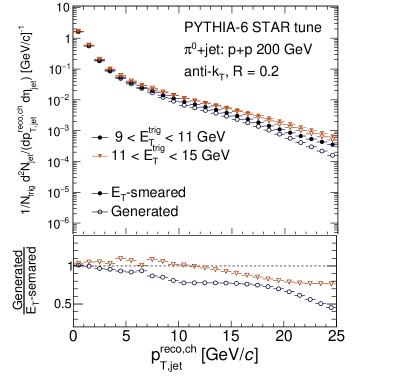
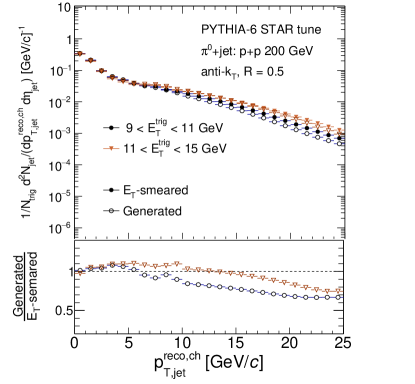
To illustrate the effect of the TES/TER on the recoil-jet spectra, the weighting factors in Fig. 11 are applied to -dependent jet spectra from PYTHIA-6 STAR tune. Figures 13 and 14 show PYTHIA-6 STAR tune recoil-jet spectra before (open markers) and after the weighting (filled markers). For the open markers, and triggers were selected in the ranges of this analysis. For the filled markers, and were accepted for GeV and then re-weighted for each selection, as described above. Note that simply restricting the range in order to match the sampled average ( in Tab. 3) is not equivalent.
10 Corrections
The distribution of trigger-correlated jet yield is obtained by subtracting the normalized ME distribution from the SE distribution, as discussed in Sect. 7. This correlated-yield distribution must then be corrected for -smearing due to instrumental effects in both and central collisions, and to background fluctuations in central collisions.
10.1 Instrumental effects
10.1.1 collisions
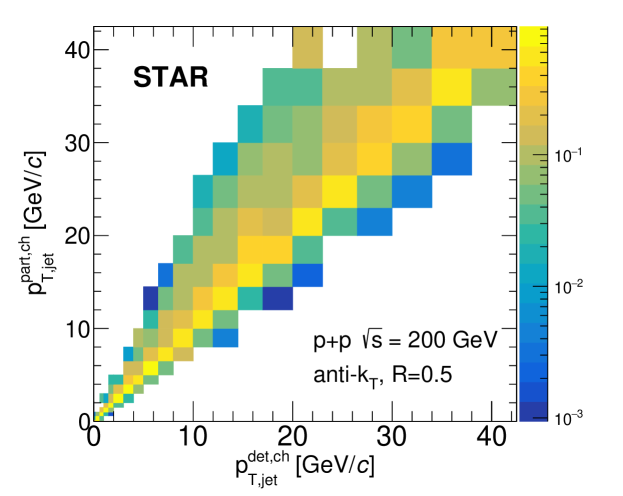
Instrumental effects for collisions at GeV are determined using simulated di-jet events generated by PYTHIA 6.42, Perugia 0 tune. These events are passed through the STAR GEANT3 simulation to produce detector-level events, which are embedded into real zero-bias collision events at GeV from the 2009 RHIC run to emulate pile-up effects.
Jet reconstruction is then carried out on both the particle-level and detector-level events. Recoil jets at the particle and detector levels are matched by requiring that the distance between jet axes , and . The jet-matching efficiency is the fraction of particle-level jets that are matched to detector-level jets.
10.1.2 collisions
The charged-particle tracking efficiency for central collisions is determined by embedding detector-level simulated tracks for pions, kaons, and protons into real events. The charged-particle tracking efficiency corresponds to the weighted average of efficiencies for individual species, with the weighting based on measurements of the relative inclusive particle yield for each species [97].
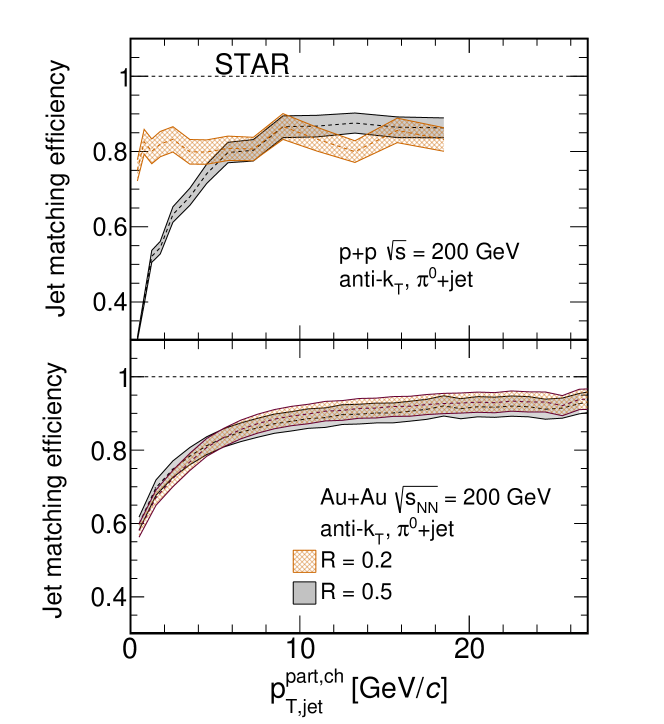
The instrumental response matrix is calculated using PYTHIA 8.185 to generate -triggered and -triggered events for collisions at GeV. These particle-level events are passed through a fast simulator incorporating a parametrization of the charged-particle tracking response for collisions. Jet reconstruction is run on the resulting detector-level particles. Matching between particle-level and detector-level recoil jets is carried out as described above for collisions, except that is only required to be at least 15% of , consistent with [49]. Figure 16, lower panel, shows the jet-matching efficiency for central collisions.
The jet-matching efficiencies for and collisions in Fig. 16 differ significantly. These differences arise from the different criteria for matching particle- and detector-level jets, with more stringent matching requirement for collisions. In addition, the jet-matching efficiency for the small resolution-parameter jets () in collisions approaches the single charged-particle efficiency and thus has a different shape than for . We note that the different matching criteria also generate differences in , with opposite effect, and it is only the combination of unfolding and the efficiency correction that is meaningful. Any residual dependence on the specific choice of matching criteria is accounted for in the systematic uncertainty.
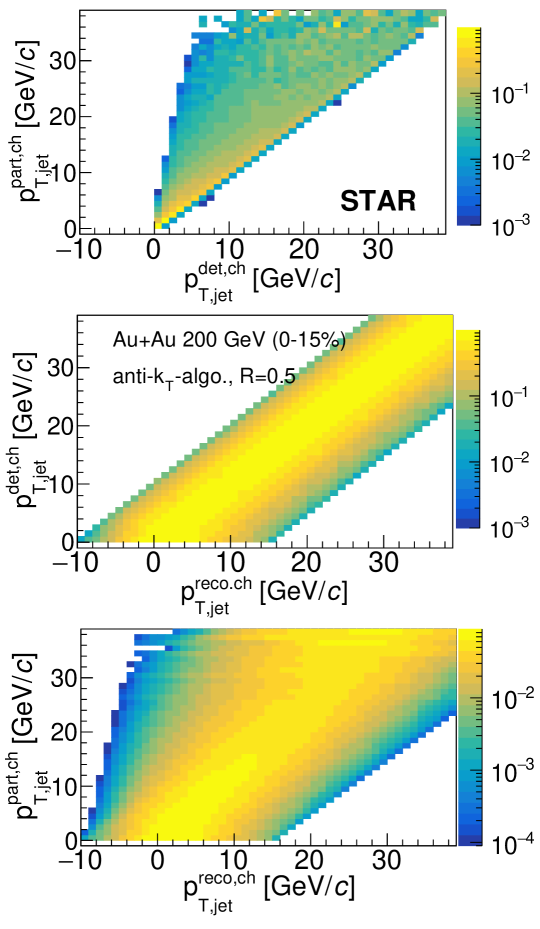
Figure 17, upper panel, shows for recoil jets with in central collisions. The other panels are discussed below.
10.1.3 Jet energy scale and resolution
While the full instrumental response matrix, , is used to correct the measured recoil-jet spectrum via unfolding, it is nevertheless valuable to characterize the instrumental response qualitatively. The instrumental response is similar in this analysis to that reported in Ref. [49], for both and collisions.
For charged-particle jets in the range , the distribution characterizing jet energy resolution (JER) has RMS %, comprising a peak with width 5-10%, with an asymmetric tail to low jet energy, with negligible -dependence. The jet energy scale (JES) uncertainty is 5%, likewise with negligible -dependence.
10.2 Uncorrelated background: collisions
We introduce the effect of uncorrelated background fluctuations on , generating a distribution of which models the measurement. This follows the embedding procedure outlined in [49], with three different classes of jet model used for systematic variation: PYTHIA-generated jets at the detector level; the same but with azimuthal correlation between trigger and the EP due to non-zero of the trigger hadron; and “Single Particle” (SP) jets in which one particle carries and is collinear with the jet centroid.
As shown in Refs. [40, 49, 82], the background response matrices for inclusive and semi-inclusive jet observables calculated by embedding PYTHIA-generated jets and SP jets are very similar, demonstrating that jet reconstruction in the heavy-ion environment is largely independent of the specific fragmentation distribution of the jet population. This in turn indicates that corrections based on this embedding procedure are likewise valid for inclusive and semi-inclusive observables of quenched jets, whose fragmentation distribution is a priori unknown. We utilize SP embedding for the primary analysis, because it provides the clearest criteria for matching particle and detector-level jets.
The uncorrelated background is, per definition, the same for -triggered and -triggered events, except for a possible EP bias. However, the EP bias in central collisions has been shown to be negligible for charged-hadron triggers [49], with the same finding in this analysis. No significant difference is observed in the response matrices for -triggered and -triggered events. We therefore focus on the response matrix for -triggered events, which is used to unfold both the -triggered and -triggered distributions. Figure 17, middle panel, shows for -triggered central collisions using SP embedding, for .
10.3 Unfolding
10.3.1 Formalism
The distribution is first corrected for uncorrelated yield by subtracting the normalized ME distribution (Sect. 7) giving the vector , the measured distribution of correlated yield. is related to the Truth distribution according to
| (11) |
where represents the cumulative response matrix from both the instrumental and heavy-ion background fluctuations. We assume that factorizes[49], such that
| (12) |
10.3.2 collisions
For collisions, uncorrelated background is negligible in the -range considered in the analysis. Only corrections for the instrumental response therefore need to be unfolded; i.e. . Determination of is described in Sect. 10.1.1.
Iterative Bayesian unfolding is used for collisions. The unfolding is regularized by restricting the number of iterations to for and for . These values were determined by the inflection point in the distribution of NDF from comparison of the backfolded distribution and the raw data, and adding one iteration. The prior distributions used in the unfolding correspond to the -triggered recoil-jet distributions from the simulation described in Sect. 10.1.1.
10.3.3 collisions
Figure 17, bottom panel, shows the combined response matrix for -triggered central collisions. Prior distributions correspond to -triggered and -triggered recoil-jet distributions generated by PYTHIA, modified by suppression of the recoil-jet yield to account for jet quenching [49].
For Iterative Bayesian unfolding, regularization corresponds to truncation of the number of iterations at values between 2 and 5. SVD unfolding is regularized by truncating the expansion at a value of the stabilization term (). This value is varied in the range 2-4, and is optimized using the value of NDF from comparing the unfolded distribution multiplied by (“backfolding”, analogous to Eq. 11) with the measured distribution .
The distributions after ME subtraction (Fig. 9) constitute the input distributions for unfolding. The distributions for drop rapidly in the region , and the full distribution is used. However, for the subtracted distributions extend to , with data points that oscillate around zero with large variance (note that negative values are not shown in Fig. 9, due to the logarithmic vertical axis).
The region of the distributions therefore has limited information content, and inclusion of that range gives unstable unfolding results. Unfolding for therefore only utilizes data from the distributions in Fig. 9 for .
11 Systematic uncertainties
Systematic uncertainties are determined following the procedures in Ref. [58, 49]. The components of the systematic uncertainty are as follows:
-
•
instrumental effects: uncertainty in tracking efficiency and resolution;
-
•
unfolding: uncertainty due to choice of regularization, prior, and algorithm;
-
•
uncorrelated background yield, collisions: uncertainty in boundary of normalization region for measuring ;
-
•
purity: uncertainty in measured value of (Eq. 8);
-
•
fragmentation model: variation in choice of Monte-Carlo model used to calculate the response matrix and jet-matching efficiency.
For each source of uncertainty, alternative unfolding solutions are generated by varying the corresponding parameter or algorithm. The variation with the largest relative difference to the baseline solution is assigned as the systematic uncertainty for that source. Variants whose unfolding does not converge or which produces anomalously large between the back-folded solution and the raw data are excluded.
11.1 collisions
The specific variations are as follows:
-
•
For the unfolding uncertainty, is varied relative to its baseline value. Several Lévy functions are used as alternative priors.
-
•
For -triggered distributions, is varied within its measured uncertainties (see Sect. 8). Near the limit of the kinematic range for jets recoiling from triggers, the uncertainty on the recoil-jet yields can be very large, as the yields can be consistent with zero.
-
•
For the instrumental uncertainty, an alternative unfolding procedure is carried out in which is constructed from -triggered recoil-jet spectra generated by PYTHIA 8.185, with a parameterized instrumental response applied. The resulting matrix is used to unfold the - and -triggered recoil-jet distributions.
-
•
Tracking efficiency in the parameterized instrumental response is varied by (absolute).
-
•
Tracking resolution in the parameterized instrumental response is quantified by a polynomial fit to the ratio of the difference between reconstructed track and matched particle-level over the matched particle-level . An alternative fit to the resolution is used as systematic variation.
-
•
The fragmentation model for the calculation of is varied by using -triggered events generated by HERWIG-7 for collisions at GeV with the default tune [101]. The difference between PYTHIA and HERWIG-derived corrections, which are found to be independent of , is assigned as the fragmentation model uncertainty. For the uncertainty is negligible for the full measured range of . For , the uncertainty is 15% at , 6% at , and negligible for .
| ; Trigger: | |||||
| Systematic uncertainty (%) | |||||
| [GeV] | [] | instr | unfold | cumulative | |
| [9,11] | 0.2 | [5,10] | 7 | 2 | 7 |
| [10,15] | 9 | 2 | 9 | ||
| [15,20] | 12 | 4 | 12 | ||
| 0.5 | [5,10] | 6 | 4 | 8 | |
| [10,15] | 10 | 4 | 11 | ||
| [15,20] | 14 | 7 | 16 | ||
| [11,15] | 0.2 | [5,10] | 7 | 1 | 7 |
| [10,15] | 8 | 2 | 8 | ||
| [15,20] | 10 | 3 | 11 | ||
| 0.5 | [5,10] | 5 | 5 | 8 | |
| [10,15] | 9 | 5 | 10 | ||
| [15,20] | 11 | 9 | 14 | ||
| ; Trigger: | ||||||
| Systematic uncertainty (%) | ||||||
| [GeV] | [] | instr | unfold | purity | cumulative | |
| [9,11] | 0.2 | [5,10] | 11 | 2 | 80 | 81 |
| 0.5 | [5,10] | 14 | 15 | 81 | 83 | |
| [11,15] | 0.2 | [5,10] | 9 | 2 | 21 | 23 |
| [10,15] | 17 | 101 | 100 | 143 | ||
| 0.5 | [5,10] | 7 | 8 | 2 | 10 | |
| [10,15] | 12 | 12 | 16 | 23 | ||
| [15,20] | 0.2 | [5,10] | 3 | 2 | 13 | 14 |
| [10,15] | 2 | 16 | 2 | 17 | ||
| [15,20] | 8 | 13 | 15 | 21 | ||
| 0.5 | [5,10] | 4 | 2 | 12 | 13 | |
| [10,15] | 3 | 2 | 12 | 16 | ||
| [15,20] | 2 | 6 | 15 | 16 | ||
11.2 collisions
The uncertainty associated with the tracking efficiency is assessed by varying the absolute efficiency by %. Corrections for the track -resolution and weak decays are found to be significantly smaller than those associated with the tracking efficiency, consistent with Ref. [49]. No systematic uncertainty due to the -resolution or weak decays is assigned.
The uncertainty due to the choice of unfolding algorithm was assessed by comparing the results of the SVD algorithm to the alternative Iterative Bayesian algorithm. Uncertainty due to the choice of prior was determined by using a modified PYTHIA-generated prior (Sect. 10.3.3) and a Levy function [49]). The uncertainty associated with the choice of regularization for SVD unfolding was assessed by varying the value of relative to the default value. Varying the choice of regularization for Iterative Bayesian unfolding generates negligible change.
Table 2 and Figs. 7 and 8 show the nominal normalization regions. To assess the uncertainty associated with this choice, the upper limit of this region was varied by 1 .
The value of is determined from the near-side correlation yields of vs. triggers (Sect. 8). The systematic uncertainty in is estimated by varying the range of of the tracks counted in the near-side correlation measurement [58]. By varying within its uncertainty, the corresponding uncertainty on the recoil-jet yields is determined.
The effects of varying the fragmentation model used to determine for central collisions were studied in Ref. [49], and were found to be small relative to other systematic effects. We therefore do not consider this contribution further here for central measurements.
| Central ; Trigger: | |||||||
| Systematic uncertainty (%) | |||||||
| [GeV] | [] | instr | unfold | ME norm | cumulative | ||
| [9,11] | 0.2 | [5,10] | 4 | 11 | 17 | 18 | 27 |
| [10,15] | 5 | 20 | 2 | 9 | 22 | ||
| [15,20] | 5 | 22 | 4 | 13 | 26 | ||
| 0.5 | [5,10] | 3 | 34 | 7 | 5 | 35 | |
| [10,15] | 7 | 36 | 2 | 4 | 36 | ||
| [15,20] | 8 | 24 | 2 | 9 | 26 | ||
| [11,15] | 0.2 | [5,10] | 4 | 36 | 14 | 10 | 40 |
| [10,15] | 5 | 29 | 8 | 11 | 32 | ||
| [15,20] | 5 | 38 | 7 | 7 | 39 | ||
| 0.5 | [5,10] | 6 | 38 | 4 | 6 | 39 | |
| [10,15] | 8 | 29 | 3 | 3 | 30 | ||
| [15,20] | 8 | 22 | 2 | 7 | 24 | ||
| Central ; Trigger: | ||||||||
| Systematic uncertainty (%) | ||||||||
| [GeV] | [] | instr | unfold | ME norm | purity | cumulative | ||
| [9,11] | 0.2 | [5,10] | 4 | 30 | 18 | 14 | 12 | 40 |
| 0.5 | [5,10] | 5 | 30 | 16 | 3 | 5 | 34 | |
| [11,15] | 0.2 | [5,10] | 4 | 36 | 17 | 10 | 3 | 41 |
| [10,15] | 5 | 20 | 10 | 15 | 16 | 31 | ||
| 0.5 | [5,10] | 2 | 36 | 10 | 8 | 2 | 38 | |
| [10,15] | 5 | 20 | 11 | 3 | 11 | 26 | ||
| [15,20] | 0.2 | [5,10] | 4 | 26 | 12 | 11 | 10 | 32 |
| [10,15] | 5 | 32 | 11 | 10 | 23 | 42 | ||
| 0.5 | [5,10] | 3 | 44 | 12 | 9 | 5 | 46 | |
| [10,15] | 4 | 42 | 10 | 6 | 9 | 44 | ||
12 Closure test
A closure test is used to validate the analysis algorithm. The test is based on detector-level events which are embedded into real data to model the effects of uncorrelated background and then subject to the full analysis chain that is used for the real data analysis, including unfolding and estimation of systematic uncertainties. Corrected distributions from these fully analysed events are then compared to those from the initial particle-level events (“Truth”). Successful closure corresponds to the agreement of these two distributions within uncertainties.
12.1 collisions
The closure test was carried out using events generated by PYTHIA 6.426 Perugia 0 tune for collisions at GeV, selected by a di-jet trigger condition. Detector-level events from this population are embedded into STAR 2009 zero-bias data (hybrid events). Jets are reconstructed in the same manner as data using both the particle-level and detector-level hybrid events. The detector-level recoil-jet distributions are modified to correspond to the trigger statistics of the measured data.
The detector-level event population is divided into two sub-samples of roughly equal size. These sub-samples correspond to the two orientations of the STAR magnetic field in which data were taken: Full-Field (FF) and Reverse Full-Field (RFF). The closure test utilizes the RFF sub-sample for calculating and the FF sub-sample serving as pseudo-data for validation. Jet reconstruction, unfolding, and determination of systematic uncertainties, are carried on the RFF sub-sample in the same way as is done for real data.
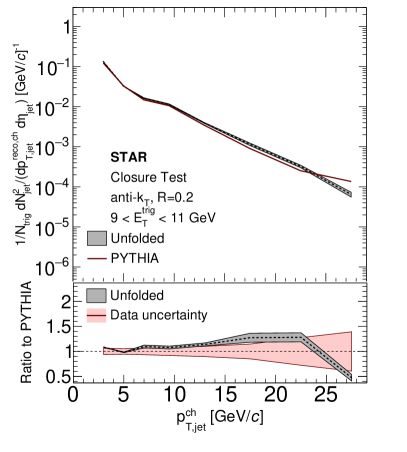
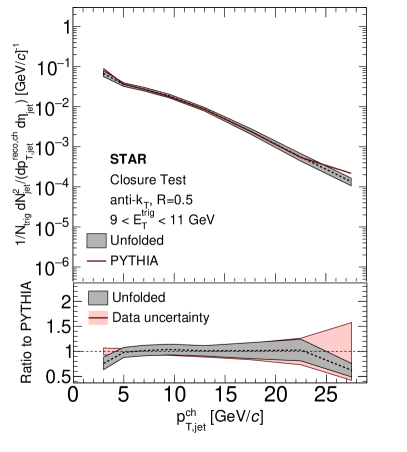
Figure 18 shows corrected distributions for -triggered events with GeV and recoil jets with and 0.5, compared to the corresponding Truth (particle-level) distributions whose statistical errors have been modified to match the systematic precision of the data. The unfolded and Truth distributions agree within the systematic precision of the measurement, thereby validating the analysis chain for this choice of kinematics. Similarly good closure is observed for triggers with and GeV, and with the roles of the FF and RFF data sub-samples reversed. This closure study validates the analysis chain over the full reported kinematic range.
12.2 collisions
The closure test for central collisions utilizes PYTHIA-generated events for collisions at GeV which contain a trigger in the range GeV. The trigger statistics are the same as those of the real data. Detector-level events are generated with the same fast simulation approach used in Sect. 10.1.2 and are embedded in central events recorded with a MB trigger. The full analysis chain is then applied to these hybrid events, including jet reconstruction, subtraction of ME, and corrections. Systematic uncertainties are determined by the same procedures as used for real data.
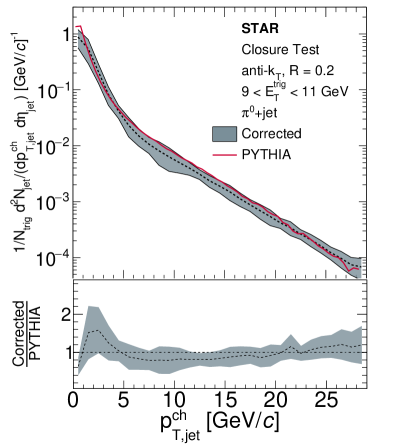
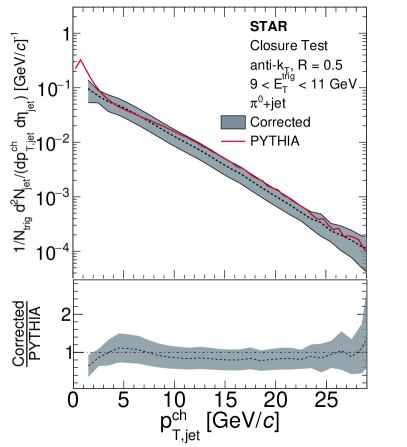
Figure 19 shows corrected semi-inclusive recoil-jet distributions for such hybrid events, for and 0.5. The ratio of corrected data to the PYTHIA truth distributions in the lower panel is consistent with unity within the systematic uncertainty, over the full reported range of . This agreement, corresponding to closure, validates the analysis chain for central collisions.
13 Results
This section compares fully-corrected distributions measured in and central collisions using the observables defined in Sect. 4.3. Comparisons of these results to theoretical calculations are presented in the companion Letter [59].
13.1 Corrected recoil distributions
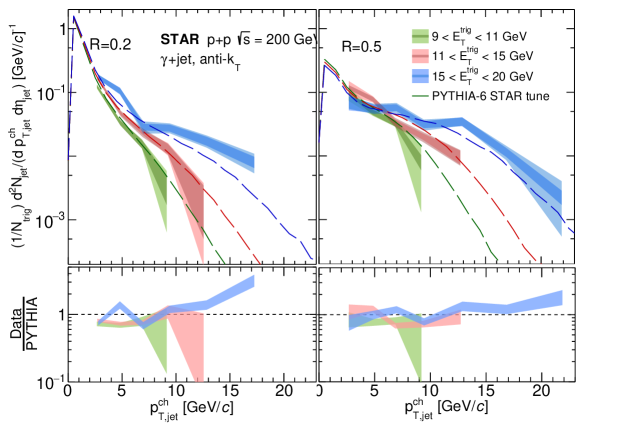
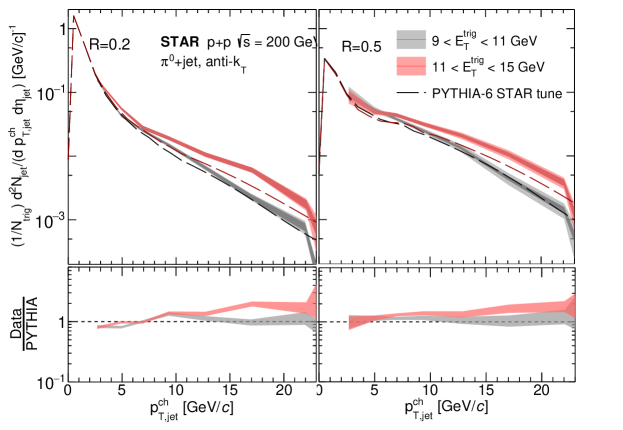
Figure 20 shows fully-corrected distributions for recoil jets with and 0.5, in -triggered and -triggered collisions at GeV. The distributions are shown as continuous bands rather than distinct points, to indicate the strong off-diagonal covariance of the systematic uncertainty [49]. Higher corresponds to a harder recoil-jet spectrum, as expected. PYTHIA-6 STAR tune calculations are also shown. For , PYTHIA largely reproduces the measured distributions within , except the -triggered data for GeV. For , PYTHIA reproduces the data except for triggers in GeV.
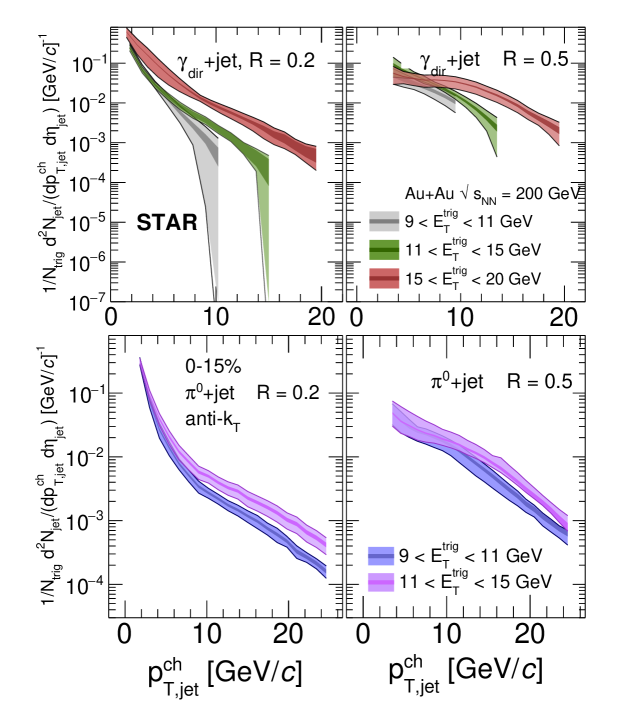
Figure 21 shows the same distributions for collisions at GeV. An ordering of the recoil spectra as a function of is likewise observed, which is qualitatively similar to that for collisions in Fig. 20.
The recoil-jet spectra extend to larger for than for triggers, as expected, due to the stronger constraint on kinematic balance for triggers. The -triggered spectra for GeV are not shown, due to their limited statistical precision arising from the stringent TSP cut required for high purity (Fig. 2). While the -triggered distributions in this selection are sufficient for the background subtraction needed to obtain the -triggered distributions, they are not precise enough for good convergence of the unfolding to obtain corrected -triggered spectra.
13.2 Recoil-jet yield modification:

Figure 22 shows (Eq. 3) as a function of for - and -triggered recoil jet distributions. For , in all cases decreases with increasing for and is significantly below unity for indicating medium-induced jet energy loss. For , in all cases is closer to unity for . These features suggest that the energy and momentum that are lost by small- jets at high due to jet quenching may be recovered at both large angles to the jet axis by large- jets, and at low by small- jets.
For both and GeV, and for both and 0.5, the -triggered and -triggered distributions are consistent within uncertainties. This is notable in light of the differences expected in the recoil-jet populations in terms of quark/gluon fraction and path-length distribution (Sect. 4.1). However, the magnitude of medium-induced yield suppression measured by depends upon both the population-averaged energy loss and the shape of the recoil-jet spectrum. Figures 20 and 21 show that the recoil-jet spectrum is steeper for than for triggers in the same bin, which suggests larger energy loss on average for the -triggered recoil-jet population. The companion Letter [59] further explores this question using comparison to theoretical model calculations.
13.3 Jet shape modification:
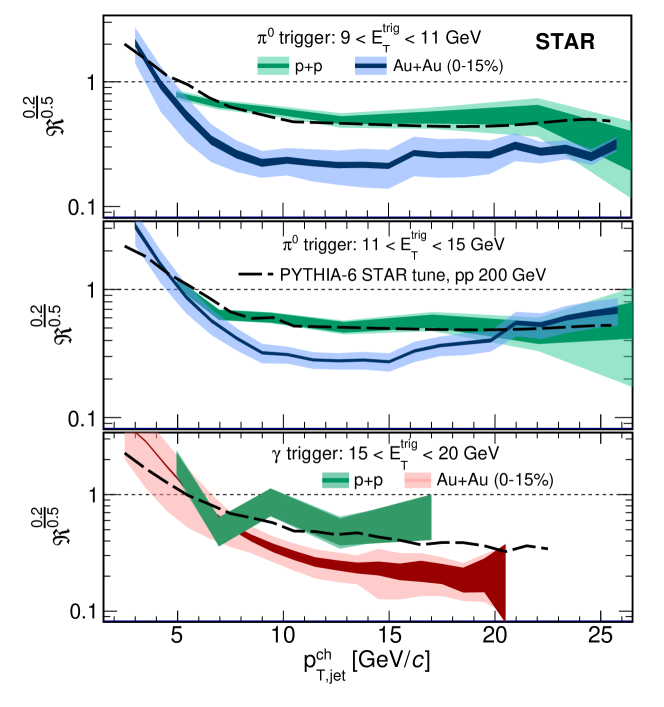
The observable (Eq. 4) probes the transverse profile of jet energy. Figure 23 shows distributions of measured for and triggers in and central collisions. The systematic uncertainty in the ratio takes into account the correlated uncertainties in numerator and denominator. The systematic uncertainty due to instrumental effects largely cancels in the ratio.
For collisions, is less than unity for , reflecting the transverse energy profile of jets in vacuum. Figure 23 also shows distributions of calculated by PYTHIA-6 STAR tune for collisions, which are consistent within uncertainties with the data. Similar level of agreement with data has been found for QCD and model calculations of in collisions for inclusive jet production [89, 90, 102, 91, 92], and semi-inclusive recoil-jet yields [40].
Note that the shape of the distribution in collisions differs markedly at low for inclusive jet cross sections compared to semi-inclusive yields. For inclusive jet cross sections, decreases as decreases [102, 91, 92], consistent with the well-established broadening of the transverse jet profile for jets at low , whereas for semi-inclusive distributions, Fig. 23 shows that increases as decreases.
As seen in the figure, the PYTHIA-6 STAR tune calculation reproduces this trend well; QCD calculations and PYTHIA-6 likewise reproduce well the opposite trend for inclusive cross sections [102, 91]. We therefore explore whether these features can be accounted for by elementary QCD processes, focussing on for -triggered data; similar considerations apply to -triggered data. In this case, the trigger is a leading fragment of the “trigger jet,” which is not measured in the analysis. However, of the trigger jet is necessarily larger than of the trigger . In a LO picture, in which jet production is a process, the recoil jet must therefore also have a value of that is larger than .
We therefore introduce a new observable,
| (13) |
which is the ratio of of the trigger to of the recoil jet. In the absence of initial- smearing effects, and accounting for the fact that the recoil jet is measured only with charged particles, LO production corresponds predominantly to .
However, Fig. 23 shows that the increase in as decreases occurs predominantly in the region , where LO production is suppressed. Production processes at higher order include gluon radiation at significant angles to the jet axis. For radiation at angles between and radians, jet reconstruction with may find two separate jets while jet reconstruction with finds only one.
These elements together may account for the increase in towards low for collisions: in the region , the energy profile of recoil jets for this semi-inclusive selection is broader than that of the inclusive jet population at the same value of , and is therefore more frequently split into two jets by jet reconstruction with than for . Note that the semi-inclusive analysis approach counts all correlated jet yield in the recoil acceptance, so that this effect corresponds to a growth in , as observed.
Validation of this picture can be carried out using QCD calculations which exhibit the same features, and by additional jet substructure measurements, both of which are beyond the scope of this paper. If validated, this mechanism can potentially be used to generate a population of initially “wide jets” in heavy-ion collisions, in order to explore the interplay between jet substructure and jet quenching [103].
Figure 23 shows that for central collisions, is additionally suppressed relative to its value for collisions for triggers in the range , and for triggers in the range . This additional suppression corresponds to medium-induced jet broadening. This observation of intra-jet broadening, combined with the measurement of values close to unity for (Fig. 22), suggests that the typical angular scale of medium-induced energy momentum transfer due to jet quenching is less than 0.5 radians. This topic is explored in detail in the companion Letter [59].
13.4 Comparison with previous results
This section compares -triggered measurements from this analysis with previously published measurements of +jet correlations in collisions at GeV [49]. These analyses differ in their choice of centrality, trigger, and reference spectrum for measuring yield suppression. Nevertheless, they address similar physics questions, and such differences may have only secondary effect on the physics results. This comparison provides a cross-check of the two analyses.
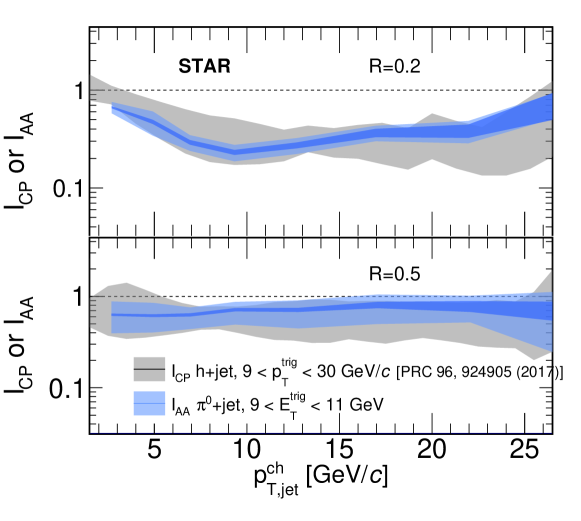
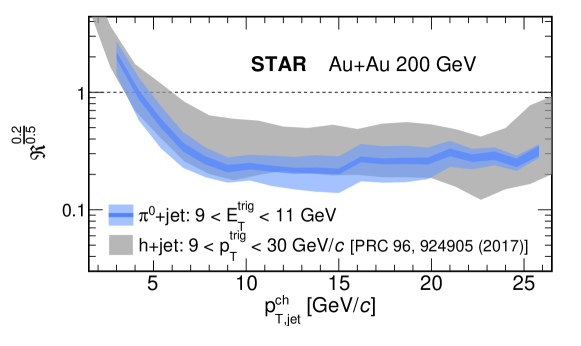
Figure 24 compares the -triggered distribution of with (ratio of recoil-jet distributions in central and peripheral collisions) from Ref. [49], for and 0.5, while Fig. 25 compares the ratio with and in the two analyses. The systematic uncertainty and statistical error are significantly smaller in this analysis, for both observables. The two analyses are consistent within uncertainties.
14 Summary
We have reported the first measurement of semi-inclusive distributions of charged-particle jets recoiling from and triggers in and central collisions at GeV. Fully-corrected recoil-jet distributions are measured for and 0.5, with GeV. The measurements are consistent with results in a previous publication that utilized charged-hadron triggers in central and peripheral collisions, with significantly improved uncertainties.
Recoil-yield suppression is observed in the range for , with the magnitude of suppression consistent within uncertainties for and -triggered data. Significantly less suppression is observed for , and at low for both and 0.5.
The transverse structure of jets and its in-medium modification is measured using , the ratio of semi-inclusive recoil-jet yields for and 0.5. The distribution of in collisions, which is well-reproduced by QCD calculations, exhibits low- behavior that is opposite to that of inclusive jet cross sections, suggesting that the semi-inclusive approach suppresses LO production processes for . The value of in collisions is markedly suppressed relative to that in collisions, for both and triggers and for , providing a new measurement of medium-induced jet broadening at RHIC energies and its angular scale.
15 Acknowledgments
Acknowledgments- We thank Shanshan Cao, Tan Luo, Guang-You Qin, Abhijit Majumder, Daniel Pablos, Krishna Rajagopal, Chathuranga Sirimanna, Xin-Nian Wang, and Ivan Vitev for providing theoretical calculations. We thank the RHIC Operations Group and RCF at BNL, the NERSC Center at LBNL, and the Open Science Grid consortium for providing resources and support. This work was supported in part by the Office of Nuclear Physics within the U.S. DOE Office of Science, the U.S. National Science Foundation, National Natural Science Foundation of China, Chinese Academy of Science, the Ministry of Science and Technology of China and the Chinese Ministry of Education, the Higher Education Sprout Project by Ministry of Education at NCKU, the National Research Foundation of Korea, Czech Science Foundation and Ministry of Education, Youth and Sports of the Czech Republic, Hungarian National Research, Development and Innovation Office, New National Excellency Programme of the Hungarian Ministry of Human Capacities, Department of Atomic Energy and Department of Science and Technology of the Government of India, the National Science Centre and WUT ID-UB of Poland, the Ministry of Science, Education and Sports of the Republic of Croatia, German Bundesministerium für Bildung, Wissenschaft, Forschung and Technologie (BMBF), Helmholtz Association, Ministry of Education, Culture, Sports, Science, and Technology (MEXT) and Japan Society for the Promotion of Science (JSPS).
References
- [1] W. Busza, K. Rajagopal, and W. van der Schee, “Heavy Ion Collisions: The Big Picture, and the Big Questions,” Ann. Rev. Nucl. Part. Sci. 68 (2018) 339–376, arXiv:1802.04801 [hep-ph].
- [2] J. W. Harris and B. Müller, “”QGP Signatures” Revisited,” arXiv:2308.05743 [hep-ph].
- [3] U. Heinz and R. Snellings, “Collective flow and viscosity in relativistic heavy-ion collisions,” Ann. Rev. Nucl. Part. Sci. 63 (2013) 123–151, arXiv:1301.2826 [nucl-th].
- [4] JETSCAPE Collaboration, D. Everett et al., “Multisystem Bayesian constraints on the transport coefficients of QCD matter,” Phys. Rev. C 103 no. 5, (2021) 054904, arXiv:2011.01430 [hep-ph].
- [5] JETSCAPE Collaboration, D. Everett et al., “Phenomenological constraints on the transport properties of QCD matter with data-driven model averaging,” Phys. Rev. Lett. 126 no. 24, (2021) 242301, arXiv:2010.03928 [hep-ph].
- [6] G. Nijs, W. van der Schee, U. Gürsoy, and R. Snellings, “Bayesian analysis of heavy ion collisions with the heavy ion computational framework Trajectum,” Phys. Rev. C 103 no. 5, (2021) 054909, arXiv:2010.15134 [nucl-th].
- [7] L. Cunqueiro and A. M. Sickles, “Studying the QGP with Jets at the LHC and RHIC,” Prog. Part. Nucl. Phys. 124 (2022) 103940, arXiv:2110.14490 [nucl-ex].
- [8] M. Cacciari, G. P. Salam, and G. Soyez, “FastJet User Manual,” Eur. Phys. J. C 72 (2012) 1896, arXiv:1111.6097 [hep-ph].
- [9] STAR Collaboration, B. I. Abelev et al., “Longitudinal double-spin asymmetry and cross section for inclusive jet production in polarized proton collisions at GeV,” Phys. Rev. Lett. 97 (2006) 252001, arXiv:hep-ex/0608030.
- [10] STAR Collaboration, L. Adamczyk et al., “Measurement of the cross section and longitudinal double-spin asymmetry for di-jet production in polarized collisions at = 200 GeV,” Phys. Rev. D 95 no. 7, (2017) 071103, arXiv:1610.06616 [hep-ex].
- [11] ALICE Collaboration, B. Abelev et al., “Measurement of the inclusive differential jet cross section in collisions at TeV,” Phys. Lett. B 722 (2013) 262–272, arXiv:1301.3475 [nucl-ex].
- [12] ALICE Collaboration, S. Acharya et al., “Measurements of inclusive jet spectra in pp and central Pb-Pb collisions at = 5.02 TeV,” Phys. Rev. C 101 no. 3, (2020) 034911, arXiv:1909.09718 [nucl-ex].
- [13] ATLAS Collaboration, G. Aad et al., “Measurement of the inclusive jet cross-section in proton-proton collisions at TeV using 4.5 invfb of data with the ATLAS detector,” JHEP 02 (2015) 153, arXiv:1410.8857 [hep-ex]. [Erratum: JHEP 09, 141 (2015)].
- [14] CMS Collaboration, V. Khachatryan et al., “Measurement and QCD analysis of double-differential inclusive jet cross sections in pp collisions at TeV and cross section ratios to 2.76 and 7 TeV,” JHEP 03 (2017) 156, arXiv:1609.05331 [hep-ex].
- [15] A. Majumder and M. Van Leeuwen, “The Theory and Phenomenology of Perturbative QCD Based Jet Quenching,” Prog. Part. Nucl. Phys. 66 (2011) 41–92, arXiv:1002.2206 [hep-ph].
- [16] J. D. Bjorken, “Energy Loss of Energetic Partons in Quark - Gluon Plasma: Possible Extinction of High Jets in Hadron - Hadron Collisions,” 8, 1982.
- [17] X.-N. Wang, M. Gyulassy, and M. Plumer, “The LPM effect in QCD and radiative energy loss in a quark gluon plasma,” Phys. Rev. D 51 (1995) 3436–3446, arXiv:hep-ph/9408344.
- [18] R. Baier, Y. L. Dokshitzer, A. H. Mueller, and D. Schiff, “Radiative energy loss of high-energy partons traversing an expanding QCD plasma,” Phys. Rev. C 58 (1998) 1706–1713, arXiv:hep-ph/9803473.
- [19] M. Gyulassy, P. Levai, and I. Vitev, “NonAbelian energy loss at finite opacity,” Phys. Rev. Lett. 85 (2000) 5535–5538, arXiv:nucl-th/0005032.
- [20] STAR Collaboration, C. Adler et al., “Centrality dependence of high hadron suppression in Au+Au collisions at = 130 GeV,” Phys. Rev. Lett. 89 (2002) 202301, arXiv:nucl-ex/0206011.
- [21] STAR Collaboration, C. Adler et al., “Disappearance of back-to-back high hadron correlations in central Au+Au collisions at = 200 GeV,” Phys. Rev. Lett. 90 (2003) 082302, arXiv:nucl-ex/0210033.
- [22] STAR Collaboration, J. Adams et al., “Transverse momentum and collision energy dependence of high hadron suppression in Au+Au collisions at ultrarelativistic energies,” Phys. Rev. Lett. 91 (2003) 172302, arXiv:nucl-ex/0305015.
- [23] STAR Collaboration, J. Adams et al., “Direct observation of dijets in central Au+Au collisions at = 200 GeV,” Phys. Rev. Lett. 97 (2006) 162301, arXiv:nucl-ex/0604018.
- [24] STAR Collaboration, L. Adamczyk et al., “Jet-Hadron Correlations in GeV and Central Collisions,” Phys. Rev. Lett. 112 no. 12, (2014) 122301, arXiv:1302.6184 [nucl-ex].
- [25] PHENIX Collaboration, K. Adcox et al., “Suppression of hadrons with large transverse momentum in central Au+Au collisions at = 130 GeV,” Phys. Rev. Lett. 88 (2002) 022301, arXiv:nucl-ex/0109003.
- [26] PHENIX Collaboration, A. Adare et al., “Neutral pion production with respect to centrality and reaction plane in AuAu collisions at =200 GeV,” Phys. Rev. C 87 no. 3, (2013) 034911, arXiv:1208.2254 [nucl-ex].
- [27] PHENIX Collaboration, A. Adare et al., “Transition in Yield and Azimuthal Shape Modification in Dihadron Correlations in Relativistic Heavy Ion Collisions,” Phys. Rev. Lett. 104 (2010) 252301, arXiv:1002.1077 [nucl-ex].
- [28] ALICE Collaboration, K. Aamodt et al., “Particle-yield modification in jet-like azimuthal di-hadron correlations in Pb-Pb collisions at TeV,” Phys. Rev. Lett. 108 (2012) 092301, arXiv:1110.0121 [nucl-ex].
- [29] ALICE Collaboration, B. Abelev et al., “Centrality Dependence of Charged Particle Production at Large Transverse Momentum in Pb–Pb Collisions at TeV,” Phys. Lett. B 720 (2013) 52–62, arXiv:1208.2711 [hep-ex].
- [30] ALICE Collaboration, J. Adam et al., “Jet-like correlations with neutral pion triggers in pp and central Pb–Pb collisions at 2.76 TeV,” Phys. Lett. B 763 (2016) 238–250, arXiv:1608.07201 [nucl-ex].
- [31] CMS Collaboration, S. Chatrchyan et al., “Study of high-pT charged particle suppression in PbPb compared to collisions at TeV,” Eur. Phys. J. C 72 (2012) 1945, arXiv:1202.2554 [nucl-ex].
- [32] CMS Collaboration, S. Chatrchyan et al., “Centrality dependence of dihadron correlations and azimuthal anisotropy harmonics in PbPb collisions at TeV,” Eur. Phys. J. C 72 (2012) 2012, arXiv:1201.3158 [nucl-ex].
- [33] N. Armesto, M. Cacciari, T. Hirano, J. L. Nagle, and C. A. Salgado, “Constraint fitting of experimental data with a jet quenching model embedded in a hydrodynamical bulk medium,” J. Phys. G 37 (2010) 025104, arXiv:0907.0667 [hep-ph].
- [34] JET Collaboration, K. M. Burke et al., “Extracting the jet transport coefficient from jet quenching in high-energy heavy-ion collisions,” Phys. Rev. C 90 no. 1, (2014) 014909, arXiv:1312.5003 [nucl-th].
- [35] JETSCAPE Collaboration, S. Cao et al., “Determining the jet transport coefficient from inclusive hadron suppression measurements using Bayesian parameter estimation,” Phys. Rev. C 104 no. 2, (2021) 024905, arXiv:2102.11337 [nucl-th].
- [36] ALICE Collaboration, B. Abelev et al., “Measurement of charged jet suppression in Pb-Pb collisions at = 2.76 TeV,” JHEP 03 (2014) 013, arXiv:1311.0633 [nucl-ex].
- [37] ALICE Collaboration, J. Adam et al., “Measurement of jet suppression in central Pb-Pb collisions at = 2.76 TeV,” Phys. Lett. B 746 (2015) 1–14, arXiv:1502.01689 [nucl-ex].
- [38] ATLAS Collaboration, G. Aad et al., “Measurements of the Nuclear Modification Factor for Jets in Pb+Pb Collisions at TeV with the ATLAS Detector,” Phys. Rev. Lett. 114 no. 7, (2015) 072302, arXiv:1411.2357 [hep-ex].
- [39] CMS Collaboration, V. Khachatryan et al., “Measurement of inclusive jet cross sections in and PbPb collisions at 2.76 TeV,” Phys. Rev. C 96 no. 1, (2017) 015202, arXiv:1609.05383 [nucl-ex].
- [40] ALICE Collaboration, J. Adam et al., “Measurement of jet quenching with semi-inclusive hadron-jet distributions in central Pb-Pb collisions at TeV,” JHEP 09 (2015) 170, arXiv:1506.03984 [nucl-ex].
- [41] ATLAS Collaboration, G. Aad et al., “Observation of a Centrality-Dependent Dijet Asymmetry in Lead-Lead Collisions at TeV with the ATLAS Detector at the LHC,” Phys. Rev. Lett. 105 (2010) 252303, arXiv:1011.6182 [hep-ex].
- [42] CMS Collaboration, S. Chatrchyan et al., “Jet momentum dependence of jet quenching in PbPb collisions at TeV,” Phys. Lett. B 712 (2012) 176–197, arXiv:1202.5022 [nucl-ex].
- [43] CMS Collaboration, S. Chatrchyan et al., “Studies of jet quenching using isolated-photon+jet correlations in PbPb and collisions at TeV,” Phys. Lett. B 718 (2013) 773–794, arXiv:1205.0206 [nucl-ex].
- [44] CMS Collaboration, A. M. Sirunyan et al., “Observation of Medium-Induced Modifications of Jet Fragmentation in Pb-Pb Collisions at 5.02 TeV Using Isolated Photon-Tagged Jets,” Phys. Rev. Lett. 121 no. 24, (2018) 242301, arXiv:1801.04895 [hep-ex].
- [45] ALICE Collaboration, S. Acharya et al., “First measurement of jet mass in Pb–Pb and p–Pb collisions at the LHC,” Phys. Lett. B 776 (2018) 249–264, arXiv:1702.00804 [nucl-ex].
- [46] ALICE Collaboration, S. Acharya et al., “Exploration of jet substructure using iterative declustering in pp and Pb–Pb collisions at LHC energies,” Phys. Lett. B 802 (2020) 135227, arXiv:1905.02512 [nucl-ex].
- [47] CMS Collaboration, A. M. Sirunyan et al., “Measurement of the Splitting Function in and Pb-Pb Collisions at 5.02 TeV,” Phys. Rev. Lett. 120 no. 14, (2018) 142302, arXiv:1708.09429 [nucl-ex].
- [48] STAR Collaboration, L. Adamczyk et al., “Dijet imbalance measurements in and collisions at GeV at STAR,” Phys. Rev. Lett. 119 no. 6, (2017) 062301, arXiv:1609.03878 [nucl-ex].
- [49] STAR Collaboration, L. Adamczyk et al., “Measurements of jet quenching with semi-inclusive hadron+jet distributions in Au+Au collisions at = 200 GeV,” Phys. Rev. C 96 no. 2, (2017) 024905, arXiv:1702.01108 [nucl-ex].
- [50] STAR Collaboration, J. Adam et al., “Measurement of inclusive charged-particle jet production in Au + Au collisions at 200 GeV,” Phys. Rev. C 102 no. 5, (2020) 054913, arXiv:2006.00582 [nucl-ex].
- [51] G. David, “Direct real photons in relativistic heavy ion collisions,” Rept. Prog. Phys. 83 no. 4, (2020) 046301, arXiv:1907.08893 [nucl-ex].
- [52] X.-N. Wang, Z. Huang, and I. Sarcevic, “Jet quenching in the opposite direction of a tagged photon in high-energy heavy ion collisions,” Phys. Rev. Lett. 77 (1996) 231–234, arXiv:hep-ph/9605213 [hep-ph].
- [53] W. Dai, I. Vitev, and B.-W. Zhang, “Momentum imbalance of isolated photon-tagged jet production at RHIC and LHC,” Phys. Rev. Lett. 110 no. 14, (2013) 142001, arXiv:1207.5177 [hep-ph].
- [54] CMS Collaboration, A. M. Sirunyan et al., “Study of jet quenching with isolated-photon+jet correlations in PbPb and pp collisions at 5.02 TeV,” Phys. Lett. B 785 (2018) 14–39, arXiv:1711.09738 [nucl-ex].
- [55] ATLAS Collaboration, M. Aaboud et al., “Measurement of photon–jet transverse momentum correlations in 5.02 TeV Pb + Pb and collisions with ATLAS,” Phys. Lett. B 789 (2019) 167–190, arXiv:1809.07280 [nucl-ex].
- [56] ALICE Collaboration, S. Acharya et al., “Constraints on jet quenching in p-Pb collisions at = 5.02 TeV measured by the event-activity dependence of semi-inclusive hadron-jet distributions,” Phys. Lett. B 783 (2018) 95–113, arXiv:1712.05603 [nucl-ex].
- [57] R. Baier, “Jet quenching,” Nucl. Phys. A 715 (2003) 209–218, arXiv:hep-ph/0209038.
- [58] STAR Collaboration, L. Adamczyk et al., “Jet-like Correlations with Direct-Photon and Neutral-Pion Triggers at GeV,” Phys. Lett. B 760 (2016) 689–696, arXiv:1604.01117 [nucl-ex].
- [59] STAR Collaboration, “Measurement of in-medium jet modification using direct photon+jet and +jet correlations in and central Au+Au collisions at GeV,” arXiv:2309.00156 [nucl-ex].
- [60] STAR Collaboration, B. I. Abelev et al., “Studying Parton Energy Loss in Heavy-Ion Collisions via Direct-Photon and Charged-Particle Azimuthal Correlations,” Phys. Rev. C 82 (2010) 034909, arXiv:0912.1871 [nucl-ex].
- [61] M. Cacciari, G. P. Salam, and G. Soyez, “The anti- jet clustering algorithm,” JHEP 04 (2008) 063, arXiv:0802.1189 [hep-ph].
- [62] STAR Collaboration, K. H. Ackermann et al., “STAR detector overview,” Nucl. Instrum. Meth. A 499 (2003) 624–632.
- [63] STAR Collaboration, M. Beddo et al., “The STAR barrel electromagnetic calorimeter,” Nucl. Instrum. Meth. A 499 (2003) 725–739.
- [64] M. Anderson et al., “The Star time projection chamber: A Unique tool for studying high multiplicity events at RHIC,” Nucl. Instrum. Meth. A 499 (2003) 659–678, arXiv:nucl-ex/0301015 [nucl-ex].
- [65] STAR Collaboration, M. S. Abdallah et al., “Differential measurements of jet substructure and partonic energy loss in Au+Au collisions at GeV,” Phys. Rev. C 105 no. 4, (2022) 044906, arXiv:2109.09793 [nucl-ex].
- [66] R. Brun, F. Bruyant, M. Maire, A. C. McPherson, and P. Zanarini, GEANT 3: user’s guide Geant 3.10, Geant 3.11; rev. version. CERN, Geneva, 1987. https://cds.cern.ch/record/1119728.
- [67] T. Sjostrand, S. Mrenna, and P. Z. Skands, “PYTHIA 6.4 Physics and Manual,” JHEP 05 (2006) 026, arXiv:hep-ph/0603175.
- [68] P. Z. Skands, “Tuning Monte Carlo Generators: The Perugia Tunes,” Phys. Rev. D 82 (2010) 074018, arXiv:1005.3457 [hep-ph].
- [69] STAR Collaboration, J. Adam et al., “Longitudinal double-spin asymmetry for inclusive jet and dijet production in pp collisions at GeV,” Phys. Rev. D 100 no. 5, (2019) 052005, arXiv:1906.02740 [hep-ex].
- [70] T. Sjostrand, S. Mrenna, and P. Z. Skands, “A Brief Introduction to PYTHIA 8.1,” Comput. Phys. Commun. 178 (2008) 852–867, arXiv:0710.3820 [hep-ph].
- [71]
- [72] N.-B. Chang and G.-Y. Qin, “Full jet evolution in quark-gluon plasma and nuclear modification of jet production and jet shape in Pb+Pb collisions at 2.76ATeV at the CERN Large Hadron Collider,” Phys. Rev. C 94 no. 2, (2016) 024902, arXiv:1603.01920 [hep-ph].
- [73] H. Song, S. A. Bass, and U. Heinz, “Viscous QCD matter in a hybrid hydrodynamic+Boltzmann approach,” Phys. Rev. C 83 (2011) 024912, arXiv:1012.0555 [nucl-th].
- [74] T. Luo, S. Cao, Y. He, and X.-N. Wang, “Multiple jets and -jet correlation in high-energy heavy-ion collisions,” Phys. Lett. B 782 (2018) 707–716, arXiv:1803.06785 [hep-ph].
- [75] L.-G. Pang, Y. Hatta, X.-N. Wang, and B.-W. Xiao, “Analytical and numerical Gubser solutions of the second-order hydrodynamics,” Phys. Rev. D 91 no. 7, (2015) 074027, arXiv:1411.7767 [hep-ph].
- [76] Z.-W. Lin, C. M. Ko, B.-A. Li, B. Zhang, and S. Pal, “A Multi-phase transport model for relativistic heavy ion collisions,” Phys. Rev. C 72 (2005) 064901, arXiv:nucl-th/0411110.
- [77] W. Zhao, W. Ke, W. Chen, T. Luo, and X.-N. Wang, “From Hydrodynamics to Jet Quenching, Coalescence, and Hadron Cascade: A Coupled Approach to Solving the RAAv2 Puzzle,” Phys. Rev. Lett. 128 no. 2, (2022) 022302, arXiv:2103.14657 [hep-ph].
- [78] W. Chen, S. Cao, T. Luo, L.-G. Pang, and X.-N. Wang, “Effects of jet-induced medium excitation in -hadron correlation in A+A collisions,” Phys. Lett. B 777 (2018) 86–90, arXiv:1704.03648 [nucl-th].
- [79] Z.-B. Kang, I. Vitev, and H. Xing, “Vector-boson-tagged jet production in heavy ion collisions at energies available at the CERN Large Hadron Collider,” Phys. Rev. C 96 no. 1, (2017) 014912, arXiv:1702.07276 [hep-ph].
- [80] J. Casalderrey-Solana, D. C. Gulhan, J. G. Milhano, D. Pablos, and K. Rajagopal, “A Hybrid Strong/Weak Coupling Approach to Jet Quenching,” JHEP 10 (2014) 019, arXiv:1405.3864 [hep-ph]. [Erratum: JHEP 09, 175 (2015)].
- [81] J. Casalderrey-Solana, Z. Hulcher, G. Milhano, D. Pablos, and K. Rajagopal, “Simultaneous description of hadron and jet suppression in heavy-ion collisions,” Phys. Rev. C 99 no. 5, (2019) 051901, arXiv:1808.07386 [hep-ph].
- [82] STAR Collaboration, J. Adam et al., “Measurement of inclusive charged-particle jet production in Au + Au collisions at 200 GeV,” Phys. Rev. C 102 no. 5, (2020) 054913, arXiv:2006.00582 [nucl-ex].
- [83] PHENIX Collaboration, A. Adare et al., “High direct photon and triggered azimuthal jet correlations and measurement of for isolated direct photons in collisions at GeV,” Phys. Rev. D 82 (2010) 072001, arXiv:1006.1347 [hep-ex].
- [84] H. Zhang, J. F. Owens, E. Wang, and X.-N. Wang, “Dihadron tomography of high-energy nuclear collisions in NLO pQCD,” Phys. Rev. Lett. 98 (2007) 212301, arXiv:nucl-th/0701045.
- [85] T. Renk, “Biased showers: A common conceptual framework for the interpretation of high- observables in heavy-ion collisions,” Phys. Rev. C 88 no. 5, (2013) 054902, arXiv:1212.0646 [hep-ph].
- [86] S. A. Bass, C. Gale, A. Majumder, C. Nonaka, G.-Y. Qin, T. Renk, and J. Ruppert, “Systematic Comparison of Jet Energy-Loss Schemes in a realistic hydrodynamic medium,” Phys. Rev. C 79 (2009) 024901, arXiv:0808.0908 [nucl-th].
- [87] PHENIX Collaboration, A. Adare et al., “Systematic Study of Azimuthal Anisotropy in CuCu and AuAu Collisions at and 200 GeV,” Phys. Rev. C 92 no. 3, (2015) 034913, arXiv:1412.1043 [nucl-ex].
- [88] M. Cacciari and G. P. Salam, “Pileup subtraction using jet areas,” Phys. Lett. B 659 (2008) 119–126, arXiv:0707.1378 [hep-ph].
- [89] ALICE Collaboration, B. Abelev et al., “Measurement of the inclusive differential jet cross section in collisions at TeV,” Phys. Lett. B 722 (2013) 262–272, arXiv:1301.3475 [nucl-ex].
- [90] CMS Collaboration, S. Chatrchyan et al., “Measurement of the Ratio of Inclusive Jet Cross Sections using the Anti- Algorithm with Radius Parameters R=0.5 and 0.7 in pp Collisions at TeV,” Phys. Rev. D 90 no. 7, (2014) 072006, arXiv:1406.0324 [hep-ex].
- [91] ALICE Collaboration, S. Acharya et al., “Measurements of inclusive jet spectra in pp and central Pb-Pb collisions at = 5.02 TeV,” Phys. Rev. C 101 no. 3, (2020) 034911, arXiv:1909.09718 [nucl-ex].
- [92] M. Dasgupta, F. A. Dreyer, G. P. Salam, and G. Soyez, “Inclusive jet spectrum for small-radius jets,” JHEP 06 (2016) 057, arXiv:1602.01110 [hep-ph].
- [93] M. Cacciari, G. P. Salam, and G. Soyez, “The Catchment Area of Jets,” JHEP 04 (2008) 005, arXiv:0802.1188 [hep-ph].
- [94] PHENIX Collaboration, S. S. Adler et al., “Common suppression pattern of eta and pi0 mesons at high transverse momentum in Au+Au collisions at ,” Phys. Rev. Lett. 96 (2006) 202301, arXiv:nucl-ex/0601037.
- [95] PHENIX Collaboration, A. Adare et al., “Azimuthal anisotropy of and mesons in Au+Au collisions at GeV,” Phys. Rev. C 88 no. 6, (2013) 064910, arXiv:1309.4437 [nucl-ex].
- [96] PHENIX Collaboration, S. Afanasiev et al., “Measurement of Direct Photons in Au+Au Collisions at GeV,” Phys. Rev. Lett. 109 (2012) 152302, arXiv:1205.5759 [nucl-ex].
- [97] STAR Collaboration, B. I. Abelev et al., “Systematic Measurements of Identified Particle Spectra in pp, d+Au and Au+Au Collisions from STAR,” Phys. Rev. C 79 (2009) 034909, arXiv:0808.2041 [nucl-ex].
- [98] A. Hocker and V. Kartvelishvili, “SVD approach to data unfolding,” Nucl. Instrum. Meth. A 372 (1996) 469–481, arXiv:hep-ph/9509307 [hep-ph].
- [99] G. D’Agostini, “A Multidimensional unfolding method based on Bayes’ theorem,” Nucl. Instrum. Meth. A 362 (1995) 487–498.
- [100] http://hepunx.rl.ac.uk/~adye/software/unfold/RooUnfold.html.
- [101] Bähr, M. and Gieseke, S. and Gigg, M. A. and Grellscheid, D. and Hamilton, K. and Latunde-Dada, O. and Plätzer, S. and Richardson, P. and Seymour, M. H. and Sherstnev, A. and Webber, B. R., “Herwig++ physics and manual,” Eur. Phys. J. C 58 (2008) 639, arXiv:0803.0883 [hep-ph].
- [102] ALICE Collaboration, S. Acharya et al., “Measurement of charged jet cross section in collisions at TeV,” Phys. Rev. D 100 no. 9, (2019) 092004, arXiv:1905.02536 [nucl-ex].
- [103] J. Casalderrey-Solana, G. Milhano, D. Pablos, and K. Rajagopal, “Modification of Jet Substructure in Heavy Ion Collisions as a Probe of the Resolution Length of Quark-Gluon Plasma,” JHEP 01 (2020) 044, arXiv:1907.11248 [hep-ph].