MIDIS: JWST/MIRI reveals the Stellar Structure of ALMA-selected Galaxies in the Hubble–UDF at Cosmic Noon
Abstract
We present deep James Webb Space Telescope (JWST)/MIRI F560W observations of a flux-limited, ALMA-selected sample of 28 galaxies at – in the Hubble Ultra Deep Field (HUDF). The data from the MIRI Deep Imaging Survey (MIDIS) reveal the stellar structure of the HUDF galaxies at rest-wavelengths of µm for the first time. We revise the stellar mass estimates using new JWST photometry and find good agreement with pre-JWST analysis; the few discrepancies can be explained by blending issues in the earlier lower-resolution Spitzer data. At , the resolved rest-frame near-infrared (1.6 µm) structure of the galaxies is significantly more smooth and centrally concentrated than seen by HST at rest-frame 450 nm (F160W), with effective radii of –5 kpc and Sérsic indices mostly close to an exponential (disk-like) profile (), up to (excluding AGN). We find an average size ratio of that decreases with stellar mass. The stellar structure of the ALMA-selected galaxies is indistinguishable from a HUDF reference sample of galaxies with comparable MIRI flux density. We supplement our analysis with custom-made, position-dependent, empirical PSF models for the F560W observations. The results imply that an older and smoother stellar structure is in place in massive gas-rich, star-forming galaxies at Cosmic Noon, despite a more clumpy rest-frame optical appearance, placing additional constraints on galaxy formation simulations. As a next step, matched-resolution, resolved ALMA observations will be crucial to further link the mass- and light-weighted galaxy structures to the dusty interstellar medium.
1 Introduction
Galaxy formation reached its high point around 10 billion years ago during the peak of cosmic star formation at Cosmic Noon (; Madau & Dickinson 2014). The typical star-forming galaxy, located on the galaxy main sequence (MS), formed around more stars during this epoch than a galaxy with similar stellar mass in the local universe (e.g., Whitaker et al., 2014). This rise in the global star formation rates goes hand-in-hand with an increase in the global molecular gas content of galaxies (Walter et al., 2014, 2016; Riechers et al., 2019; Decarli et al., 2020; Boogaard et al., 2023). Galaxies at Cosmic Noon are significantly more gas-rich than their local counterparts at fixed stellar mass, with a total cold gas mass that can exceed the total mass in stars (; e.g., Tacconi et al. 2013, 2018). These large gas fractions are expected to have a significant impact on the conditions inside the interstellar medium (ISM), potentially leading to the apparently clumpy star-forming structures in the rest-frame UV/optical and increased ionized-gas velocity dispersions (see Förster Schreiber & Wuyts 2020 for a review).
Yet, the older stellar populations—best traced at rest-frame wavelengths µm—which contain the bulk of the stellar mass, have remained unresolved due to the relatively large point-spread-function (PSF) of the Spitzer/IRAC instrument (16–20, or 13–17 kpc at ; Fazio et al., 2004) and their flux has remained uncertain due to the complex deblending of neighbouring sources (e.g., Labbé et al., 2015). As a result, the total stellar mass and structure of the galaxies remain uncertain, as well as the gas fraction and its potential impact on galaxy structure. This leaves open important questions, such as whether the galaxies are intrinsically clumpy, or whether their underlying stellar-mass distribution is smooth.
The Mid-Infrared Instrument (MIRI) on board the James Webb Space Telescope (JWST) can now provide sensitive, high-resolution imaging at wavelengths of 5.6 µm and above (Wright et al., 2023). This allows one to trace the rest-frame near-infrared light of galaxies at ( µm) and beyond for the first time, with unprecedented spatial resolution ( at 5.6 µm, or 1.7 kpc at ).
In this paper, we utilise deep JWST/MIRI observations to study a flux-limited sample of dust continuum- and cold gas-selected galaxies in the Hubble Ultra Deep Field (HUDF). The sample is taken from the ALMA Spectroscopic Survey (ASPECS) Large Program (Walter et al., 2016; Decarli et al., 2019, 2020) that performed flux-limited spectral scans in the 1.2 mm and 3 mm bands to detect molecular gas via 12CO across cosmic time (González-López et al., 2019; Boogaard et al., 2019) while simultaneously obtaining extremely sensitive 1.2 mm dust continuum imaging over the HUDF (González-López et al., 2020; Aravena et al., 2020).
This paper is organised as follows: in § 2 we present the JWST observations, including NIRCam imaging and slitless spectroscopy. In § 3 we discuss the updated properties of the full ALMA sample in the JWST era. We then analyse the rest-frame near-infrared morphology focusing on the galaxies, now probed by the deep MIRI/F560W observations, in § 4 and discuss the results in § 5. We adopt a Chabrier (2003) initial mass function and a Planck Collaboration et al. (2020) cosmology (flat CDM with km s-1 Mpc-1, and ). We use to denote and for the natural logarithm. We report magnitudes in the AB system (Oke & Gunn, 1983).
2 JWST Observations
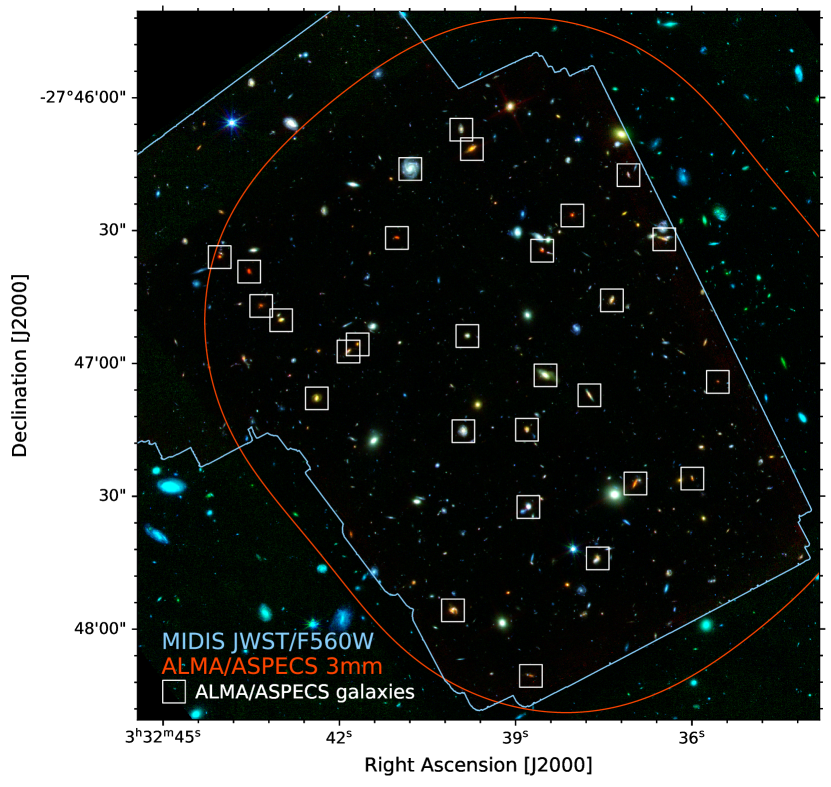
The MIRI Deep Imaging Survey (MIDIS) is a deep JWST/MIRI survey of the Hubble UDF conducted by the MIRI European Consortium GTO program (Prog. ID 1283, PI: G. Östlin). MIDIS was designed as a single F560W deep field, spread over 6 observations totaling 63 hours (48.8 h net exposure time), with 100 groups, 100 integrations and a 10-point random cycling dither pattern. The majority of the MIDIS observations (4/6) were executed between 2–6 December 2022, while the fifth observation was executed on 20 December 2022, at a slightly different central position and position angle, due to several safe-mode incidents of the observatory in the meantime. The sixth observation has not been completed to date. The data were reduced using the official JWST pipeline version 1.8.4 (pmap=1019). In addition to the default pipeline steps, we perform custom routines to deal with cosmic showers, background variations and other well known MIRI instrument effects as well as the absolute and relative astrometric alignment of the exposures. These additional steps use similar approaches to the steps taken in other high-redshift studies (e.g. Bagley et al., 2023; Iani et al., 2022; Rinaldi et al., 2023). The final mosaic consists of a total of 96 exposures with 50 unique dithers and has a total exposure time of 41.4 h, reaching a point-source depth of mag, and covers a total area of 4.7 arcmin2. Further details will be described in Östlin et al. (in prep.).
In addition to the MIRI data, we use the publicly available JWST/NIRCam imaging over the HUDF, taken as part of the programs JEMS (Prog. ID 1963; Williams et al., 2023) and FRESCO (Prog. ID 1895; Oesch et al., 2023). We use the combined medium band and wide band observations in the F182M, F210M, F430M, F444W, F460M and F480M filters, as reduced with the JWST pipeline and Grizli (Brammer, 2023) from the Grizli Image Release v6.0, 8 March 2023111https://github.com/gbrammer/grizli/blob/master/docs/grizli/image-release-v6.rst.
JWST/NIRCam slitless spectroscopy over the HUDF was taken as part of the FRESCO program and used to obtain redshift information of galaxies without prior secure redshift information. These observations were taken in the F444W filter (covering 3.9–5.0µm, limited to 4.4 µm for part of the survey area) and a single grism orientation (GrismR) with a resolution of . Two hours of exposure time is obtained in 8 exposures, designed to reach a point-source depth for an unresolved emission line of erg s-1 cm-2. For more details on the spectral coverage and extraction we refer to Oesch et al. (2023).
3 Analysis
3.1 Sample
The flux-limited ASPECS sample consists of all galaxies that are detected in the deep 1.2 mm dust continuum image from ASPECS, that has an unprecedented 9.3 Jy beam-1 rms sensitivity and a resolution (beam size) of roughly 13 (González-López et al., 2020; Aravena et al., 2020). From this sample, we discard two sources (1mm.C27 and 1mm.C29) that remain without counterparts in the optical-FIR and also the new JWST imaging and are potentially false-positives, consistent with the fidelity estimates of the sample (González-López et al., 2020). The continuum-selected sample includes all of the 12CO-selected galaxies (González-López et al., 2019; Boogaard et al., 2019), as discussed in Boogaard et al. (2020), apart from two sources detected in 12CO only, which are included in Table 1 for completeness, but excluded from the analysis where relevant (one of these sources is part of the continuum-faint sample, see § 4.2). The sample also encompasses all 1 mm continuum sources from shallower ALMA data in the HUDF area (e.g., Dunlop et al., 2017; Franco et al., 2018; Hatsukade et al., 2018).
As the Rayleigh-Jeans tail of the dust continuum emission is nearly always optically thin, the 1.2 mm selection is essentially a cold dust mass selection (the phase which contains most of the dust mass) and effectively also a cold, molecular gas mass selection (e.g., Hildebrand 1983; Scoville et al. 2014, 2016; see Aravena et al. 2020, their Appendix A, on the consistency between the dust- and 12CO-based molecular gas mass estimates).
3.2 Redshifts
Most ASPECS sources already have spectroscopic redshifts from the deep MUSE HUDF and MXDF Surveys (Bacon et al., 2017, 2023, see Boogaard et al. 2019 and Aravena et al. 2020) and/or their multi- CO and emission (Boogaard et al., 2020). The few sources with missing spectroscopic redshifts lie primarily between and where there are no bright emission lines covered by MUSE, including , where there is also no low- CO-coverage from ASPECS (see Boogaard et al. 2019, Fig. 1). This gap in spectroscopic redshift coverage is now mostly filled by FRESCO, that covers the , , and lines between , as well as the line (between ) and many fainter lines.
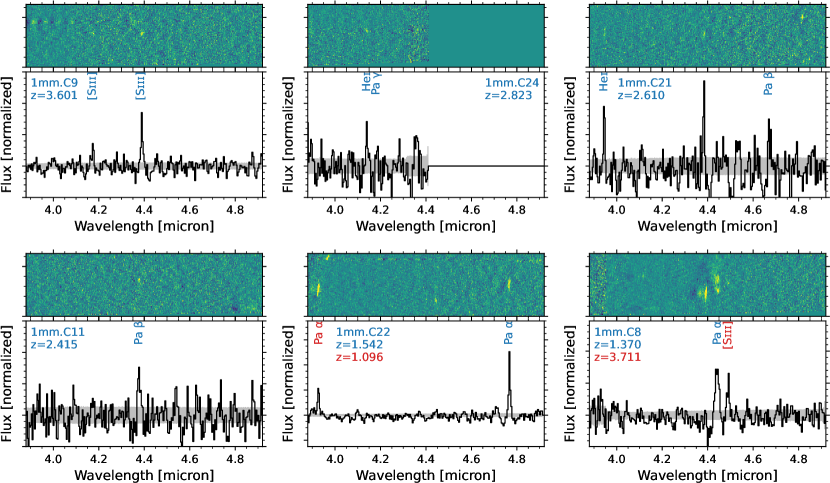
We extract FRESCO spectra for all ALMA sources, removing the continuum using a median filter, and search for bright emission lines in a window around the known redshift. We detect line emission in nearly all sources that have spectral coverage of the brightest emission lines. Notably, we confirm the earlier photometric redshifts for all sources (see Aravena et al., 2020), except for 1mm.C2 (the only source without spectroscopic redshift), for which we revise the photometric redshift from 1.76 to (at which no bright emission lines are covered in all available observations) based on the JWST imaging and using EAZY (Brammer et al., 2008). We also detect in the highest redshift source and resolve the tentative MUSE redshifts for two known blended sources, 1mm.C08 and 1mm.C22 (which corresponds to the northern galaxy). The updated redshift information is given in Table 1. The FRESCO spectra of the aforementioned sources are shown in Fig. 9 in Appendix B.
3.3 Spectral energy distributions
Photometry is performed for all sources in the F560W image in the MIRI, NIRCam and HST bands with The Farmer (Weaver et al., 2022), using our F560W PSF model for MIRI (see Appendix A) and WebbPSF models for NIRCam (Perrin et al., 2012, 2014). In brief, we first detect and model the galaxies in F560W MIRI band, and then perform forced photometry in the other multi-wavelength bands, allowing the flux to vary, whilst keeping the structural parameters fixed (for details see Gillman et al., in prep.).
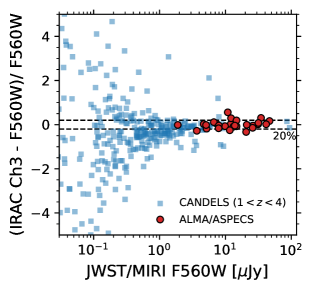
We compare the F560W fluxes for all sources in the combined MIDIS and ASPECS field to the Spitzer IRAC/Channel 3 (5.8µm) fluxes from CANDELS (Guo et al., 2013) in Fig. 3. Overall, the Spitzer fluxes agree reasonably well with MIRI at the bright end (above Jy), but show significant scatter below Jy. The ASPECS sources are all relatively bright and overall the integrated MIRI and Spitzer fluxes agree to on average. The strongest outlier is 1mm.C22, which is indeed heavily blended with a similarly-bright neighbouring galaxy (see Fig. 2).
We model the spectral energy distributions using the high-z version of Magphys (Da Cunha et al., 2008, 2015), including Magphys+AGN models (Chang et al., 2017) for sources with known AGN activity. We join the new JWST and HST photometry with the total fluxes from existing longer-wavelength photometry from Spitzer/IRAC 24 µm (Whitaker et al., 2014), Herschel/PACS 100 and 160 µm (Elbaz et al., 2011) and ALMA at 1 mm and 3 mm (Dunlop et al., 2017; González-López et al., 2019, 2020), including upper limits on the mm flux. We mask the NIRCam medium bands that contain bright emission lines to mitigate their potential impact. The resulting stellar masses are listed in Table 1. The total stellar masses are very consistent (within 0.1 dex) with the pre-JWST determinations using the same models (cf. Aravena et al., 2020; Boogaard et al., 2020) which we attribute to the good agreement between the integrated fluxes from Spitzer fluxes and JWST for the ALMA sources.
3.4 Structural parameters
We measure the global structural parameters observed in the MIRI/F560W filter by modeling the galaxies with a single Sérsic profile (Sérsic, 1963) using GALFIT (Peng et al., 2002). We create pixel cutouts around each source from the background-subtracted F560W science image and error map at resolution. We adopt initial guesses on the magnitude, half light radius (), Sérsic index (), axis ratio (), and position angle from The Farmer catalog. We simultaneously model all sources in the cutout up to 2.5 magnitudes fainter and within 3″ of the target source and mask fainter sources using the segmentation map. We slightly tweak these parameters for the background sources in a few individual cases to improve the overall fit. For the PSF, we use our empirical, position-dependent PSF model, that is described in Appendix A. To take into account systematic errors and residual uncertainties in the PSF, we quadratically fold in a minimum uncertainty on the effective radius and Sérsic index of half a pixel and 0.2 respectively (cf. van der Wel et al., 2012).
The best-fit parameters for all ASPECS galaxies are listed in Table 1. We discard the two AGN that are best-fit with a point-source template from the structural analysis (3mm.09 and 1mm.C08, see Fig. 2). From the reference sample of galaxies in the HUDF (see § 4.2), we remove all galaxies for which GALFIT returned bad flags or parameter values at the edge of the parameter space (indicative of bad fits). These galaxies are typically at the edge of the field and/or affected by strong gradients in the background.
4 Results
4.1 Rest-frame Near-Infrared Morphology at
The MIDIS observations at 5.6 µm resolve the rest-frame near-infrared light of galaxies at , around µm, for the first time. These wavelengths trace the bulk of the (older) stellar light, that remained inaccessible with HST, and are less affected by dust attenuation than observations at shorter wavelengths.
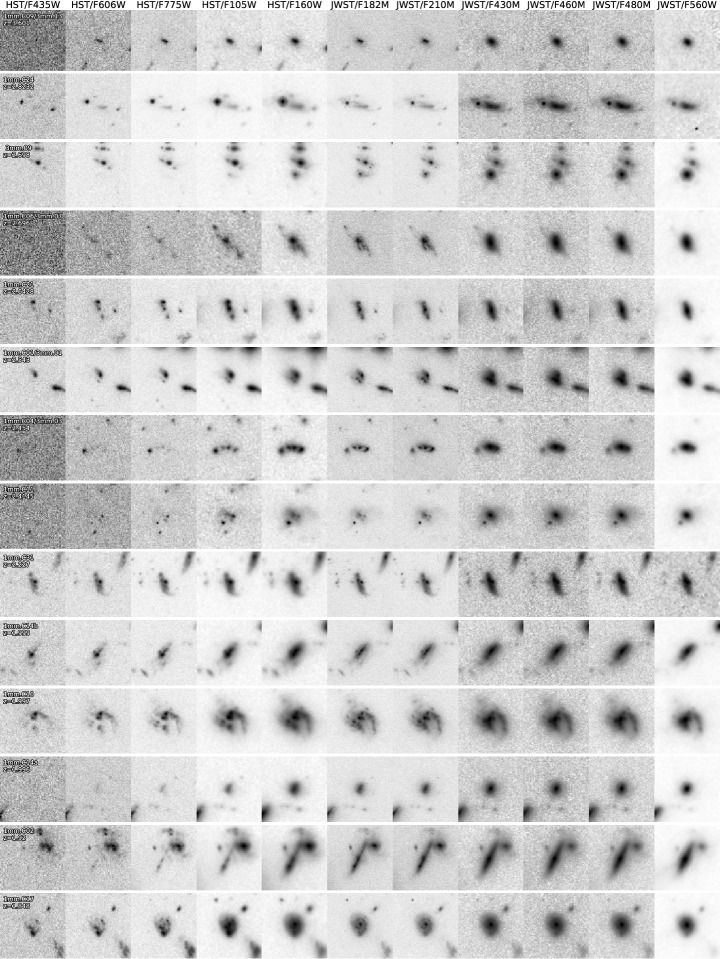
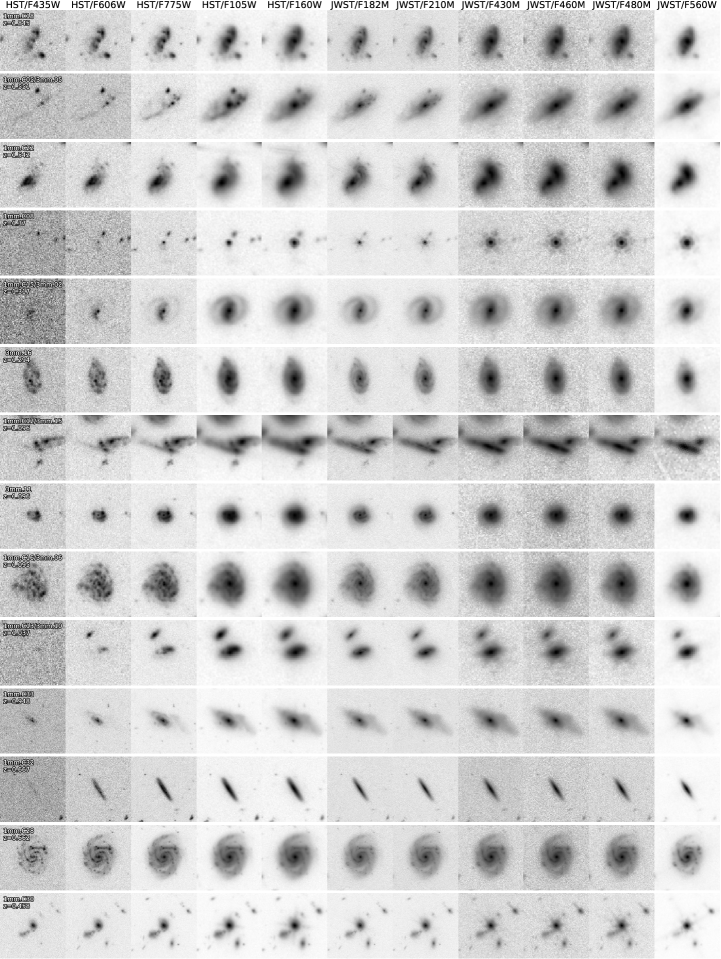
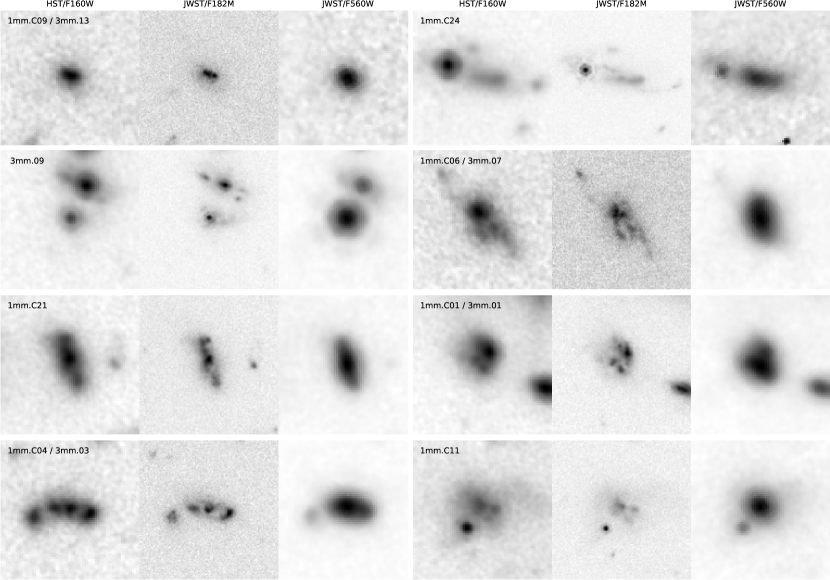
Fig. 2 shows that the observed-frame 5.6 µm morphology of the galaxies at is markedly different from the morphology traced at shorter wavelengths. To examine the morphological differences at in more detail, we compare the HST/F160W, and now higher-resolution NIRCam/F182M at similar wavelengths, to the MIRI/F560W observations in Fig. 4 (more extensive multi-wavelength cutouts of all sources are shown in Appendix C). We also include the highest-redshift source at in this sample (the only galaxy above ) where F560W probes µm.
The MIRI observations reveal that all sources have a centrally concentrated and relatively smooth light distribution at rest-frame 1.6 µm. This is in contrast to the significantly more substructured or clumpy appearance in HST and NIRCam at rest-frame 450 nm. We stress the smoother morphology is intrinsic and not primarily due to the MIRI/F560W PSF (with a ). This can be seen by comparing to the HST/F160W observations, which trace roughly the same wavelength as NIRCam/F182M, but have a similar PSF size () as MIRI/F560W. In all cases, the galaxies show significantly more substructure in the F160W filter than in F560W.
As an aside, we note that the high-resolution NIRCam imaging reveals some striking details in the galaxies (Fig. 4). This includes rich substructure in the X-ray AGN 1mm.C01, which suggests merger activity may be triggering the starburst and AGN activity in this system. For the X-ray AGN 3mm.09, there is extended emission in the F182M filter not present in F210M (Fig. 10). This is likely + emission in the medium band that could originate from a gas in/outflow or gas that is ionised by the AGN at larger distances. Notable are also the pronounced obscuring dust structures (lanes) visible in several galaxies across the entire redshift range of our sample.
4.2 Structural parameters at – with MIRI and HST
We analyse the structural parameters of the ALMA sources in the context of a flux-limited reference sample, consisting of all galaxies at –4 in the HUDF galaxy population covered by MIRI and ALMA that have a flux density Jy. The redshifts for the non-ALMA sources are taken from the MUSE (Bacon et al., 2023) or else 3D-HST (Momcheva et al., 2016) catalogs.
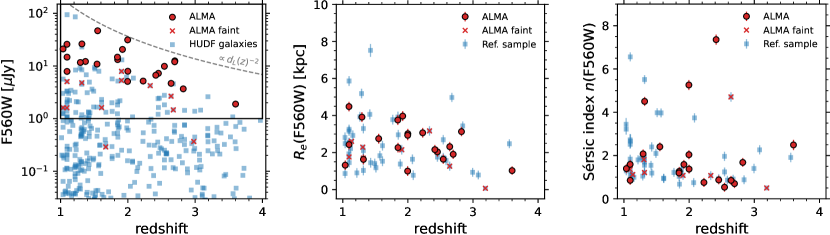
We show the F560W fluxes of the dust continuum-selected galaxies in the context of the HUDF galaxy population in Fig. 5. The ASPECS galaxies trace the bright end of the galaxy population in F560W. In addition to the flux-limited ALMA sample, we also mark the fainter galaxies in the MIDIS footprint that were detected at 1.2 mm based on an optical–FIR prior (González-López et al., 2020). These galaxies mostly correspond to galaxies that lie just below the formal blind detection threshold of ASPECS.
The GALFIT-derived structural parameters are shown in Fig. 5. The effective radii of the ALMA galaxies are between –5 kpc, slightly decreasing towards higher redshift on average, as expected from the evolution of the mass-size relation (van der Wel et al., 2014). The ALMA galaxies trace a similar distribution in effective radius as the other galaxies from the HUDF reference sample. The Sérsic indices are shown in the rightmost panel of Fig. 5. Between , where MIRI traces rest-frame µm, most galaxies have indicating an exponential profile that is typical for star-forming disks, while a few show higher, , Sérsic indices. The highest-redshift galaxy at ( µm) has . Below , the ALMA galaxies show a range of Sérsic indices, mostly between 1 and 3. Overall, the distribution of Sérsic indices follows the HUDF reference sample, with potentially a slight trend towards lower Sérsic indices.
Next, we compare the structural parameters measured at µm by MIRI to the measurements at µm. As measuring the structural parameters requires accurate knowledge of the PSF, we do not measure the structural parameters from the NIRCam imaging, but instead refer to the established measurements from HST/F160W by van der Wel et al. (2012). This excludes 1mm.C12 (AGN) and 1mm.C22 as they are not properly deblended in the HST catalog.
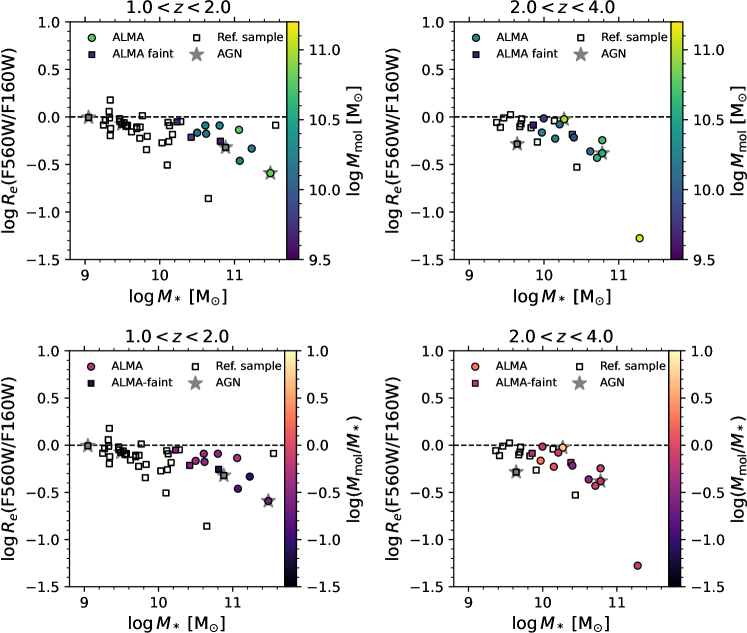
The average effective radius at 5.6 µm is smaller than at 1.6 µm. For the ASPECS sources, is on average about 35% and 30% smaller than at and , respectively. For the full reference sample at Jy, is about 20% smaller than at both and . We show the ratio of effective radii as a function of stellar mass and in Fig. 6. We find that the ratio decreases as a function of stellar mass, such that more massive galaxies have relatively more compact light profiles at longer wavelengths. A similar trend has been shown by Suess et al. (2022) comparing shorter-wavelength NIRCam 4.4 and 1.5 µm observations for a larger sample of galaxies out to (see also Gillman et al. 2023). The Sérsic indices are, on average, roughly a factor larger in F560W than in F160W, though with a significant scatter and no clear trend with stellar mass or redshift.
We also investigate correlations between the JWST/HST size ratio and quantities related to the cold gas mass (or, equivalently, the cold dust mass, see § 3.1). We find that the size-ratio at most weakly anti-correlates with gas mass, but more strongly correlates with gas-to-stellar mass ratio, with a slope that is close to the inverse of the trend found with stellar mass.
5 Discussion
5.1 HST vs. JWST structure and morphology
The MIRI observations imply that the mass-weighted stellar structure ( µm) of these galaxies is significantly smoother compared to the light-weighted structure in the rest-frame optical frame observed with HST and NIRCam at nm. The more structured and clumpy rest-optical morphology can be due to a combination of different factors. If the underlying true distribution of young stars and star formation (traced by HST) was as smooth as seen in the stellar mass (traced by JWST/MIRI), the structure at 450 nm could be due to a patchy distribution of attenuating dust, leading to the more clumpy morphology. On the other hand, star formation is expected to occur in spatially-separated clumps, i.e., the observed HST morphology may reflect the actual underlying distribution of young stars. Matched high-resolution ALMA imaging of the dust distribution will be able to measure the relative impact of the two scenarios.
5.2 HST vs. JWST sizes and color gradients
Most galaxies in our sample at show large –5 kpc, exponential (disk-like) structures (). The fact that the ASPECS galaxies do not clearly stand out in their structural parameters compared to the other sources in the HUDF reference sample (Fig. 5), implies that at the depth reached by ASPECS over a relatively small field, the galaxies mostly trace the massive end of the typical galaxy population at these redshifts (cf. Boogaard et al., 2019; González-López et al., 2020).
The inferred rest-frame near-infrared sizes are smaller compared to those observed in the rest-frame optical, implying a negative color gradient (i.e., the galaxies have redder centers). A similar trend has also been observed in other galaxy populations (e.g., Suess et al., 2022), including local face-on spiral galaxies (e.g., Casasola et al., 2017), and can be driven by differences in the properties of the stars, such as their age, or by dust extinction. The results can thus be attributed to the presence or formation of an older, more centrally concentrated stellar population (such as a bulge) and/or stronger dust extinction in the center (potentially linked to compact central star formation), where both lead to a ‘flatter’ distribution in the rest-frame optical bands. The trend with stellar mass can be linked to the same effects becoming stronger in more massive star-forming galaxies. Indeed, massive galaxies are known to show overall stronger extinction and a larger fraction of obscured star formation (e.g., Garn & Best, 2010; Whitaker et al., 2017) and have stronger extinction towards their centers (e.g., Nelson et al., 2016; Matharu et al., 2023).
While the rest-frame 1.6 µm emission is primarily sensitive to the old stellar light, it may also contain a contribution from an AGN, which can make the profiles look more centrally concentrated (e.g., Prieto et al., 2010). While the number of AGN in the sample is limited, we do not see a clear difference in Fig. 6 between the ALMA galaxies that are identified as AGN and those that are not (note this already excludes the two AGN best-fit with a point-source model). In the same vein, the MIRI emission may also trace nebular continuum and/or high equivalent width emission lines in case of very vigorous young star formation, which can have a complicated impact on the morphology (e.g., Papaderos et al., 2023). This would most strongly impact galaxies with a low stellar mass and/or high specific SFR. Given the comparatively smooth light distribution over large scales, this however does not appear to have a major impact on the MIRI morphology of the relatively massive gas rich galaxies studied here.
5.3 Trends with total gas/dust mass?
It would be interesting to assess whether the color and size trends above are correlated with any other galaxy property. As dust can be responsible for some of the observed trends, we can check for the influence of the total dust (or gas) mass, even in the absence of resolved dust imaging. However, both the gas mass and the gas-to-stellar-mass fraction are known to independently correlate and anti-correlate with stellar mass, respectively (e.g., Tacconi et al., 2018; Aravena et al., 2019), and larger samples are needed to distinguish potential trends. Again, we would expect a relation with the resolved dust properties. The sizes of the dust in these massive star-forming galaxies are often significantly smaller than the rest-optical sizes (Tadaki et al., 2020), though typically not extremely compact as seen in submillimeter galaxies (e.g. Gullberg et al., 2019). Based on the average sub-mm/optical size ratios, they may even be more compact than the stellar sizes now measured with MIRI. This centrally concentrated dust emission is often linked to a compact starburst, which may be responsible for building up bulges (e.g. Nelson et al., 2019; Tadaki et al., 2020). Though note the dust may also appear more compact due to dust temperature gradients, as also shown in simulations (e.g., Cochrane et al., 2019; Popping et al., 2022). Matched high-resolution ALMA imaging, especially in multiple bands, would help to differentiate between the presence (or formation) of a bulge and/or stronger extinction in the center, especially in combination with studies of the resolved color gradients and spectral energy distributions now possible with JWST (e.g. Miller et al., 2022; Pérez-González et al., 2023).
6 Summary and Conclusions
We present JWST/MIRI F560W observations of the stellar structure of gas- and dust-rich galaxies in the Hubble Ultra Deep Field (HUDF) at rest-wavelengths of µm using the MIRI Deep Imaging Survey (MIDIS).
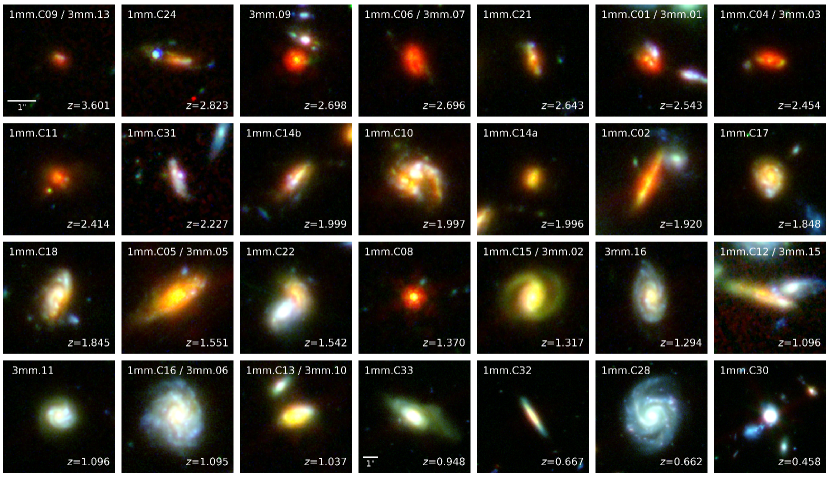
We select a complete, 1.2 mm continuum flux-limited sample of 35 galaxies from the ALMA Spectroscopic Survey (ASPECS)—encompassing all sources from shallower ALMA 1 mm continuum imaging in the HUDF—of which 28 lie within the 4.7 arcmin2 footprint of MIDIS, at –3.6. Using NIRCam slitless spectroscopy from FRESCO, we determine the spectroscopic redshifts for the few galaxies in the ASPECS sample that were still missing spectroscopic confirmation, in particular in the range.
We find good agreement between the MIRI/F560W flux densities and those previously determined from (deblended) Spitzer IRAC 5.8 µm observations for the ALMA sources (to within 20%). Subsequently, we revisit the stellar masses by modeling the spectral energy distributions with Magphys+AGN models, finding good agreement with previous determinations. The reinforcement of the (IRAC-based) stellar mass estimates for the ALMA galaxies at implies that there are no fundamental changes to the previously reported gas and dust-mass fractions (for these bright and relatively massive systems), nor to how the properties of this population of gas and dust-rich galaxies evolve with stellar mass (Aravena et al., 2019, 2020; Boogaard et al., 2019; González-López et al., 2020).
We find that the rest-frame near-infrared light distribution at µm of the ALMA galaxies at —that can now be resolved with MIRI—is intrinsically more smooth and centrally concentrated compared to the more substructured or clumpy appearance in the rest-frame UV/optical at nm as probed by HST/F160W. This is not a resolution effect as both observations have a similar PSF. We build a custom, position-dependent, empirical PSF model for the MIDIS observations (described in Appendix A) and use it to perform a structural analysis using GALFIT. We find the galaxies at have effective radii of –5 kpc and Sérsic indices mostly close to , consistent with an exponential (disk-like) profile, up to (excluding AGN). We find average size ratios between JWST and HST of and 0.7 at and respectively, that decrease with stellar mass. Overall the mass-weighted stellar structure of the ALMA-selected galaxies is indistinguishable from a reference sample of other galaxies in the HUDF.
The results imply that an older and smoother stellar structure is already in place in gas-rich, star-forming galaxies at cosmic noon and their clumpy rest-frame optical is likely caused by a combination of intrinsically clumpy star formation and/or patchy dust extinction. The difference in the mass-weighted radial structure of the galaxies now traced by MIRI, compared to earlier observations with HST, can be explained both by the presence of stronger dust extinction; in the center, potentially linked to compact central star formation, and/or presence or formation of older central stellar populations, such as a bulge. Future matched-resolution, spatially resolved ALMA observations will be key to measure the actual extent (size) of the dust and its resolved structure and column densities on the same scale as MIRI, and link the dust properties to the resolved optical/near-IR morphology that we can now for the first time characterize with JWST.
| ID 1mm | ID 3mm | R.A. | Decl. | Ref | X-ray | (F560W) | ||||
|---|---|---|---|---|---|---|---|---|---|---|
| (Jy) | ( M⊙) | () | ||||||||
| 1mm.C09 | 3mm.13 | 03:32:35.56 | -27:47:04.2 | 3.601 | CO,F | 1.89 0.02 | 0.94 0.25 | 1.03 0.22 | 2.49 0.23 | |
| 1mm.C24 | 03:32:38.76 | -27:48:10.4 | 2.823 | F | 3.68 0.03 | 1.41 0.36 | 3.13 0.24 | 1.68 0.20 | ||
| UDF-1 | 3mm.09 | 03:32:44.03 | -27:46:36.0 | 2.698 | CO,F | AGN | 12.52 0.01 | 24.55 5.99 | ||
| 1mm.C06 | 3mm.07 | 03:32:43.53 | -27:46:39.2 | 2.696 | CO,F | 12.01 0.02 | 19.05 4.39 | 1.91 0.24 | 0.70 0.20 | |
| 1mm.C21 | 03:32:35.98 | -27:47:25.8 | 2.643 | F | 4.67 0.02 | 2.51 0.58 | 2.32 0.24 | 0.85 0.20 | ||
| 1mm.C07 | 03:32:35.08 | -27:46:47.8 | 2.580 | CO,F | AGN | |||||
| 1mm.C19 | 3mm.12 | 03:32:36.19 | -27:46:28.0 | 2.574 | CO,M,F | AGN | ||||
| 1mm.C01 | 3mm.01 | 03:32:38.54 | -27:46:34.6 | 2.543 | CO,M,F | AGN | 9.86 0.02 | 1.86 0.43 | 1.64 0.25 | 0.53 0.20 |
| 1mm.C04 | 3mm.03 | 03:32:41.02 | -27:46:31.6 | 2.454 | CO,F | 7.25 0.02 | 5.13 1.18 | 2.04 0.25 | 0.87 0.20 | |
| 1mm.C11 | 03:32:43.32 | -27:46:47.0 | 2.414 | F | AGN | 6.67 0.02 | 6.03 1.39 | 2.16 0.25 | 7.36 0.23 | |
| 1mm.C31 | 03:32:37.08 | -27:46:17.4 | 2.227 | M,F | 5.17 0.05 | 0.99 0.23 | 3.07 0.25 | 0.75 0.20 | ||
| 1mm.C14b | 03:32:41.846 | -27:46:56.997 | 1.999 | M | 7.94 0.02 | 1.62 0.4 | 3.02 0.26 | 1.37 0.20 | ||
| 1mm.C10 | 03:32:40.07 | -27:47:55.8 | 1.997 | CO,M | X | 31.32 0.03 | 6.03 1.39 | 2.93 0.26 | 2.04 0.20 | |
| 1mm.C14a | 03:32:41.69 | -27:46:55.6 | 1.996 | CO | 5.09 0.01 | 4.17 1.14 | 1.00 0.26 | 5.26 0.23 | ||
| 1mm.C02 | 03:32:36.96 | -27:47:27.2 | 1.920 | PHOT | 20.63 0.02 | 11.48 2.64 | 3.97 0.26 | 1.59 0.20 | ||
| 1mm.C17 | 03:32:38.80 | -27:47:14.8 | 1.848 | M | 13.22 0.02 | 4.17 1.03 | 2.27 0.26 | 1.27 0.20 | ||
| 1mm.C18 | 03:32:37.36 | -27:46:45.8 | 1.845 | M | X | 14.73 0.02 | 4.07 1.03 | 3.76 0.26 | 1.19 0.20 | |
| 1mm.C26 | 03:32:34.70 | -27:46:45.0 | 1.552 | M,F | ||||||
| 1mm.C05 | 3mm.05 | 03:32:39.75 | -27:46:11.6 | 1.551 | CO,M | AGN | 46.68 0.02 | 30.2 6.95 | 2.75 0.26 | 2.40 0.20 |
| 1mm.C22 | 03:32:37.60 | -27:47:44.2 | 1.542 | M,F | X | 10.86 0.02 | 3.02 0.7 | 2.99 0.26 | 0.80 0.20 | |
| 1mm.C03 | 3mm.04 | 03:32:34.45 | -27:46:59.8 | 1.414 | CO,M,F | |||||
| 1mm.C23 | 3mm.08 | 03:32:35.55 | -27:46:26.2 | 1.382 | CO,M,F | |||||
| 1mm.C08 | 03:32:38.03 | -27:46:26.6 | 1.370 | M,F | AGN | 12.18 0.01 | 9.55 2.24 | |||
| 1mm.C15 | 3mm.02 | 03:32:42.37 | -27:47:07.8 | 1.317 | CO,M,F | 26.23 0.03 | 11.75 2.79 | 1.63 0.26 | 4.50 0.20 | |
| Faint.1mm.C20 | 3mm.16 | 03:32:39.92 | -27:46:07.4 | 1.294 | CO,M,F | 11.65 0.03 | 3.16 0.78 | 3.91 0.26 | 2.08 0.20 | |
| 1mm.C25 | 3mm.14 | 03:32:34.85 | -27:46:40.6 | 1.098 | CO,M,F | |||||
| 3mm.11 | 03:32:39.81 | -27:46:53.5 | 1.096 | CO,M,F | 7.88 0.02 | 2.19 0.56 | 2.43 0.25 | 0.85 0.20 | ||
| 1mm.C12 | 3mm.15 | 03:32:36.48 | -27:46:31.8 | 1.096 | CO,M,F | AGN | 14.73 0.06 | 2.51 0.59 | 4.73 0.25 | 1.15 0.20 |
| 1mm.C16 | 3mm.06 | 03:32:39.87 | -27:47:15.2 | 1.095 | CO,M,F | X | 25.87 0.03 | 6.31 2.05 | 4.48 0.25 | 1.59 0.20 |
| 1mm.C20 | 03:32:35.77 | -27:46:27.6 | 1.093 | M,F | ||||||
| 1mm.C13 | 3mm.10 | 03:32:42.98 | -27:46:50.2 | 1.037 | CO,M,F | 21.06 0.02 | 16.98 3.92 | 1.32 0.25 | 1.39 0.20 | |
| 1mm.C33 | 03:32:38.50 | -27:47:02.8 | 0.948 | M | 41.50 0.03 | 10.47 2.41 | 3.98 0.24 | 5.24 0.20 | ||
| 1mm.C32 | 03:32:37.75 | -27:47:06.8 | 0.667 | M | 13.90 0.02 | 2.0 0.56 | 3.47 0.22 | 0.81 0.20 | ||
| 1mm.C28 | 03:32:40.85 | -27:46:16.4 | 0.662 | M | 34.70 0.04 | 3.8 0.98 | 8.06 0.22 | 1.63 0.20 | ||
| 1mm.C30 | 03:32:38.79 | -27:47:32.4 | 0.458 | M,F | X | 31.63 0.02 | 0.4 0.09 | 0.56 0.18 | 2.28 0.20 |
Note. — (1) ALMA 1mm Continuum ID (1mm.C##: ASPECS-LP González-López et al. 2020; Aravena et al. 2020; UDF#: Dunlop et al. 2017) (2) ALMA 3mm CO ID (González-López et al., 2019; Boogaard et al., 2019) (3) Right Ascension (4) Declination (5) Redshift (6) Redshift reference: CO: CO and/or line(s) (Boogaard et al., 2019, 2020), M: MUSE (Inami et al., 2017; Boogaard et al., 2019; Bacon et al., 2023), F: FRESCO (Oesch et al., 2023). (7) AGN or other X-ray Source (Luo et al., 2017). (8) MIRI/F560W flux density from MIDIS. (9) Stellar mass. (10) Effective radius. (11) Sérsic Index.
References
- Akhlaghi & Ichikawa (2015) Akhlaghi, M., & Ichikawa, T. 2015, The Astrophysical Journal Supplement Series, 220, 1, doi: 10.1088/0067-0049/220/1/1
- Aravena et al. (2019) Aravena, M., Decarli, R., Gónzalez-López, J., et al. 2019, The Astrophysical Journal, 882, 136, doi: 10.3847/1538-4357/ab30df
- Aravena et al. (2020) Aravena, M., Boogaard, L., Gónzalez-López, J., et al. 2020, The Astrophysical Journal, 901, 79, doi: 10.3847/1538-4357/ab99a2
- Argyriou et al. (2023) Argyriou, I., Lage, C., Rieke, G. H., et al. 2023, 1. https://arxiv.org/abs/2303.13517
- Astropy Collaboration et al. (2022) Astropy Collaboration, Price-Whelan, A. M., Lim, P. L., et al. 2022, Astrophysical Journal, 935, 167, doi: 10.3847/1538-4357/ac7c74
- Bacon et al. (2017) Bacon, R., Conseil, S., Mary, D., et al. 2017, Astronomy & Astrophysics, 608, A1, doi: 10.1051/0004-6361/201730833
- Bacon et al. (2023) Bacon, R., Brinchmann, J., Conseil, S., et al. 2023, Astronomy and Astrophysics, 670, doi: 10.1051/0004-6361/202244187
- Bagley et al. (2023) Bagley, M. B., Finkelstein, S. L., Koekemoer, A. M., et al. 2023, The Astrophysical Journal Letters, 946, L12, doi: 10.3847/2041-8213/acbb08
- Boogaard et al. (2021) Boogaard, L., Meyer, R. A., & Novak, M. 2021, Interferopy: analysing datacubes from radio-to-submm observations, doi: 10.5281/ZENODO.5775603
- Boogaard et al. (2019) Boogaard, L. A., Decarli, R., González-López, J., et al. 2019, The Astrophysical Journal, 882, 140, doi: 10.3847/1538-4357/ab3102
- Boogaard et al. (2020) Boogaard, L. A., van der Werf, P., Weiss, A., et al. 2020, The Astrophysical Journal, 902, 109, doi: 10.3847/1538-4357/abb82f
- Boogaard et al. (2023) Boogaard, L. A., Decarli, R., Walter, F., et al. 2023, The Astrophysical Journal, 945, 111, doi: 10.3847/1538-4357/acb4f0
- Bradley et al. (2022) Bradley, L., Sipőcz, B., Robitaille, T., et al. 2022, astropy/photutils: 1.6.0, Zenodo, doi: 10.5281/zenodo.7419741
- Brammer (2023) Brammer, G. 2023, grizli, Zenodo, Zenodo, doi: 10.5281/zenodo.7712834
- Brammer et al. (2008) Brammer, G. B., van Dokkum, P. G., & Coppi, P. 2008, The Astrophysical Journal, 686, 1503, doi: 10.1086/591786
- Casasola et al. (2017) Casasola, V., Cassarà, L. P., Bianchi, S., et al. 2017, Astronomy and Astrophysics, 605, doi: 10.1051/0004-6361/201731020
- Chabrier (2003) Chabrier, G. 2003, Publications of the Astronomical Society of the Pacific, 115, 763, doi: 10.1086/376392
- Chang et al. (2017) Chang, Y.-Y., Le Floc’h, E., Juneau, S., et al. 2017, The Astrophysical Journal Supplement Series, 233, 19, doi: 10.3847/1538-4365/aa97da
- Cochrane et al. (2019) Cochrane, R. K., Hayward, C. C., Anglés-Alcázar, D., et al. 2019, Monthly Notices of the Royal Astronomical Society, 488, 1779, doi: 10.1093/mnras/stz1736
- Da Cunha et al. (2008) Da Cunha, E., Charlot, S., & Elbaz, D. 2008, Monthly Notices of the Royal Astronomical Society, 388, 1595, doi: 10.1111/j.1365-2966.2008.13535.x
- Da Cunha et al. (2015) Da Cunha, E., Walter, F., Smail, I. R., et al. 2015, Astrophysical Journal, 806, 110, doi: 10.1088/0004-637X/806/1/110
- Decarli et al. (2019) Decarli, R., Walter, F., Gónzalez-López, J., et al. 2019, The Astrophysical Journal, 882, 138, doi: 10.3847/1538-4357/ab30fe
- Decarli et al. (2020) Decarli, R., Aravena, M., Boogaard, L., et al. 2020, The Astrophysical Journal, 902, 110, doi: 10.3847/1538-4357/abaa3b
- Dunlop et al. (2017) Dunlop, J. S., McLure, R. J., Biggs, A. D., et al. 2017, Monthly Notices of the Royal Astronomical Society, 466, 861, doi: 10.1093/mnras/stw3088
- Elbaz et al. (2011) Elbaz, D., Dickinson, M., Hwang, H. S., et al. 2011, Astronomy & Astrophysics, 533, A119, doi: 10.1051/0004-6361/201117239
- Fazio et al. (2004) Fazio, G. G., Hora, J. L., Allen, L. E., et al. 2004, The Astrophysical Journal Supplement Series, 154, 10, doi: 10.1086/422843
- Förster Schreiber & Wuyts (2020) Förster Schreiber, N. M., & Wuyts, S. 2020, Annual Review of Astronomy and Astrophysics, 58, 661, doi: 10.1146/annurev-astro-032620-021910
- Franco et al. (2018) Franco, M., Elbaz, D., Béthermin, M., et al. 2018, Astronomy & Astrophysics, 620, A152, doi: 10.1051/0004-6361/201832928
- Garn & Best (2010) Garn, T., & Best, P. N. 2010, Monthly Notices of the Royal Astronomical Society, 409, 421, doi: 10.1111/j.1365-2966.2010.17321.x
- Gáspár et al. (2021) Gáspár, A., Rieke, G. H., Guillard, P., et al. 2021, Publications of the Astronomical Society of the Pacific, 133, 1, doi: 10.1088/1538-3873/abcd04
- Gillman et al. (2023) Gillman, S., Gullberg, B., Brammer, G., et al. 2023, Astronomy & Astrophysics, 676, A26, doi: 10.1051/0004-6361/202346531
- González-López et al. (2019) González-López, J., Decarli, R., Pavesi, R., et al. 2019, The Astrophysical Journal, 882, 139, doi: 10.3847/1538-4357/ab3105
- González-López et al. (2020) González-López, J., Novak, M., Decarli, R., et al. 2020, The Astrophysical Journal, 897, 91, doi: 10.3847/1538-4357/ab765b
- Gullberg et al. (2019) Gullberg, B., Smail, I., Swinbank, A. M., et al. 2019, Monthly Notices of the Royal Astronomical Society, 490, 4956, doi: 10.1093/mnras/stz2835
- Guo et al. (2013) Guo, K., Zhong Zheng, X., & Fu, H. 2013, The Astrophysical Journal, 778, 23, doi: 10.1088/0004-637X/778/1/23
- Harris et al. (2020) Harris, C. R., Millman, K. J., van der Walt, S. J., et al. 2020, Nature, 585, 357, doi: 10.1038/s41586-020-2649-2
- Hatsukade et al. (2018) Hatsukade, B., Kohno, K., Yamaguchi, Y., et al. 2018, Publications of the Astronomical Society of Japan, 70, 1, doi: 10.1093/pasj/psy104
- Hildebrand (1983) Hildebrand, R. 1983, Quarterly Journal of the Royal Astronomical Society, 24, 267
- Hunter (2007) Hunter, J. D. 2007, Computing in Science & Engineering, 9, 90, doi: 10.1109/MCSE.2007.55
- Iani et al. (2022) Iani, E., Caputi, K. I., Rinaldi, P., & Kokorev, V. I. 2022, The Astrophysical Journal Letters, 940, L24, doi: 10.3847/2041-8213/aca014
- Inami et al. (2017) Inami, H., Bacon, R., Brinchmann, J., et al. 2017, Astronomy & Astrophysics, 608, A2, doi: 10.1051/0004-6361/201731195
- Labbé et al. (2015) Labbé, I., Oesch, P. A., Illingworth, G. D., et al. 2015, Astrophysical Journal, Supplement Series, 221, 23, doi: 10.1088/0067-0049/221/2/23
- Luo et al. (2017) Luo, B., Brandt, W. N., Xue, Y. Q., et al. 2017, The Astrophysical Journal Supplement Series, 228, 2, doi: 10.3847/1538-4365/228/1/2
- Madau & Dickinson (2014) Madau, P., & Dickinson, M. 2014, Annual Review of Astronomy and Astrophysics, 52, 415, doi: 10.1146/annurev-astro-081811-125615
- Matharu et al. (2023) Matharu, J., Muzzin, A., Sarrouh, G. T. E., et al. 2023, The Astrophysical Journal Letters, 949, L11, doi: 10.3847/2041-8213/acd1db
- Miller et al. (2022) Miller, T. B., Whitaker, K. E., Nelson, E. J., et al. 2022, The Astrophysical Journal Letters, 941, L37, doi: 10.3847/2041-8213/aca675
- Momcheva et al. (2016) Momcheva, I. G., Brammer, G. B., van Dokkum, P. G., et al. 2016, The Astrophysical Journal Supplement Series, 225, 27, doi: 10.3847/0067-0049/225/2/27
- Nelson et al. (2019) Nelson, D., Pillepich, A., Springel, V., et al. 2019, Monthly Notices of the Royal Astronomical Society, 490, 3234, doi: 10.1093/mnras/stz2306
- Nelson et al. (2016) Nelson, E. J., van Dokkum, P. G., Momcheva, I. G., et al. 2016, The Astrophysical Journal, 817, L9, doi: 10.3847/2041-8205/817/1/l9
- Oesch et al. (2023) Oesch, P. A., Brammer, G., Naidu, R. P., et al. 2023, 11, 1. https://arxiv.org/abs/2304.02026
- Oke & Gunn (1983) Oke, J. B., & Gunn, J. E. 1983, The Astrophysical Journal, 266, 713, doi: 10.1086/160817
- Papaderos et al. (2023) Papaderos, P., Östlin, G., & Breda, I. 2023, Astronomy and Astrophysics, 673, 1, doi: 10.1051/0004-6361/202245769
- Peng et al. (2002) Peng, C. Y., Ho, L. C., Impey, C. D., & Rix, H.-W. 2002, The Astronomical Journal, 124, 266, doi: 10.1086/340952
- Perez & Granger (2007) Perez, F., & Granger, B. E. 2007, Computing in Science & Engineering, 9, 21, doi: 10.1109/MCSE.2007.53
- Pérez-González et al. (2023) Pérez-González, P. G., Barro, G., Annunziatella, M., et al. 2023, The Astrophysical Journal Letters, 946, L16, doi: 10.3847/2041-8213/acb3a5
- Perrin et al. (2014) Perrin, M. D., Sivaramakrishnan, A., Lajoie, C.-P., et al. 2014, in Society of Photo-Optical Instrumentation Engineers (SPIE) Conference Series, Vol. 9143, Space Telescopes and Instrumentation 2014: Optical, Infrared, and Millimeter Wave, ed. J. Oschmann Jacobus M., M. Clampin, G. G. Fazio, & H. A. MacEwen, 91433X, doi: 10.1117/12.2056689
- Perrin et al. (2012) Perrin, M. D., Soummer, R., Elliott, E. M., Lallo, M. D., & Sivaramakrishnan, A. 2012, in Society of Photo-Optical Instrumentation Engineers (SPIE) Conference Series, Vol. 8442, Space Telescopes and Instrumentation 2012: Optical, Infrared, and Millimeter Wave, ed. M. C. Clampin, G. G. Fazio, H. A. MacEwen, & J. Oschmann Jacobus M., 84423D, doi: 10.1117/12.925230
- Planck Collaboration et al. (2020) Planck Collaboration, Aghanim, N., Akrami, Y., et al. 2020, Astronomy & Astrophysics, 641, A6, doi: 10.1051/0004-6361/201833910
- Popping et al. (2022) Popping, G., Pillepich, A., Calistro Rivera, G., et al. 2022, Monthly Notices of the Royal Astronomical Society, 510, 3321, doi: 10.1093/mnras/stab3312
- Prieto et al. (2010) Prieto, M. A., Reunanen, J., Tristram, K. R., et al. 2010, Monthly Notices of the Royal Astronomical Society, 402, 724, doi: 10.1111/j.1365-2966.2009.15897.x
- Riechers et al. (2019) Riechers, D. A., Pavesi, R., Sharon, C. E., et al. 2019, The Astrophysical Journal, 872, 7, doi: 10.3847/1538-4357/aafc27
- Rinaldi et al. (2023) Rinaldi, P., Caputi, K. I., Costantin, L., et al. 2023, The Astrophysical Journal, 952, 143, doi: 10.3847/1538-4357/acdc27
- Scoville et al. (2014) Scoville, N., Aussel, H., Sheth, K., et al. 2014, The Astrophysical Journal, 783, 84, doi: 10.1088/0004-637X/783/2/84
- Scoville et al. (2016) Scoville, N., Sheth, K., Aussel, H., et al. 2016, The Astrophysical Journal, 820, 83, doi: 10.3847/0004-637X/820/2/83
- Sérsic (1963) Sérsic, J. 1963, Boletin de la Asociacion Argentina de Astronomia La Plata Argentina, 6, 41
- Suess et al. (2022) Suess, K. A., Bezanson, R., Nelson, E. J., et al. 2022, The Astrophysical Journal Letters, 937, L33, doi: 10.3847/2041-8213/ac8e06
- Tacconi et al. (2013) Tacconi, L. J., Neri, R., Genzel, R., et al. 2013, The Astrophysical Journal, 768, 74, doi: 10.1088/0004-637X/768/1/74
- Tacconi et al. (2018) Tacconi, L. J., Genzel, R., Saintonge, A., et al. 2018, The Astrophysical Journal, 853, 179, doi: 10.3847/1538-4357/aaa4b4
- Tadaki et al. (2020) Tadaki, K.-i., Belli, S., Burkert, A., et al. 2020, The Astrophysical Journal, 901, 74, doi: 10.3847/1538-4357/abaf4a
- Taylor (2005) Taylor, M. B. 2005, Astronomical Data Analysis Software and Systems XIV, 347, 29. https://ui.adsabs.harvard.edu/abs/2005ASPC..347...29T
- van der Wel et al. (2012) van der Wel, A., Bell, E. F., Häussler, B., et al. 2012, The Astrophysical Journal Supplement Series, 203, 24, doi: 10.1088/0067-0049/203/2/24
- van der Wel et al. (2014) van der Wel, A., Franx, M., van Dokkum, P. G., et al. 2014, The Astrophysical Journal, 788, 28, doi: 10.1088/0004-637X/788/1/28
- Virtanen et al. (2020) Virtanen, P., Gommers, R., Oliphant, T. E., et al. 2020, Nature Methods, 17, 261, doi: 10.1038/s41592-019-0686-2
- Walter et al. (2014) Walter, F., Decarli, R., Sargent, M., et al. 2014, The Astrophysical Journal, 782, 79, doi: 10.1088/0004-637X/782/2/79
- Walter et al. (2016) Walter, F., Decarli, R., Aravena, M., et al. 2016, The Astrophysical Journal, 833, 67, doi: 10.3847/1538-4357/833/1/67
- Weaver et al. (2022) Weaver, J. R., Kauffmann, O. B., Ilbert, O., et al. 2022, The Astrophysical Journal Supplement Series, 258, 11, doi: 10.3847/1538-4365/ac3078
- Whitaker et al. (2017) Whitaker, K. E., Pope, A., Cybulski, R., et al. 2017, The Astrophysical Journal, 850, 208, doi: 10.3847/1538-4357/aa94ce
- Whitaker et al. (2014) Whitaker, K. E., Franx, M., Leja, J., et al. 2014, The Astrophysical Journal, 795, 104, doi: 10.1088/0004-637X/795/2/104
- Williams et al. (2023) Williams, C. C., Tacchella, S., Maseda, M. V., et al. 2023, 1. https://arxiv.org/abs/2301.09780
- Wright et al. (2023) Wright, G. S., Rieke, G. H., Glasse, A., et al. 2023, Publications of the Astronomical Society of the Pacific, 135, 0, doi: 10.1088/1538-3873/acbe66
Appendix A MIRI/F560W Point Spread Function
The MIRI point spread function (PSF) at 5.6 µm is affected by a number of effects that are not modeled by WebbPSF. These include the non-linearity of the detector, the brighter-fatter effect, and internal diffraction that occurs inside the detector below approximately 10 µm (Gáspár et al., 2021; Argyriou et al., 2023, cf. Wright et al. 2023). While the first two are mainly relevant in the case of very bright sources—of which there are none in the MIDIS field—the latter effect can scatter photons to large distances from the core of the PSF and is very relevant for observations at 5.6 µm. The net result of the internal diffraction is a broadening of the core of the PSF and a cruciform artefact out to large radii. The shape of the cruciform artefact is dependent on the angle of incidence and varies with position across the detector, with the spikes effectively bending inwards towards the center of the detector.
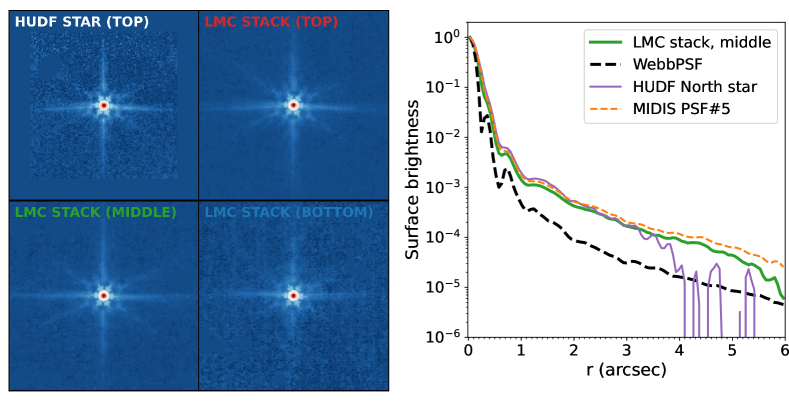
For these reasons, we construct a varying PSF model for the MIDIS field making use of empirical PSFs at different positions on the MIRI detector. The MIDIS image itself contains only two bright stars, of which one is in a highly crowded region. The other bright star is shown in Fig. 7, where we have masked background sources. This star is in the very north of the exposures, close to the top of the detector (see Fig. 8) and the bending of the cruciform artifact can be clearly seen for this star. Hence, we cannot use this single star as an empirical PSF for the entire field.
Instead, we create the empirical PSFs by stacking stars in the Large Magellanic Cloud (LMC) images from the commissioning program ID 1473 and two calibration programs (IDs: 1040 and 1024). The F560W frames in each program are reduced and resampled to a pixel scale of 55 mas (i.e., oversampled by a factor of 2) using the standard JWST pipeline. Given that we want to stack many different stars, the astrometry needs to be thoroughly checked in the image, but since these are well known regions of the sky, we found the JWST pipeline astrometry to be sufficient. We then select a total of 64 stars in the stacked frames. In this selection we avoid saturated stars and stars in very crowded regions, i.e., stars which have other sources within . A stamp of size arcsec is cut out for each star and a local background is subtracted. Faint sources are masked in each stamp using standard source detection techniques (photutils.detection). The images are resampled keeping the native detector orientation, which enables us to separately stack three bins of stars, situated in upper, middle, and lower detector positions. By doing so we take into account the strongest PSF variation in the field that occurs over the longest axis of the detector. The total number of stars in these bins is 31, 21, and 12, respectively. We scale the star stamps to have the same flux within a radius of 2 pixels (0.11″, measured using photutils) and stack the stars in each detector position bin by using median stacking (dropping the 2 brightest and faintest data points). The resulting three empirical PSFs still have a few defects in the outskirts of the PSF image which are manually masked (flux set to zero). We inspect signal-to-noise maps (using the standard deviation of the stacked star stamps as noise), to make sure that the final PSF model is valid. There is an insufficient number of stars for a more detailed spatially varying model using this technique, but we note that with additional calibration data, and by stacking stars from individual data frames (before resampling/stacking the full images), PSF models with higher sub-sampling and similar (or even greater) depth can be derived, though this is beyond the scope of the present work. The resulting stacked PSFs and their radial profiles are shown in Fig. 7. These clearly show the up- and downward bending of the cruciform artifact along the long axis of the detector and the significantly broader core compared to the WebbPSF model. The LMC-based PSF model is available at https://github.com/jensmelinder/miripsfs.
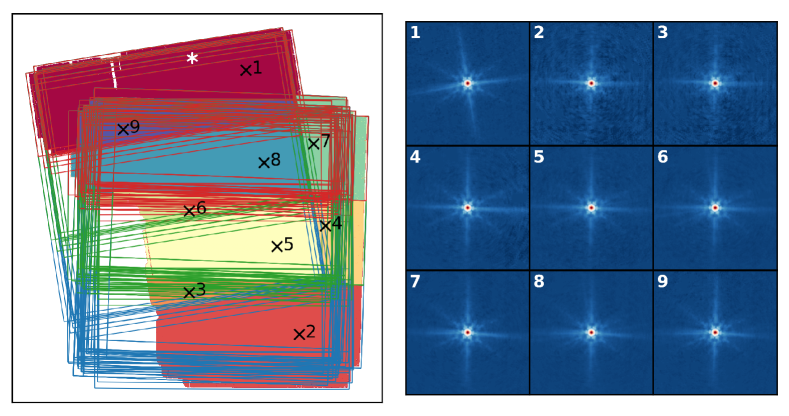
We use the empirical PSFs to create a field varying PSF for the MIDIS field. Based on the relative orientation of each of the MIDIS exposures, we determine 9 areas in the MIDIS field between which the PSF varies most strongly and mark a WCS coordinate () in each area, as shown in Fig. 8. In each of these areas we insert the appropriate empirical PSF, based on the corresponding image coordinates ), into each of the 96 individual exposures (i.e., WCS-aligned cal files). We then run the Stage 3 Imaging Processing twice, once with the inserted stars and once without, and recover the varying PSF model by taking the difference. To ensure the pipeline produces identical results in the different runs, we turn off all steps except the resample step. This results in 9 effective PSFs, shown in Fig. 8, that model the largest PSF variations across the MIDIS field. The MIDIS PSF model is available at https://github.com/lboogaard/midis_psf.
Appendix B FRESCO spectra
Appendix C Multi-wavelength Cutouts