New Technologies-Research Center, University of West Bohemia, Plzeň, Czech Republic \alsoaffiliationInstitut Jean Lamour, UMR 7198, CNRS-Université de Lorraine, Campus ARTEM, 2 allée André Guinier, BP 50840, 54011 Nancy, France \alsoaffiliationPhoton Science Division, Paul Scherrer Institut, Villigen, Switzerland
Persistence of structural distortion and bulk band Rashba splitting in SnTe above its ferroelectric critical temperature
Abstract
The ferroelectric semiconductor -SnTe has been regarded as a topological crystalline insulator and the dispersion of its surface states has been intensively measured with angle-resolved photoemission spectroscopy (ARPES) over the last decade. However, much less attention has been given to the impact of the ferroelectric transition on its electronic structure, and in particular on its bulk states. Here, we investigate the low-energy electronic structure of -SnTe with ARPES and follow the evolution of the bulk-state Rashba splitting as a function of temperature, across its ferroelectric critical temperature of about K. Unexpectedly, we observe a persistent band splitting up to room temperature, which is consistent with an order-disorder contribution to the phase transition that requires the presence of fluctuating local dipoles above . We conclude that no topological surface state can occur at the (111) surface of SnTe, at odds with recent literature.
1 Introduction
Semiconductors based spintronics materials are one of the most promising playground for modern applications and technologies 1, 2. Among these materials, the class IV-VI semiconductors are particularly interesting because they can combine semiconductor properties with ferroelectricity. This is due to a spontaneous distortion of the crystalline lattice structure that leads to a macroscopic electric polarization of the material 3, 4, 5, 6. In addition, the concomitant inversion symmetry breaking induces a momentum-dependent energy splitting in the electronic band structure, i.e. the so-called Rashba effect, which means that these bands are not anymore spin degenerate 7, 8.
In this framework, the electronic band structure of -GeTe, a ferroelectric Rashba semiconductor with a critical temperature K 9, has been investigated in details. Different surface states, surface resonances and bulk states have been identified using angle-resolved photoemission spectroscopy (ARPES) 10, 11 and those studies have led to the observation of one of the largest Rashba parameters 12. Its potential for application is then particularly large, e.g. with the ability to enhance spin Hall conductivity 13, to control the spin-to-charge conversion, to store information in a non-volatile way 14, 15, 16, 17, 18 or also to manipulate the crystal distortion and thus the ferroelectricity using intense femtosecond pulses 19. The isostructural compound SnTe has similar properties than GeTe and it shows ferroelectricity typically below 100 K 20.
For both GeTe and SnTe, the nature of the ferroelectric transition is still subject to debate, even though it has attracted a lot of attention in the literature. Early studies using neutron diffraction or Raman scattering to reveal the atomic structure and related phonons 20, 9, 21 suggested that the transition temperature could strongly depend on the number of Sn (Ge) vacancies and that the transition is of second order22, 23, 9. Subsequently, this was confirmed by theoretical 24, 25, 26, 27 and experimental studies that demonstrated a phonon softening at , indicating a displacive phase transition 28. However, extended x-ray absorption fine structure, x-ray scattering measurements and analysis of the pair distribution function, evidenced the persistence of a local rhombohedral lattice distortion above , indicating the presence of local ferroelectric dipoles 29, 30, 31, 32. However, this conclusion was criticized in another work based on the analysis of pair distribution function 33, emphasizing that a vivid debate on the ferroelectric phase transition in SnTe still remains.
SnTe has been regarded as an outstanding representative of the class of topological crystalline insulators. However, the ferroelectric transition has also considerable effect on its topological properties. Symmetry arguments have been used to claim that in the paraelectric phase this semiconductor has gapless protected surface states 34. This was first predicted theoretically 35, 36 and the existence of linear-dispersive bands attributed to topologically protected surface states was later on confirmed by ARPES for the and surface-plane orientations37, 38, 39, 40, 41, 42. However, as shown by Pleakhanov et al. 43, the topological surface state does not subsist in a ferroelectric state on the (111) surface.
In the present work, we study the low-energy electronic structure of SnTe(111) across its ferroelectric phase transition with ARPES. Taking advantage of our high energy and momentum resolution and also of the unprecedented crystalline quality of our thin films, we reveal multiple states in the first eV below the Fermi level that have not been resolved in the literature so far. Based on one-step model photoemission calculations and photon-energy dependent ARPES measurements, we classify them as surface or bulk states. Most importantly, we systematically characterize the change of the Rashba splitting of bulk states as a function of temperature. We observe clear inconsistencies of the ferroelectric phase transition with a simple mean-field-like transition that can be explained with an order-disorder type contribution to the transition. Finally, we comment on its consequence for the topological properties of the (111) surface of SnTe.
2 Results
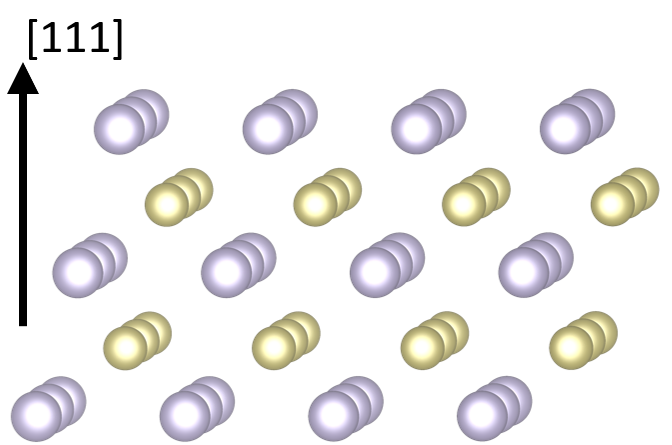
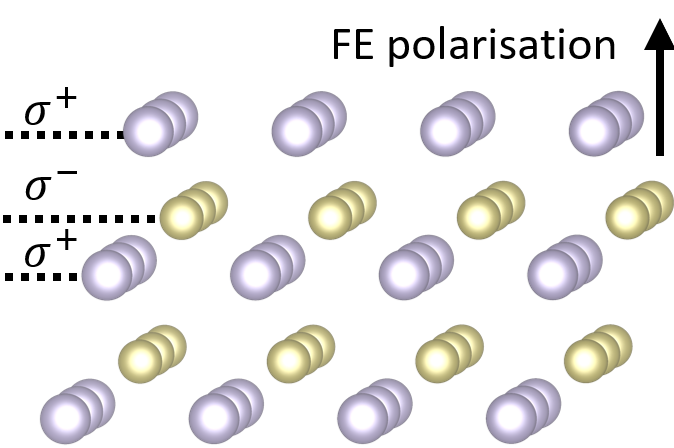
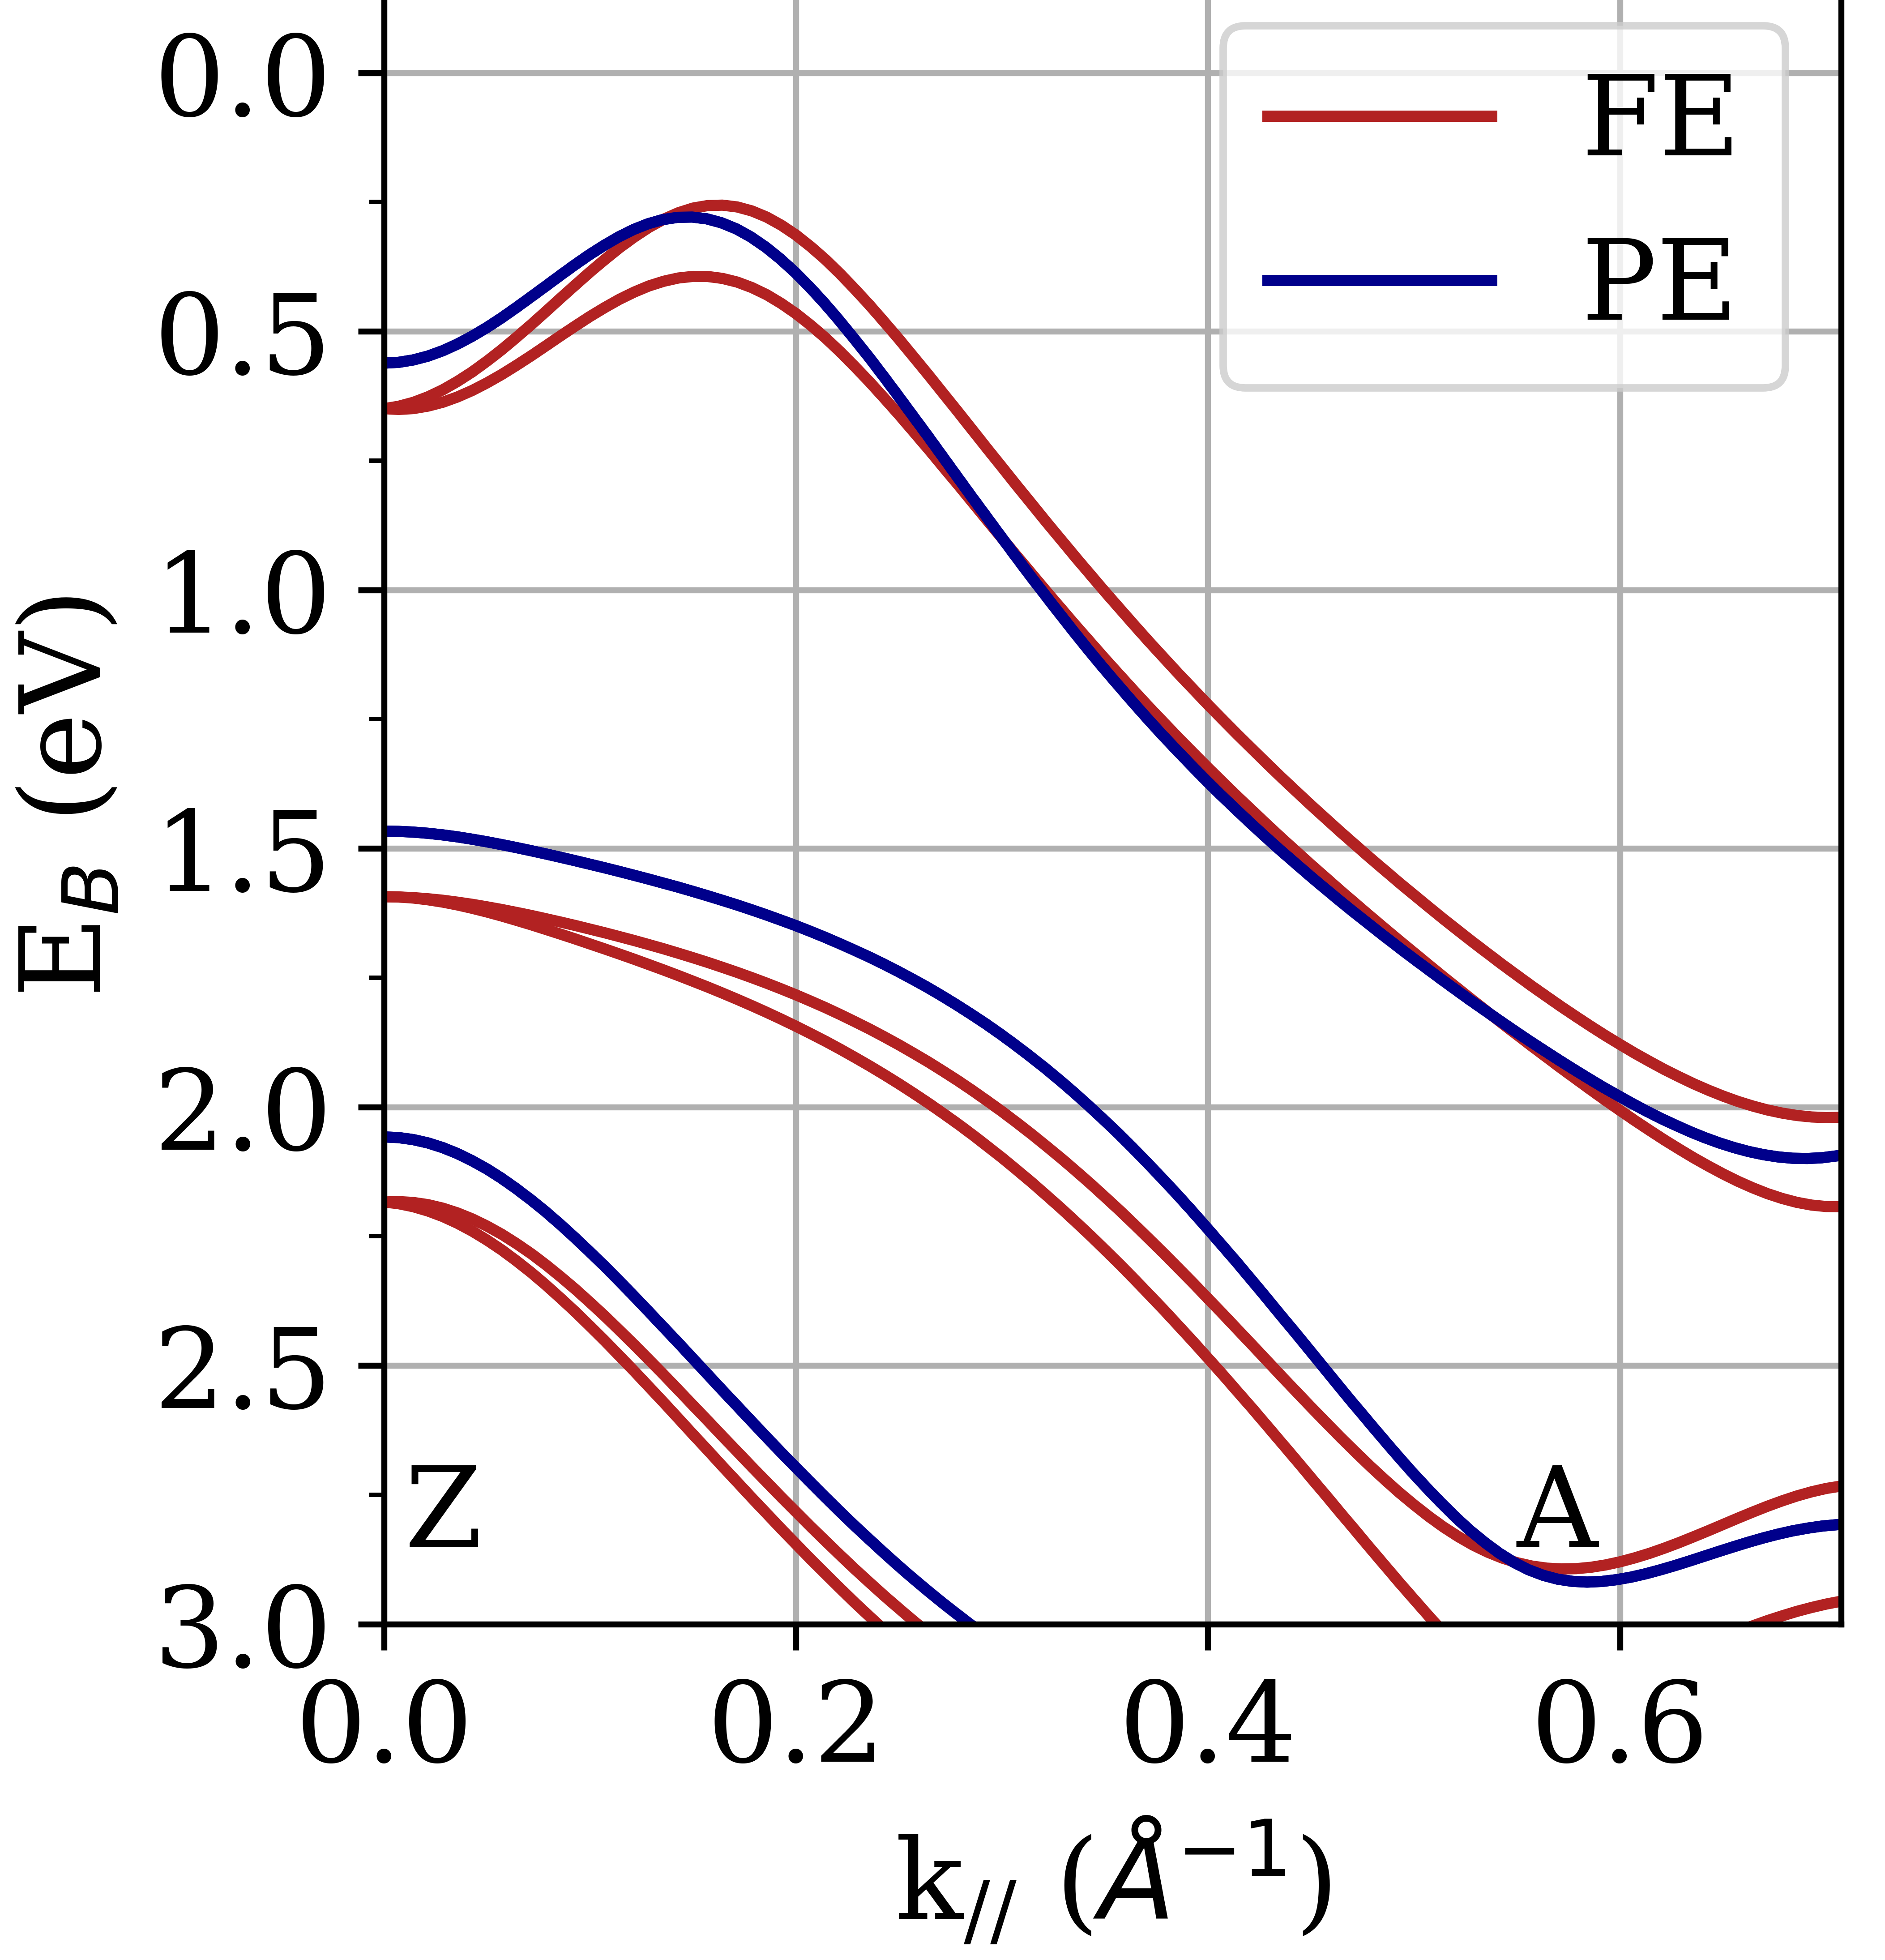
SnTe undergoes a transition from a paraelectric state, with a cubic rocksalt structure with equidistant stackings of Sn and Te layers along the [111] direction (space group , see Fig. 1(a)), to a ferroelectric state with a rhombohedral structure (space group , see Fig. 1(b)) at low temperature around 100 K 20. In the ferroelectric state, the bulk inversion symmetry is broken by a displacement of the Sn and Te lattice planes against each other, which leads to a non-zero electric dipole between the ionic charges and of the Sn and Te atoms. This induces a Rashba-like splitting in the electronic structure, as can be seen by comparing the bulk DFT band structure in Fig. 1(d) calculated for the paraelectric (blue bands) and the ferroelectric (red bands) states. Our objective is to experimentally resolve this splitting and to follow its evolution as a function of temperature in order to characterize the ARPES signatures of the paraelectric-to-ferroelectric phase transition.
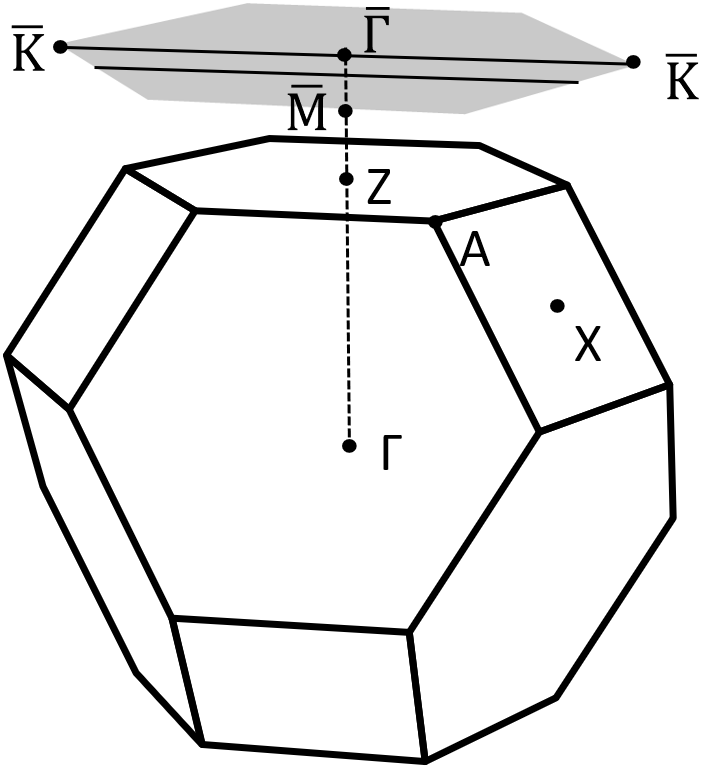
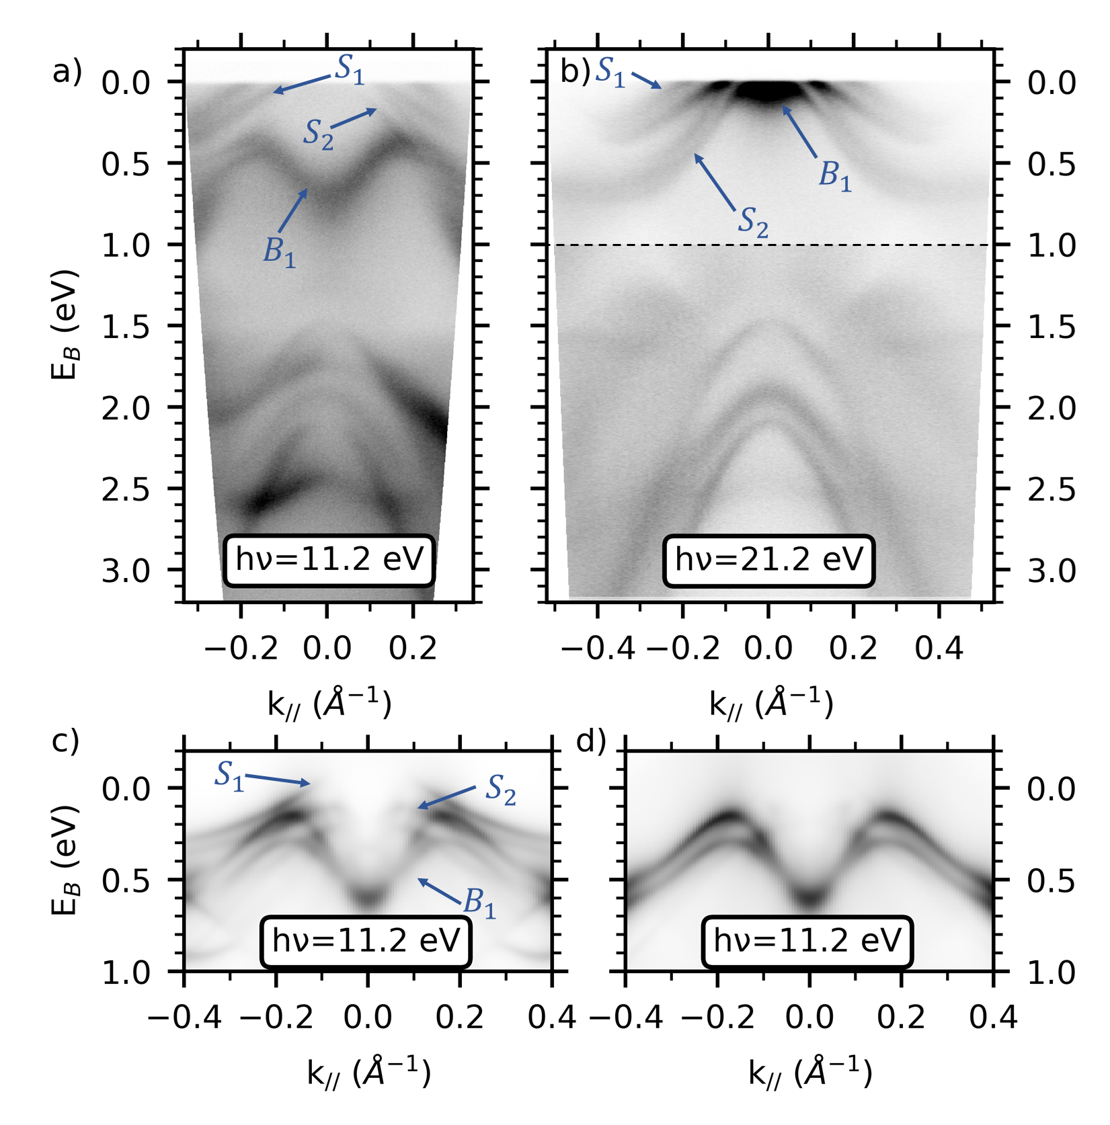
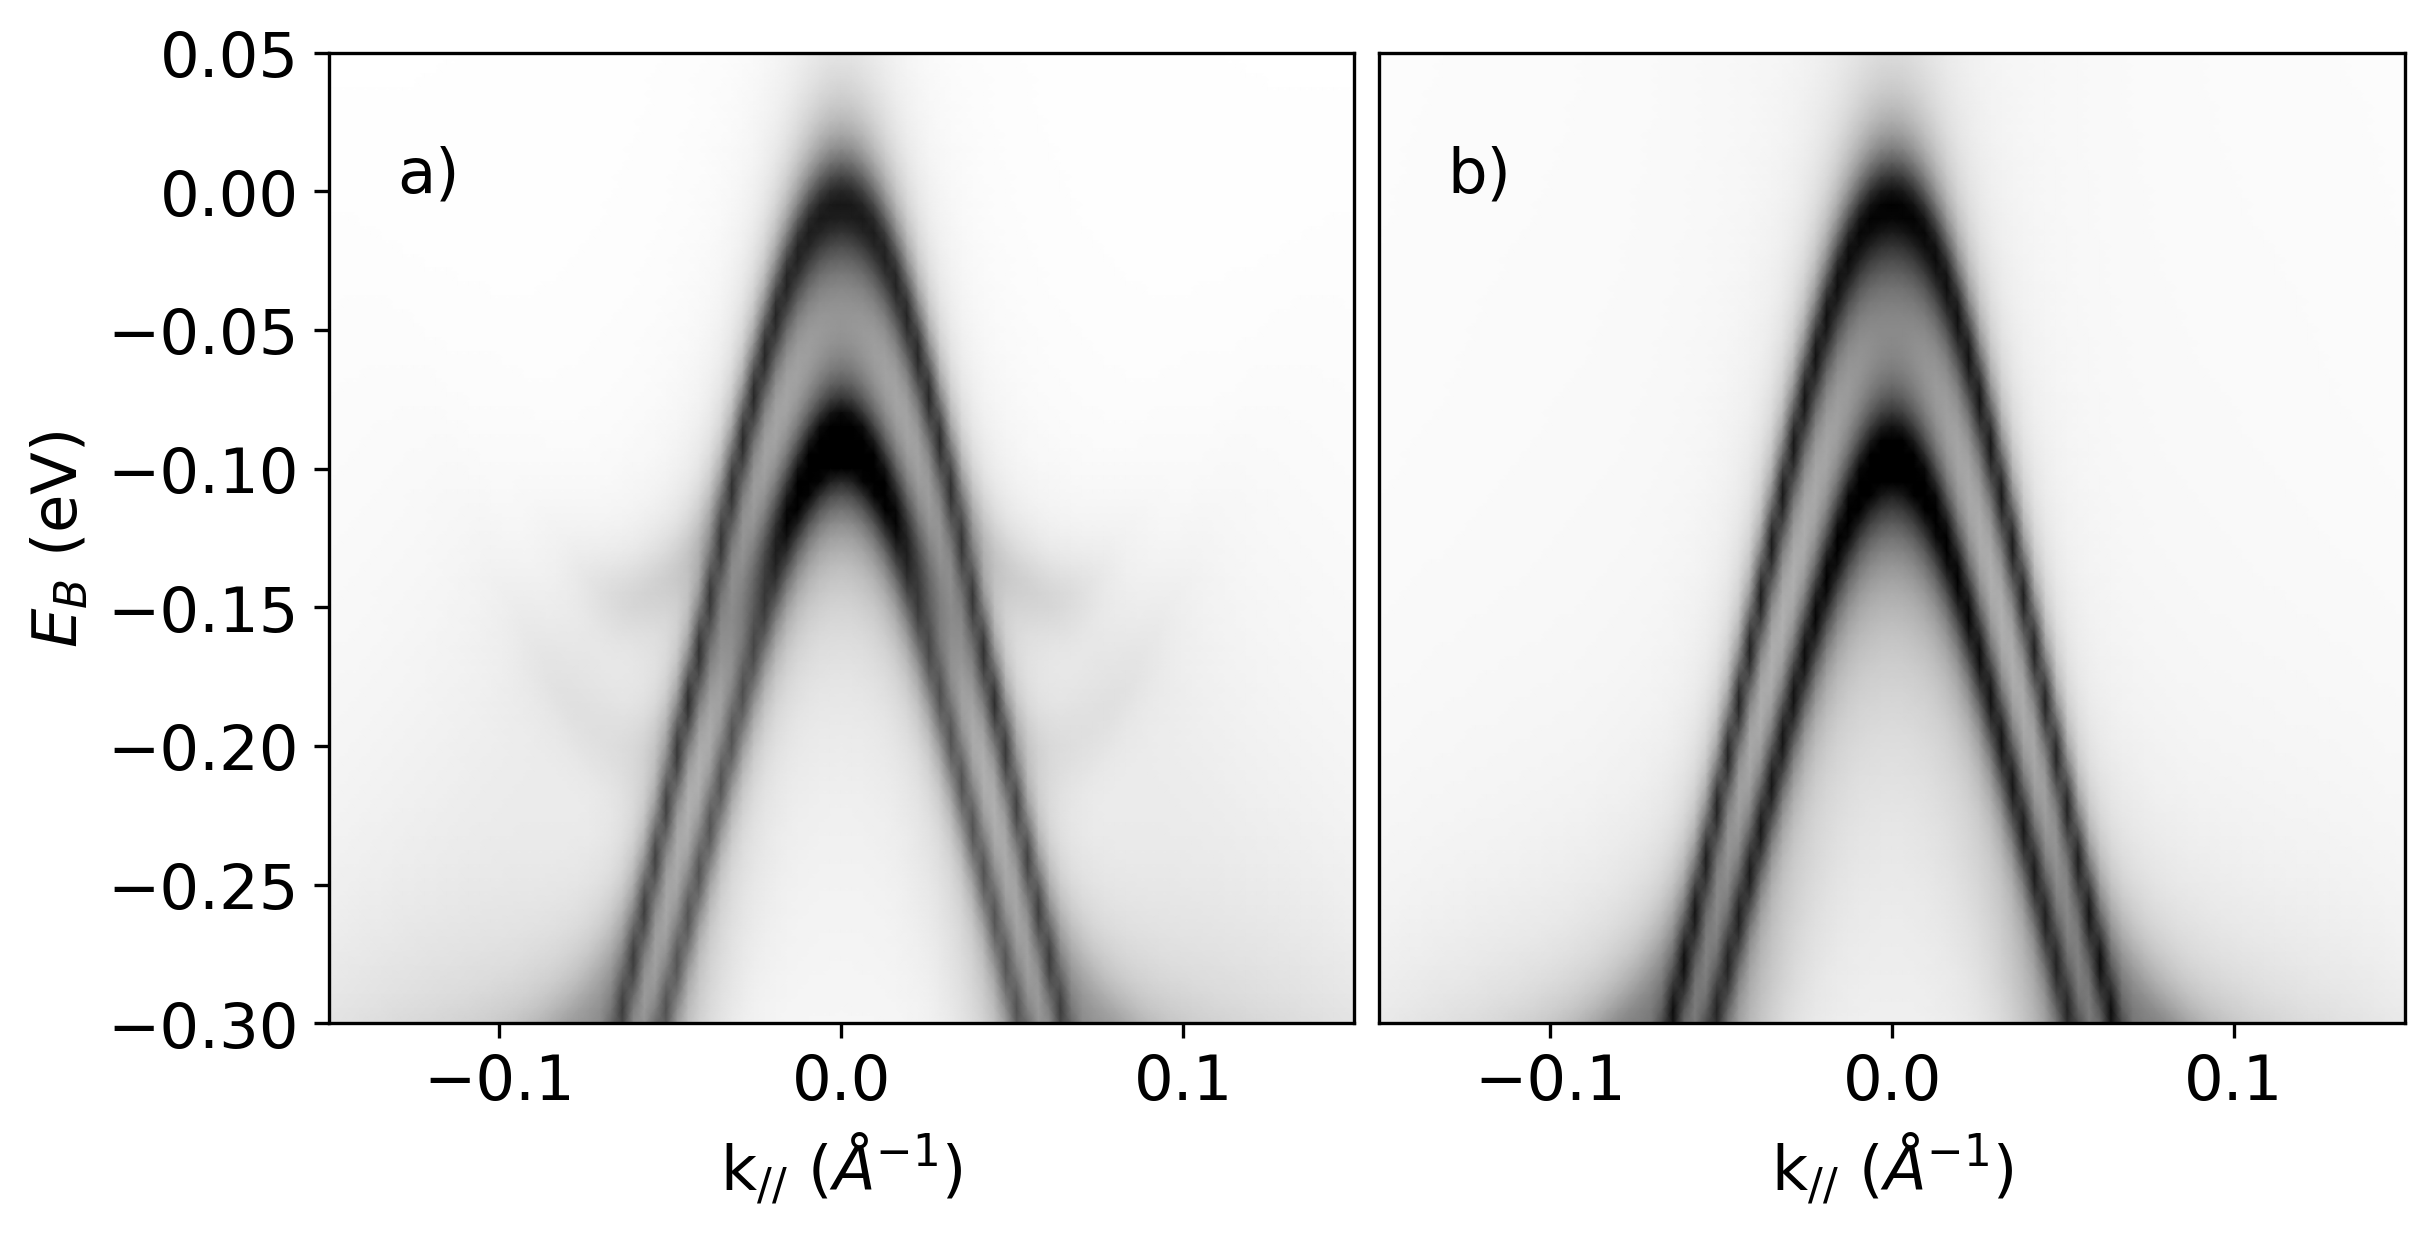
We have performed ARPES measurements of SnTe(111) along the high-symmetry direction, which corresponds to the projection of the direction on the surface. Photoemission intensity maps obtained at 30 K with two different photon energies are shown in Fig. 2 for eV and Fig. 2 for eV respectively. Thanks to the high energy resolution of our experiment and the high quality of our thin films, we distinguish several bands in the low-energy region, where previously only a linear dispersive band was resolved and attributed to a Dirac cone 38, 40, 39. Near the Fermi level, we identify one surface state (labelled ) that appears for both photon energies at higher parallel momenta. At lower momenta, we observe another surface state () which partially overlaps with a bulk state () that disperses with photon energy. A more detailed series of photon-energy dependent ARPES measurements using synchrotron radiation is shown in the Supporting Information and corroborates these observations with Fig. 5. Similar to the isostructural compound -GeTe 10, we attribute the state to a surface resonance state.
To support our interpretation of the origin of the bands, we have performed DFT calculations using a semi-infinite slab geometry for the ferroelectric structure. The surface with a Te-termination and short bonds between the first Te and Sn planes gives the best agreement with the experimental data (see Supporting Information with Fig. 7).
Fig. 2 and Fig. 2 show the calculation for a 11.2 eV photon energy with an active and a transparent surface barrier, respectively. The position of the Fermi level in the calculation has been corrected to match with the experiment and the sampled at 21.2 eV (11.2 eV) has been estimated to be approximately 80% (50% respectively) of the total distance. The transparent surface barrier suppresses the surface states and allows us to discriminate the origin of the bands (see Supporting Information for more details about this procedure). The resulting comparison between theory and experiment confirms our attribution of the bands and to surface and bulk states, respectively.
 \phantomcaption\phantomcaption\phantomcaption
Having clarified the nature of the low-energy band structure, we focus now on the bulk state that shows a large energy splitting at low temperature in the ferroelectric phase. We concentrate ourselves now on the data as measured at 11.2 eV photon energy (see Fig. 2), which allow to disentangle the bulk states from the surface states and to clearly resolve the bulk Rashba splitting. By presenting ARPES measurements as a function of temperature, we address the effect of the ferroelectric to paraelectric transition on the amplitude of the bulk Rashba splitting, which is directly correlated to the ferroelectric distortion.
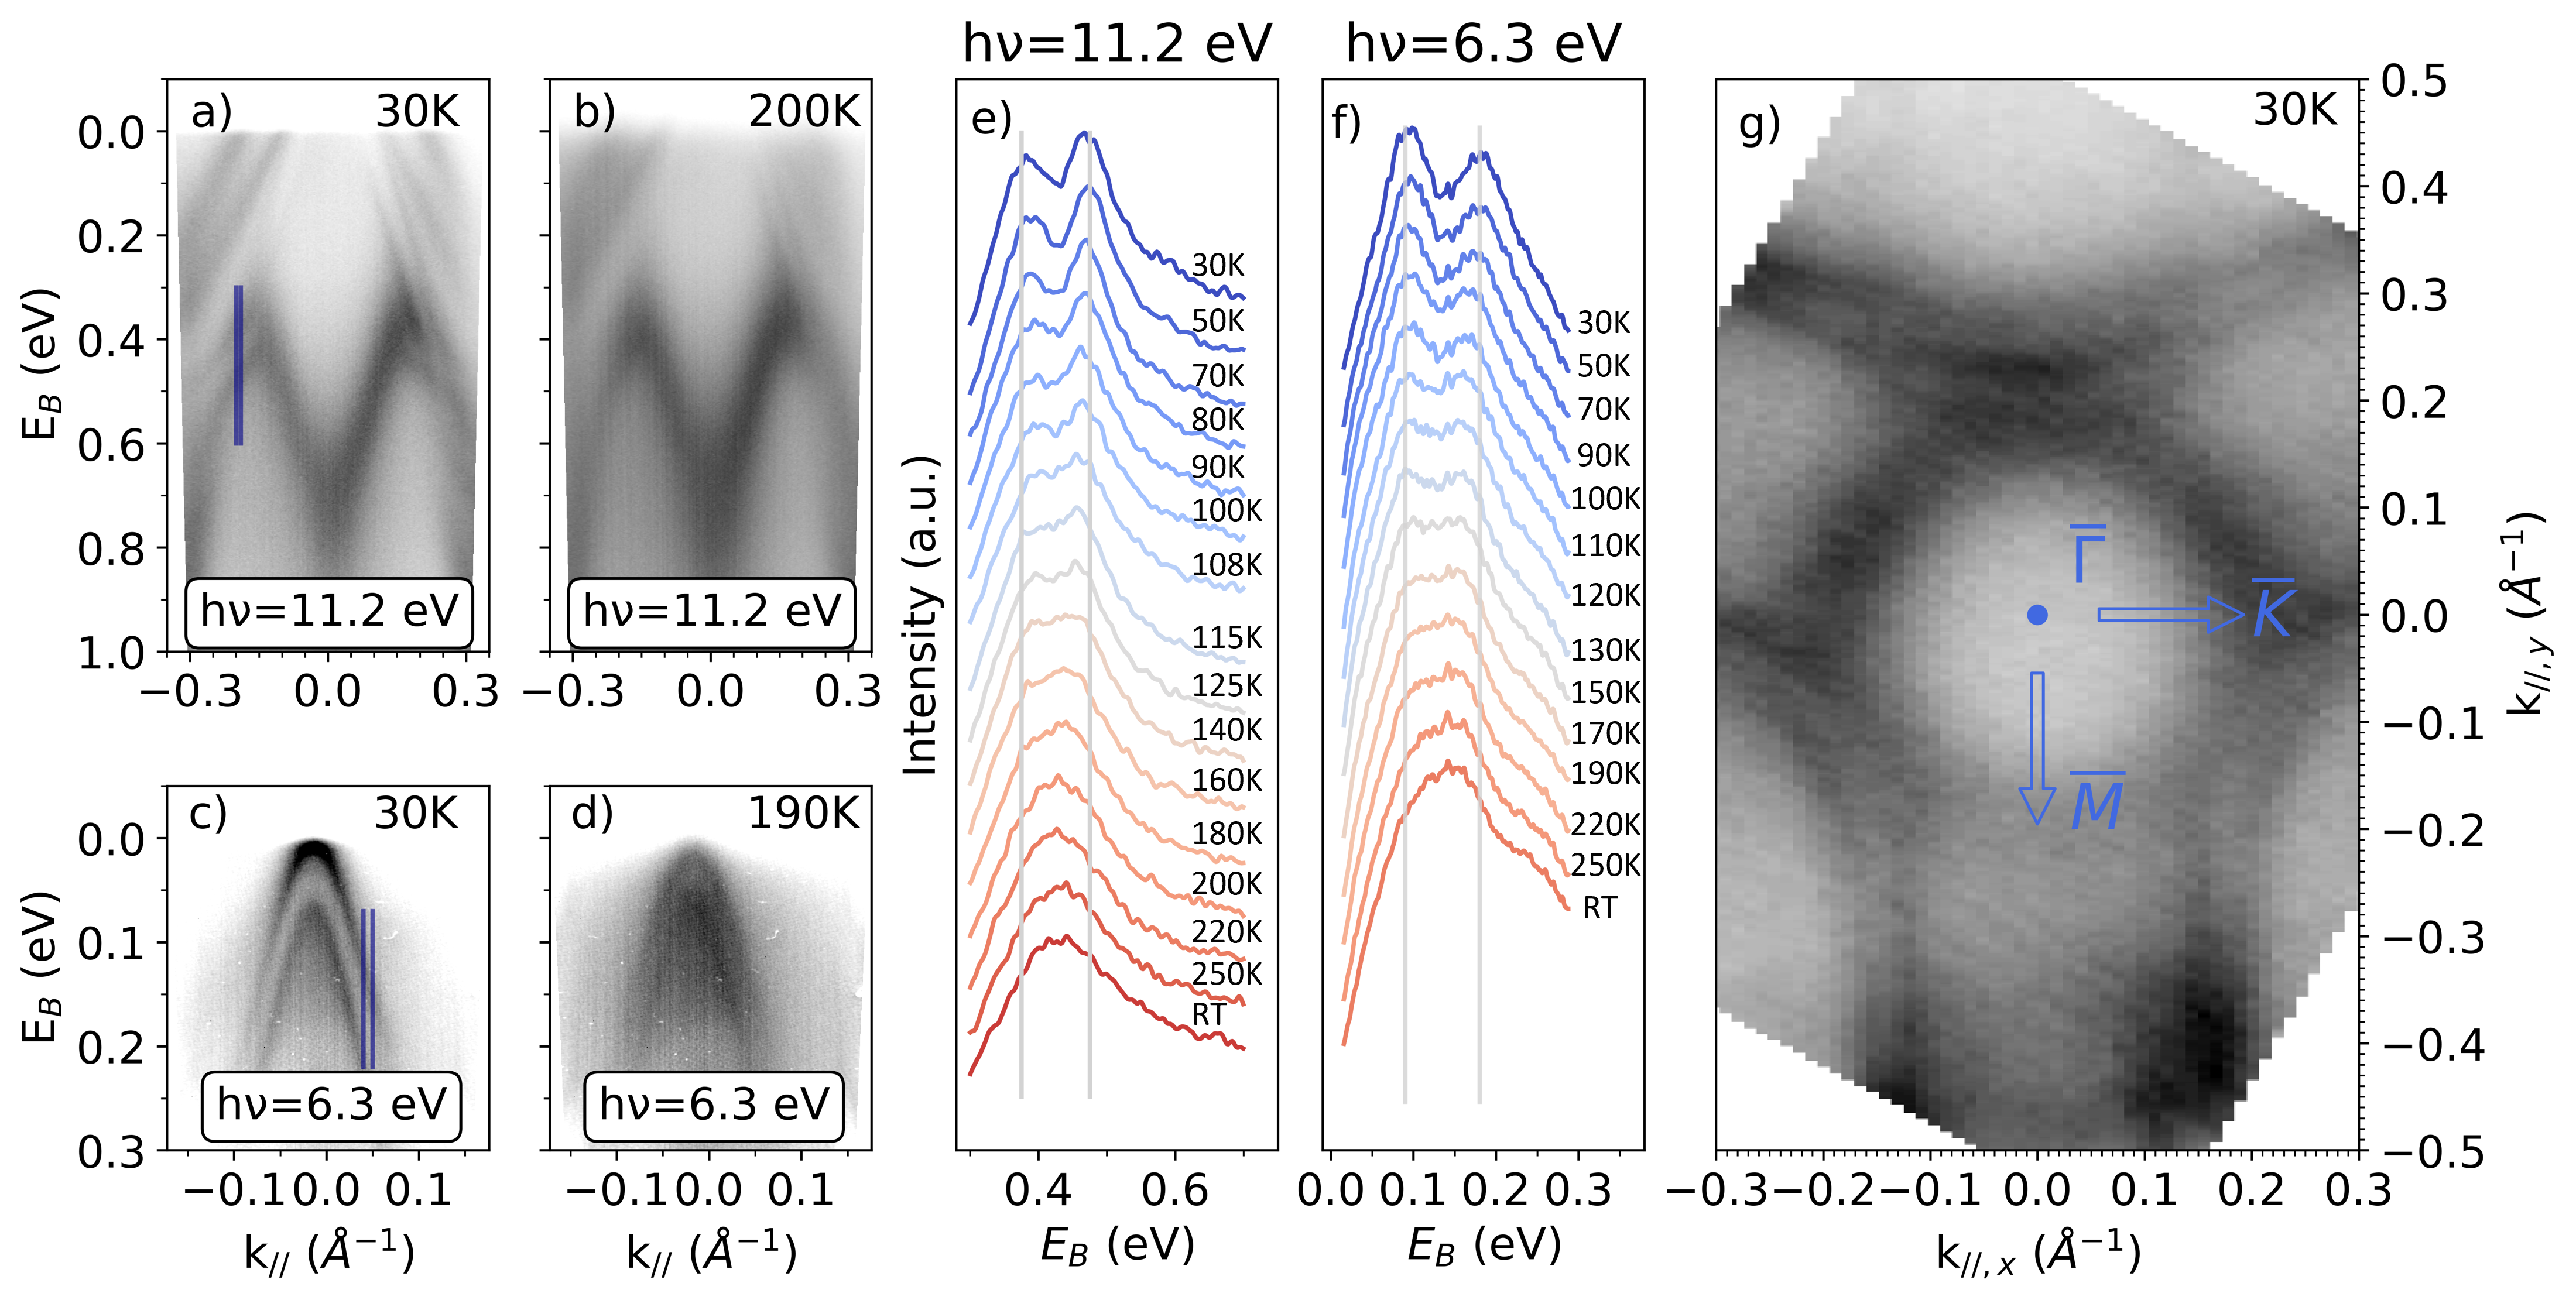
Figures 3 and 3 show ARPES spectra taken at 30 K and at 200 K, respectively, with eV. At 30 K, a clear splitting is observed in all bands, namely the surface ones and the bulk one . At 200 K, the bands become significantly broader due to thermal effects, but a splitting of the surface-related bands is still obvious, in contrast to the bulk band , for which the splitting is no longer clearly resolved. We therefore plot in Fig. 3 energy distribution curves (EDCs) integrated over k Å-1 (blue region in panel Fig. 3) for a large temperature range up to room temperature. These EDCs allow us to clearly distinguish the two peaks related to the split bulk band at low temperature (in the ferroelectric phase) and to follow the splitting up to about 160 K. At higher temperature, the two peaks seem to merge together, so that it is difficult to directly assess whether the band splitting persists at high temperatures or whether it collapses.
To answer this question, we have acquired ARPES data using a photon energy of 6.3 eV, to take advantage of the higher momentum resolution at lower photon energy. For this purpose and to maximize the effect of the splitting, we oriented the analyzer slit in a plane parallel to , but shifted towards at Å-1 (which allows to see the same bulk band at a different position in the reciprocal space - see Fig. 3).
The corresponding photoemission intensity maps are shown in Fig. 3 and 3 for temperatures of 30 K and 190 K, respectively. We observe two hole-like bands with a clear splitting at low temperature (Fig. 3). One-step model photoemission calculations confirm that these are the same bulk band (see the calculations with and without a transparent surface barrier in the Supporting Information with Fig. 6). Moreover, the band splitting is still visible at 190 K (Fig. 3). We have extracted EDCs in this configuration for Å-1 to follow the reduction of the splitting as a function of temperature (see Fig. 3), which allows us to track the splitting up to 250 K at least.
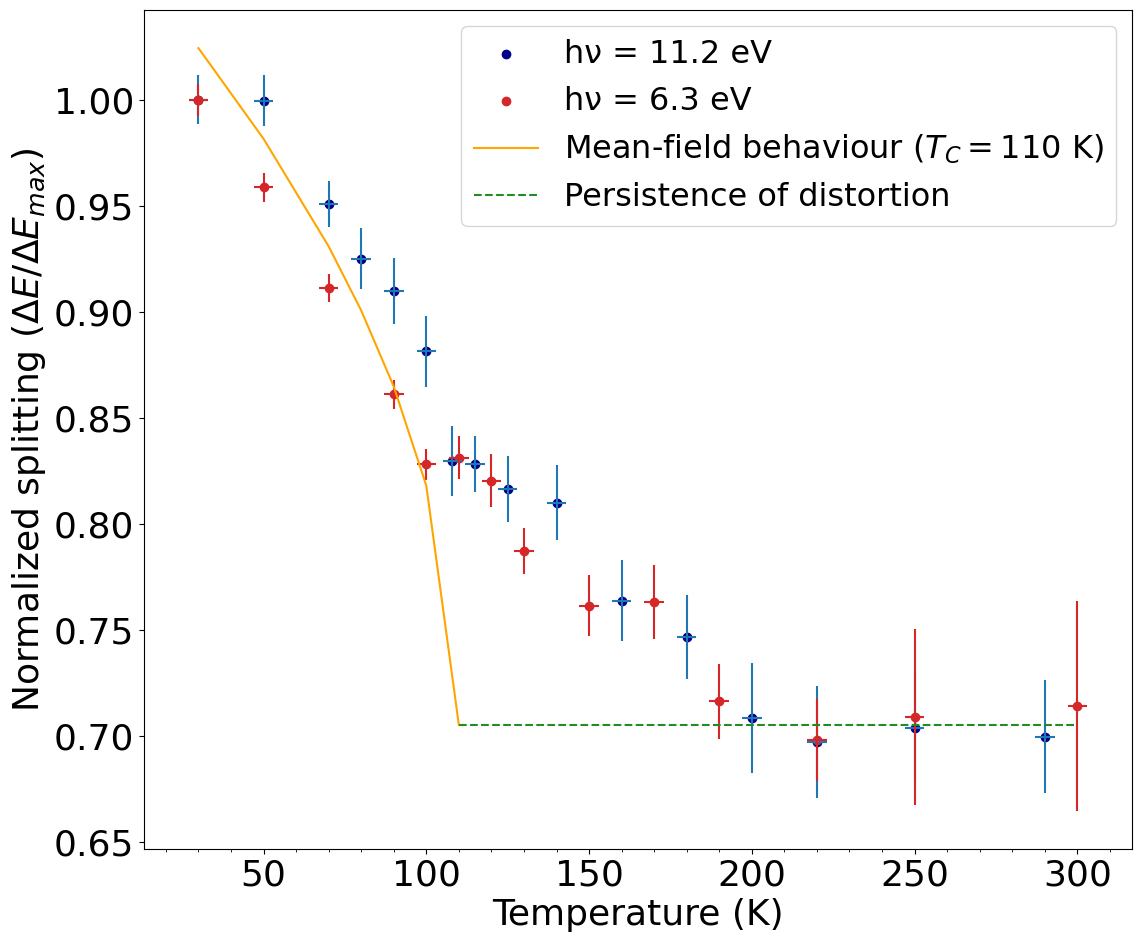
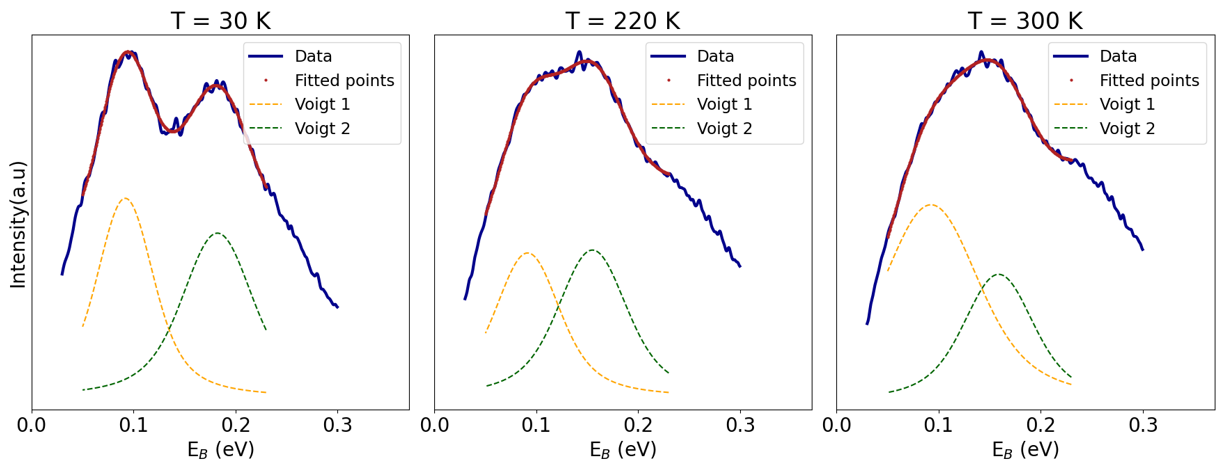
For a quantitative characterization of the temperature evolution of the bulk states across the ferroelectric transition, we have fitted the EDCs of Fig. 3 and Fig. 3 with two Voigt functions (see Supporting Information for more details on the procedure with Fig. 8). The variation of the splitting as a function of temperature is plotted in Fig. 4. We caution that, although we obtained good fits with two Voigt functions for temperatures above 250 K, equally good fits could be obtained with a single broader Voigt function in this temperature range. However, this would lead to an abrupt and nonphysical behavior of the width of the Voigt function around 200 K: therefore we focus on the scenario with two peaks up to room temperature 111A single peak scenario starting above the transition temperature where two peaks are still clearly visible in the EDCs, e.g. at 190 K, gives an absurdly large width. Moreover, this width decreases with increasing temperature, indicating that we are trying to fit with one peak two contributions that are moving closer together.. First of all, we see that the evolution of the band splitting in temperature is the same for the two sets of EDCs, confirming the same mechanism observed with both photon energies. Secondly, the reduction of the splitting is particularly pronounced below K, but a finite value remains at higher temperatures, up to room temperature at odds with the expectation for a paraelectric cubic state at high temperature. The evolution of the band splitting was reversible and reproducible across different heating and cooling cycles.
3 Discussion
Although the origin of the transition (displacive vs. order-disorder) remains a matter of debate in the literature, its second-order character is agreed upon 20, 9, 21, 28, 25, 26, 24, 29, 45. We therefore superimpose on the experimental data in Fig. 4 a mean-field-like (orange) curve with a critical temperature of K and adding a constant offset of . We stress that, within a mean-field-like scenario, one would expect a zero offset at room temperature. The obtained curve agrees well with the low temperature data, but it reveals a rounding of the phase transition above . This could be due to strong thermal fluctuations, in agreement with the general increased broadening of the bands observed at and above about 200 K in ARPES (see Fig. 3). However, this fails to explain the persistence of a splitting well above , which is a clear indication of inversion symmetry breaking inside the crystal even at high temperature.
This surprising observation is consistent with an order-disorder type of phase transition instead of a displacive transition. Whereas for a displacive transition, the onset of the anion/cation displacement appears only at and continuously grows as the temperature decreases, the order-disorder phase transition is based on the freezing of the fluctuations between two equivalent off-center lattice sites at the critical temperature . As a result, although above the net macroscopic polarization is zero, there are still clusters with a non-zero local polarization extending over a few-unit cells and with alternation of the sign of the polarization from cluster to cluster. These clusters would therefore still have locally a structural distortion and thus give rise to the spin-split bulk bands above as we experimentally observe. This agrees with extended x-ray absorption fine structure, x-ray scattering analysis of the pair distribution function that have revealed the persistence of local lattice distortions, i.e. the presence of local ferroelectric dipoles above 29, 30, 31, 32. We caution though that we cannot rule out another structural mechanism occurring specifically near the surface of SnTe that could cause the persistence of the band splitting at high temperature46, given that ferroelectricity has been observed up to room temperature in the two dimensional limit of SnTe 47 .
From our data at a photon energy of 11.2 eV (see Fig. 2), we can estimate a value for the Rashba parameter . With the standard relation , we extract eV and Å-1 at 30 K. The Rashba parameter is then eV Å. We note that this experimental value is relatively close to the theoretical estimation from DFT in Ref. 43 ( eV Å), providing therefore an experimental confirmation of the giant Rashba effect in SnTe.
Given our discovery of the persistence of a structural distortion in SnTe at higher temperatures, an open question is what is its impact on the topological surface states? Symmetry arguments have been used to derive a non-zero mirror Chern number on the (001), (111) and (110) surfaces of the rocksalt paraelectric structure, and therefore the presence of Dirac cones in the ARPES spectra 34. Such considerations were supported by earlier theoretical 35, 39 and experimental studies on the (001) surface 37. As for the (111) orientation, static ARPES studies have also claimed to have measured a topological surface state at 38, 40, 39. However, the highly p-type character of SnTe precludes the direct observation of the Dirac cone by ARPES. Our results provide a new perspective to these findings by resolving more bands, namely two surfaces states instead of one, and with an unprecedented resolution. By looking at our ARPES measurements, we identify the and surface states as the candidate for the linear dispersion in the occupied states that has been interpreted as a topological surface state in previous studies. Furthermore, our one-step calculation (see e.g. Fig. 2) confirm the finding of Plekhanov et al. 43, which shows that in the rhombohedral structure, there is no topological surface state near the Fermi level. Based on our observation of the persistence of local lattice distortions above , we therefore expect that no topological surface states appear at high temperature on the (111) surface, at odds with recent time-resolved ARPES studies 48. Our new results therefore requires a reassessment of these observations.
4 Conclusion
We have characterized the band structure of SnTe(111) using high-energy resolution ARPES measurements with an unprecedented quality. Combined with state-of-the-art photoemission calculation with and without a surface barrier, our ARPES study at selected photon energies enabled us to differentiate surface and bulk states. The presence of bulk-split bands has been directly connected to inversion symmetry breaking. We have also studied the evolution of this splitting as a function of temperature to characterize the ferroelectric transition. This study demonstrated inconsistencies with a displacive mean-field like transition, revealing a rounding of the phase transition and a splitting persisting above , at least up to 250 K. This observation is consistent with an order-disorder type phase transition, in agreement with findings from other studies using local probes 29, 30, 46. Above the critical temperature, fluctuations of the polarization vector from one cluster to another implies that a structural distortion remains and explain the persistence of the band splitting at high temperature. We propose that the possible persistence of ferroelectricity at high temperature in the near-surface region could be tested with spin-resolved and microfocus ARPES measurements by looking for the existence of a finite spin polarisation, as well as by evidencing circular dichroism in ARPES 49, 50. Finally, the persistence of rhombohedral distortions above the critical temperature requires a reassessment of the topological nature of the SnTe(111) surface, since it has been shown in the literature 43 and confirmed by our DFT calculation that the break of symmetry destroys the topological surface state along the (111) direction.
Aki Pulkkinen and Geoffroy Kremer contributed equally to this work.
G.S. would like to thank the Austrian Science Fund (FWF), who supported this study with projects No. P30960-N27 and I 4493-N. We are greatful to Natalia Olszowska and Jacek Kołodziej for their support of the ARPES measurements at SOLARIS, funded by the Polish Ministry of Education and Science under contract nr . J. M. and A. P. would like to thank the CEDAMNF project with reg. no. and the QM4ST project with reg. no. , co-funded by the ERDF as part of the MŠMT.
We are very grateful to M. Rumo and B. Salzmann for fruitful discussions. Skillful technical assistance was provided by F. Bourqui, B. Hediger and M. Audrey.
5 Methods
5.1 Sample growth
Epitaxial SnTe(111) films of 2 µm thickness were grown by molecular beam epitaxy on BaF2 substrates under ultra-high vacuum (UHV) conditions at a substrate temperature of 350∘ C and a compound effusion cell. During growth, the SnTe(111) surface exhibits a perfect two-dimensional reflection high-energy electron diffraction pattern revealing a perfect 2D growth mode. After growth, the samples were transferred to the ARPES setup without breaking UHV conditions using a battery operated vacuum suitcase having a pressure of better than mbar. It is noted, that due to the high density of native Sn vacancies, SnTe intrinsically exhibits a high p-type carrier concentration of typically x cm-3. For this reason the Fermi level is always inside the topmost valence band. The lattice parameter of the SnTe layers was determined to be Åat room temperature (rhombohedral lattice parameter of Å) , which is in good agreement with literature values20.
5.2 ARPES measurements
Temperature-dependent angle-resolved photoemission spectroscopy (ARPES) investigations were carried out using a Scienta DA30 photoelectron analyzer with a base pressure better than mbar. Photons sources are monochromatized HeI (and Xe) radiation with eV ( eV) and a high energy-resolution laser based on a commercial setup (Harmonix, APE GmbH) generating 6.3 eV photons using harmonic generation from the output of an optical parametric oscillator pumped by a Paladin laser (Coherent, inc.) at 80 MHz. The total energy resolution was about 10 meV and cooling of the sample was carried out at rates 2 K/min to avoid thermal stress. Each measurement was preceded by a break of at least 15 min, to ensure thermalisation. Accordingly, the error on the absolute sample temperature was estimated to be well below 5 K. The photon-energy dependent ARPES measurements were performed at K at the URANOS beamline of the SOLARIS synchrotron in Krakow using a Scienta DA30L photoelectron analyzer.
6 Supporting Information
6.1 Photoemission calculations
The ARPES calculations were performed using the one-step model of photoemission implemented in the multiple scattering Green’s function code SPRKKR 51, 52. The bulk electronic structure was calculated within the atomic sphere approximation with angular momentum expansion up to with lattice parameter Å, rhombohedral distortion angle 59.9 degrees, and . To investigate the origin of the spectral features, we have compared one-step model calculations with the Rundgren-Malmström model surface barrier and a transparent barrier, which allows us to evaluate contributions from surface-related bands 53.
In the layer-KKR formalism of the one-step model of photoemission54, 55, the crystal structure is divided into layers whose transmission and reflection factors characterize the photocurrent attenuation inside the crystal. In addition to the atom layers, the Rundgren-Malmström56 type surface barrier connecting the inner potential of the crystal to the vacuum level is also treated as a layer with transmission and reflection factors. The surface barrier layer reflection factor is set to zero in the transparent barrier calculations.
6.2 Density functional theory calculations
Density functional theory (DFT) band structure calculations with spin-orbit coupling were performed using the Vienna ab-initio software package (VASP) 57, 58, 59, 60, 61. The SnTe(111) surface was modeled as a repeated slab geometry of 72 atom layers and 24 Å of vacuum between the adjacent slabs. Exchange and correlation (xc) effects were treated at the level of the generalized gradient approximation using the PBE xc-functional 62. The kinetic energy cutoff was set to 250 eV, and a 9×9×1 -point mesh was used for the Brillouin zone sampling in the slab calculations.
6.3 Photon-energy dependent ARPES measurements
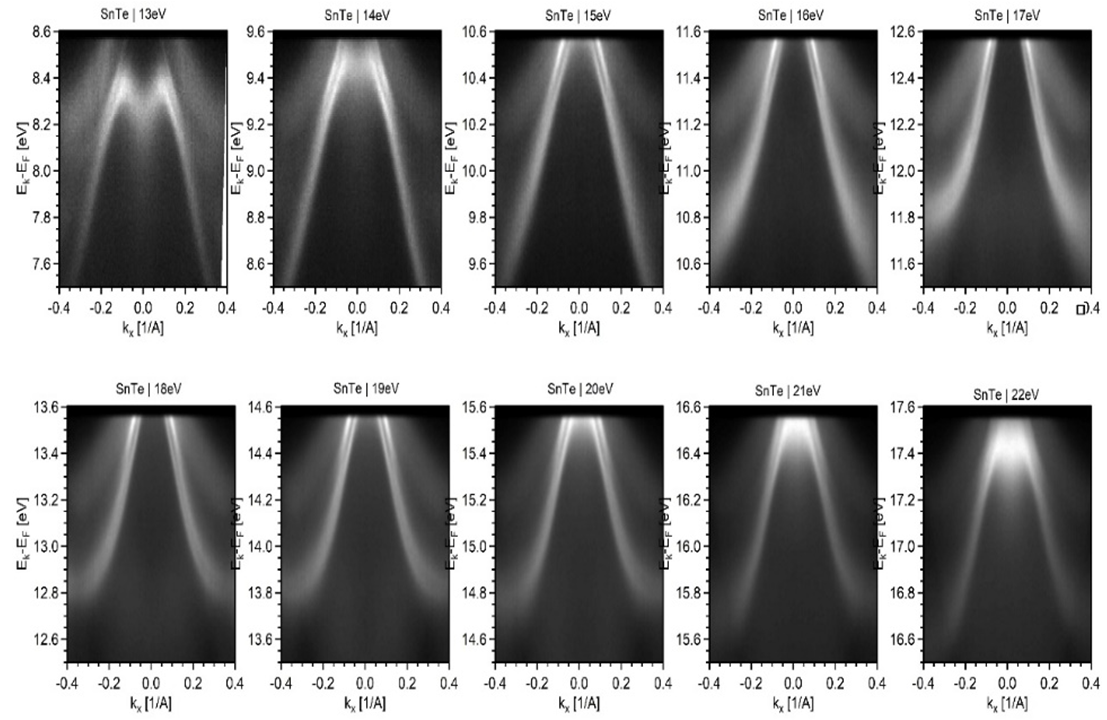
Figure 5 shows photon-energy dependent ARPES measurements taken along the high-symmetry direction at 30 K with photon energy ranging from 13 to 22 eV. These data allows to follow the dispersion of the different bands identified in the main text. Although the intensity of the surface states is lower than in the main text (probably due to a slightly degraded surface quality), we observe that the states and do not disperse as function of photon energy, contrarily the state . These data confirms our identification of and as surface states and as a bulk state.
6.4 Photoemission calculation for the 6.3 eV ARPES data
Figure 6 and 6 displays the one-step photoemission calculation with and without, respectively, the surface barrier at a photon energy of 6.3 eV along the same wave vector direction as used in the experiment. Despite slight differences with the experimental data in Fig. 3c of the main text (e.g., a very weak surface state in the calculations that seems to be hidden in the background of the measurement), the qualitative comparison is good and proves that the investigated band is a bulk one.
 \phantomcaption
6.5 DFT calculations for different surface terminations
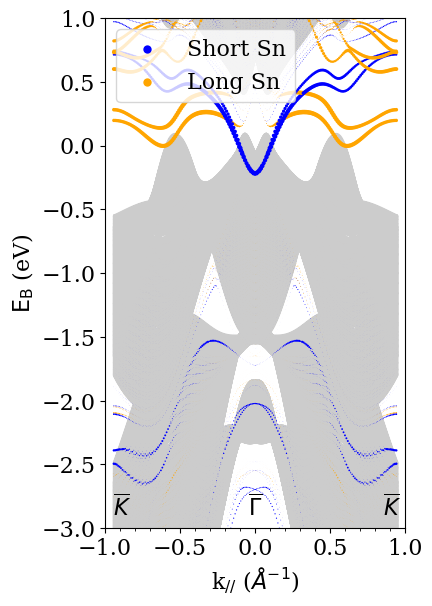
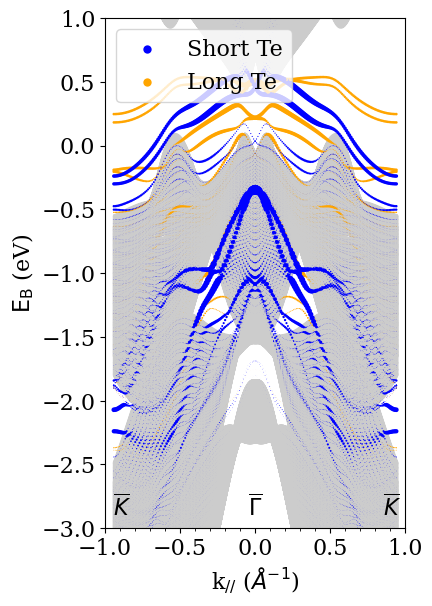
Figure 7 displays the DFT calculation of SnTe(111) in its ferroelectric state for four different terminations, namely the Te or Sn terminated surfaces, and for each case with a short or a long distance between the first two atomic planes (called short and long configurations thereafter). The bulk projected bands are integrated in the grey area and the contribution of the first surface layer is highlighted in yellow or blue dots, for the long and short configurations, respectively. As such, we expect to visualize the surface state (by analogy with GeTe, being interpreted as a surface resonance state having a deeper origin in the crystal 10). The comparison with the experimental data (see Fig. 2 of the main text) confirms our interpretation of the origin of the bands and clearly proves that our samples are Te terminated. The short distance configuration seems more likely, because of the presence of surface states with higher binding energies and because its work function (5.05 eV versus 5.45 eV for the long configuration) is closer to the experimental value (4.65 eV).
7 Fitting of the Rashba splitting
Figure 8 illustrates how the fits of the energy distributions curves (EDCs) were done in order to extract the Rashba splitting as a function of temperature. The combination of two Voigt functions with a linear background was used to fit the EDCs on a limited energy range, using the Levenberg-Marquardt algorithm of the lmfit software 63. No other constraints were imposed on the fit, apart from a manually chosen first guess. The splitting is determined as the distance between the centers of the two Voigt functions.
References
- Wolf et al. 2001 Wolf, S. A.; Awschalom, D. D.; Buhrman, R. A.; Daughton, J. M.; von Molnár, S.; Roukes, M. L.; Chtchelkanova, A. Y.; Treger, D. M. Spintronics: A Spin-Based Electronics Vision for the Future. Science 2001, 294, 1488–1495
- Xu et al. 2015 Xu, Y.; Awschalom, D.; Nitta, J. Handbook of Spintronics; Springer, 2015; pp 1–1596
- Rabe et al. 2007 Rabe, K. M.; Dawber, M.; Lichtensteiger, C.; Ahn, C. H.; Triscone, J.-M. Physics of Ferroelectrics: A Modern Perspective; Topics in Applied Physics; Springer, 2007; pp 1–30
- Noël et al. 2020 Noël, P.; Trier, F.; Vicente Arche, L. M.; Bréhin, J.; Vaz, D. C.; Garcia, V.; Fusil, S.; Barthélémy, A.; Vila, L.; Bibes, M.; Attané, J.-P. Non-volatile electric control of spin–charge conversion in a SrTiO3 Rashba system. Nature 2020, 580, 483–486
- noa 2020 A century of ferroelectricity. Nature Materials 2020, 19, 129–129
- Bhalla and Saxena 2021 Bhalla, A. S.; Saxena, A. Ferroelectricity: 100 years on. Physics World 2021, 33, 38
- Bychkov and Rashba 1984 Bychkov, Y. A.; Rashba, É. I. Properties of a 2D electron gas with lifted spectral degeneracy. JETP lett 1984, 39, 78
- Rotenberg et al. 1999 Rotenberg, E.; Chung, J. W.; Kevan, S. D. Spin-Orbit Coupling Induced Surface Band Splitting in Li/W(110) and Li/Mo(110). Phys. Rev. Lett. 1999, 82, 4066–4069
- Pawley et al. 1966 Pawley, G. S.; Cochran, W.; Cowley, R. A.; Dolling, G. Diatomic Ferroelectrics. Physical Review Letters 1966, 17, 753–755
- Krempaský et al. 2016 Krempaský, J. et al. Disentangling bulk and surface Rashba effects in ferroelectric -GeTe. Physical Review B 2016, 94, 205111
- Elmers et al. 2016 Elmers, H. J. et al. Spin mapping of surface and bulk Rashba states in ferroelectric -GeTe(111) films. Phys. Rev. B 2016, 94, 201403
- Di Sante et al. 2013 Di Sante, D.; Barone, P.; Bertacco, R.; Picozzi, S. Electric Control of the Giant Rashba Effect in Bulk GeTe. Advanced Materials 2013, 25, 509–513
- Wang et al. 2020 Wang, H.; Gopal, P.; Picozzi, S.; Curtarolo, S.; Buongiorno Nardelli, M.; Sławińska, J. Spin Hall effect in prototype Rashba ferroelectrics GeTe and SnTe. npj Computational Materials 2020, 6, 1–7
- Rinaldi et al. 2016 Rinaldi, C.; Rojas-Sánchez, J. C.; Wang, R. N.; Fu, Y.; Oyarzun, S.; Vila, L.; Bertoli, S.; Asa, M.; Baldrati, L.; Cantoni, M.; George, J.-M.; Calarco, R.; Fert, A.; Bertacco, R. Evidence for spin to charge conversion in GeTe(111). APL Materials 2016, 4, 032501
- Picozzi 2014 Picozzi, S. Ferroelectric Rashba semiconductors as a novel class of multifunctional materials. Frontiers in Physics 2014, 2
- Liebmann et al. 2016 Liebmann, M. et al. Giant Rashba-Type Spin Splitting in Ferroelectric GeTe(111). Advanced Materials 2016, 28, 560–565
- Krempaský et al. 2016 Krempaský, J. et al. Entanglement and manipulation of the magnetic and spin–orbit order in multiferroic Rashba semiconductors. Nature Communications 2016, 7, 13071
- Krempaský et al. 2018 Krempaský, J.; Muff, S.; Minár, J.; Pilet, N.; Fanciulli, M.; Weber, A.; Guedes, E.; Caputo, M.; Müller, E.; Volobuev, V.; Gmitra, M.; Vaz, C.; Scagnoli, V.; Springholz, G.; Dil, J. Operando Imaging of All-Electric Spin Texture Manipulation in Ferroelectric and Multiferroic Rashba Semiconductors. Physical Review X 2018, 8, 021067
- Kremer et al. 2022 Kremer, G.; Maklar, J.; Nicolaï, L.; Nicholson, C. W.; Yue, C.; Silva, C.; Werner, P.; Dil, J. H.; Krempaský, J.; Springholz, G.; Ernstorfer, R.; Minár, J.; Rettig, L.; Monney, C. Field-induced ultrafast modulation of Rashba coupling at room temperature in ferroelectric -GeTe(111). Nature Communications 2022, 13, 6396
- Iizumi et al. 1975 Iizumi, M.; Hamaguchi, Y.; F. Komatsubara, K.; Kato, Y. Phase Transition in SnTe with Low Carrier Concentration. J. Phys. Soc. Jpn. 1975, 38, 443–449
- Brillson et al. 1974 Brillson, L. J.; Burstein, E.; Muldawer, L. Raman observation of the ferroelectric phase transition in SnTe. Physical Review B 1974, 9, 1547–1551
- Kobayashi et al. 1976 Kobayashi, K. L. I.; Kato, Y.; Katayama, Y.; Komatsubara, K. F. Carrier-Concentration-Dependent Phase Transition in SnTe. Phys. Rev. Lett. 1976, 37, 772–774
- Mazelsky et al. 1962 Mazelsky, R.; Lubell, M. S.; Kramer, W. E. Phase Studies of the Group IV‐A Tellurides. The Journal of Chemical Physics 1962, 37, 45–47
- Littlewood 1980 Littlewood, P. B. The crystal structure of IV-VI compounds. II. A microscopic model for cubic/rhombohedral materials. Journal of Physics C: Solid State Physics 1980, 13, 4875
- Rabe and Joannopoulos 1985 Rabe, K. M.; Joannopoulos, J. D. Ab initio relativistic pseudopotential study of the zero-temperature structural properties of SnTe and PbTe. Physical Review B 1985, 32, 2302–2314
- Salje et al. 2010 Salje, E. K. H. et al. Tin telluride: A weakly co-elastic metal. Physical Review B 2010, 82, 184112
- Li et al. 2022 Li, Z.; Li, S.; Castellan, J.-P.; Heid, R.; Xiao, Y.; Zhao, L.-D.; Chen, Y.; Weber, F. Anomalous transverse optical phonons in SnTe and PbTe. Physical Review B 2022, 105, 014308
- O’Neill et al. 2017 O’Neill, C. D.; Sokolov, D. A.; Hermann, A.; Bossak, A.; Stock, C.; Huxley, A. D. Inelastic x-ray investigation of the ferroelectric transition in SnTe. Physical Review B 2017, 95, 144101
- Fornasini et al. 2021 Fornasini, P.; Grisenti, R.; Dapiaggi, M.; Agostini, G. Local structural distortions in SnTe investigated by EXAFS. Journal of Physics: Condensed Matter 2021, 33, 295404
- Mitrofanov et al. 2014 Mitrofanov, K. V.; Kolobov, A. V.; Fons, P.; Krbal, M.; Shintani, T.; Tominaga, J.; Uruga, T. Local structure of the SnTe topological crystalline insulator: Rhombohedral distortions emerging from the rocksalt phase. Physical Review B 2014, 90, 134101
- Fons et al. 2010 Fons, P.; Kolobov, A. V.; Krbal, M.; Tominaga, J.; Andrikopoulos, K. S.; Yannopoulos, S. N.; Voyiatzis, G. A.; Uruga, T. Phase transition in crystalline GeTe: Pitfalls of averaging effects. Physical Review B 2010, 82, 155209
- Matsunaga et al. 2011 Matsunaga, T.; Fons, P.; Kolobov, A. V.; Tominaga, J.; Yamada, N. The order-disorder transition in GeTe: Views from different length-scales. Applied Physics Letters 2011, 99, 231907
- Chatterji et al. 2015 Chatterji, T.; Kumar, C. M. N.; Wdowik, U. D. Anomalous temperature-induced volume contraction in GeTe. Physical Review B 2015, 91, 054110
- Fu 2011 Fu, L. Topological Crystalline Insulators. Phys. Rev. Lett. 2011, 106, 106802
- Hsieh et al. 2012 Hsieh, T. H.; Lin, H.; Liu, J.; Duan, W.; Bansil, A.; Fu, L. Topological crystalline insulators in the SnTe material class. Nature Communications 2012, 3, 982
- Shi et al. 2014 Shi, Y.; Wu, M.; Zhang, F.; Feng, J. surface states of SnTe. Phys. Rev. B 2014, 90, 235114
- Tanaka et al. 2012 Tanaka, Y.; Ren, Z.; Sato, T.; Nakayama, K.; Souma, S.; Takahashi, T.; Segawa, K.; Ando, Y. Experimental realization of a topological crystalline insulator in SnTe. Nature Phys 2012, 8, 800–803
- Tanaka et al. 2013 Tanaka, Y.; Shoman, T.; Nakayama, K.; Souma, S.; Sato, T.; Takahashi, T.; Novak, M.; Segawa, K.; Ando, Y. Two types of Dirac-cone surface states on the (111) surface of the topological crystalline insulator SnTe. Phys. Rev. B 2013, 88, 235126
- Yan et al. 2014 Yan, C.; Liu, J.; Zang, Y.; Wang, J.; Wang, Z.; Wang, P.; Zhang, Z.-D.; Wang, L.; Ma, X.; Ji, S.; He, K.; Fu, L.; Duan, W.; Xue, Q.-K.; Chen, X. Experimental Observation of Dirac-like Surface States and Topological Phase Transition in Pb1-xSnxTe (111) Films. Phys. Rev. Lett. 2014, 112, 186801
- Zhang et al. 2017 Zhang, Y.; Liu, Z.; Zhou, B.; Kim, Y.; Yang, L.; Ryu, H.; Hwang, C.; Chen, Y.; Hussain, Z.; Shen, Z.-X.; Mo, S.-K. ARPES study of the epitaxially grown topological crystalline insulator SnTe(111). Journal of Electron Spectroscopy and Related Phenomena 2017, 219, 35–40
- Polley et al. 2016 Polley, C. M.; Jovic, V.; Su, T.-Y.; Saghir, M.; Newby, D.; Kowalski, B. J.; Jakiela, R.; Barcz, A.; Guziewicz, M.; Balasubramanian, T.; Balakrishnan, G.; Laverock, J.; Smith, K. E. Observation of surface states on heavily indium-doped SnTe(111), a superconducting topological crystalline insulator. Phys. Rev. B 2016, 93, 075132
- Maiti et al. 2021 Maiti, A.; Pandeya, R. P.; Singh, B.; Iyer, K. K.; Thamizhavel, A.; Maiti, K. Anomalies in the temperature evolution of Dirac states in the topological crystalline insulator SnTe. Phys. Rev. B 2021, 104, 195403
- Plekhanov et al. 2014 Plekhanov, E.; Barone, P.; Di Sante, D.; Picozzi, S. Engineering relativistic effects in ferroelectric SnTe. Physical Review B 2014, 90, 161108
- Momma and Izumi 2011 Momma, K.; Izumi, F. VESTA 3 for three-dimensional visualization of crystal, volumetric and morphology data. Journal of Applied Crystallography 2011, 44, 1272–1276
- Knox et al. 2014 Knox, K. R.; Bozin, E. S.; Malliakas, C. D.; Kanatzidis, M. G.; Billinge, S. J. L. Local off-centering symmetry breaking in the high-temperature regime of SnTe. Physical Review B 2014, 89, 014102
- Aggarwal et al. 2016 Aggarwal, L.; Banik, A.; Anand, S.; Waghmare, U. V.; Biswas, K.; Sheet, G. Local ferroelectricity in thermoelectric SnTe above room temperature driven by competing phonon instabilities and soft resonant bonding. Journal of Materiomics 2016, 2, 196–202
- Chang et al. 2016 Chang, K.; Liu, J.; Lin, H.; Wang, N.; Zhao, K.; Zhang, A.; Jin, F.; Zhong, Y.; Hu, X.; Duan, W.; Zhang, Q.; Fu, L.; Xue, Q.-K.; Chen, X.; Ji, S.-H. Discovery of robust in-plane ferroelectricity in atomic-thick SnTe. Science 2016, 353, 274–278
- Ito et al. 2020 Ito, H.; Otaki, Y.; Tomohiro, Y.; Ishida, Y.; Akiyama, R.; Kimura, A.; Shin, S.; Kuroda, S. Observation of unoccupied states of SnTe(111) using pump-probe ARPES measurement. Phys. Rev. Research 2020, 2, 043120
- Cho et al. 2018 Cho, S.; Park, J.-H.; Hong, J.; Jung, J.; Kim, B. S.; Han, G.; Kyung, W.; Kim, Y.; Mo, S.-K.; Denlinger, J. D.; Shim, J. H.; Han, J. H.; Kim, C.; Park, S. R. Experimental Observation of Hidden Berry Curvature in Inversion-Symmetric Bulk 2H-WSe2. Phys. Rev. Lett. 2018, 121, 186401
- 50 Kim, J.; Kim, K.-W.; Shin, D.; Lee, S.-H.; Sinova, J.; Park, N.; Jin, H. Prediction of ferroelectricity-driven Berry curvature enabling charge- and spin-controllable photocurrent in tin telluride monolayers. 10, 3965, Number: 1 Publisher: Nature Publishing Group
- Ebert et al. 2011 Ebert, H.; Ködderitzsch, D.; Minár, J. Calculating condensed matter properties using the KKR-Green’s function method—recent developments and applications. Reports on Progress in Physics 2011, 74, 096501
- Braun et al. 2018 Braun, J.; Minár, J.; Ebert, H. Correlation, temperature and disorder: Recent developments in the one-step description of angle-resolved photoemission. Physics Reports 2018, 740, 1–34
- Rundgren and Malmstrom 1977 Rundgren, J.; Malmstrom, G. Transmission and reflection of low-energy electrons at the surface barrier of a metal. Journal of Physics C: Solid State Physics 1977, 10, 4671
- Pendry 1976 Pendry, J. Theory of photoemission. Surface Science 1976, 57, 2
- Braun et al. 2018 Braun, J.; Minar, J.; Ebert, H. Correlation, temperature and disorder: Recent developments in the one-step description of angle-resolved photoemission. Physics Reports 2018, 740, 1
- Malmstroem and J. Rundgren 1980 Malmstroem, G.; J. Rundgren, J. A program for calculation of the reflection and transmission of electrons through a surface potential barrier. Computer Physics Communications 1980, 19, 2
- Kresse and Hafner 1993 Kresse, G.; Hafner, J. Ab initio molecular dynamics for liquid metals. Phys. Rev. B 1993, 47, 558–561
- Kresse and Hafner 1994 Kresse, G.; Hafner, J. Ab initio molecular-dynamics simulation of the liquid-metal–amorphous-semiconductor transition in germanium. Phys. Rev. B 1994, 49, 14251–14269
- Kresse and Furthmüller 1996 Kresse, G.; Furthmüller, J. Efficiency of ab-initio total energy calculations for metals and semiconductors using a plane-wave basis set. Computational Materials Science 1996, 6, 15–50
- Kresse and Furthmüller 1996 Kresse, G.; Furthmüller, J. Efficient iterative schemes for ab initio total-energy calculations using a plane-wave basis set. Phys. Rev. B 1996, 54, 11169–11186
- Kresse and Joubert 1999 Kresse, G.; Joubert, D. From ultrasoft pseudopotentials to the projector augmented-wave method. Phys. Rev. B 1999, 59, 1758–1775
- Perdew et al. 1996 Perdew, J. P.; Burke, K.; Ernzerhof, M. Generalized Gradient Approximation Made Simple. Phys. Rev. Lett. 1996, 77, 3865–3868
- Newville et al. 2014 Newville, M.; Stensitzki, T.; Allen, D. B.; Ingargiola, A. LMFIT: Non-Linear Least-Square Minimization and Curve-Fitting for Python. 2014; https://doi.org/10.5281/zenodo.11813