Separate and Locate: Rethink the Text in Text-based Visual Question Answering
Abstract.
Text-based Visual Question Answering (TextVQA) aims at answering questions about the text in images. Most works in this field focus on designing network structures or pre-training tasks. All these methods list the OCR texts in reading order (from left to right and top to bottom) to form a sequence, which is treated as a natural language “sentence”. However, they ignore the fact that most OCR words in the TextVQA task do not have a semantical contextual relationship. In addition, these approaches use 1-D position embedding to construct the spatial relation between OCR tokens sequentially, which is not reasonable. The 1-D position embedding can only represent the left-right sequence relationship between words in a sentence, but not the complex spatial position relationship. To tackle these problems, we propose a novel method named Separate and Locate (SaL) that explores text contextual cues and designs spatial position embedding to construct spatial relations between OCR texts. Specifically, we propose a Text Semantic Separate (TSS) module that helps the model recognize whether words have semantic contextual relations. Then, we introduce a Spatial Circle Position (SCP) module that helps the model better construct and reason the spatial position relationships between OCR texts. Our SaL model outperforms the baseline model by 4.44% and 3.96% accuracy on TextVQA and ST-VQA datasets. Compared with the pre-training state-of-the-art method pre-trained on 64 million pre-training samples, our method, without any pre-training tasks, still achieves 2.68% and 2.52% accuracy improvement on TextVQA and ST-VQA. Our code and models will be released at https://github.com/fangbufang/SaL .
1. Introduction
Text-based Visual Question Answering (TextVQA) (Singh et al., 2019; Biten et al., 2019; Mishra et al., 2019) aims to answer questions by understanding the interaction of scene text and visual information in the image. It requires models not only to recognize the difference between text and visual information but also to have the ability to reason the answer based on various modalities. Most of the works in this field explore the network structure (Kant et al., 2020; Hu et al., 2020; Zeng et al., 2021; Jin et al., 2022; Han et al., 2020; Fang et al., 2022) and design specific pre-training tasks (Yang et al., 2021; Biten et al., 2022; Lu et al., 2021), which promote field development. All of them use a transformer-based model (Vaswani et al., 2017), which is trained from scratch or initiated by a pre-training language model, to fuse different modality information. These transformer-based models (Devlin et al., 2019; Raffel et al., 2020) are usually used to process semantically coherent and complete sentences in Natural Language Processing (NLP).
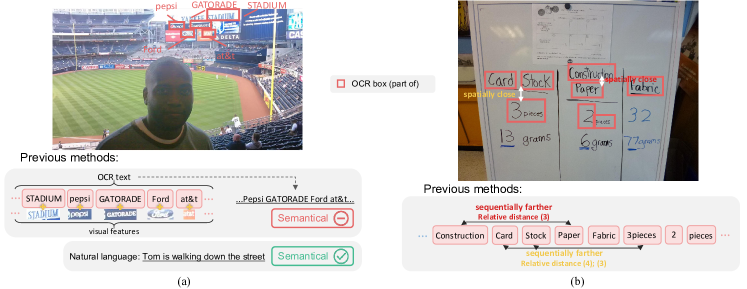
However, the text in images is recognized by the Optical Character Recognition (OCR) system (Borisyuk et al., 2018). These texts are scattered throughout the image. Compared with the input sentence in NLP tasks, these OCR texts distributed in the image may not be semantically related and cannot form a sentence. Figure 1 (a) shows the difference between the input of the TextVQA models and a natural language sentence. In Figure 1 (a), the sentence “Tom is walking down the street” is semantically coherent and complete. There are apparent contextual relationships in natural language sentences, and the words in the sentence have semantic relevance. Conversely, the OCR texts “Pepsi GATORADE Ford at&t” do not actually have contextual semantic associations. However, all the previous works in TextVQA ignore that texts in an image are different from the sentence in NLP. The OCR texts sequence “Pepsi GATORADE Ford at&t” is regarded as a sentence in current methods, even though the words in it do not actually have contextual semantic associations. Forcing these irrelevant OCR texts to form a sentence will force the model to construct contextual relationships that should not exist in these texts, adding harmful noise to the learning process of the model.
Another difference is that natural language text input has a reading order from left to right and top to down. The words and sentences in natural language inherently have semantic associations, so the text can be spliced in reading order and form as a linguistic sequence. There is no problem to use absolute position embedding or relative position embedding to indicate the sequential-position relationships between different words or sentences. However, OCR texts recognized in the scene image cannot simply be spliced from left to right and top to bottom. We attribute this to the nature that OCR texts show strong spatial-position relations between each other. The 1-D relative or absolute position encoding cannot express the 2-D complex spatial relationship in the image. It is not reasonable if we input the concatenated OCR texts into the model and then use the original 1-D position embedding for position modeling. This will lead to some OCR texts that are spatially close in the image being set away from each other by the 1-D position embedding. Intuitively, OCR texts that are adjacent left and right, or up and down in an image are more likely to have direct semantic associations. For example, in Figure 1 (b), current methods take in “Construction Card Stock Paper Fabric 3pieces…” with 1-D position embedding adding to them, which will cause ‘Construction’ to be close to ‘Card’ while the distance between ‘Construction’ and ‘Paper’ is far. It will also lead to ‘3 pieces’ close to ‘Fabric’ but farther away from ‘Card Stock’. However, ‘3 pieces’ is more semantically related to ‘Card Stock’ which is spatially close. Therefore, better spatial-aware position modeling is appealing.
To alleviate the above problems, we rethink the text in Text-based Visual Question Answering and propose a new method called Separate and Locate (SaL). Aiming at the problem that there is no apparent semantic association between the text in the image, we introduce a Text Semantic Separate (TSS) module. Compared with directly combining unrelated OCR texts into a sentence, TSS can learn to reduce the noise during training by separating OCR texts that do not have semantic relevance. In this way, the model is promoted to better learn relationships between different OCR texts and help the subsequent reasoning of answers to text-related questions. As for the problem that 1-D position encoding cannot properly express the spatial position relationships between OCR texts, we introduce a Spatial Circle Position (SCP) module. SCP provides each text in the image with representations indicating the spatial relative distances between it and all other texts. Specifically, we follow the Pythagorean theorem (Maor, 2019) to calculate spatial relative distances between two texts.
Benefiting from the two modules, our proposed SaL properly overcomes the problems of ambiguous semantic associations of OCR texts and inaccurate positional representations. With better correlation capturing and the spatial-position realization between different OCR texts, SaL enhances the model’s feature fusion ability and multi-modal information reasoning ability.
We conduct experiments on two benchmarks: TextVQA (Singh et al., 2019) and ST-VQA (Biten et al., 2019). SaL, without any pretraining tasks that are adapted in previous works(Biten et al., 2022; Lu et al., 2021; Yang et al., 2021), outperforms the SOTA methods even including those pre-training ones. The reason for not adapting pre-training is that OCR annotations of the SOTA pre-training dataset with 64 million samples are not open-source. We believe that our performance can be further improved by pre-training on the large-scale pre-training data.
In summary, our contributions are three-folded:
1. We are the first to claim that the text input in TextVQA is different from that in NLP. Most of the OCR texts do not have semantic associations and should not be stitched together. For this, we designed a Text Semantic Separate (TSS) module.
2. We propose a Spatial Circle Position (SCP) module to help the model realize the spatial relative-position information between OCR texts. It can solve the problem that 1-D position embedding cannot well represent the text position in the image.
3. Extensive experiments demonstrate the effectiveness of our method. SaL outperforms the current SOTA method by 2.68% and 2.52% on TextVQA and ST-VQA respectively (The SOTA method uses 64 million pre-training data but we do not use any pre-training data).
2. Related Work
2.1. Vision-language tasks incorporating scene text
As scene-text visual question answering (Biten et al., 2019; Singh et al., 2019) has gradually gained attention, in order to enhance the scene-text understanding ability of VQA models (Antol et al., 2015; Alberti et al., 2019), several datasets (Singh et al., 2019; Biten et al., 2019; Mishra et al., 2019) have been proposed to promote the development of this field.
Previous works (Liu et al., 2020; Singh et al., 2021; Wang et al., 2020; Han et al., 2020; Hu et al., 2020; Fang et al., 2022; Biten et al., 2022; Wang et al., 2022; Lu et al., 2021; Yang et al., 2021; Zeng et al., 2021; Jin et al., 2022) realize that texts play an important role in answering text-related questions. CRN (Liu et al., 2020) focuses on the interaction between text and visual objects. LaAP-Net (Han et al., 2020) gives the bounding box of the generated answer to guide the process of answer generation. SMA (Gao et al., 2020) and SA-M4C (Kant et al., 2020) build graphs to build relations between OCR texts and objects. TAG (Wang et al., 2022) introduces a data augmentation method for TextVQA.
TAP (Yang et al., 2021), LOGOS (Lu et al., 2021), LaTr (Biten et al., 2022), and PreSTU (Kil et al., 2022) propose different pre-training tasks to promote the development of scene-text visual question answering. Specifically, TAP proposed a text-aware pre-training task that predicts the relative spatial relation between OCR texts. LOGOS introduces a question-visual grounding task to enhance the connection between text and image regions. LaTr is based on the T5 model (Raffel et al., 2020) and proposes a layout-aware pre-training task that incorporation of the layout information. PreSTU is based on the mT5 model and designed a simple pre-training recipe for scene-text understanding.
However, all of them ignore the irrelevance between different OCR texts and the poor ability of original 1-D position encoding. Our model separates different OCR words according to their semantic contextual information and can realize the difference between OCR texts and complete semantically related sentences. Furthermore, it can establish accurate relative spatial relationships between each OCR word, which facilitates the answering process.
2.2. Spatial position encoding methods
After the Transformer (Devlin et al., 2019) becomes the common paradigm of NLP, the 1-D absolute position encoding (Devlin et al., 2019) and relative position encoding (Shaw et al., 2018) are proposed to identify the position relation between the different words in the sentence. After Vit (Dosovitskiy et al., 2020) uses the transformer to process the image task, Standalone self-attention (Ramachandran et al., 2019) proposes an encoding method for 2-D images. The idea is simple. It divides the 2-D relative encoding into horizontal and vertical directions, such that each direction can be modeled by a 1-D encoding.
However, it only gives each image region a simple absolute spatial position encoding, and cannot directly construct the relative spatial relationship and distance between images. Simply summing two one-dimensional positional embeddings of x and y to represent the positional relationship of regions in an image is the main limitation that prevents the model from learning spatial relationships.
LaAP-Net (Han et al., 2020), SMA (Gao et al., 2020), SA-M4C (Kant et al., 2020), and LaTr (Biten et al., 2022) prove the critical role of the position of OCR texts in the TextVQA field. They proposed various network structures and pre-training tasks to make the model learn the different spatial position relations between OCR texts. LaAP-Net, SMA, and SA-M4C still use traditional 1-D absolute position encoding in NLP to build spatial associations between OCR texts. Although LaTr uses six learnable lookup tables to construct the spatial layout information of OCR text, it does not improve much in the absence of a large amount of data pre-training, because it still uses the simple addition of multiple original 1-D position encoding to represent spatial position information.
Our method models the spatial relative distance and implicit angle of each OCR text in the image to all other OCR texts, which is a more direct and reasonable spatial encoding representation.
3. Method
SaL analyzes the difference between OCR texts in TextVQA and complete sentences in NLP. In terms of semantic relations, SaL proposes a Text Semantic Separate (TSS) module that explicitly separates OCR texts without semantic contextual relations. In terms of spatial-position relations, SaL introduces a Spatial Circle Position (SCP) module that models 2-D relative spatial-position relations for OCR texts. With these two modules, our method can separate semantic irrelevance OCR texts and locate the accurate spatial position of OCR texts in the image.
In this section, we introduce the whole process of our model. Specifically, we elaborate on the TSS and SCP modules in Sections 3.2 and 3.3 respectively.
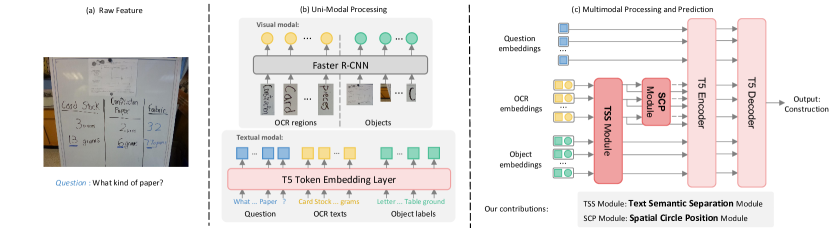
3.1. Multimodal Feature Embedding
Following LaTr, we utilize a transformer of Text-to-Text Transfer Transformer (T5) as the backbone. As shown in Figure 2(a), the original data in each sample in the dataset is a image and the corresponding question. Next, as shown in Figure 2(b), we use the FRCNN model and the T5 token embedding layer to process visual and text information respectively. Finally, as shown in Figure 2(c), the question, OCR text, and object features are concatenated together and input into the model. The specific process is as follows:
Question Features. Following LaTr, the question words are indexed as the question feature embeddings by T5 token embedding layer, where is the embedding of the -th question word, is the length of the question, and is the dimension of the feature.
OCR Features. For texts recognized in input images by the OCR system, we have three different features: 1) visual features extracted by Faster R-CNN . 2) the corresponding bounding box of visual features . 3) the text embedding produced by the T5 embedding layer. The final OCR feature is:
| (1) |
Object Features. To get object region features, we apply the same Faster R-CNN model mentioned in OCR features:
| (2) |
where is the appearance feature, is the bounding box feature and is the t5 word embedding corresponding to the object label.
Therefore, the input embedding is:
| (3) |
where is the question embeddings, is the OCR embeddings, is the object embeddings. The cat means the concatenating function.
3.2. Text Semantic Separate Module
Unlike words in a sentence, scene texts in images are distributed in various positions of the image. They are distributed on different text carriers and backgrounds of different materials, which naturally leads to no contextual relationship between most texts. Since the previous work did not realize this, OCR texts are directly spliced as a sentence and input into the model. This makes the learning process of the model suffer from noises.
To this end, the Text Semantic Separate (TSS) module separates different OCR texts according to their visual and spatial information, so that the model can correctly recognize differences between OCR texts and the natural sentence, and better help the model to express and fuse the features of the question, the OCR text, and the object. Specifically, we can look at the bottom of Figure 3(a). Without the TSS module, the model stitches the OCR text together, making the model think that two adjacent words such as ‘Paper’ and ‘Fabric’ may have contextual relationships. However, it is not the case.
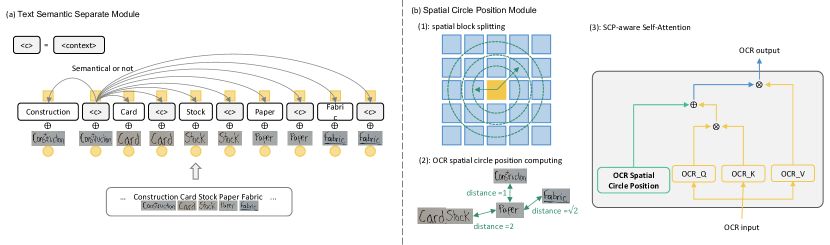
Our TSS module inserts a context-separation token ¡context¿ after the last token of each OCR text. Every ¡context¿ token is represented by its learnable reserved embedding from the T5 lookup table. Then, we add the visual feature and bounding coordination of each OCR text to its corresponding context-separation token (shown in Figure 3 (a)). Finally, each context-separation token can interact with all other OCR texts and distinguish whether there is a semantic relationship by visual relation and coordination relation. The benefits of this are: 1) The model can learn that there is no contextual relationship between different OCR texts, which helps the model’s reasoning and feature fusion. 2) ¡context¿ can combine the OCR texts before and after to learn the difference between different OCR texts. 3) Compared with directly splicing OCR text into sentences, this method reduces noise.
3.3. Spatial Circle Position Module
The spatial position relationship of text in natural scenes is extremely important for solving text-related questions. How to construct the complex spatial position relationship between texts has become one of the urgent problems to be solved. We, therefore, propose the SCP module to construct precise inter-textual spatial position relationships.
Specifically, SCP includes the following three steps: 1) divide the scene image into 11 11 image areas, and assign all OCR texts to the corresponding areas by their coordinates; 2) calculate the spatial distance between each OCR text and all other texts through the Pythagorean theorem; 3) assign spatial position embeddings between the OCR text and other OCR texts based on the calculated spatial distances and feed them into the spatial circle position-aware self-attention. The formula for this process is as follows:
| (4) | |||
| (5) | |||
| (6) | |||
| (7) | |||
| (8) | |||
| (9) |
where Patch is a function that aligns the OCR text to the image patch coordination by its coordination. Pytha is a function that calculates the spatial distance between OCR texts. Embedding is a function in Pytorch and it is a 32*12 look-up table. are learnable parameters of the self-attention layer and is a scaling factor.
Using the SCP module has the following advantages: 1) Compared with models such as SMA and SA-M4C, which construct an attention layer that specifically handles a variety of predefined spatial position relationships. SCP explicitly constructs all spatial relationships of each OCR text with other OCR texts through spatial distance. In addition, since in the first step of Figure 3 (b), various angle relationships implicitly exist between each image block, and each OCR text assigned to a different image block also implicitly contains various angle relationships. It does not require additional consumption of model parameters, only a 32*12 learnable look-up table is required. 2) Compared with LaTr, which uses 6 learnable look-up tables of 1000*768 and a large amount of pre-training data, the explicit construction method of SCP is much better (See Table 5 for details). 3) The previous method builds global spatial positional relationships of all OCR texts and cannot well construct the relative spatial positional relationship between each OCR text and all other OCR texts. SCP takes into account the implicit angle and spatial distance between each OCR text and all other OCR texts, and can more accurately locate the position of the text in the image.
As we can see in Figure 3 (a), the previous methods tend to generate many unreasonable positional relationships due to the lack of spatial position representation capabilities. For example, ‘Construction’ is closer to ‘Card’ but ‘Construction’ is farther away from ‘Paper’. This obviously doesn’t match what we see in the image. Our approach solves this problem very well. Specifically, as shown in Figure 3 (b3), we added our SCP module to the attention layer, so that the model can capture various angles and spatial position relationships between OCR texts.
3.4. Training Loss
Following previous works, we use the binary cross-entropy loss to train our model. Since there are several answers to the question in the sample, it can be converted into a multi-label classification problem. The binary cross-entropy loss can be defined as followings:
| (10) |
where is the prediction and is the ground-truth target.
| # | Model | OCR system | Pre-Training Data | Extra Finetune | Val Acc. (%) | Test Acc. (%) |
|---|---|---|---|---|---|---|
| 1 | M4C (Hu et al., 2020) | Rosetta-en | - | - | 39.40 | 39.01 |
| 2 | SMA (Gao et al., 2020) | Rosetta-en | - | - | 40.05 | 40.66 |
| 3 | LaAP-Net (Han et al., 2020) | Rosetta-en | - | - | 40.68 | 40.54 |
| 4 | CRN (Liu et al., 2020) | Rosetta-en | - | - | 40.39 | 40.96 |
| 5 | BOV (Zeng et al., 2021) | Rosetta-en | - | - | 40.90 | 41.23 |
| 6 | SC-Net (Fang et al., 2022) | Rosetta-en | - | - | 41.17 | 41.42 |
| 7 | TAP (Yang et al., 2021) | Rosetta-en | TextVQA | - | 44.06 | - |
| 8 | LaTr-Base (Biten et al., 2022) | Rosetta-en | - | - | 44.06 | - |
| 9 | SaL-Base | Rosetta-en | - | - | 48.67 | - |
| 10 | SA-M4C (Kant et al., 2020) | Google-OCR | - | ST-VQA | 45.40 | 44.60 |
| 11 | SMA (Gao et al., 2020) | SBD-Trans OCR | - | ST-VQA | - | 45.51 |
| 12 | LOGOS (Lu et al., 2021) | Microsoft-OCR | - | ST-VQA | 51.53 | 51.08 |
| 13 | TWA (Jin et al., 2022) | Microsoft-OCR | - | ST-VQA | 52.70 | 52.40 |
| 14 | TAG (Wang et al., 2022) | Microsoft-OCR | TextVQA,ST-VQA | ST-VQA | 53.63 | 53.69 |
| 15 | TAP (Yang et al., 2021) | Microsoft-OCR | TextVQA,ST-VQA,TextCaps,OCR-CC | ST-VQA | 54.71 | 53.97 |
| 16 | LaTr-Base (Biten et al., 2022) | Amazon-OCR | IDL | - | 58.03 | 58.86 |
| 17 | LaTr-Base (Biten et al., 2022) | Amazon-OCR | IDL | ST-VQA | 59.53 | 59.55 |
| 18 | LaTr-Large (Biten et al., 2022) | Amazon-OCR | IDL | ST-VQA | 61.05 | 61.60 |
| 19 | SaL-Base | Amazon-OCR | - | - | 62.42 | 62.35 |
| 20 | SaL-Base | Amazon-OCR | - | ST-VQA | 62.85 | 63.18 |
| 21 | SaL-Large | Amazon-OCR | - | - | 63.88 | 63.92 |
| 22 | SaL-Large | Amazon-OCR | - | ST-VQA | 64.58 | 64.28 |
4. Experiments
In this section, we verify the effectiveness of our method on two main benchmarks, TextVQA and ST-VQA. In Section 4.1, we introduce them and evaluation metrics.
In Sections 4.2 and 4.3, we compare our method with SOTA methods and conduct ablation experiments. Finally, in Section 4.4 we present the visualization results. Following LaTr, we use to refer to the models trained on TextVQA and ST-VQA. ‘-Base’ and ‘-Large’ model sizes refer to architectures that have 12+12 and 24+24 layers of transformers in encoder and decoder, respectively.
4.1. Datasets and Evaluation Metrics
TextVQA (Singh et al., 2019) is the main dataset for text-based visual question answering. It is a subset of open images (Kuznetsova et al., 2020) and is annotated with 10 ground-truth answers for each scene-text-related question. It includes 28,408 images with 45,336 questions. Following previous settings, we split the dataset into 21,953 images, 3,166 images, and 3,289 images respectively for train, validation, and test set. The methods are evaluated by the soft-voting accuracy of 10 answers.
ST-VQA is similar to TextVQA and it contains 23,038 images with 31,791 questions. We follow the setting from M4C and split the dataset into train, validation, and test splits with 17,028, 1,893, and 2,971 images respectively. The data in ST-VQA is collected from Cocotext (Veit et al., 2016), Visual Genome (Krishna et al., 2017), VizWiz (Bigham et al., 2010), ICDAR (Karatzas et al., 2015, 2013), ImageNet (Deng et al., 2009), and IIIT-STR (Mishra et al., 2013) datasets. Different from TextVQA, we report both soft-voting accuracy and Average Normalized Levenshtein Similarity(ANLS) on this dataset. ANLS defined as , where is the prediction, is the ground-truth answer, is the edit distance.
4.2. Experiment Results
4.2.1. TextVQA Results
For a fair comparison with previous methods, we divide the previous methods into non-pre-trained methods and pre-trained methods pre-training on numerous data. Since the accuracy of the OCR system for recognizing text has a great influence on the performance of the model, our method uses the classic Rosetta OCR and Amazon OCR to make a fairer comparison with the previous methods.
As shown in Table 1, in the case of using Rosetta OCR, the performance of our method has reached an accuracy rate of 48.67% in the validation set of TextVQA, which exceeds the previous SOTA method LaTr by 4.61%.
In the case of using Amazon-OCR, our method uses the same T5-base as the previous SOTA LaTr-base as the model structure, and our method outperforms LaTr by 3.32% and 3.63% accuracy on the validation set and test set of TextVQA, respectively. In the case of using the T5-large and training on both TextVQA and ST-VQA datasets, our method achieved the new best accuracy of 64.58% and 64.28% on the validation set and test set of TextVQA respectively. Our method outperforms the SOTA LaTr-large method with the same configuration by 3.53% and 2.68% respectively. It is worth noting that the additional pre-training data set IDL (Biten et al., 2022) containing 64 million data used by LaTr is not open source, which hinders our method from pre-training. This demonstrates the effectiveness and efficiency of our method. Since this pre-training method is orthogonal to our method, we believe that our method will be further improved by applying the pre-training task of LaTr.
4.2.2. ST-VQA Results
As we can see in Table 2, under the unconstrained setting, SaL-Large achieves 64.16% accuracy, 0.722 ANLS on the validation set of ST-VQA, and ANLS of 0.717 on the test set. Our model exceeds SOTA LaTr-Large by 2.52% accuracy, 2.0% ANLS on the ST-VQA validation set, and 2.1% ANLS on the ST-VQA test set. Likewise, SaL-base also outperforms LaTr-base by a large margin. From Table 1 and Table 2, we can observe that training on both TextVQA and ST-VQA, the improvement on TextVQA (from 62.42% to 62.85% on SaL-base, from 63.88% to 64.58% on SaL-large ) is not significant as the improvement on the ST-VQA dataset (from 59.74% to 62.29% on SaL-base and from 61.45% to 64.16% on SaL-large). We will analyze this phenomenon in Appendix B.
| # | Model | Val Acc. (%) | Val ANLS | Test ANLS |
|---|---|---|---|---|
| 1 | M4C (Hu et al., 2020) | 38.05 | 0.472 | 0.462 |
| 2 | SA-M4C (Kant et al., 2020) | 42.23 | 0.512 | 0.504 |
| 3 | SMA (Gao et al., 2020) | - | - | 0.466 |
| 4 | CRN (Liu et al., 2020) | - | - | 0.483 |
| 5 | LaAP-Net (Han et al., 2020) | 39.74 | 0.497 | 0.485 |
| 6 | LOGOS (Lu et al., 2021) | 48.63 | 0.581 | 0.579 |
| 7 | TAP (Yang et al., 2021) | 50.83 | 0.598 | 0.597 |
| 8 | LaTr-Base (Biten et al., 2022) | 58.41 | 0.675 | 0.668 |
| 9 | LaTr-Base (Biten et al., 2022) | 59.09 | 0.683 | 0.684 |
| 10 | LaTr-Large (Biten et al., 2022) | 61.64 | 0.702 | 0.696 |
| 11 | SaL-Base | 59.74 | 0.683 | 0.673 |
| 12 | SaL-Base | 62.29 | 0.708 | 0.697 |
| 13 | SaL-Large | 61.45 | 0.699 | 0.685 |
| 14 | SaL-Large | 64.16 | 0.722 | 0.717 |
4.3. Ablation Study
In this section, we provide insightful experiments that we deem influential for the TextVQA task and its future development. We first analyze the performance improvement of the different modules we propose on the TextVQA dataset. Afterward, we analyze the effect of different input information on the model performance. Then, to prove the effectiveness of our SCP module, we compare our SCP module and layout embedding in LaTr. Finally, for different methods of OCR text separation, we conduct experiments and further emphasize that our TSS module is the most effective choice.
| # | Model | Module | TextVQA Acc.(%) | ST-VQA Acc.(%) | ST-VQA ANLS |
|---|---|---|---|---|---|
| 1 | Baseline | - | 57.98 | 55.78 | 0.649 |
| 2 | Baseline | TSS | 61.55 | 58.29 | 0.667 |
| 3 | Baseline | SCP | 60.98 | 57.80 | 0.666 |
| 4 | Baseline | TSS + SCP | 62.42 | 59.74 | 0.683 |
4.3.1. The Effective Of Modules
In order to prove the effectiveness of our proposed method, we follow LaTr to do ablation experiments on TextVQA and ST-VQA based on T5-Base.
As shown in the first row of Table 3, our baseline model (removing all of our proposed modules) shows the worst performance compared to our full model and other ablated ones.
As shown in the second row of Table 3, with the help of the TSS module, the accuracy of our baseline on TextVQA increased from 57.98% to 61.55%, and the accuracy on ST-VQA increased from 55.78% to 58.29%. This proves that the TSS module can make the model realize whether there is a semantic context relationship directly between different OCR texts, reducing the noise generated by treating all OCR texts as a sentence in previous work.
When adding the SCP module, the performance of the baseline on TextVQA and ST-VQA increased from 57.98% to 60.98% and from 55.78% to 57.80% respectively. At the same time, the ANLS metric also improved by 1.7% on ST-VQA. This proves that the SCP module can help the model better locate OCR texts in different spatial positions in the image, and construct the spatial relationship between OCR texts in different positions.
Adapting TSS and SCP modules at the same time (our full model), compared with the baseline, the accuracy on TextVQA and ST-VQA is increased by 4.44% and 3.96% respectively. The ANLS of our model on ST-VQA maintained the same trend as the accuracy and increased by 3.40%, indicating the importance of both modules. In the visualization section, we will more intuitively show the impact of these two modules on model inference.
| Model | Quetsion | OCR Text | OCR Visual | OBJ Label | OBJ Visual | Acc. |
|---|---|---|---|---|---|---|
| SaL | ✔ | ✗ | ✗ | ✗ | ✗ | 11.97 |
| ✔ | ✔ | ✗ | ✗ | ✗ | 56.17 | |
| ✔ | ✔ | ViT | ✗ | ✗ | 56.78 | |
| ✔ | ✔ | FRCNN | ✗ | ✗ | 61.31 | |
| ✔ | ✔ | FRCNN | ✔ | ✗ | 61.97 | |
| ✔ | ✔ | FRCNN | ✔ | ✔ | 62.42 |
4.3.2. The Influence Of Different Input Information
We explore the effect of different input information on the model. We use the coordinate information of OCR and objects in the image by default. The results are shown in Table 4. It can be seen that OCR information (including both text and visual information) has the greatest impact on the performance of the model. Adding OCR text and its visual information extracted by FRCNN achieves an accuracy of 61.31%, which drastically improve the model with only question input. In addition, different from the conclusion in LaTr, when using the same T5-Base model as the model structure, the performance of OCR using FRCNN visual features is much better than using ViT visual features in our experiments. For this, two reasons can be regarded. The first one is that compared to ViT, we bind FRCNN features with OCR text features through addition operations. This means that for each OCR text, we can accurately fuse its text and visual features. However, using ViT visual features requires the model to be trained to match each OCR text with its associated image patch. There is no supervisory signal to help OCR text to match ViT features during training, making the performance of using ViT visual features much worse than that of using FRCNN features. The second reason is that the ViT model needs to resize the image to 224*224, which greatly reduces the resolution of the image, making the ViT feature unable to express the visual information of the original image well.

4.3.3. Effectiveness Of Spatial Circle Position Module.
In order to further prove the importance of the relative spatial position and distance between the OCR texts in the image and the effectiveness of our SCP module, we compare the LaTr method that represents the absolute spatial position of the OCR text with our SCP module. For a fair comparison, both our model and LaTr only input questions and OCR text (no visual features). As shown in Table 5, the use of layout embedding to represent the spatial position of the OCR text in the image increases the accuracy of the LaTr model in the TextVQA validation set by 0.85%. We use layout embedding in SaL, and the accuracy increased from 53.51% to 54.56%. In contrast, when the SCP module is used to represent the relative spatial position relationship between each OCR text in the image, the accuracy of SaL is increased from 53.51% to 55.95%.
| # | Model | Method | Val Acc. (%) |
|---|---|---|---|
| 1 | Baseline | - | 57.98 |
| 2 | Baseline | Tag | 59.74 |
| 3 | Baseline | Index | 60.07 |
| 4 | Baseline | TSS | 61.55 |
4.3.4. Different OCR Text Separation Methods
This subsection studies the effect of different OCR text separation methods. We implement two method variants: Tag and Index. Tag add ¡context¿ and OCR visual feature to the last token of every OCR text in the image to distinguish each OCR text instead of separating possible phrases in OCR texts. As for Index, it separates each OCR text by directly shifting its position id for 1-D position encoding instead of inserting ¡context¿. The Tag variant provides the model with an embedding that learns the context between OCR texts, and the Index variant tells the model that the distance between different OCR texts should be appropriately distanced. As shown in Table 6, both variants improve the performance, which further emphasizes our motivation of separating OCR texts. Compared with these variants, Our TSS achieves the best performance, indicating its superiority, as our TSS can satisfy the goals of both variants.
4.4. Visualization
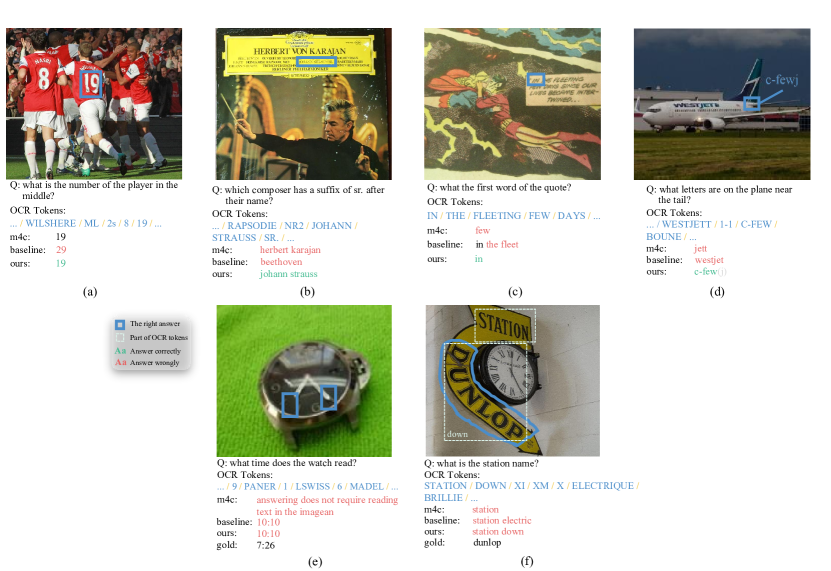
To further verify the effectiveness of our method, we illustrate some visual cases from the TextVQA validation set. As shown in Figure 4 (a), since neither the m4c model nor the baseline model considers whether the OCR text has semantic relevance, OCR texts are directly processed as a sentence. Therefore, the m4c model and the baseline take the text “fine food & spirits” belonging to the same line as the answer. With the help of the TSS module, our model learned whether there is a semantic relationship between each OCR text, and gave the correct answer ‘fine food’. It can be seen from Figure 4 (c, d) that for images with multiple OCR texts, our model can better model the spatial position relationship between them, and get the correct answer based on reasoning. Specifically, in Figure 4(c), the spatial position relationship between ‘32’ and ‘NO’ is closer, and the baseline uses ‘30’ as the answer as it is closer to ‘NO’ according to the reading order. Figure 4 (b) can better reflect the role of our TSS module and SCP module. It can be seen that the baseline model directly stitches “dr. dr. dr. er’s affer” together as the answer in accordance with the reading order, while our model takes the text into account semantics and the spatial positional relationship between OCR texts to give the correct answer. More qualitative examples and error cases can find out in Appendix C.
5. Conclusion
For the TextVQA community, we proved that the previous works are unreasonable for OCR text processing. Previous works added noise to the reasoning process of the model by forcibly splicing all OCR texts into a sentence. Our proposed Text Semantic Separate module effectively separates different OCR texts and enables the model to learn whether there is a semantic context relationship between different OCR texts. In addition, the spatial position relationship of OCR text is very important for the model to understand the spatial relationship of OCR text in different positions in the image. But the 1-D position embedding used in previous work cannot reasonably express this relationship. The Spatial Circle Position module we proposed can better reflect the spatial position relationship between each OCR text and other OCR texts in the image. It can make the model more accurately locate the position of the OCR text in the image. With these two modules, our proposed SaL model achieves SOTA performance on TextVQA and ST-VQA datasets without any pretraining tasks. Finally, we call on the community to rethink how to use the text information in the scene more reasonably.
References
- (1)
- Alberti et al. (2019) Chris Alberti, Jeffrey Ling, Michael Collins, and David Reitter. 2019. Fusion of detected objects in text for visual question answering. In EMNLP-IJCNLP. 2131–2140.
- Antol et al. (2015) Stanislaw Antol, Aishwarya Agrawal, Jiasen Lu, Margaret Mitchell, Dhruv Batra, C Lawrence Zitnick, and Devi Parikh. 2015. Vqa: Visual question answering. In ICCV. 2425–2433.
- Bigham et al. (2010) Jeffrey P. Bigham, Chandrika Jayant, Hanjie Ji, Greg Little, Andrew Miller, Robert C. Miller, Aubrey Tatarowicz, Brandyn White, Samuel White, and Tom Yeh. 2010. VizWiz: nearly real-time answers to visual questions. In W4A. 24.
- Biten et al. (2022) Ali Furkan Biten, Ron Litman, Yusheng Xie, Srikar Appalaraju, and R Manmatha. 2022. Latr: Layout-aware transformer for scene-text vqa. In CVPR. 16548–16558.
- Biten et al. (2019) Ali Furkan Biten, Ruben Tito, Andres Mafla, Lluis Gomez, Marçal Rusinol, Ernest Valveny, CV Jawahar, and Dimosthenis Karatzas. 2019. Scene text visual question answering. In ICCV. 4291–4301.
- Borisyuk et al. (2018) Fedor Borisyuk, Albert Gordo, and Viswanath Sivakumar. 2018. Rosetta: Large scale system for text detection and recognition in images. In ACM SIGKDD. 71–79.
- Deng et al. (2009) Jia Deng, Wei Dong, Richard Socher, Li-Jia Li, Kai Li, and Fei-Fei Li. 2009. ImageNet: A large-scale hierarchical image database. In CVPR. 248–255.
- Devlin et al. (2019) Jacob Devlin, Ming-Wei Chang, Kenton Lee, and Kristina Toutanova. 2019. Bert: Pre-training of deep bidirectional transformers for language understanding. In NAACL.
- Dosovitskiy et al. (2020) Alexey Dosovitskiy, Lucas Beyer, Alexander Kolesnikov, Dirk Weissenborn, Xiaohua Zhai, Thomas Unterthiner, Mostafa Dehghani, Matthias Minderer, Georg Heigold, Sylvain Gelly, et al. 2020. An image is worth 16x16 words: Transformers for image recognition at scale. ICLR (2020).
- Fang et al. (2022) Chengyang Fang, Gangyan Zeng, Yu Zhou, Daiqing Wu, Can Ma, Dayong Hu, and Weiping Wang. 2022. Towards Escaping from Language Bias and OCR Error: Semantics-Centered Text Visual Question Answering. In ICME. IEEE, 01–06.
- Gao et al. (2020) Chenyu Gao, Qi Zhu, Peng Wang, Hui Li, Yuliang Liu, Anton van den Hengel, and Qi Wu. 2020. Structured Multimodal Attentions for TextVQA. CoRR abs/2006.00753 (2020).
- Han et al. (2020) Wei Han, Hantao Huang, and Tao Han. 2020. Finding the evidence: Localization-aware answer prediction for text visual question answering. In COLING. 3118–3131.
- Hu et al. (2020) Ronghang Hu, Amanpreet Singh, Trevor Darrell, and Marcus Rohrbach. 2020. Iterative answer prediction with pointer-augmented multimodal transformers for textvqa. In CVPR. 9992–10002.
- Jin et al. (2022) Zan-Xia Jin, Mike Zheng Shou, Fang Zhou, Satoshi Tsutsui, Jingyan Qin, and Xu-Cheng Yin. 2022. From Token to Word: OCR Token Evolution via Contrastive Learning and Semantic Matching for Text-VQA. In ACMMM. 4564–4572.
- Kant et al. (2020) Yash Kant, Dhruv Batra, Peter Anderson, Alex Schwing, Devi Parikh, Jiasen Lu, and Harsh Agrawal. 2020. Spatially aware multimodal transformers for textvqa. In ECCV. 715–732.
- Karatzas et al. (2015) Dimosthenis Karatzas, Lluis Gomez-Bigorda, Anguelos Nicolaou, Suman Ghosh, Andrew Bagdanov, Masakazu Iwamura, Jiri Matas, Lukas Neumann, Vijay Ramaseshan Chandrasekhar, Shijian Lu, et al. 2015. ICDAR 2015 competition on robust reading. In ICDAR. 1156–1160.
- Karatzas et al. (2013) Dimosthenis Karatzas, Faisal Shafait, Seiichi Uchida, Masakazu Iwamura, Lluis Gomez i Bigorda, Sergi Robles Mestre, Joan Mas, David Fernández Mota, Jon Almazán, and Lluís-Pere de las Heras. 2013. ICDAR 2013 Robust Reading Competition. In ICDAR. 1484–1493.
- Kil et al. (2022) Jihyung Kil, Soravit Changpinyo, Xi Chen, Hexiang Hu, Sebastian Goodman, Wei-Lun Chao, and Radu Soricut. 2022. PreSTU: Pre-training for scene-text understanding. arXiv preprint arXiv:2209.05534 (2022).
- Krishna et al. (2017) Ranjay Krishna, Yuke Zhu, Oliver Groth, Justin Johnson, Kenji Hata, Joshua Kravitz, Stephanie Chen, Yannis Kalantidis, Li-Jia Li, David A. Shamma, Michael S. Bernstein, and Li Fei-Fei. 2017. Visual Genome: Connecting Language and Vision Using Crowdsourced Dense Image Annotations. IJCV (2017), 32–73.
- Kuznetsova et al. (2020) Alina Kuznetsova, Hassan Rom, Neil Alldrin, Jasper Uijlings, Ivan Krasin, Jordi Pont-Tuset, Shahab Kamali, Stefan Popov, Matteo Malloci, Alexander Kolesnikov, et al. 2020. The open images dataset v4: Unified image classification, object detection, and visual relationship detection at scale. IJCV 128, 7 (2020), 1956–1981.
- Liu et al. (2020) Fen Liu, Guanghui Xu, Qi Wu, Qing Du, Wei Jia, and Mingkui Tan. 2020. Cascade Reasoning Network for Text-based Visual Question Answering. In ACM MM. 4060–4069.
- Lu et al. (2021) Xiaopeng Lu, Zhen Fan, Yansen Wang, Jean Oh, and Carolyn P Rosé. 2021. Localize, group, and select: Boosting text-vqa by scene text modeling. In ICCV. 2631–2639.
- Maor (2019) Eli Maor. 2019. The Pythagorean theorem: a 4,000-year history. Vol. 65. Princeton University Press.
- Mishra et al. (2013) Anand Mishra, Karteek Alahari, and C. V. Jawahar. 2013. Image Retrieval Using Textual Cues. In ICCV. 3040–3047. https://doi.org/10.1109/ICCV.2013.378
- Mishra et al. (2019) Anand Mishra, Shashank Shekhar, Ajeet Kumar Singh, and Anirban Chakraborty. 2019. Ocr-vqa: Visual question answering by reading text in images. In ICDAR. 947–952.
- Raffel et al. (2020) Colin Raffel, Noam Shazeer, Adam Roberts, Katherine Lee, Sharan Narang, Michael Matena, Yanqi Zhou, Wei Li, and Peter J Liu. 2020. Exploring the limits of transfer learning with a unified text-to-text transformer. JMLR 21, 1 (2020), 5485–5551.
- Ramachandran et al. (2019) Prajit Ramachandran, Niki Parmar, Ashish Vaswani, Irwan Bello, Anselm Levskaya, and Jon Shlens. 2019. Studying Stand-Alone Self-Attention in Vision Models. NeurIPS (2019).
- Shaw et al. (2018) Peter Shaw, Jakob Uszkoreit, and Ashish Vaswani. 2018. Self-attention with relative position representations. NAACL (2018).
- Singh et al. (2019) Amanpreet Singh, Vivek Natarajan, Meet Shah, Yu Jiang, Xinlei Chen, Dhruv Batra, Devi Parikh, and Marcus Rohrbach. 2019. Towards vqa models that can read. In CVPR. 8317–8326.
- Singh et al. (2021) Amanpreet Singh, Guan Pang, Mandy Toh, Jing Huang, Wojciech Galuba, and Tal Hassner. 2021. Textocr: Towards large-scale end-to-end reasoning for arbitrary-shaped scene text. In CVPR. 8802–8812.
- Vaswani et al. (2017) Ashish Vaswani, Noam Shazeer, Niki Parmar, Jakob Uszkoreit, Llion Jones, Aidan N Gomez, Lukasz Kaiser, and Illia Polosukhin. 2017. Attention is all you need. In NeurIPS. 5998–6008.
- Veit et al. (2016) Andreas Veit, Tomas Matera, Lukas Neumann, Jiri Matas, and Serge J. Belongie. 2016. COCO-Text: Dataset and Benchmark for Text Detection and Recognition in Natural Images. CoRR abs/1601.07140 (2016).
- Wang et al. (2022) Jun Wang, Mingfei Gao, Yuqian Hu, Ramprasaath R Selvaraju, Chetan Ramaiah, Ran Xu, Joseph F JaJa, and Larry S Davis. 2022. TAG: Boosting Text-VQA via Text-aware Visual Question-answer Generation. BMVC (2022).
- Wang et al. (2020) Xinyu Wang, Yuliang Liu, Chunhua Shen, Chun Chet Ng, Canjie Luo, Lianwen Jin, Chee Seng Chan, Anton van den Hengel, and Liangwei Wang. 2020. On the general value of evidence, and bilingual scene-text visual question answering. In CVPR. 10126–10135.
- Yang et al. (2021) Zhengyuan Yang, Yijuan Lu, Jianfeng Wang, Xi Yin, Dinei Florencio, Lijuan Wang, Cha Zhang, Lei Zhang, and Jiebo Luo. 2021. Tap: Text-aware pre-training for text-vqa and text-caption. In CVPR. 8751–8761.
- Zeng et al. (2021) Gangyan Zeng, Yuan Zhang, Yu Zhou, and Xiaomeng Yang. 2021. Beyond ocr+ vqa: involving ocr into the flow for robust and accurate textvqa. In ACMMM. 376–385.
Appendix A More Implementation Details
In this section, we summarize the implementation and hyper-parameter settings of the model designed in our work. All experiments are based on PyTorch deep-learning framework.
SaL consists of three main components: multimodal inputs, a multi-layer transformer encoder, and a multi-layer transformer decoder. During training, the answer words are iteratively predicted and supervised using teacher-forcing. We apply multi-label sigmoid loss over the T5 tokenizer vocabulary score. We list the network and optimization parameters of SaL in Table 7 and Table 8 respectively.
| Network parameters | Value |
|---|---|
| Maximum question tokens | 45 |
| Maximum OCR tokens | 350 |
| Maximum object tokens | 250 |
| Text Faster R-CNN feature dimension | 2048 |
| Object Faster R-CNN feature dimension | 2048 |
| Joint embedding dimension | 768 |
| Transformer encoder layers | 12 |
| Transformer decoder layers | 12 |
| Transformer attention heads | 12 |
| Maximum decoding steps | 25 |
| Optimization parameters | Value |
|---|---|
| Optimizer | Adam |
| Base learning rate | 2e-4 |
| Learning rate decay | 0.1 |
| Warm-up iterations | 1000 |
| Warm-up learning rate factor | 0.2 |
| Batch size | 36 |
| Max iterations | 24000 |
| Learning rate decay steps | 14000, 19000 |
| Train Set | Val Set | ||||
|---|---|---|---|---|---|
| Model | Dataset | Len. | Num | Ratio | Acc. |
| 3 | 324,963 | 0.939 | 64.50 | ||
| TextVQA | 3 | 21,057 | 0.061 | 51.71 | |
| 3 | 549,373 | 0.946 | 65.26 | ||
| Both | 3 | 31,107 | 0.054 | 49.17 | |
| 3 | 224,410 | 0.957 | 62.27 | ||
| ST-VQA | 3 | 10,050 | 0.043 | 38.20 | |
| 3 | 549,373 | 0.946 | 64.67 | ||
| SaL-large | Both | 3 | 31,107 | 0.054 | 46.67 |
Appendix B Why the performance is different on TextVQA and ST-VQA?
As for the observation of different improvement ranges on TextVQA and ST-VQA when SaL is jointly finetuned on them, we analyzed the accuracy of answers of different lengths in the two datasets to explain this phenomenon. From Table 9, we can see that in TextVQA and ST-VQA, the number of answers with lengths greater than 3 is far less than the number of answers with lengths less than or equal to 3. This makes the model tend to predict an answer with a length less than or equal to 3 and predict answers with smaller lengths more accurately. We can see that the ratio of answers with lengths of less than 3 to all answers in TextVQA is 0.939, and it reaches 0.957 in ST-VQA. This bias triggers the larger difference between the accuracy of different-length answers in ST-VQA than in TextVQA (62.27% vs 38.20% and 64.50% vs 51.71%).
When jointly finetuning on both TextVQA and ST-VQA, it can be observed from Table 9 that the proportion of answers with lengths greater than or equal to 3 becomes 0.946. This is a higher rate than in TextVQA but lower than that in ST-VQA. This means that the joint training makes the bias in TextVQA more severe but alleviates the bias in the ST-VQA. Therefore, the accuracy of the answers of different lengths in the ST-VQA validation set has been improved and the gap in the accuracy of answers of different lengths has become smaller. However, in TextVQA, the accuracy of the validation set decreases on answers with lengths greater than 3, and the accuracy gap between answers of different lengths becomes larger. This makes the performance improvement of the TextVQA validation set smaller than that of the ST-VQA validation set when jointly finetuning on both datasets.
Appendix C More Visualization Examples
We provide more qualitative examples in Figure 5 to support our claim in the paper. There are still some failure cases (Figure 5) in our experiments, which are extremely challenging.
In (a), our baseline model cannot accurately locate the correct OCR text in the image because the relative spatial relationship between each text and other text in the image is not constructed. However, our SaL model can accurately locate the correct OCR text in the middle of the image that is relevant to the question with the help of the SCP module. In (d), M4C and our baseline model tend to choose the prominent text in the image as the answer. SaL could construct the spatial position relation of OCR texts in the image and predict the right answer according to the position relation word in the question.
All the previous models did not take into account that most of the OCR texts in the image do not have a semantic relationship, and all the OCR texts are forcibly spliced into sentences. In (b) and (c), m4c could not answer the question about a complex image with quantities of OCR texts. Our baseline model tends to predict an answer without considering the semantic relation with words in the question and image. Our TSS module separates different OCR texts and then lets the model learn whether there is a semantic relationship between different OCR texts, which greatly reduces the noise in the previous method.So even in the face of complex questions and images, SaL can answer questions very well.
However, as shown in (e), facing the problem of time, since the OCR system is difficult to identify the correct time, the input of the model does not have the correct time text information. It is difficult for our model to choose the correct answer from a huge vocabulary just based on the direction of the clock in the image. Figure 5(e) is an interesting example, although our predicted answer is wrong because the OCR system misrecognized ‘dunlop’ as ‘down’. But we were pleasantly surprised to find that SaL can judge that the two texts ‘station’ and ‘dunlop’ attached to the same material in different directions are closely related. This is not only due to the fact that SCP provides the model with the spatial relationship between different texts but also the semantic correlation between texts learned by TSS.