[table]captionskip=0pt
A Mathematical Framework for Citation Disruption††thanks: We thank the National Science Foundation for financial support of work related to this project (grants 1829168, 1932596, and 1829302).
Abstract
Many theories of scientific and technological progress imagine science as an iterative, developmental process periodically interrupted by innovations which disrupt and restructure the status quo. Due to the immense societal value created by these disruptive scientific and technological innovations, accurately operationalizing this perspective into quantifiable terms represents a key challenge for researchers seeking to understand the history and mechanisms underlying scientific and technological progress. Researchers in this area have recently proposed a number of quantitative measures that seek to quantify the extent to which works in science and technology are disruptive with respect to their scientific context. While these disruption measures show promise in their ability to quantify potentially disruptive works of science and technology, their definitions are bespoke to the science of science and lack a broader theoretical framework, obscuring their interrelationships and limiting their adoption within broader network science paradigms. We propose a mathematical framework for conceptualizing and measuring disruptive scientific contributions within citation networks through the lens of network centrality, and formally relate the CD Index disruption measure and its variants to betweenness centrality. By reinterpreting disruption through the lens of centrality, we unify a number of existing citation-based disruption measures while simultaneously providing natural generalizations which enjoy empirical and computational efficiencies. We validate these theoretical observations by computing a variety of disruption measures on real citation data and find that computing these centrality-based disruption measures over ego networks of increasing radius results in better discernment of future award-winning scientific innovations relative to conventional disruption metrics which rely on local citation context alone. This work extends the theoretical foundations and potential applications of citation disruption measures and clarifies the relationship to other notions of scholarly importance, highlighting fruitful connections between bibliometrics and network science.
Introduction
Scientific and technological knowledge is characterized by its dynamic nature, constantly evolving through the contributions of scientists and inventors (Popper, 2005; Mokyr, 1992; Arthur, 2009; Fleck, 2012; Arthur, 2007; Mokyr, 1992). This evolution is driven by a combination of developmental improvements and disruptive breakthroughs, which shape the trajectory of progress in science and technology. The Kuhnian view of scientific and technological progress imagines science as an iterative process, developing incrementally through time, periodically interrupted by periods of revolution, wherein major paradigm shifts disrupt the accepted principles beheld by the preceding “normal” regime (Kuhn, 1962). In a similar vein, the “creative destruction” theory of economic innovation, popularized by Schumpeter, posits that industrial progress is driven by the incessant destruction of old technologies by the new (Schumpeter, 1942). From general relativity to penicillin, DNA to the internet, artifacts of this revolutionary potential of science continuously restructure society and our shared understanding of the universe. Due to the immense societal value created by these disruptive scientific and technological innovations, accurately operationalizing this perspective into quantifiable terms represents a key challenge for researchers seeking to understand the history and mechanisms underlying scientific and technological progress (Fortunato et al., 2018).
Recently, a number of promising network-theoretic measurements of such scientific and technological disruption have emerged towards this goal (Funk and Owen-Smith, 2017; Bornmann et al., 2020b; Leydesdorff et al., 2021). Buoyed by the advent of massive, electronic bibliometric datasets, these disruption measures operationalize the revolutionary interpretation of scientific progress by evaluating the extent to which particular works of science or technology restructure their local knowledge niche, as defined by their relationship to their neighborhood within a citation network. These disruption measures have shown promise in their ability to pick out scientific and technological works that are interpreted as paradigm-shifting (Bornmann et al., 2020a) while remaining distinct from citation count, a widely-acknowledge–but sometimes flawed (Bornmann and Daniel, 2008)–indicator of innovative value. These disruption measures have received wide adoption within the field of science and innovation studies, and have begun to appear as dependent variables in a number of metascientific analyses measuring the differences in scientific achievement with respect to team size (Wu et al., 2019), the effects of topical disagreements on scientific output (Lin et al., 2022), and the observed slowing pace of scientific disruption altogether (Park et al., 2023).
Despite this empirical success, these disruption measures are largely lacking in a robust mathematical foundation. Their definitions typically rely on counts of papers within bespoke constructions of network neighborhoods and are heavily dependent on their citation network context. This lack of mathematical formalism hides the relationships among competing measures of citation disruption, limits the wider application of these disruption measures to other non-bibliometric network-theoretic domains, hinders the development of more extensive models of scientific innovation, and obscures their position within the broader network social science paradigm Borgatti et al. (2009).
In this work, we bridge this theoretical gap by providing a mathematical framework for the definition of citation disruption via network centrality. Specifically, we re-conceptualize a popular measure of citation disruption, the CD Index (Funk and Owen-Smith, 2017), as a measure of betweenness centrality, a well-studied concept in network science that seeks to measure the “importance” of nodes within a network as a function of the proportion of shortest paths passing through each node (Anthonisse, 1971; Freeman, 1977). In addition, we show that this centrality framework for measuring scientific and technological disruption is both flexible enough to express many of the objectives sought by a citation-based disruption measure while also recovering existing disruption measures like citation count and variants of the CD Index (Funk and Owen-Smith, 2017; Leydesdorff et al., 2021; Bu et al., 2021; Leibel and Bornmann, 2023) as special cases. The relationship between citation disruption and other frequently-used measures of scholarly importance becomes clear under this network-theoretic reframing, thereby broadening the relevance of disruption measurement to other network science domains and vice versa.
In addition to unifying a number of existing disruption measures, this centrality definition of disruption also points towards natural extensions to existing disruption measures which are better aligned with their theoretical motivations and more robust to the noisiness of real-world citation patterns. We verify the empirical potential of these extensions by observing that they are more discerning of award-winning scientific and technological innovations compared to other disruption measures, like the CD Index, or citation count.
Measuring Disruption
Foundational theories of scientific and technological change highlight the existence of two types of breakthroughs (Kuhn, 1962; Schumpeter, 1942; Dosi, 1982). The first type consists of contributions that enhance and refine existing streams of knowledge, thereby consolidating the status quo (Enos, 1958; David, 1990; Rosenberg, 1982). These developmental improvements build upon established theories and methodologies, refining them for greater accuracy, efficiency, or applicability, thereby making them more valuable (Enos, 1962). The second type of breakthroughs challenge and disrupt existing knowledge, rendering it obsolete and propelling science and technology in new and unforeseen directions (Tushman and Anderson, 1986). These breakthroughs have the potential to revolutionize entire fields, opening up new avenues of inquiry and application. By embracing both types of breakthroughs, the scientific and technological community continually pushes the boundaries of what is known and reshapes our understanding of the world, paving the way for transformative advancements and discoveries.
Citation Networks
Given the abstract and multifaceted nature of scientific and technological knowledge, precisely measuring and quantifying the distinction between developmental and disruptive intellectual contributions poses a significant challenge. However, large-scale bibliometric data, particularly in the form of published scientific papers and patented technologies, offer a valuable context within which to begin making such quantifications (Price, 1963; Jaffe and Trajtenberg, 2002). The vast body of scientific literature and patent records provides a wealth of information that enables researchers to analyze and trace the evolution of ideas, concepts, and technologies (Liu et al., 2023; Wang and Barabási, 2021). Papers and patents not only present novel ideas but also make citations to prior works, thereby establishing a conceptual genealogy. Analysis of the evolution of citation networks therefore enables tracing of the influence and impact of specific contributions, discernment of patterns of continuity and transformation, and consequently, one approach for the identification of disruptive breakthroughs. While acknowledging the inherent complexities (Bornmann and Marx, 2015; Tahamtan and Bornmann, 2019, 2018; Bornmann, 2020; Waltman, 2016), leveraging bibliometric data in the study of scientific and technological evolution provides valuable insights into the dynamics of knowledge advancement and facilitates a more nuanced understanding of the disruptive forces driving innovation (Wu et al., 2019; Figueiredo and Andrade, 2019; Andrade et al., 2020; Azoulay et al., 2019; Leahey et al., 2023; Zeng et al., 2021; Chu and Evans, 2021; Wang and Barabási, 2021; Wang et al., 2023).
We define these citation networks as follows.
Definition 1.
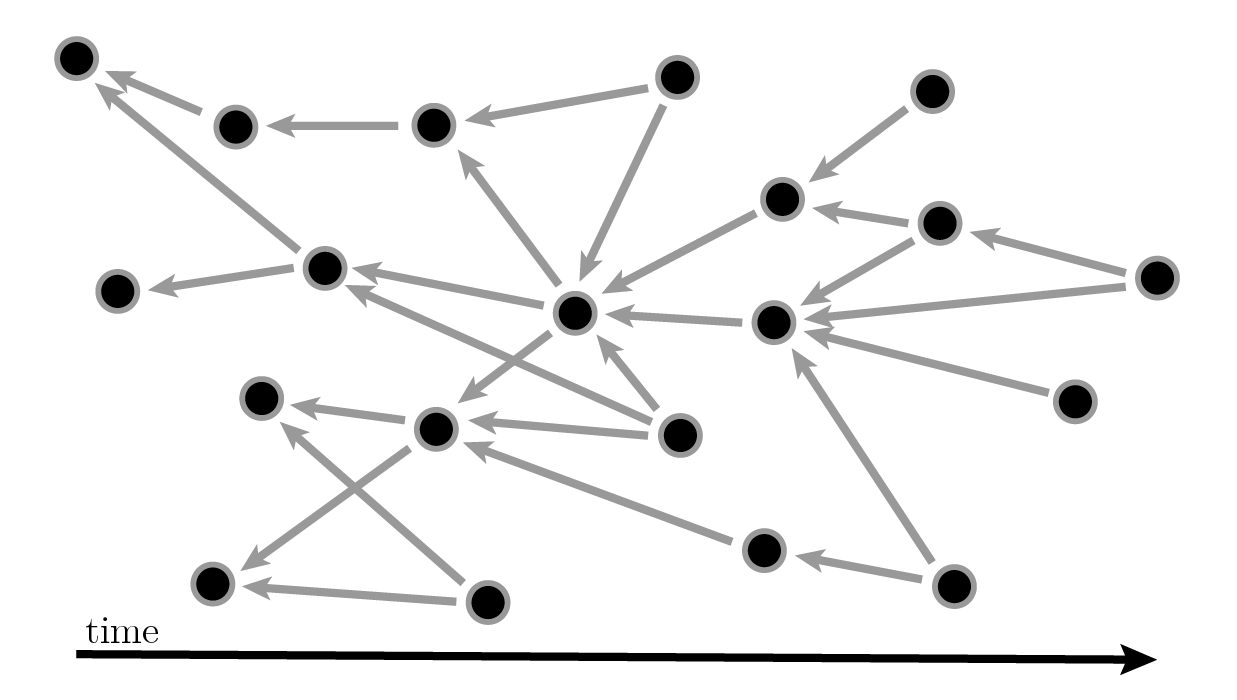
Given a collection of papers , a citation network is a directed, unweighted graph formed by directed edges connecting directed towards if paper cites paper .
Here we have used “papers” as shorthand to refer to any attributed scientific or technological work which may be situated within a citation network (academic publications, books, patents, etc.). We will continue to use this nomenclature in the following sections though the results extend to any corpus of work which engages in attribution. Under some minor assumptions, we can view as acyclic, with the directedness of edges describing an implicit temporal ordering of papers, such that the existence of edge implies paper was published before paper . It will sometimes be convenient to overload notation and write or to refer to the set of nodes or set of edges, respectively, of graph .
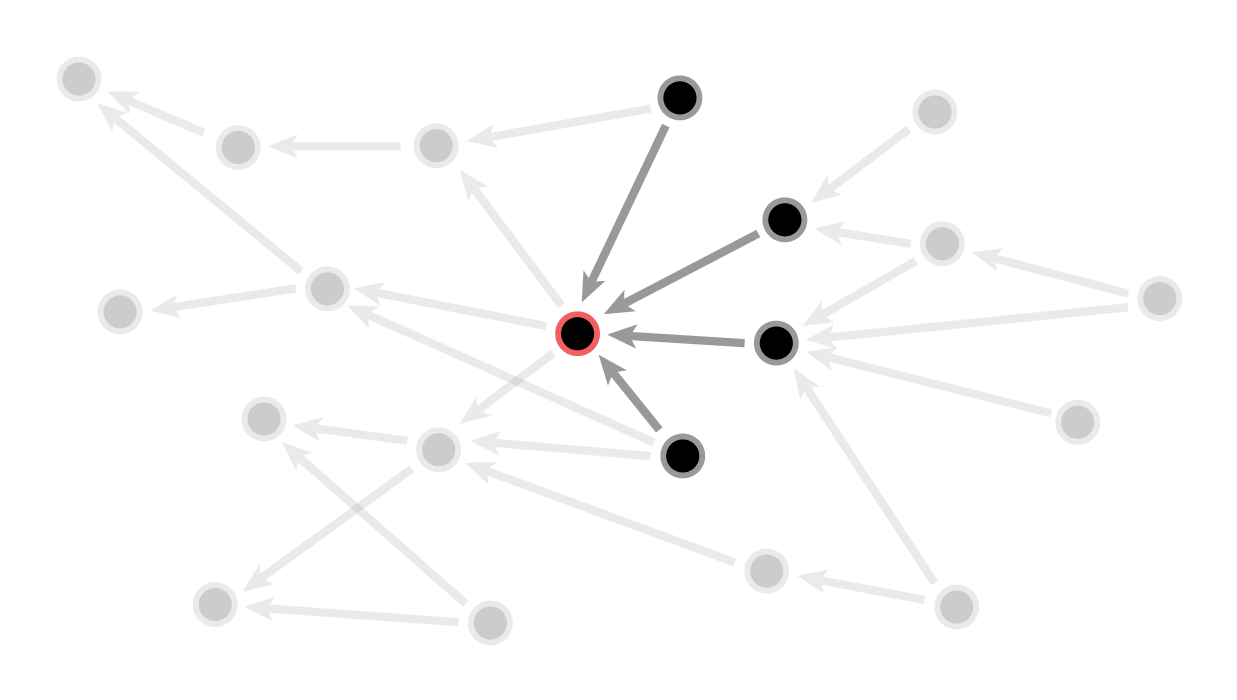
Note that each paper induces a (possibly trivial) subgraph of papers composed of edges recording ’s citations to prior work . This subgraph represents paper ’s approximation of how the concepts and ideas presented in relate to or are otherwise inspired by the cited collection of prior work . Conversely, also induces a (possibly trivial) subgraph composed of edges which connect each paper citing to . The set may be interpreted as the collection of papers that were directly impacted by or otherwise derived ideas from paper specifically.
Properties of Disruption Measures
The definition and measurement of disruption within citation networks necessitate an examination of how intellectual contributions alter the value of prior streams of knowledge upon which they build (Funk and Owen-Smith, 2017; Park et al., 2023). At the core of the notion of disruption lies the transformative effect that contributions have on these streams, simultaneously propelling them in new directions while breaking with the past, resulting in a decrease in the use of preceding works. Conversely, developmental contributions enhance the value and utility of previous work, increasing its usage. Therefore, a quantitative measure of disruption should primarily focus on characterizing whether and how a paper alters the use of its predecessors. Within the context of citation networks, this can be accomplished by evaluating the degree by which future works cite the prior works referenced by a focal paper.
Beyond this fundamental requirement, we further suggest that such a measure should account for the intricate interconnectedness of scientific and technological knowledge, acknowledging the potential for both direct and indirect influences of a particular work. Specifically, it should be capable of characterizing neighborhoods of influence of varying sizes, capturing the nuanced cascading effects on subsequent scientific and technological development. Further, while theories of scientific and technological change often discuss disruption in categorical or binary terms, it is more appropriate to consider disruptiveness as a measure of degree (Funk and Owen-Smith, 2017). Some works fully eclipse the prior streams of work upon which they build, while others cast more partial shadows. Therefore, an ideal measure should exhibit a continuous nature, allowing for the quantification of these gradations.
In summary, given a citation network , we seek to derive a disruption measure which captures the extent to which paper is disruptive with respect to the rest of . Specifically, we seek a function , dependent on , which
-
1.
respects the temporal ordering of ,
-
2.
measures the degree by which future works cite the prior works referenced by a focal paper,
-
3.
is sensitive to direct and indirect influence on future works,
-
4.
is continuous with respect to the disruptive effects measured.
We will refer back to these properties of disruption measures in the next section when we introduce network centrality, observing that many centrality measures happen to satisfy these requirements.
Measuring Disruption with Network Centrality
While there are no precise boundaries for its definition within network science, we define centrality as a class of functions defined on networks which measure the structural or informational “importance” of nodes within the network. Network centrality has a storied history within the social sciences, with the earliest application of this concept, closeness centrality, appearing at least as early as 1950 as an inverse measure of average distance to each node in the graph for use in evaluating communication efficiency in problem solving across different social group topologies (Bavelas, 1950). Since then, the number and variety of centrality measures have grown substantially (Newman, 2018). This growth is due to the fact that the notion of importance is highly context-dependent: importance in a social network may differ from that of a biophysical network, and different still from that a transportation network.111See Landherr et al. (2010) for a review of centrality in social networks, Ghasemi et al. (2014) for usage of centrality in biological networks, and and Chapter 7 Newman (2018) for a general introduction to some well-known centrality measures. Bloch et al. (2023) propose taxonomy of centrality measures.
In this section, we provide an introduction to some well-known centrality measures and observe that all of the desired properties of a disruption measure discussed in Section 2 can be satisfied by both betweenness and Pagerank centrality.
Degree Centrality
The degree centrality of a node measures its number of incident edges. Over directed graphs, degree centrality subdivides into out-degree and in-degree centrality, depending on the orientation of the nodes incident edges. The latter of these centrality measures is relevant for our uses, so we provide a proper definition.
Definition 2.
Given a directed graph , define the in-neighborhood of node with node set and edge set . The in-degree centrality of node is given by .
Evaluated over a citation network , in-degree centrality satisfies disruption Properties 1 and 4, as the directedness of reflects the temporal publication order of papers and may be arbitrarily large, respectively. However, does not satisfy Properties 2 and 3 due to its focus only on the citing works of focal node .
Betweenness Centrality
Betweenness centrality (Anthonisse, 1971; Freeman, 1977) measures the importance of a node in a network by counting the proportion of shortest paths between each pair of vertices in the graph which pass through .
Definition 3.
The betweenness centrality of a node within a graph is given by
where is the number of shortest paths between nodes and in , is the number of shortest paths originating at node and terminating at which pass through , and is a normalization constant.
Evaluated over citation network , betweenness centrality satisfies all of the disruption Properties listed in Section 2. Because is a relative count of shortest paths from arbitrary nodes across a temporally-ordered citation network, if acts as a bottleneck in the citation network, requiring its visitation along a shortest path between future and past works of paper , its betweeenness centrality will be high. By contrast, if the cited works of are frequently cited by future works of , its betweenness will be low, as there are multiple shortest paths from future to past work which route around .
Using each node’s inclusion in shortest paths as the measurement of “importance” endows the betweenness centrality measure of disruption with particular semantics. This geodesic betweenness condition implies that if any path between nodes and is shorter than the shortest path between and passing through , then does not inherit any “importance” with respect to those pairs of nodes. One can imagine relaxing these austere flow constraints such that if a the path(s) between and through are “close” to being important, then still inherits some centrality from this relationship. Pagerank centrality represents one such relaxation by replacing the shortest path betweenness measure with a visitation probability determined by a random walk.
Pagerank Centrality
Pagerank centrality (Page et al., 1998) reinterprets the directed graph with adjacency matrix as a Markov chain with transition probabilities , where is a diagonal matrix of node out-degrees and is a vector of ’s. Pagerank assigns centrality based on the stationary distribution of a random walk on this Markov chain. Dangling nodes in which have zero out-degree eventually capture all probability mass, and thus trivialize the long-run random walk dynamics. To combat this behavior, we connect these dangling nodes to other non-dangling nodes in the graph according to probability vector , resulting in a new stochastic matrix .
Definition 4.
Given directed graph with stochastic transition matrix determined by personalization vector and teleportation probability , the personalized Pagerank centrality of node is given by where is the solution to the eigenvalue problem
| (1) |
When , we recover the original Pagerank algorithm which assigns equal teleportation probability between each pair of nodes in the network.
Equation 1 solves for the stationary distribution of a random walk on which teleports to new nodes with probability . Thus, measured over citation network , we may interpret as measuring the likelihood a random walker moving backwards through time along paper citations passes through node (Properties 1, 4). If paper is highly-cited or is cited by a number of highly-cited papers, will be high because has many opportunities to be visited along a random walk (Properties 2, 3). Thus, we may interpret as a disruption measure in the sense that papers with high Pagerank will be those which will be most likely traversed when walking the citation network between present and past works. Under this interpretation, we see Pagerank satisfies all four properties of a disruption measure given in Section 2.
Existing Disruption Measures are Centrality Measures
We will now show that many of the measures already in use for quantifying scientific and technological disruption on citation networks may be rewritten as specific instances of the well-known centrality measures given in the previous section. In particular, we show that citation count and in-degree centrality are interchangeable, and that the CD Index is a shifted version of betweenness centrality evaluated over a bespoke neighborhood graph around each node in the network.
Citation Count
Citation count is a ubiquitous measure of scientific and technological impact that records the number of times an individual paper has been cited. Embedded in a citation network , citation count and in-degree centrality are equivalent. This equivalence implies citation count fails to satisfy Properties 2 and 3 given in Section 2.
The CD Index
The CD Index (Funk and Owen-Smith, 2017) is a citation-based measure of the “disruptive” effect that a scientific work introduces with respect to its topic-specific context within a citation network. This topic context of is typically proxied by observing the citation patterns of a neighborhood around within the broader citation graph. The CD Index, then, is a measure over the possible configurations of the citation neighborhood , assigning higher values to which have high “importance” to the connectivity of and low values to those with relatively low “importance” within .
A number of distinct disruption measures have been introduced under the “CD Index” moniker (Funk and Owen-Smith, 2017; Bornmann et al., 2020a; Wang et al., 2023; Leydesdorff et al., 2021; Chen et al., 2021; Li and Chen, 2022; Deng and Zeng, 2023; Wu and Yan, 2019). We will narrow our focus to two closely related definitions of the CD Index, which we denote and , introduced in Funk and Owen-Smith (2017) and Bornmann et al. (2020a), respectively.
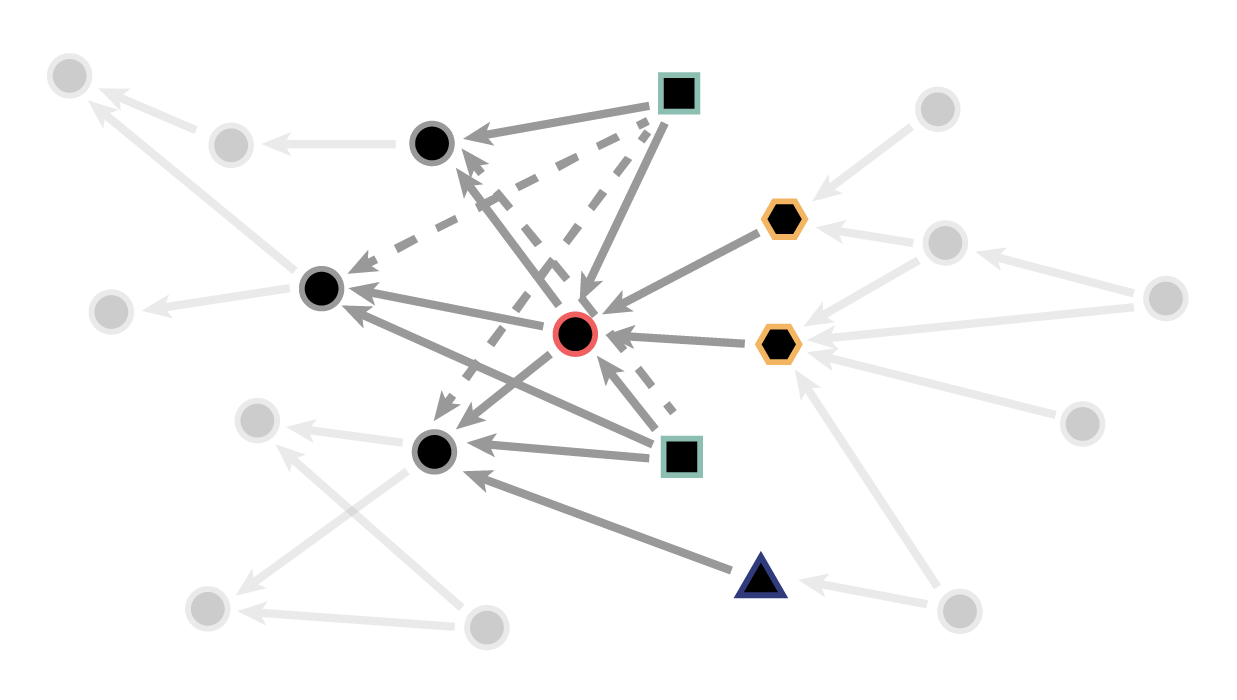
The definition of the CD Index relies on the construction of a bespoke neighborhood subgraph around node . This neighborhood subgraph forms the basis of the CD Index and is given by the following union of graphs:
Definition 5.
Given an ambient citation graph , the CD Index neighborhood of node is defined by
| (2) |
where
is the subgraph composed of the union of in-citations for each node in the out-citation subgraph of .

We can equivalently define Equation 2 in terms of its vertex and edge sets:
Removing this term from the graph union, we can define the the “no-” neighborhood subgraph centered at as the following vertex and edge sets:
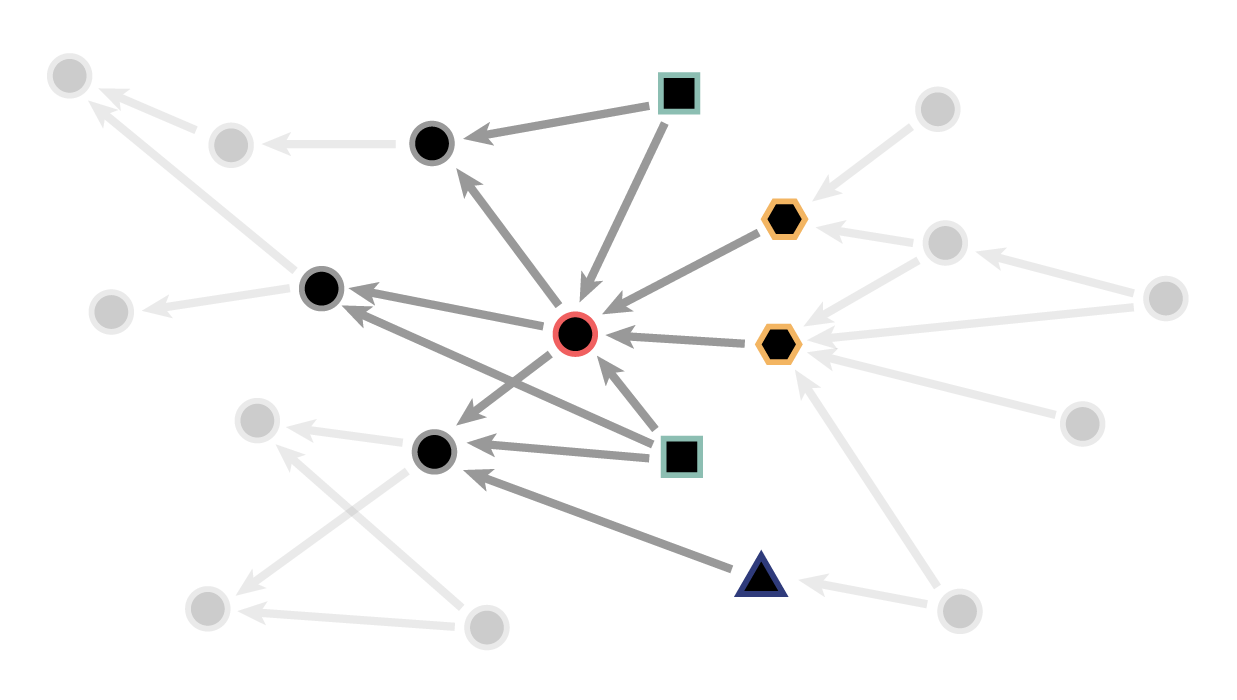
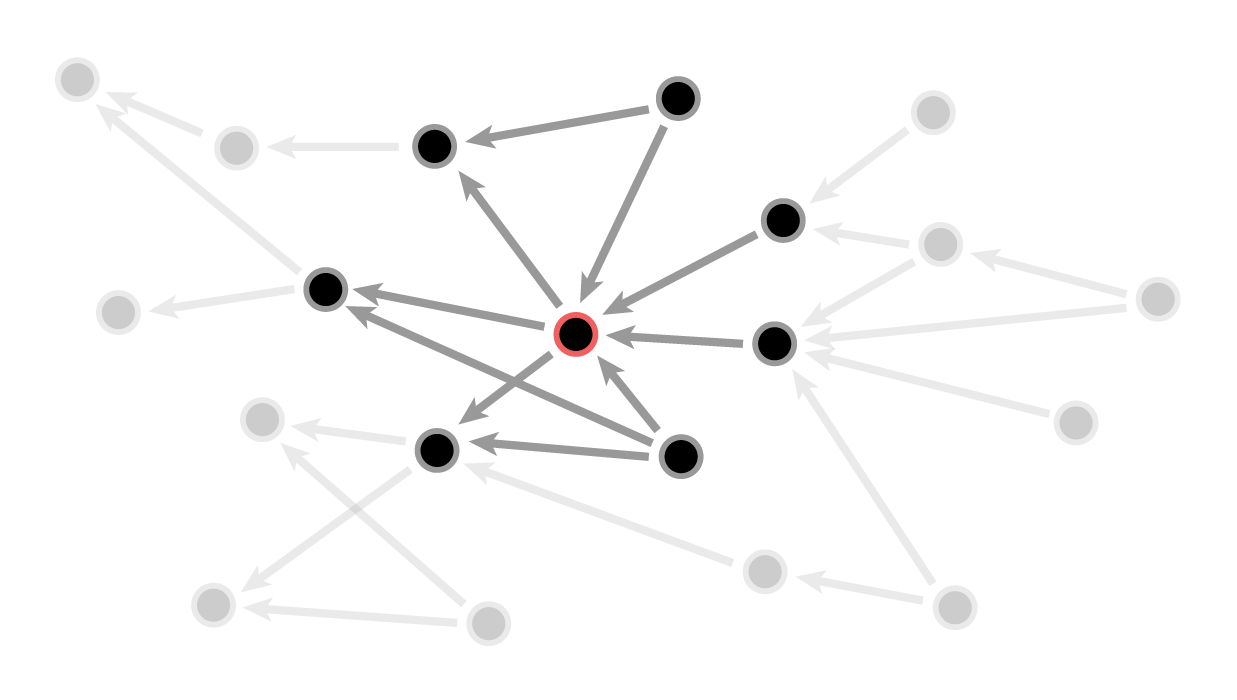
In other words, is composed of the union of the in- and out-subgraphs induced by , but also includes the edges between these two subgraphs. The subgraph forms the basis for the “no-” CD Index formulation given in Bornmann et al. (2020a). Note that the subgraphs and are both similar to the (1-hop) ego subgraph (Figure 5), in that all of these graphs contain the union . However, lacks any edges between nodes within , in addition to lacking edges between nodes within . The subgraph also lacks these edges, and contains additional nodes from .
With these neighborhood graph definitions, we can now provide definitions of the CD Index measures and . Both of these measures are contingent on a labeling of the nodes in the subgraph of .
Definition 6.
Given a CD Index neighborhood subgraph of node , define the -type nodes of as the set .
In other words, the -type nodes of are those which cite only within .
Definition 7.
Given a CD Index neighborhood subgraph of node , define the -type nodes as the set
Here is the out-degree of node . The papers in are those which cite both and at least one of the papers that cites, forming the complement of with respect to the set of papers citing . Note that prior two definitions apply also to , but the following does not.
Definition 8.
Given a CD Index neighborhood subgraph of node , define the -type nodes of as the set .
The set accounts for the papers which cite the papers that cites, but do not cite directly. Given the node labelings in Definitions 6, 7, 8, we can now define the CD Index measures and as ratios of the magnitudes of these sets.
Definition 9.
Given a neighborhood graph derived from citation graph as defined in Definition 5, let , , and be the sizes of the three node sets defined above. The CD Index is given by:
| (3) | ||||
where is the number of nodes in the neighborhood graph.
Definition 10.
Given a neighborhood graph derived from citation graph as defined in Definition 5, let and be the sizes of the node sets defined above. The no- CD Index is given by:
| (4) | ||||
where is the in-degree of node .
Intuitively, measures the propensity of paper to attract citations to itself, drawing attention away from the work which came before it, relative to the total number of citations received by and the papers it cites. The no- CD Index measures a similar propensity, but focuses only on citations made among nodes that cite or are cited by . Note that and satisfy Properties 1, 4, and 2 but fail to satisfy Property 3 due to the one-hop definition of . We will return to this observation in Section 5.
A paper which maximizes the CD Index such that is one which has no - or -type citations: all subsequent works either cite or ignore and its cited work entirely. Such a would be a maximally-disruptive paper according to the CD Index. By contrast, a paper which minimizes the CD Index is one with only -type citations: all of its subsequent citations cite both itself and at least one of its cited papers. Such a would be a maximally-consolidating paper according to the CD Index. Note that and also maximize and minimize .
The CD Index is inherently measuring the importance of node with respect to the citation neighborhood by defining a ratio of node types among the papers citing . As discussed in Section 3, network centrality also provides a framework for measuring importance of nodes embedded within networks. We will now show that this relationship between the importance measured by the CD Index and the importance measured by betweenness centrality are equivalent up to a translation in their ranges.
CD Index as Betweenness Centrality
Recall that we are interested in the importance of nodes over a citation graph , which introduces a number of structural constraints. In particular, we wish to compute the centrality of a node with respect to , which has a very particular structure and leads to the following proposition:
Proposition 1.
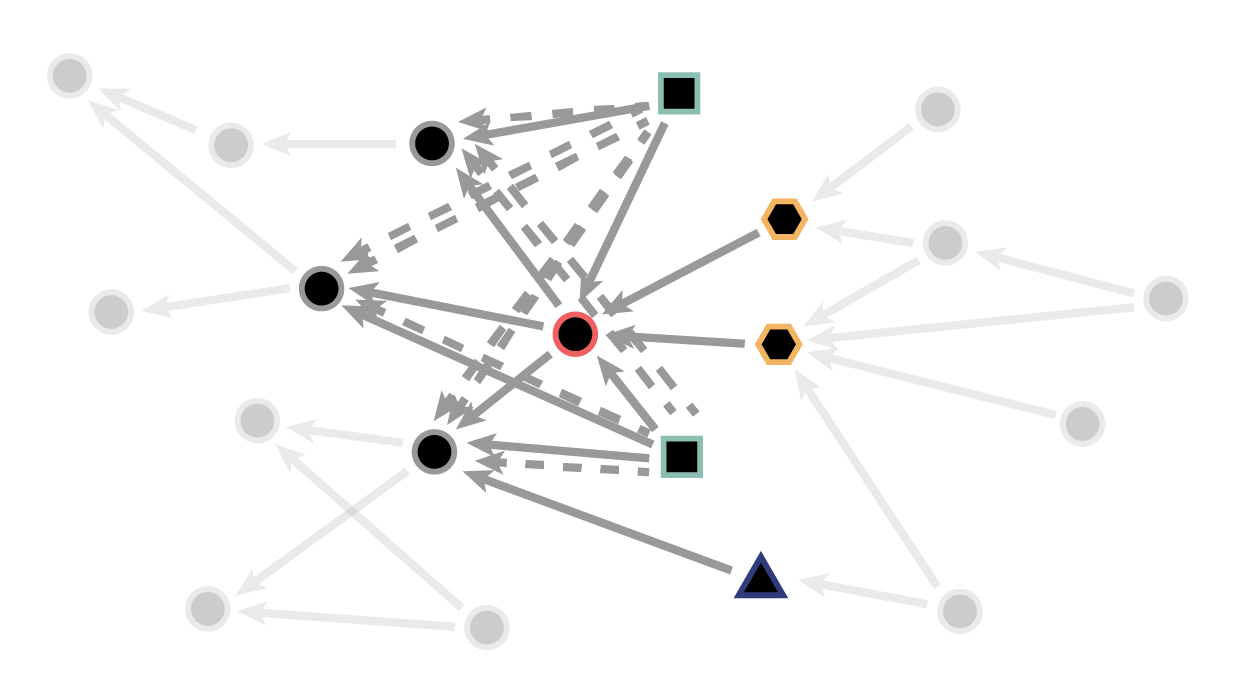
Evaluated over the CD Index neighborhood graph as described in Definition 5, the betweenness centrality of node may be computed as the (normalized) count of paths passing through :
Proof.
By definition of , there is never more than one shortest path between and whenever one exists which passes through , thereby making the denominator of Definition 3 whenever . ∎
Proposition 1 implies that we must only concern ourselves with counting the paths passing through in order to calculate betweenness centrality over . As an immediate corollary, it is easy to see that the vertex , which induces subgraph maximizing , also maximizes : papers citing only cite and not its cited papers.
The normalization factor in the definition of betweenness is typically chosen in such a way as to make comparable across all possible choices of underlying graph. For example, on an arbitrary directed network with nodes, choosing accounts for all possible choices of directed edges between all pairs of nodes excluding the measured node . However, many of the possible edges enumerated by this combinatorial choice of are not realizable within , so a tighter normalization constant is available.
Proposition 2.
Evaluated over the CD Index neighborhood graph as described in Definition 5, the normalization constants
and
both normalize to the range . We denote the betweenness centrality normalized by by and the beweenness centrality normalized by by .
Proof.
This is a multiplicative normalization, so the lower bound of is unchanged at 0 when normalizing. Thus, it suffices to show that the which induces the subgraph maximizing is equal to under this normalization scheme. As discussed above, the maximal is that which induces that has all paths between any possible and flowing through . Any -type nodes, by definition, do not pass through , so they can be ignored at the maximum value (. This means the optimal normalization constant is independent of the inclusion of -type terms, and we must only consider the maximal value of . The maximum betweenness centrality value is achieved by the neighborhood graph which has all in-nodes to connected only to . In such a scenario,
∎
As shown in Proposition 2, the -normalizing constant for graphs of type () is the denominator of the CD Index (no- CD Index) scaled by , and . This observation motivates us to consider to what extent the CD Index and betweenness centrality are related. Careful observation of Definitions 3 and 9 implies that the CD Index is not simply a scaled version of betweenness centrality, as is a difference of label counts over the citing nodes, whereas is a ratio of path counts. We can rewrite to further clarify this observation. Letting and ,
| (5) |
and by extension when :
| (6) |
Thus, the betweenness centrality in simplifies over this neighborhood graph to a measurement of the relative number of paths in the graph emanating from -type nodes and routing around to its cited papers. When extended to graph types with -type nodes, the resulting value (Equation 5) becomes the proportion of possible shortest paths that can pass through minus the number of paths which route around , normalized by the number of possible paths.
Although they are similar, is not equivalent to . In fact, and cannot be forced into equality through mere scaling on alone. This is because is a ratio of the number of paths which emanate from -type nodes and therefore has range , whereas ignores these paths, accounting instead for only the number of -type nodes, resulting in a range .
However, we can force into equivalence with if we are allowed an additional constant to align the ranges. To see this, note that setting
| (7) |
brings Equation 5 into equivalence with :
Equation 7 shows that the CD Index is equivalent to computing the betweenness centrality over a neighborhood graph withing which the average out-degree of -type nodes is .
However, no proper digraph with the structural constraints of exists that can satisfy Equation 7 due to the fact that each node that cites can out-degree at most . This structural impossibility comes from the fact that is a ratio of paths, whereas is a shifted count of vertices. To align these two measures, we can either relax our structural constraints on and view it as a multidigraph which has two edges between each -type node and each node cited by , or we can re-shift to align with . To find this additive constant for the latter case, set
and solve for :
Thus, we see that the addition bringing the CD Index and betweenness into alignment is one which re-aligns their ranges by adding to then deflates by the number of paths emanating from -type nodes which still pass through . If we take to be the maximum possible out-degree supported by our assumptions on the neighborhood graph structure , we find
In other words, computing the CD Index is equivalent to computing the betweenness centrality on the graph where all -type papers in cite all of ’s cited nodes minus a constant which aligns their ranges by accounting for the proportion of -type nodes in the graph. Equivalently, on a neighborhood graph wherein all -type nodes connect to each of ’s out-neighbors, which measures the proportion of -type nodes to total nodes which is equivalent to the reformulation of the CD Index presented in Leydesdorff et al. (2021) and Chen et al. (2021).
Generalizing Disruption Measures via Centrality
The relationship the CD Index and betweenness centrality leads to a number of exciting implications regarding the measurement of disruption. As noted in Section 4.2, the CD Index fails to satisfy Property 3 due to the fact that it is only defined over which is composed of only the immediate predecessor and successor works of . This specificity in citation context can lead to issues in accurately measuring disruption. For example, if future works do not directly cite paper and instead attribute better-known or more refined follow-up works of , will be blind to these indirect attributions. Similarly, if multiple papers compose a disruptive stream of work wherein each subsequent paper builds upon and eclipses the last in relevance, the most recent work is likely to garner the lion’s share of disruption as measured by the , even though each earlier work composes a piece of the disruptive whole.
Because they may be defined with respect to arbitrarily-sized neighborhood graphs, centrality measures are sensitive to this form of indirect influence and therefore offer a theoretical basis for reasoning about these indirect influences and expanding the notion of disruption to account for such behavior. As detailed in Section 3, betweenness and Pagerank are defined with respect to arbitrary-sized neighborhood subgraphs and therefore satisfy Property 3 by default. The relationship between betweenness and the CD Index derived in the previous section motivates one to consider disruption indices constructed from subgraphs of the focal paper of various size and structure, up to the entire ambient citation network. Although work has begun to emerge towards this end (Yang et al., 2023), the heretofore lack of network-theoretic grounding leads to ambiguity in the implementation and properties of the resulting multi-hop measure. The centrality framework for disruption presented in this work provides a much more direct route for such measurement generalizations.

This relationship between centrality measures and disruption also highlights the importance of measurement semantics regarding node importance as measured by centrality. As observed in Section 4.3, the CD Index counts -type nodes the same, regardless of whether they cite all of the focal paper’s prior work or a single prior work. By contrast, betweenness is sensitive to the number of paths which route from successors to predecessors of the focal paper. Pagerank’s random walk semantics are also sensitive to paths between citing and cited papers, though the randomness softens the sensitivity to the path length of these walks. Such measurement semantics must be taken into account when choosing a disruption measure, whether it be the CD Index, betweenness, Pagerank, or some other centrality measure extended to the disruption context.
Note that these centrality definitions of disruption also provide computational benefits when measuring disruption over large citation networks. Betweenness centrality is typically computed by running an all-pairs shortest path algorithm which benefits from the compositionality of geodesic distances when run on the entire graph at once. The dynamic nature of this computation, when computed over the entire network at once, provides significant computational savings as one can avoid computing shortest paths along the same path multiple times for each choice of focal paper. This is in contrast to the CD Index and hop-based disruption measures which must compute disruption measures over each subgraph independently, without borrowing information from past computations within the citation network. The Pagerank algorithm enjoys similar computational benefits to betweenness when computed on the entire citation network at once, and the Eigenvalue problem in Equation 1 can be efficiently computed using a power iteration method which allows for arbitrary precision, although convergence issues may warrant consideration (Langville and Meyer, 2004). In addition, efficient implementations of these centrality-based algorithms exist across many software packages, and approximation algorithms for betweenness also exist (Brandes, 2008).
Finally, we note that this idea of using centrality to measure paper importance within citation networks is not new. Many past works have investigated the use of centrality measures–especially Pagerank–in highlighting important papers within scientific corpora (Ma et al., 2008; Maslov and Redner, 2008; Frahm et al., 2014), in addition to measuring the relevance of scientisits within their collaboration networks (Senanayake et al., 2015). By explicitly tying disruption to centrality in this work, we can both begin interpreting these past results within the context of disruption, and further extend the study of disruption to other areas of network social science through the shared language of centrality.
Measuring Disruption in Physics
This section provides empirical validation for many of the claims made in the previous sections regarding the relationship between disruption and centrality measures. Using a 2021 snapshot of the American Physical Society (APS) bibliographic database, containing over 630,000 papers published in APS journals between the years 1893 and 2019, we derive citation networks based on the corresponding citation data. For each year of the data, we create a citation network representing the citation network of all papers published up to and including year where is an integer-valued lookahead time horizon. For the experiments below, we take where is an “all-time” horizon which results in a citation network constructed from all papers in the database.
For each year and each time horizon , we compute each paper the citation count (), CD Index (), betweenness centrality (), and Pagerank () of each paper published in year with respect to . For betweenness and Pagerank, we also compute these centrality measures for a range of -hop ego subgraphs for in addition to computing centrality over the entire network irrespective of any node neighborhood (“all”). Note again that is not equivalent to in general, so we should not expect to correlate perfectly with . We normalize by setting . We normalize by dividing each Pagerank value by , the lower bound of scores over the neighborhood graph . We set for Pagerank and let .
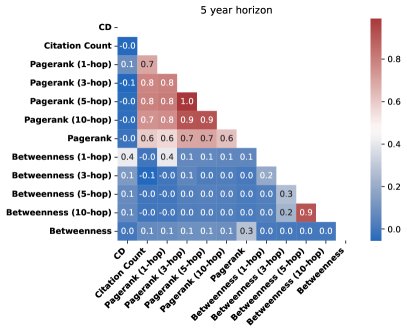
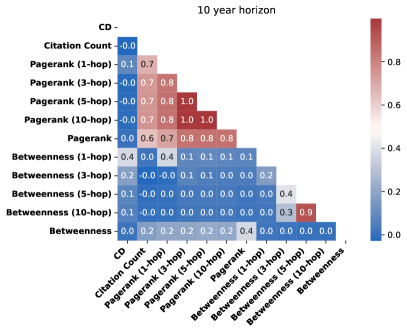
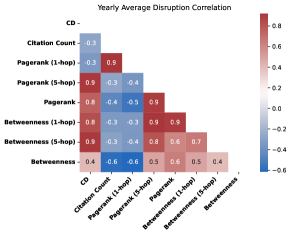
Correlation among Disruption Measures
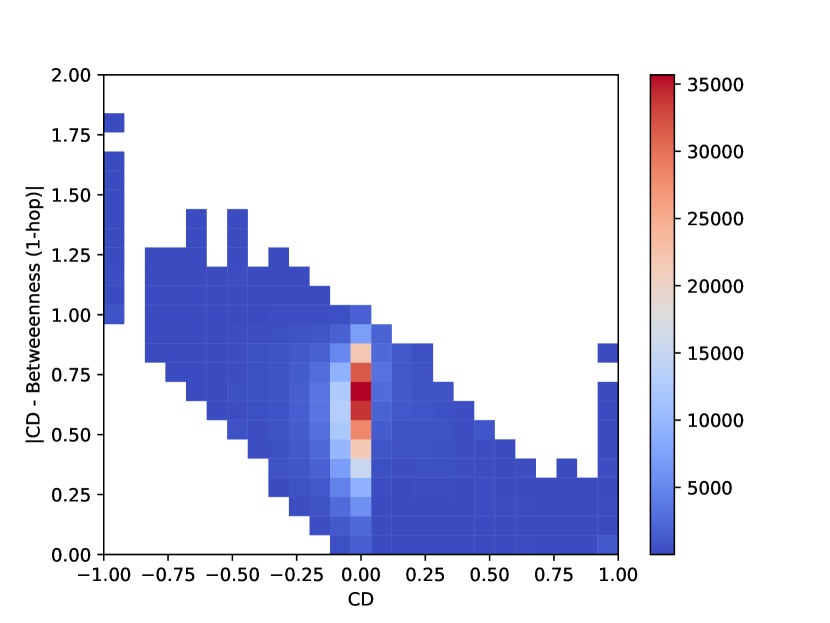
Figure 6 displays the correlation between each disruption measure across 5- and 10-year time horizons and across various -hop subgraphs. As expected, the correlation between and is substantial, though their disruption measurements are still distinct due to the difference between and . Plotting versus as in Figure 7 provides further empirical evidence for the source of the measurement difference between the CD Index and 1-hop betweenness. Overwhelmingly, the papers with values near zero are those with divergent values.
As noted in Section 4.3, this is expected due to the fact that a single citation to the focal paper’s prior work reduces the value of the CD Index the same as if this paper cited all of the focal paper’s prior work, while the same does not hold for betweenness. This discontinuity of the CD Index near has been noted in prior work (Wu and Wu, 2019), and the analyses presented here further enforce the notion that disruption based on path measures may provide a more intuitive measure of disruption than those based on node counts.
Besides , the correlation between and all other disruption measures is limited. This suggests that each of these disruption measures captures varying facets of disruption with respect to each paper’s neighborhood network. The betweenness disruption measures diverge from as their neighborhood hop size increases. This divergence is expected, as the options for shortest routes between the past and future papers relative to the focal paper increases combinatorially with each additional hop. Intriguingly, the family of betweeenness measures also exhibits relatively low inter-family correlation across values of except for the pair and . This observation reinforces the concept that the geodesic distance underlying betweenness may exhibit discontinuous behavior when confronted with minor modifications to the structural composition of the neighborhood graph.
By contrast, yields disruption measures which display substantial inter-family correlation across all values of , reflecting the intuition that disruption derived from random walks may be more robust to modifications to the structural composition of the neighborhood graph surrounding the focal paper. Figure 6 also indicates that Pagerank is, in general, highly correlated with citation count. This relationship is expected, as a higher proportion of nodes directly citing the focal paper implies a higher likelihood of visiting the focal paper along an arbitrary random walk on . This relationship is especially relevant when , as will be primarily driven by the number of papers citing unless each of these papers cite a significant amount of ’s prior work.
Taken together, the results of these correlation analyses reinforce the observation from Section 5 that the definition and measurement of node “importance” over the citation network is integral to the resulting semantics of these disruption measures. The node-type importance of diverges from the geodesic betweenness measure of importance underlying as increases. Similarly, the random walk visitation importance underlying results in a disruption measure which is correlated to both Citation Count and when , but then diverges from the latter measure with increasing until all hops are taken into account. Although each of these measures appears to highlight a distinct facet of disruption, we will observe in the next section that they do share similarity in their aggregate trends across time.
Disruption Trends
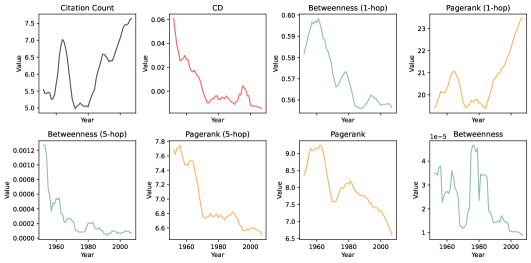
Since its introduction, the CD Index has seen frequent employment as a measure of disruptive outcomes with respect to particular structural variables relevant to the science of science like team size (Wu et al., 2019) or scientific discourse (Lin et al., 2022). A recent study by Park et al. (2023) featured the CD Index in an evaluation of the slowing pace of scientific and technological innovation. In this work, the authors tracked the yearly average value of the CD Index across time and found a generally decreasing trend in disruptiveness measured within citation networks across the sciences. Figure 8 plots the yearly average disruption across papers and their correlations, smoothed by averaging across a centered 5-year window, evaluated at a 5-year time horizon (). Similar to the observations in Park et al. (2023), we observe a generally downward trend in disruption through time across all alternative specifications of disruption apart from Citation Count and . This latter outlier similarity between 1-hop Pagerank and Citation Count is expected due to their close theoretical relationship stemming from a strong influence of direct citations on these measures. As the neighborhood expands, however, we see the time series of Pagerank quickly begins to mirror that of and . As the correlation plot suggests, these alternative disruption specifications are highly similar in terms of their aggregate measurements of disruption through time. The high variance of the average yearly value of betweenness across time is an interesting artifact deserving of further study. We hypothesize that these spikes may correspond to structural shifts in the topology of the citation network which, due to the geodesic distance underlying betweenness, results in large jumps in average betweenness across the network. Such structural changes to the citation network topology may be scientifically meaningful and therefore deserve further study. These results imply that even though the alternative measurements of disruption introduced in this paper may see low correlation to the CD Index at the paper level, these alternative specifications are still influenced by similar global trends in the structure of the citation network which play out through time.
Measuring Prize-Winning Papers
| Disruption Type | AMR | stdev | ||
|---|---|---|---|---|
| CD | 1 | 5 | 45.7% | 40.0% |
| 10 | 40.9% | 39.1% | ||
| Citation Count | 1 | 5 | 9.9% | 18.9% |
| 10 | 9.3% | 18.2% | ||
| Betweenness | 1 | 5 | 33.0% | 22.1% |
| 10 | 30.3% | 21.6% | ||
| 3 | 5 | 19.4% | 13.7% | |
| 10 | 13.1% | 10.6% | ||
| 5 | 5 | 4.7% | 8.3% | |
| 10 | 5.4% | 8.0% | ||
| 10 | 5 | 4.7% | 9.0% | |
| 10 | 2.8% | 5.0% | ||
| all | 5 | 3.6% | 7.0% | |
| 10 | 3.3% | 6.9% | ||
| Pagerank | 1 | 5 | 11.8% | 20.0% |
| 10 | 8.9% | 18.7% | ||
| 3 | 5 | 5.6% | 14.9% | |
| 10 | 4.5% | 12.0% | ||
| 5 | 5 | 5.3% | 14.6% | |
| 10 | 4.2% | 11.9% | ||
| 10 | 5 | 6.0% | 14.9% | |
| 10 | 4.1% | 11.8% | ||
| all | 5 | 3.2% | 9.0% | |
| 10 | 3.6% | 12.3% |
Using data compiled from Li et al. (2019), we determined all papers in the APS database which were cited within acceptance lectures for the Nobel prize in physics. We then computed the descending percentile rank of each paper in the database according to a each disruption measure. Based on this percentile ranking, we computed the mean ranking of all Nobel prize-winning papers within the dataset. The mean ranking of Nobel prize-winning papers across each time horizon and across each choice of (for and ) is plotted in Figure 9.
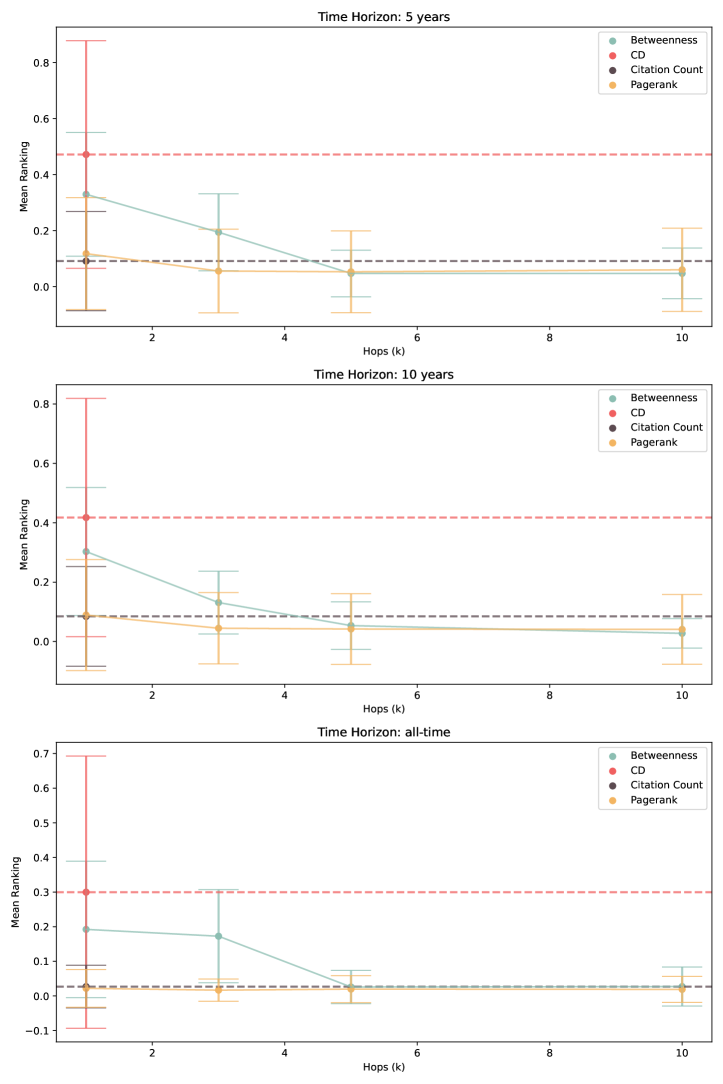
We observe that the CD Index generally ranks Nobel prize-winning papers as being only slightly more disruptive than the median paper across 5- and 10-year time horizons with high variance in this ranking, and unsurprisingly, the -hop betweenness centrality measure of disruption performs similarly. However, we find that assigns higher rank to prize-winning papers as increases while the variance of this ranking shrinks. As seen in Table 1, computing betweenness on an arbitrary number of hops provides the highest ranking to Nobel prize-winning papers with the lowest standard deviation, followed by Pagerank and for 5- and 10-year time horizons. However as the number of hops decreases, the average ranking assigned by approaches 50%, whereas the rankings experience less average rank deterioration but with increased spread.
Summary
We have observed that network centrality satisfies many of the properties desired by a measure of scientific and technological disruption within citation networks. In addition, we have shown that citation count and variants of the CD Index may be explicitly rewritten as measuring degree and betweenness centrality, respectively. By detailing this link between citation disruption and network centrality, and by explicitly consolidating existing disruption measures as specific forms of centrality, we have provided a more general and mathematically rigorous framework for measuring scientific and technological disruption within citation networks.
We have provided empirical evidence which reinforces the value of this network centrality view of disruption by observing the disruption assigned to Nobel prize-winning papers under various definitions of disruption and paper contexts. In particular, we find that disruption measurements may benefit from an expanded the context outside of a one-hop neighborhood around the focal paper which provides better accounts for down-stream innovations which may not directly attribute the focal work. We hope this relationship between citation disruption and network centrality will foster a more fruitful exchange of ideas between the field of science and innovation studies and the broader network science community.
References
- Andrade et al. [2020] Felipe Falcão1 Nazareno Andrade, Flávio Figueiredo, Diego Silva, and Fabio Morais. Measuring disruption in song similarity networks. In Proc. of the 21st Int. Society for Music Information Retrieval Conf, 2020.
- Anthonisse [1971] Jac M Anthonisse. The rush in a directed graph. Stichting Mathematisch Centrum. Mathematische Besliskunde, 1971.
- Arthur [2007] W Brian Arthur. The structure of invention. Research Policy, 36(2):274–287, 2007.
- Arthur [2009] W Brian Arthur. The nature of technology: What it is and how it evolves. Simon and Schuster, 2009.
- Azoulay et al. [2019] Pierre Azoulay, Christian Fons-Rosen, and Joshua S Graff Zivin. Does science advance one funeral at a time? American Economic Review, 109(8):2889–2920, 2019.
- Bavelas [1950] Alex Bavelas. Communication patterns in task-oriented groups. The journal of the acoustical society of America, 22(6):725–730, 1950.
- Bloch et al. [2023] Francis Bloch, Matthew O Jackson, and Pietro Tebaldi. Centrality measures in networks. Social Choice and Welfare, pages 1–41, 2023.
- Borgatti et al. [2009] Stephen P Borgatti, Ajay Mehra, Daniel J Brass, and Giuseppe Labianca. Network analysis in the social sciences. science, 323(5916):892–895, 2009.
- Bornmann [2020] Lutz Bornmann. How can citation impact in bibliometrics be normalized? A new approach combining citing-side normalization and citation percentiles. Quantitative Science Studies, 1(4):1553–1569, 2020.
- Bornmann and Daniel [2008] Lutz Bornmann and Hans-Dieter Daniel. What do citation counts measure? a review of studies on citing behavior. Journal of documentation, 64(1):45–80, 2008.
- Bornmann and Marx [2015] Lutz Bornmann and Werner Marx. Methods for the generation of normalized citation impact scores in bibliometrics: Which method best reflects the judgements of experts? Journal of Informetrics, 9(2):408–418, 2015.
- Bornmann et al. [2020a] Lutz Bornmann, Sitaram Devarakonda, Alexander Tekles, and George Chacko. Are disruption index indicators convergently valid? the comparison of several indicator variants with assessments by peers. Quantitative Science Studies, 1(3):1242–1259, 2020a.
- Bornmann et al. [2020b] Lutz Bornmann, Sitaram Devarakonda, Alexander Tekles, and George Chacko. Disruptive papers published in scientometrics: meaningful results by using an improved variant of the disruption index originally proposed by wu, wang, and evans (2019). Scientometrics, 123(2):1149–1155, 2020b.
- Brandes [2008] Ulrik Brandes. On variants of shortest-path betweenness centrality and their generic computation. Social networks, 30(2):136–145, 2008.
- Bu et al. [2021] Yi Bu, Ludo Waltman, and Yong Huang. A multidimensional framework for characterizing the citation impact of scientific publications. Quantitative science studies, 2(1):155–183, 2021.
- Chen et al. [2021] Jiyao Chen, Diana Shao, and Shaokun Fan. Destabilization and consolidation: Conceptualizing, measuring, and validating the dual characteristics of technology. Research policy, 50(1):104115, 2021.
- Chu and Evans [2021] Johan SG Chu and James A Evans. Slowed canonical progress in large fields of science. Proceedings of the National Academy of Sciences, 118(41):e2021636118, 2021.
- David [1990] Paul A David. The dynamo and the computer: an historical perspective on the modern productivity paradox. American Economic Review, 80(2):355–361, 1990.
- Deng and Zeng [2023] Nan Deng and An Zeng. Enhancing the robustness of the disruption metric against noise. Scientometrics, 128(4):2419–2428, 2023.
- Dosi [1982] Giovanni Dosi. Technological paradigms and technological trajectories: a suggested interpretation of the determinants and directions of technical change. Research policy, 11(3):147–162, 1982.
- Enos [1958] John L Enos. A measure of the rate of technological progress in the petroleum refining industry. The Journal of Industrial Economics, 6(3):180–197, 1958.
- Enos [1962] John L Enos. Invention and innovation in the petroleum refining industry. In The rate and direction of inventive activity: Economic and social factors, pages 299–322. Princeton University Press, 1962.
- Figueiredo and Andrade [2019] Flavio Figueiredo and Nazareno Andrade. Quantifying disruptive influence in the allmusic guide. In ISMIR, pages 832–838, 2019.
- Fleck [2012] Ludwik Fleck. Genesis and development of a scientific fact. University of Chicago Press, 2012.
- Fortunato et al. [2018] Santo Fortunato, Carl T Bergstrom, Katy Börner, James A Evans, Dirk Helbing, Staša Milojević, Alexander M Petersen, Filippo Radicchi, Roberta Sinatra, Brian Uzzi, et al. Science of science. Science, 359(6379):eaao0185, 2018.
- Frahm et al. [2014] Klaus M Frahm, Young-Ho Eom, and Dima L Shepelyansky. Google matrix of the citation network of physical review. Physical Review E, 89(5):052814, 2014.
- Freeman [1977] Linton C Freeman. A set of measures of centrality based on betweenness. Sociometry, pages 35–41, 1977.
- Funk and Owen-Smith [2017] Russell J Funk and Jason Owen-Smith. A dynamic network measure of technological change. Management science, 63(3):791–817, 2017.
- Ghasemi et al. [2014] Mahdieh Ghasemi, Hossein Seidkhani, Faezeh Tamimi, Maseud Rahgozar, and Ali Masoudi-Nejad. Centrality measures in biological networks. Current Bioinformatics, 9(4):426–441, 2014.
- Jaffe and Trajtenberg [2002] Adam B Jaffe and Manuel Trajtenberg. Patents, citations, and innovations: A window on the knowledge economy. MIT press, 2002.
- Kuhn [1962] Thomas S Kuhn. The structure of scientifi revolutions. The Un of Chicago Press, 2:90, 1962.
- Landherr et al. [2010] Andrea Landherr, Bettina Friedl, and Julia Heidemann. A critical review of centrality measures in social networks. Wirtschaftsinformatik, 52:367–382, 2010.
- Langville and Meyer [2004] Amy N Langville and Carl D Meyer. Deeper inside pagerank. Internet Mathematics, 1(3):335–380, 2004.
- Leahey et al. [2023] Erin Leahey, Jina Lee, and Russell J Funk. What types of novelty are most disruptive? American Sociological Review, 88(3):562–597, 2023.
- Leibel and Bornmann [2023] Christian Leibel and Lutz Bornmann. What do we know about the disruption indicator in scientometrics? an overview of the literature. arXiv preprint arXiv:2308.02383, 2023.
- Leydesdorff et al. [2021] Loet Leydesdorff, Alexander Tekles, and Lutz Bornmann. A proposal to revise the disruption index. Profesional de la información (EPI), 30(1), 2021.
- Li et al. [2019] Jichao Li, Yian Yin, Santo Fortunato, and Dashun Wang. A dataset of publication records for nobel laureates. Scientific Data, 6(1):1–10, 2019.
- Li and Chen [2022] Jiexun Li and Jiyao Chen. Measuring destabilization and consolidation in scientific knowledge evolution. Scientometrics, 127(10):5819–5839, 2022.
- Lin et al. [2022] Yiling Lin, James A Evans, and Lingfei Wu. New directions in science emerge from disconnection and discord. Journal of Informetrics, 16(1):101234, 2022.
- Liu et al. [2023] Lu Liu, Benjamin F Jones, Brian Uzzi, and Dashun Wang. Data, measurement and empirical methods in the science of science. Nature human behaviour, pages 1–13, 2023.
- Ma et al. [2008] Nan Ma, Jiancheng Guan, and Yi Zhao. Bringing pagerank to the citation analysis. Information Processing & Management, 44(2):800–810, 2008.
- Maslov and Redner [2008] Sergei Maslov and Sidney Redner. Promise and pitfalls of extending google’s pagerank algorithm to citation networks. Journal of Neuroscience, 28(44):11103–11105, 2008.
- Mokyr [1992] Joel Mokyr. The lever of riches: Technological creativity and economic progress. Oxford University Press, 1992.
- Newman [2018] M. Newman. Networks. OUP Oxford, 2018. ISBN 9780192527493. URL https://books.google.com/books?id=YdZjDwAAQBAJ.
- Page et al. [1998] Lawrence Page, Sergey Brin, Rajeev Motwani, and Terry Winograd. The pagerank citation ranking: Bring order to the web. Technical report, Technical report, stanford University, 1998.
- Park et al. [2023] Michael Park, Erin Leahey, and Russell J Funk. Papers and patents are becoming less disruptive over time. Nature, 613(7942):138–144, 2023.
- Popper [2005] Karl Popper. The logic of scientific discovery. Routledge, 2005.
- Price [1963] Derek J. de Solla Price. Little science, Big science. Columbia University Press, 1963.
- Rosenberg [1982] Nathan Rosenberg. Inside the black box: Technology and economics. Cambridge University Press, 1982.
- Schumpeter [1942] Joseph A Schumpeter. Capitalism, socialism and democracy. Harper & Brothers, 1942.
- Senanayake et al. [2015] Upul Senanayake, Mahendra Piraveenan, and Albert Zomaya. The pagerank-index: Going beyond citation counts in quantifying scientific impact of researchers. PloS one, 10(8):e0134794, 2015.
- Tahamtan and Bornmann [2018] Iman Tahamtan and Lutz Bornmann. Core elements in the process of citing publications: Conceptual overview of the literature. Journal of informetrics, 12(1):203–216, 2018.
- Tahamtan and Bornmann [2019] Iman Tahamtan and Lutz Bornmann. What do citation counts measure? an updated review of studies on citations in scientific documents published between 2006 and 2018. Scientometrics, 121:1635–1684, 2019.
- Tushman and Anderson [1986] Michael L Tushman and Philip Anderson. Technological discontinuities and organizational environments. Administrative Science Quarterly, 31(3):439–465, 1986.
- Waltman [2016] Ludo Waltman. A review of the literature on citation impact indicators. Journal of informetrics, 10(2):365–391, 2016.
- Wang and Barabási [2021] Dashun Wang and Albert-László Barabási. The science of science. Cambridge University Press, 2021.
- Wang et al. [2023] Shiyun Wang, Yaxue Ma, Jin Mao, Yun Bai, Zhentao Liang, and Gang Li. Quantifying scientific breakthroughs by a novel disruption indicator based on knowledge entities. Journal of the Association for Information Science and Technology, 74(2):150–167, 2023.
- Wu et al. [2019] Lingfei Wu, Dashun Wang, and James A Evans. Large teams develop and small teams disrupt science and technology. Nature, 566(7744):378–382, 2019.
- Wu and Yan [2019] Qiang Wu and Zhaoyang Yan. Solo citations, duet citations, and prelude citations: New measures of the disruption of academic papers. arXiv preprint arXiv:1905.03461, 2019.
- Wu and Wu [2019] Shijie Wu and Qiang Wu. A confusing definition of disruption. 2019.
- Yang et al. [2023] Alex J Yang, Sanhong Deng, Hao Wang, Yiqin Zhang, and Wenxia Yang. Disruptive coefficient and 2-step disruptive coefficient: Novel measures for identifying vital nodes in complex networks. Journal of Informetrics, 17(3):101411, 2023.
- Zeng et al. [2021] An Zeng, Ying Fan, Zengru Di, Yougui Wang, and Shlomo Havlin. Fresh teams are associated with original and multidisciplinary research. Nature human behaviour, 5(10):1314–1322, 2021.