An Astrometric Approach to Measuring the Color of an Object
Abstract
The color of a star is a critical feature to reflect its physical property such as the temperature. The color index is usually obtained via absolute photometry, which is demanding for weather conditions and instruments. In this work, we present an astrometric method to measure the catalog-matched color index of an object based on the effect of differential color refraction (DCR). Specifically, we can observe an object using only one filter or alternately using two different filters. Through the difference of the DCR effect compared with reference stars, the catalog-matched color index of an object can be conveniently derived. Hence, we can perform DCR calibration and obtain its accurate and precise positions even if observed with Null filter during a large range of zenith distances, by which the limiting magnitude and observational efficiency of the telescope can be significantly improved. This method takes advantage of the DCR effect and builds a link between astrometry and photometry. In practice, we measure the color indices and positions of Himalia (the sixth satellite of Jupiter) using 857 CCD frames over 8 nights by two telescopes. Totally, the mean color index (Gaia photometric system) of Himalia is 0.750 0.004 magnitude. Through the rotational phased color index analysis, we find two places with their color indices exceeding the mean 3.
keywords:
Astrometry – Atmospheric effect – Planets and satellites: general – Method: data analysis – Techniques: image processing1 Introduction
The color of a star, which is usually described as the value of color index, contains the key information of its basic property. For example, the color of a star reflects its temperature, and helps us further derive its mass, brightness and metallicity (we only refer to main sequence stars here). The color of a solar system object helps us reveal its composition. It is expected that the color properties of Trans-Neptunian objects (TNOs) and irregular satellites are similar, since these satellites are expected to be the captured TNOs during the early history of the giant planet dynamical evolution (Graykowski & Jewitt, 2018; Peña & Fuentes, 2022). In addition, investigating the color variations of the objects in solar system helps us analyze their atmospheric changes and surface material distributions. For ground-based astrometry, the effect of differential color refraction (DCR) can be calibrated effectively via the color index of an object.
The atmospheric refraction occurs when the lights of stars pass through the Earth’s atmosphere. In a taken CCD frame by a ground-based telescope, except for the effect of atmospheric refraction, different positional refraction still exists in the star images due to their different colors, which is called DCR. The DCR effect makes the star images in a frame with different positional deviations towards zenith, which increases with the angle away from zenith. The light with shorter wavelength (blue stars) is more refracted, whereas longer wavelength (red stars) less. For ground-based astrometry, the DCR effect results in a systematic positional error, which should be considered to obtain accurate and precise positions (Anderson et al., 2006; Velasco et al., 2016).
At present, several methods have been proposed to calibrate the DCR effect in astrometry. For example, Monet et al. (1992) obtained a series of observations when the targets are located at different zenith distances (ZDs, which equal 90∘ - altitude) to determine the DCR effect. Then, they performed absolute photometry to obtain the colors of stars so that the DCR effect can be calibrated. Velasco et al. (2016) and Ducourant et al. (2008) are the good examples of calibrating the DCR effect using this method. Stone (2002) used H interference filter (with very narrow passband) to obtain observations, which can be regarded as non-DCR-affected. He also obtained the observations of the same fields of view (FOV) using other filters. Thus, the DCR effect can be calculated when they were mapped onto the non-DCR-affected observations. In this way, the DCR effect can be calibrated after obtaining the colors of stars. Recently, the catalog-based methods have been proposed and one can calibrate the DCR effect based on the astrometric and photometric information provided by some star catalog. For example, Magnier et al. (2020) calibrated the DCR effect of stars from Pan-STARRS catalog based on the astrometric information from 2MASS catalog (Skrutskie et al., 2006). And later, the star positions of Pan-STARRS catalog have been further improved after the DCR calibration using the astrometric information of Gaia EDR3 catalog (Gaia Collaboration et al., 2021). Lin et al. (2020) proposed a convenient method using both astrometric and photometric information from Gaia DR2 catalog (Gaia Collaboration et al., 2018).
However, the methods mentioned above mainly focus on the DCR calibration of stars. As for the objects in solar system whose information is not provided by star catalogs, the DCR effect is usually considered in the following ways. Some scholars, for example, Kilic et al. (2012), Dieterich et al. (2018) and Shang et al. (2022) used the filter with longer wavelength passband to reduce the DCR effect. In addition, the DCR effect can be minimized by restricting the target being close to the meridian when observed. Ortiz et al. (2017), Winters et al. (2017) and White et al. (2022) reduced the astrometric errors in this way. However, even if we observe close to the meridian, some systematic errors exist in declination. Sometimes, because the astrometric accuracy of moving targets was limited, some works (Gomes-Júnior et al., 2015; Wang et al., 2015; Yu et al., 2018) didn’t take the DCR effect into account. Of course, there remain some works that calibrated this effect. For example, Benedetti-Rossi et al. (2014) observed Pluto using several different filters to calibrate the effect of both reference stars and the target.
To accurately calibrate the DCR effect for the solar system objects using the catalog-based method, their catalog-matched color indices should be acquired, however, which are not provided by a star catalog. To obtain the color index of such a target, we can consult some references and transform them to the catalog-matched photometric system. For example, we need to transform to the color index BP-RP in Gaia photometric system. For more details of the color index BP-RP, one can refer to Carrasco et al. (2021). This transformation may cause large errors (e.g. 0.02 0.20 mag according to different photometric systems111https://gea.esac.esa.int/archive/documentation/GDR3). However, some colors of the targets may have not been published, such as the newly-discovered objects in solar system. Another approach is to perform absolute photometry, which is demanding for weather conditions (in photometric night) and well-calibrated instruments.
In this work, we want to derive the color of a solar system object based on the DCR effect. Since the color index of an object can be described as the function of its DCR effect, we can accordingly derive its color if its DCR effect has been determined. However, it is not easy to acquire the pure DCR effect, because the DCR effect exists when observing with any filter for ground-based telescopes. We will explore this method to obtain the catalog-matched color index of an object in an astrometric way. Once the color index has been derived, we can observe with Null or Clear filters during a large range of ZDs and perform DCR calibration. Compared with using the filters with long wavelength passband which cause negligible DCR effect (Stone, 2002; Lin et al., 2020), the limiting magnitude and the observational efficiency can be well improved. Compared with the observational scheme of only observing near the meridian, we have much more time to observe a program object. On the other hand, we don’t need to perform absolute photometry to acquire the color of an object, which relies on the demanding weather conditions, instruments and photometric system transformation.
The contents of this paper are arranged as follows. Section 2 will elaborate the method to measure the color of an object using DCR effect. Section 3 will introduce the observations used. Section 4 will show the measurement results in detail. Section 5 will show the discussions, and the conclusions will be drawn in the last section.
2 Method
There are two observation schemes to measure the catalog-matched color index in an astrometric way. One is observing an object only with one filter, and another is alternately using two different filters. The details of the two schemes will be elaborated in this section.
2.1 Atmospheric Refraction and DCR Effect
The lights of stars through the Earth’s atmosphere cause the positional refraction, including atmospheric refraction and DCR effect. To clearly describe the positional effects of Earth’s atmosphere here, the positional effects are divided into color-related effect (called the DCR effect) and color-unrelated effect (called atmospheric refraction), although the atmospheric refraction includes the differential color refraction effect in some references. Here, we refer to The Astronomical Almanac (Bell & Urban, 2012), according which the atmospheric refraction is not relevant to light wavelength. As for DCR effect, the lights of stars will refract with different positions towards zenith according to their different light wavelengths. For ground-based telescopes, the DCR effect exists when observing with any filter (even more obvious effect without using filter). For an observed star image, the observational position in the direction of ZD can be expressed via the following equation (this equation is applicable for any filter in optical band or no filter in optical telescope),
| (1) |
where is the positional () (the observed minus computed) in ZD, and the computed position is made from some star catalog or some ephemeris. The color-unrelated effect of atmospheric refraction can be eliminated in by fitting the plate model with a order polynomial. In this way, the effects of distortion and color-unrelated atmospheric refraction can be well calibrated (Lin et al., 2019; Guo et al., 2022). Specifically, we take the astrometric positions of some catalog for reference stars and perform differential astrometry. usually changes during one night due to the change of both and . For the first term in the right side of equation 1, is the positional error in the direction of ZD. It is derived from the components of both ()s in right ascension (R.A.) and declination (Decl.) and projected into the direction of ZD. The ()s in R.A. and Decl. are usually stable during a period of time. However, of an object or a reference star usually changes during one night because of the change of its parallactic angle. is the DCR effect, which is scaled as tangent of ZD. The light with shorter wavelength is more refracted, whereas longer wavelength less. is the random error (e.g. the uncertainty of measurement error). According to Lin et al. (2020), the DCR effect can be expressed as,
| (2) |
where and are the DCR coefficients of a certain filter, is the color index (BP-RP in Gaia system is used in this work) of the star and is zenith distance. In equation 2, since the absolute value of is very small (less than 0.15 arcsec/mag for Null filter), we can directly use the observed value of for calculation. When we fit the plate model (e.g. order polynomial) and calculate , the DCR coefficient will be a dummy coefficient because (a constant) can be absorbed by the constant term of the polynomial. Hence, combining equations 1 and 2, the observed position in ZD can be expressed as,
| (3) |
2.2 DCR Calibration from Reference Stars
We calibrate the DCR effect of the reference stars with a catalog-based method according to Lin et al. (2020). In the field of view, there should be at least 20 calibrated stars with a large range of known color index (e.g. 2.0 mag) in the field of view so that the DCR coefficient can be solved accurately. Specifically, for each frame, we first fit the plate model ( order polynomial) using the matched stars between their pixel coordinates and standard coordinates in altitude-azimuth system based on the positional and photometric information of Gaia DR3 catalog (Gaia Collaboration et al., 2023). Here, this polynomial contains the term in the direction of ZD so that the DCR effect of stars can be eliminated. The positional errors of reference stars from the catalog ( in equation 3) are considered negligible. In this way, the DCR coefficient for each frame can be solved. However, we can’t directly obtain the catalog-matched color index of a solar system object from the catalog. In the following two subsections, we will elaborate on how to obtain the catalog-matched color index of such an object.
| Date (UT) | Filters | Frames (No.) | ExpTime (s) | ZD (deg) | Telescope | (mas/mag) | (mas/mag) |
|---|---|---|---|---|---|---|---|
| 2022-10-18 | Cousins-I / Null | 25 / 28 | 120 / 120 | 26.5 51.0 | 1 m | -5.8 1.6 | -95.8 3.1 |
| 2022-10-19 | Cousins-I / Null | 37 / 36 | 120 / 120 | 27.6 60.2 | 1 m | -9.4 0.7 | -100.7 2.3 |
| 2022-10-20 | Cousins-I / Null | 27 / 27 | 120 / 120 | 26.9 43.2 | 1 m | -5.7 1.0 | -118.9 4.7 |
| 2022-10-21 | Cousins-I / Null | 18 / 17 | 120 / 120 | 26.9 47.8 | 1 m | -8.6 1.5 | -110.4 3.8 |
| 2022-11-22 | Cousins-I / Clear | 54 / 55 | 120 / 80 | 29.3 63.9 | 0.8 m | -5.1 0.5 | -114.1 1.2 |
| 2022-11-23 | Cousins-I / Clear | 88 / 85 | 120 / 80 | 28.1 64.7 | 0.8 m | -5.3 0.3 | -117.3 0.8 |
| 2022-11-29 | Cousins-I / Clear | 89 / 91 | 120 / 80 | 28.1 70.2 | 0.8 m | -5.0 0.3 | -105.8 0.8 |
| 2022-11-30 | Cousins-I / Clear | 90 / 90 | 120 / 80 | 28.1 70.2 | 0.8 m | -5.0 0.3 | -110.7 0.9 |
2.3 Measure the Color of an Object Using One Filter
After DCR calibration from reference stars, we can conveniently derive the DCR coefficients of each filter. As for an object in solar system, in each frame, we can calculate of the object. However, in equation 3, neither nor is known. is the positional error which comes from the referenced ephemeris in R.A. and Decl.. For an object in solar system, can not be negligible since the ephemeris may not provide the accurate position. According to the parallactic angle, the positional error in R.A. and Decl. can be projected into the direction of ZD. Similar to equation 3, for the positions of the object in altitude-azimuth system, we have the following expression (if we ignore the random error here),
| (4) |
where is the parallactic angle, is the () in R.A., is the () in Decl., and (also expressed as ) is the () in azimuth. Both and can be expressed as the function of , and . The parallactic angle can be calculated conveniently. In equation 4, , and are all unknown and we can regard them as the constants during a period of time (e.g. during one night). Therefore, at least 3 observations are needed to solve the set of equations above. This method requires the observations with a large range of ZDs and large change of DCR effect for robust solution. It is obvious that this method it not convenient to measure the instant color index of the object, because we can only solve the mean DCR coefficient and the mean color index. In practice, the uncertainty of the measured color index with this scheme is usually large (also see Figure 3) due to the large condition number. In addition, the solution might not be inaccurate due to the complex relationships of , and (they might not be the constants during a short period of time). To accurately measure the instant color index, we can use another observation scheme with two filters alternately for measurement, which will be elaborated in the next subsection.
2.4 Measure the Color of an Object Using Two Filters Alternately
As shown in Subsection 2.1, we can derive the DCR coefficient of each filter. of the object can be calculated. According to equation 3, we can also solve (and ) via at least two equations with different and at the same moment. Namely, we can observe with at least two different filters to solve the color index (and ). For a frame observed with one filter (denoted by filter-P), we can calculate the of the object, and as shown in equation 3, . We ignore the random errors during the derivation. Similarly, for a frame observed with another filter (denoted by filter-Q), . If we alternately observe with the two filters, we can fit or as the respective function with time. In this way, we can obtain and at any moment during the period of observation. We do not need to fit such a function if the telescope can obtain two frames with two different filters simultaneously. Suppose at the moment of , the DCR effect with filter-P and filter-Q can be expressed as the following two equations.
| (5) |
| (6) |
In the two equations above, at the same moment of , equals . Let equation 6 minus equation 5, for the same moment, we have the following expression,
| (7) |
In this way, in equation 3 can be eliminated at the moment of . For each observed frame with some filter (e.g. filter-P), we can directly calculate the at the moment of (the mid-time of the observed exposure frame). Then, the observed position with another filter (e.g. filter-Q) at the moment of can be interpolated by the fitted function. According to equation 7, all the parameters except can be obtained. Therefore, we can calculate the of the object at the moment of . The uncertainty of the measured color index at the moment of can be approximately (ignore the uncertainty of ) estimated as equation 8,
| (8) |
where and are the positional error in ZD with filter-P and filter-Q, respectively. It can be seen that the uncertainty is mainly caused by the absolute value of difference of DCR coefficients and the observed zenith distance. Hence, to obtain the accurate and precise color index, we should observe with large difference of DCR coefficients (e.g. using Cousins-I and Null filter alternately) and at large ZD. After we obtain the object’s color indices and uncertainties, we can calculate a weighted (1/) average color index.
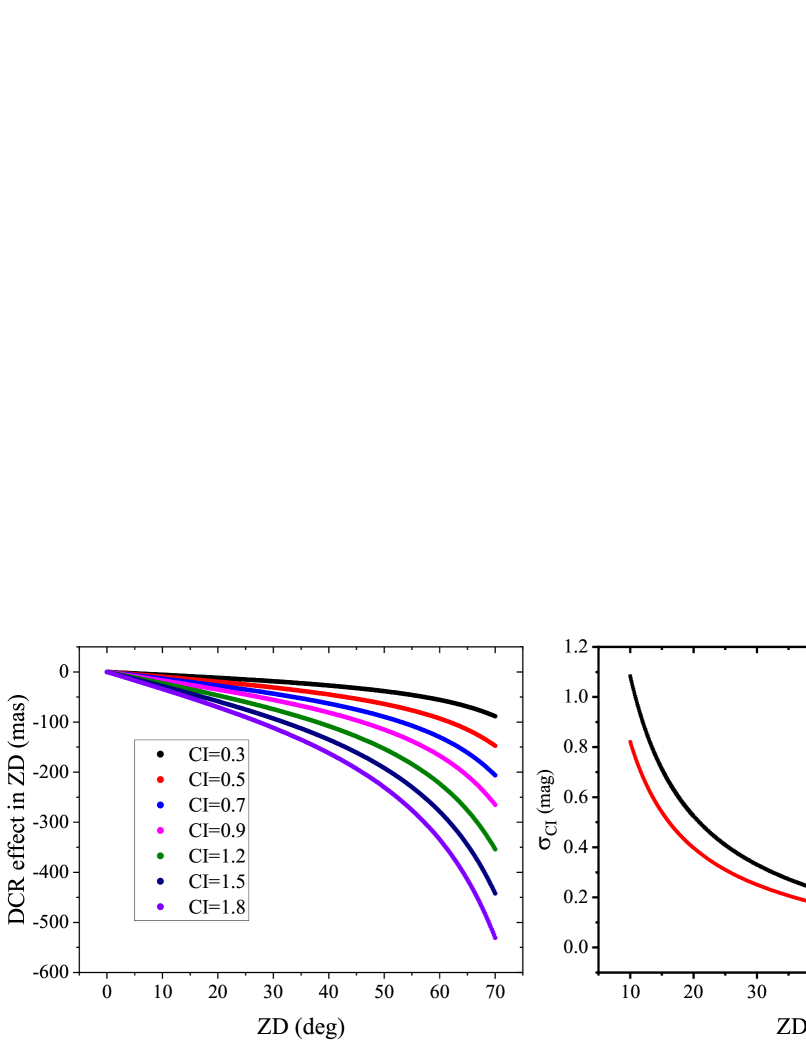
Figure 1 shows the DCR effect of an object change with ZD (left panel) and the estimated uncertainty changes with ZD (right panel). In the figure, we take the mean measured DCR coefficient and estimated uncertainties of color indices during the observation in this work as an example. The used observations in detail will be shown in Section 3. From the left panel, observed with Null filter, the DCR effect of an object changes greatly with ZD (especially when the color index of the object is large). From the right panel, we can see that the uncertainty of color measurement is quite large at small ZD, but it is a good time to efficiently observe and perform astrometry with Null filter. During the observation using the 1 m telescope (see the next section of observations), mainly due to the urban light pollution and poor weather conditions, the uncertainty of color measurement is larger than the 0.8 m telescope (also see the next section).
3 Observations
To verify the effectiveness of our method, we observe the jovian irregular satellite Himalia (the sixth satellite of Jupiter) for color measurement and astrometry over 8 nights by two different telescopes. The observations of Himalia overview are shown in Table 1. Totally, 215 frames are obtained over 4 nights by the 1 m telescope at Kunming Station, Yunnan Observatory (IAU code: 286). And 642 frames are obtained over 4 nights by the 0.8 m telescope at Yaoan Station, Purple Mountain Observatory (IAU code: O49). During the observation by the 1 m telescope, the observations with consecutive time for one night may not be obtained due to the instrumental troubles and poor weather conditions. In addition, for the 1 m telescope, we could not observe the object with its ZD larger than 62∘ due to its dome occlusion. In contrast, observations with better quality are obtained by the 0.8 m telescope with the ZD as large to 70∘. For all the taken observations, at least 30 calibrated Gaia stars can be detected and matched in the field of view. As for the filters, we use Cousins-I and Null alternately by the 1 m telescope, while Cousins-I and Clear alternately by the 0.8 m telescope.
4 Results
After bias and flat-field corrections, for each frame, the two-dimensional Gaussian centering algorithm is used to measure the detected star images in pixel coordinate. For calibration, we match the detected stars with those in Gaia DR3 catalog (Gaia Collaboration et al., 2023) and obtain their astrometric and photometric information.
4.1 Results of Color Index
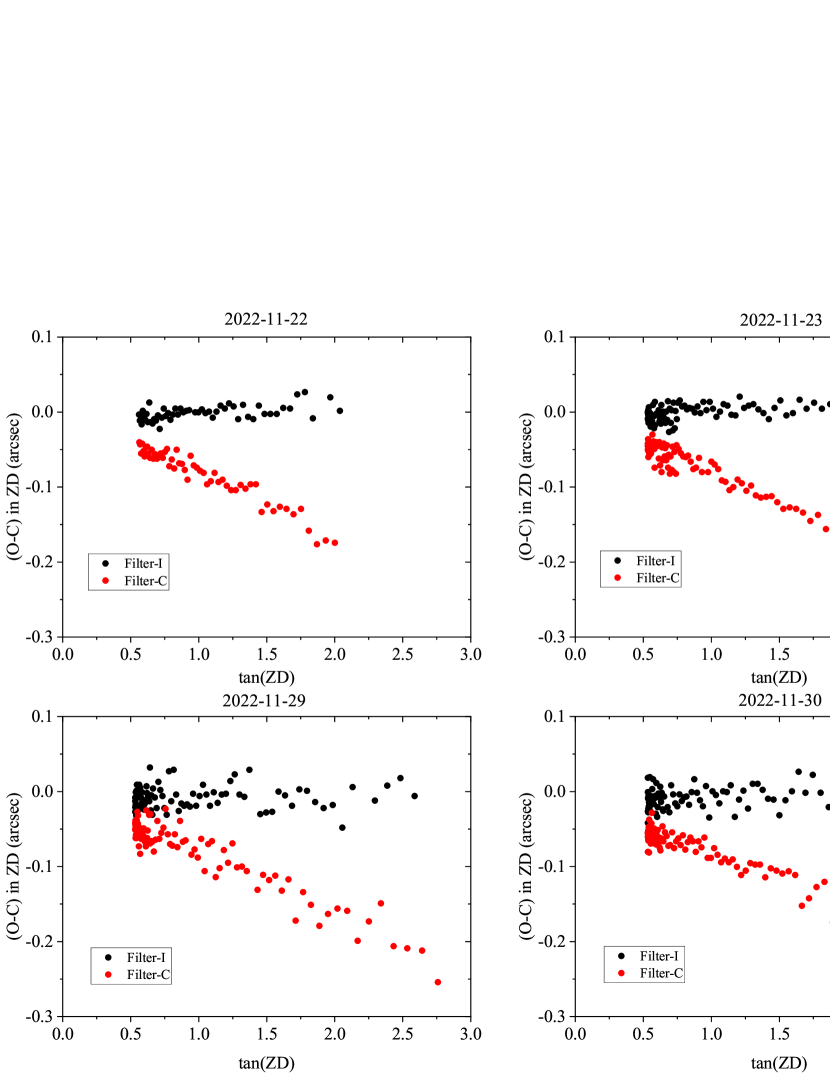
For the obtained observations of Himalia, according to Subsection 2.2, we solve the DCR coefficient of each filter, and the results are shown in Table 1. For the same filter of the same telescope, empirically, the DCR coefficient is usually stable over several nights unless the poor weather conditions. To show the DCR effect of Himalia clearly, we calculate the () in ZD ( in equation (3) compared with JPL ephemeris222https://ssd.jpl.nasa.gov/horizons.cgi#top (JUP344 and DE441). Figure 2 shows the ()s in ZD with the tangent of ZD as an example, alternately observed with Cousins-I and Clear filters by the 0.8 m telescope. For each panel, the ()s with Cousins-I filter are almost near 0. Both the ()s with Clear and Cousins-I filter are almost linear with the tangent of ZD. If we fit their respective linear function, they will approximately intersect at zenith (). This numeral relationship is also shown in equation 3.
| Work | Observations | BP-RP | Uncertainty |
|---|---|---|---|
| (mag) | (mag) | ||
| Others | Degewij et al. (1980) | 0.78 | 0.08 |
| Luu (1991) | 0.75 | 0.07 | |
| Rettig et al. (2001) | 0.75 | 0.09 | |
| This work | 2022-10-18 | 0.743 | 0.038 |
| 2022-10-19 | 0.753 | 0.025 | |
| 2022-10-20 | 0.800 | 0.036 | |
| 2022-10-21 | 0.769 | 0.046 | |
| 2022-11-22 | 0.746 | 0.008 | |
| 2022-11-23 | 0.746 | 0.007 | |
| 2022-11-29 | 0.752 | 0.009 | |
| 2022-11-30 | 0.747 | 0.008 | |
| Total | Subtotal (1 m) | 0.763 | 0.017 |
| Subtotal (0.8 m) | 0.748 | 0.004 | |
| Total (all) | 0.750 | 0.004 |
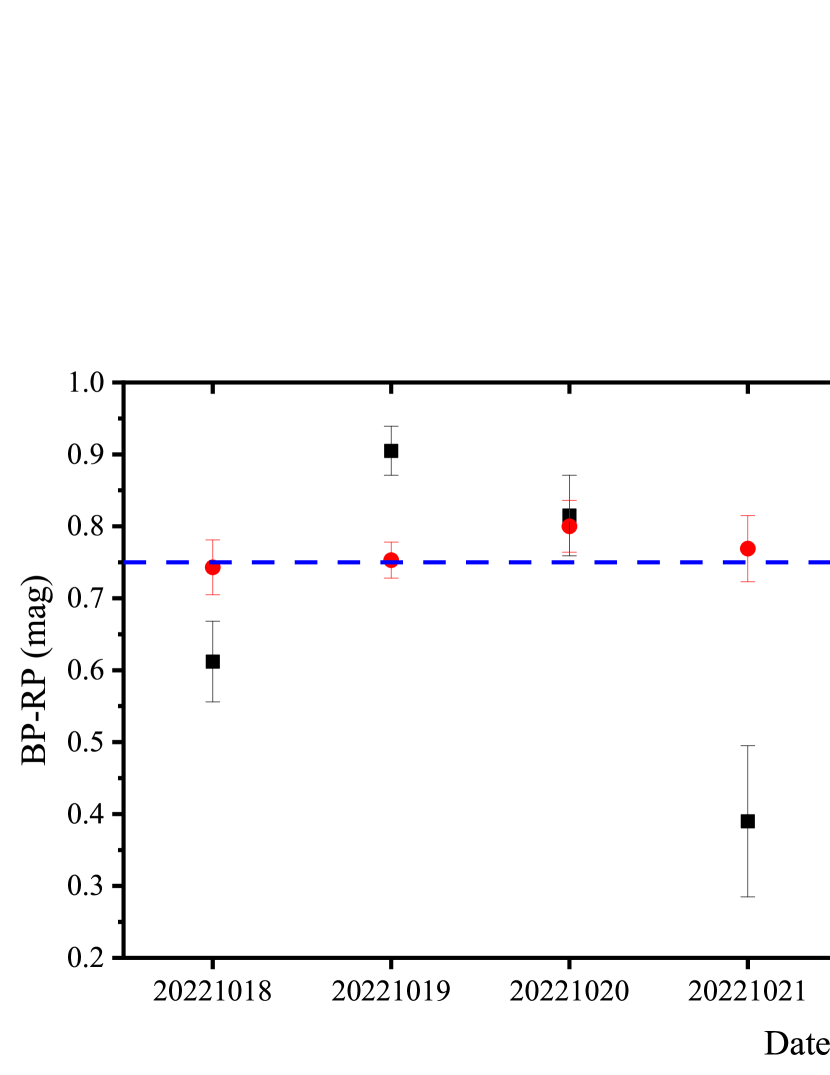
We calculate the color indices BP-RP (in Gaia photometric system) of Himalia for the observations of each night using two methods (using one filter and two filters alternately). As for the method of using one filter, only the observations with Null or Clear filter are used for calculation. We obtain a color measurement result for the observations over one night. Observations with Cousins-I filter will have influence on the accuracy of the results because of the large condition number. As for the method of using two filters, we use all the taken observations as shown in Table 1. The comparison of the results with two methods are shown in Figure 3. Obviously, we can derive more accurate and precise results using the method of two filters alternately.
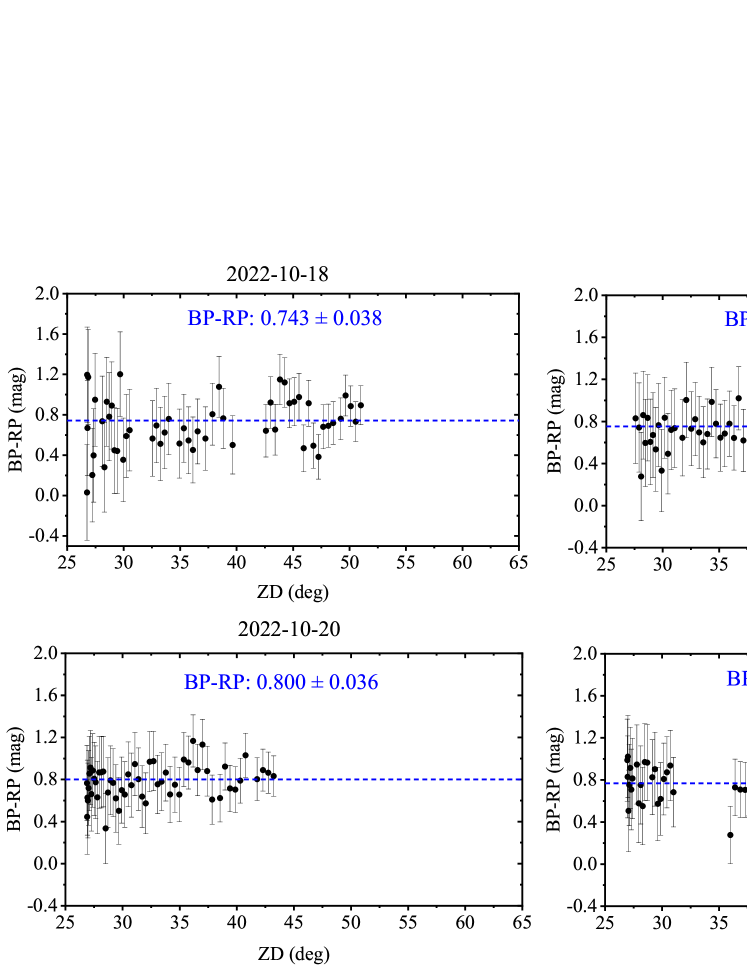
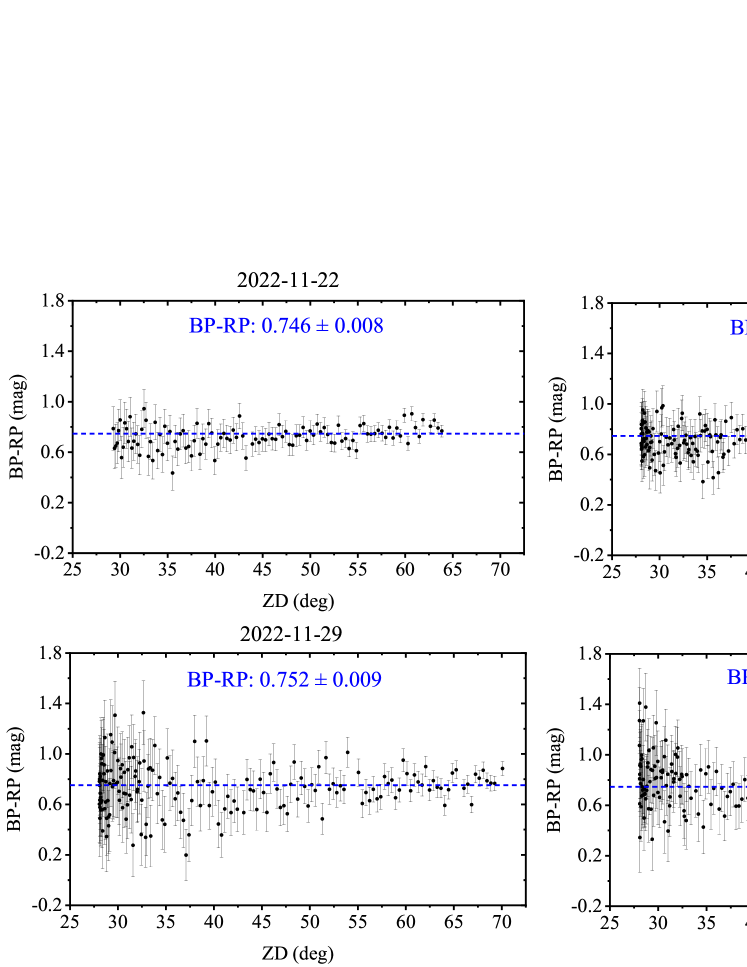
Figures 4 and 5 show the color measurement results of Himalia using the method of two filters alternately by the 1 m and 0.8 m telescope, respectively. From Figure 4, especially for the bottom-right panel, due to the bad weather, only 7 frames (for either Cousins-I or Null filter) with each ZD greater than 40∘ are taken. In contrast, for the four panels in Figure 5 observed by the 0.8 m telescope, the observations are consecutive for each night, and the observations at large ZD are also obtained. On Nov 22 and 23, 2022, observations are obtained at the large ZD of 65∘. While on Nov 29 and 30, 2022, the ZD is even as larger as 70∘. Therefore, the uncertainties of the mean color indices by the 0.8 m telescope are smaller.
To verify the measured color index in this work, we compared it with other references. For comparison, we have changed their original measured color indices into the BP-RP system according to Gaia Data Release 3 Documentation333https://gea.esac.esa.int/archive/documentation/GDR3/. The comparison results are shown in Table 2. The color indices we measured in this work using the method of two filters alternately show the consistency for each night, and also with other works. Totally, the mean color index BP-RP of Himalia measured in this work is 0.750 0.004 magnitude. The reasons why we spend 8 nights using two different telescopes to measure the color index are shown in the following three aspects. a) to verify whether we can obtain the same result in different nights; b) to verify whether we can obtain the same result using different telescopes; c) to verify the uncertainty of the measured color index with respect to zenith distance. If we want to measure the color index in a short time, we can just observe the target at large zenith distances.
| Date (UT) | R.A. (I) | Decl. (I) | R.A. (N/C) | Decl. (N/C) | R.A. (I) | Decl. (I) | R.A. (N/C) | Decl. (N/C) |
|---|---|---|---|---|---|---|---|---|
| SD (before DCR calibration) in arcsec | SD (after DCR calibration) in arcsec | |||||||
| 2022-10-18 | 0.019 0.019 | 0.006 0.012 | -0.003 0.030 | 0.049 0.012 | 0.020 0.019 | 0.005 0.012 | 0.029 0.018 | 0.010 0.013 |
| 2022-10-19 | 0.017 0.015 | -0.004 0.014 | 0.010 0.015 | -0.001 0.018 | 0.015 0.015 | -0.002 0.015 | 0.019 0.015 | -0.008 0.018 |
| 2022-10-20 | 0.012 0.016 | -0.004 0.010 | 0.003 0.013 | 0.015 0.012 | 0.012 0.016 | -0.005 0.010 | 0.017 0.014 | -0.007 0.013 |
| 2022-10-21 | 0.024 0.019 | 0.008 0.012 | 0.023 0.020 | 0.030 0.025 | 0.024 0.019 | 0.008 0.012 | 0.034 0.018 | 0.012 0.026 |
| 2022-11-22 | 0.019 0.008 | -0.008 0.009 | 0.090 0.041 | 0.059 0.015 | 0.017 0.007 | -0.009 0.009 | 0.014 0.007 | -0.007 0.009 |
| 2022-11-23 | 0.020 0.006 | -0.001 0.007 | 0.063 0.058 | 0.058 0.014 | 0.018 0.006 | -0.004 0.007 | 0.018 0.005 | -0.003 0.008 |
| 2022-11-29 | 0.014 0.013 | -0.009 0.020 | 0.055 0.047 | 0.031 0.020 | 0.012 0.013 | -0.010 0.020 | 0.015 0.013 | -0.013 0.022 |
| 2022-11-30 | 0.014 0.014 | -0.011 0.018 | 0.061 0.054 | 0.043 0.019 | 0.012 0.013 | -0.013 0.018 | 0.011 0.012 | -0.011 0.013 |
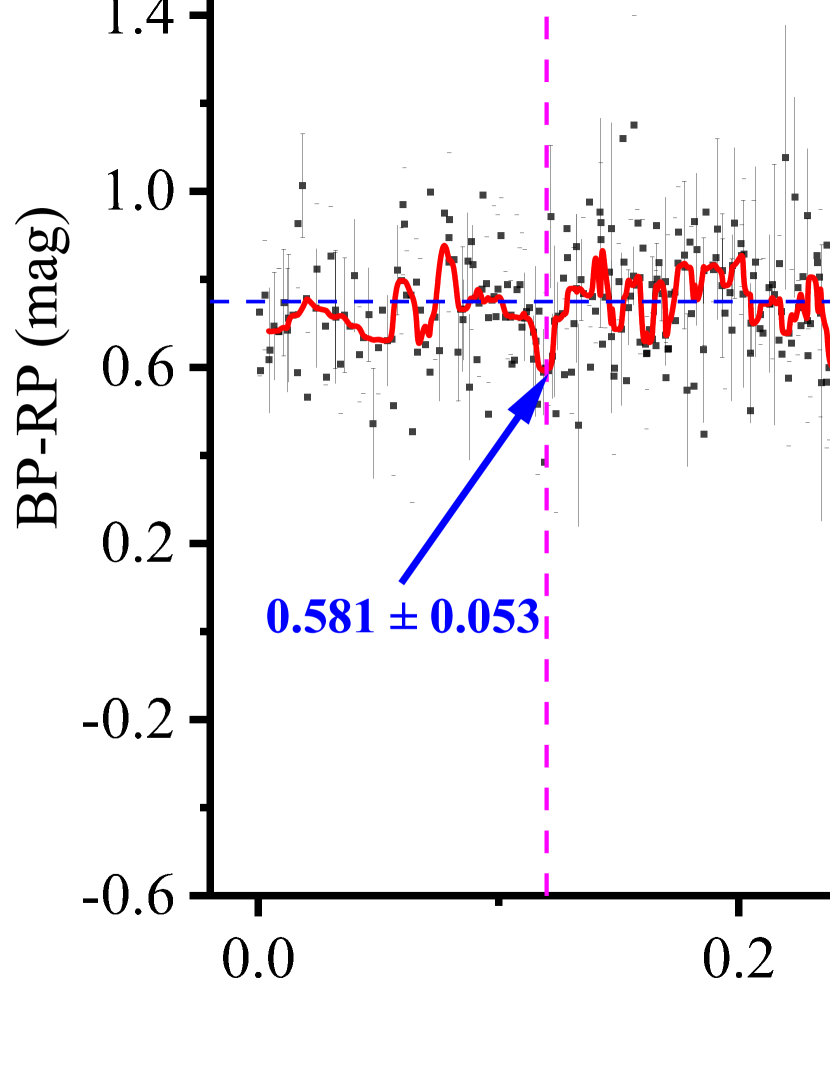
At present, the change of Himalia’s color within a short time (e.g. the change with its rotation) has not been explored. The color indices of Himalia measured by other works are regarded as its instant color, which are only measured by several frames on one night. Its color index is usually considered as a constant. According to all the color measurement results in this work, we have them rotational phased based on its rotation period 7.7819h (Pilcher et al., 2012), which is shown in Figure 6. We used an average filter for the nearest seven plots to smooth the color index with its rotational phase. According to the smoothed phased color index, two places are found with their color indices exceeding the mean 3. One is near the phase of 0.119 where the color index is small to 0.581 0.053 magnitude. The other is near the phase of 0.688 and the color index is up to 1.081 0.106 magnitude. The change of color index with its rotational phase might indicate the uneven material distributions on the surface.
4.2 Results of Astrometry in Equatorial Coordinate
To calibrate the DCR effect of both reference stars and Himalia in data reduction, according to the astrometric information from the star catalog, we firstly calculate the standard coordinate of each catalog-matched star at the observational epoch through the central projection (Green, 1985). Here, the astrometric positions of stars are taken in equatorial coordinate. Then, the least squares scheme is used to solve the plate model with a weighted 4th order polynomial (Lin et al., 2019), which also contains the terms of DCR coefficient, color index, parallactic angle and ZD. According to the solved DCR coefficient and color indices (the color indices of reference stars are from Gaia DR3 catalog and the mean color index of Himalia is solved in this work), the observed positions of both reference stars and the Himalia can be calculated via the solved plate model. The calculate position of Himalia is computed by the latest version of JPL ephemeris and we can calculate the positional () of Himalia.
The results before and after the DCR calibration are shown in Table 3. Here, the astrometric results before DCR calibration are calculated using a weighted 4th order polynomial without containing the items of DCR calibration to fit the plate model. From our results, there are only a few differences in the observations with Cousins-I filter after DCR calibration, which also shows that using Cousins-I filter can effectively reduce the DCR effect. As for the DCR effect of Null and Clear filters, it depends on the difference color indices between the reference stars and the object as well as the position distributions of reference stars in the field of view. For the results after DCR calibration, we can derive similar astrometric results for both observed with Cousins-I, Null or Clear filters. The reduction results after DCR calibration show that the standard deviations of s (the observed minus computed) compared with JPL ephemeris is estimated at 0.005 0.019 and 0.007 0.026 arcsec in R.A. and Decl., respectively.
5 Discussion
Compared with the two methods (using one filter and two filters alternately), we can obtain more accurate and precise color index by the method of two filters alternately. In addition, we can conveniently obtain the instant color index of an object using two filters alternately. However, we should concentrate on the telescope focus. A proper focusing should be found for both filters. Namely, a good focus for Cousins-I filter might not fit Null or Clear filter. In contrast, we do not need to worry about the focus using only a filter. As for the method of using two filters alternately, there is a contradiction between the color and position measurement. When observed at larger ZD, although we can derive more accurate color index of an object with the same positional precision, the measurement error of the pixel position would be larger mainly due to the greater atmospheric extinction. From the observations used in this work, we find it works well with the ZD up to 70∘, and the effectiveness of observing with larger ZD should be further explored. The purpose of our work is to effectively calibrate the DCR effect in astrometry. Therefore, we focus less on what kind of color indices are used. To measure the color of an object, this method requires the corresponding color indices (e.g. B-V) of enough reference stars in the field of view. However, we cannot find the corresponding color indices (e.g. B-V) of most reference stars. In contrast, Gaia catalog provides a large number of reference stars with accurate color indices, which is more convenient to our work. Therefore, this method can effectively measure the color indices in Gaia system. In this work, we measure the color index BP-RP with larger numerical range of reference stars compared with G-RP and BP-G so that the solution of DCR coefficient is more accurate and precise.
To measure the color index precisely using two filters alternately, the observations should be made according to the requirements as follows. Firstly, the two filters used should cause large difference of DCR effect. For example, we can alternately observe with Cousins-I filter (the small DCR effect) and Null filter (the large DCR effect). Secondly, we should observe at large ZD (90∘ - altitude), e.g. larger than 40∘, no matter when located before or after the meridian. Thirdly, enough frames should be obtained to reduce the influence of random errors, and we suggest at least 15 frames for each filter. Fourthly, there should be more than 20 reference stars with a large range of color index (e.g. 2.0 mag) in the field of view to solve the DCR coefficients accurately.
DCR has been regarded as a negative effect for ground-based observation especially for astrometry, since it makes the accurate positional measurement difficult. However, in this work, we take advantage of the DCR effect and measure the color of an object, which also builds a link between astrometry and photometry. In fact, two kinds of differential astrometry are performed based on the catalog. One is the plate model between the pixel and equatorial standard coordinate, which shows the differential positions of stars in the field of view. Another is the differential relationship of DCR effect between the reference stars and the target (solar system object). Namely, the Earth’s atmosphere will have the same positional influence on both the reference stars and the target. Although there are some effects caused by the atmosphere (e.g. diffused effect), we can obtain the accurate color index of the target via differential measurement. In addition, the atmospheric conditions (e.g. the atmospheric transparency and thin clouds) might decrease the SNRs of stars. However, it will not influence the positional accuracy, but will influence the positional uncertainty. For color index measurement, the positional uncertainty has been taken into account in equation (8).
In order to explore whether this method can accurately measure the objects with different color indices. For testing, we can assume that the color indices of some reference stars (with different colors) are unknown. Then, we measure their color indices and make a comparison with those in Gaia catalog. Specifically, these reference stars for testing are not used for DCR calibration, which are regarded as the objects with unknown color indices. Table 4 shows the testing results using the observations with Clear filter on Nov, 23, 2022. Here, we assume that the positional errors in Gaia catalog are negligible. The results show that our method also works when measuring the objects with other color indices.
| Source ID | Magnitude | Measured CI | Gaia CI |
|---|---|---|---|
| (mag) | (mag) | ||
| 2449158753553218816 | 14.047 | 1.198 0.016 | 1.185 0.007 |
| 2449162704923136512 | 14.656 | 2.157 0.017 | 2.160 0.007 |
| 2449162670563388544 | 14.992 | 0.855 0.019 | 0.826 0.007 |
| 2449157791480546048 | 15.116 | 0.996 0.016 | 0.983 0.007 |
| 2449151950325022848 | 15.447 | 1.300 0.018 | 1.296 0.008 |
| 2449151778526331904 | 15.541 | 1.032 0.018 | 1.024 0.008 |
| 2449151709806855424 | 15.771 | 0.952 0.018 | 0.989 0.008 |
| 2448963865117864064 | 15.789 | 1.187 0.018 | 1.197 0.008 |
| 2449151434928925312 | 16.397 | 0.838 0.020 | 0.864 0.010 |
| 2449159784345367680 | 16.608 | 0.854 0.021 | 0.850 0.012 |
Compared with obtaining color index by absolute photometry, our method (using two filters alternately) may be inefficient when observed at small ZD. There are two aspects to elaborate the advantages of our method. One is that our method is not so demanding for weather conditions or well-calibrated instruments. For example, absolute photometry might not work well if the thin or curve clouds exist in some sky areas or flat fields are not taken. In some sense, the photometric nights are rare. In contrast, the cases above have smaller influence when using our method. Another is that the catalog-matched color index can be directly obtained via our method, and it serves for DCR calibration in astrometry. For example, if we would like to calibrate the DCR effect of Himalia based on the Gaia star catalog, the color indices of both stars and Himalia in the Gaia photometric system should be obtained. We can obtain the precise color indices BP-RP of stars from Gaia catalog. As for Himalia, we can directly derive the color index of Himalia in BP-RP system using this method. However, the measured color index system by absolute photometry is based on the photometric system of the filters attached. The transformation to the catalog-matched color index system may cause a large error (e.g. 0.020.20 mag), which will cause the positional errors of up to tens of milli-arcseconds with Null filter after DCR calibration.
6 Conclusion
In this work, we present an astrometric method to measure the catalog-matched color index of an object via the DCR effect. Once the color index has been derived, we can observe it with Null or Clear filter during a large range of ZDs and perform DCR calibration, by which the limiting magnitude and the efficiency of the telescope can be significantly improved. In addition, this method builds a link between astrometry and photometry. Take the jovian satellite Himalia as an example, we measure its color indices and positions using the observations over 8 nights by two telescopes. To verify whether this method can measure the objects with different color indices, the stars with different color indices are measured for testing. Totally our results show that the mean color index of Himalia is 0.750 0.004 magnitude. After DCR calibration, the standard deviations of the positional s (the observed minus computed) compared with JPL ephemeris are estimated at 0.005 0.019 and 0.007 0.026 arcsec in R.A. and Decl. for each night, respectively.
Acknowledgements
This work was supported by the National Key R&D Program of China (Grant No. 2022YFE0116800), by the China Manned Space Project (Grant No. CMS-CSST-2021-B08), by the National Natural Science Foundation of China (Grant Nos. 11873026, 11273014) and Joint Research Fund in Astronomy (Grant No. U1431227). We thank the anonymous reviewer who provided us with valuable comments, Dr. Lin F. R. who had a helpful discussion with us and Mr. Cao J. L. who helped us match the observations. This work has made use of data from the European Space Agency (ESA) mission Gaia (https://www.cosmos.esa.int/gaia), processed by the Gaia Data Processing and Analysis Consortium (DPAC; hppts://www.cosmos.esa.int/web/gaia/dpac/consortium). Funding for the DPAC has been provided by national institutions, in particular the institutions participating in the Gaia Multilateral Agreement.
Data Availability
The data underlying this article will be shared on reasonable request to the corresponding author.
References
- Anderson et al. (2006) Anderson J., Bedin L. R., Piotto G., Yadav R. S., Bellini A., 2006, A&A, 454, 1029
- Bell & Urban (2012) Bell S. A., Urban S. E., 2012, The Astronomical Almanac for the year 2013
- Benedetti-Rossi et al. (2014) Benedetti-Rossi G., Vieira Martins R., Camargo J. I. B., Assafin M., Braga-Ribas F., 2014, A&A, 570, A86
- Carrasco et al. (2021) Carrasco J. M., et al., 2021, A&A, 652, A86
- Degewij et al. (1980) Degewij J., Andersson L. E., Zellner B., 1980, Icarus, 44, 520
- Dieterich et al. (2018) Dieterich S. B., et al., 2018, ApJ, 865, 28
- Ducourant et al. (2008) Ducourant C., Teixeira R., Chauvin G., Daigne G., Le Campion J. F., Song I., Zuckerman B., 2008, A&A, 477, L1
- Gaia Collaboration et al. (2018) Gaia Collaboration et al., 2018, A&A, 616, A1
- Gaia Collaboration et al. (2021) Gaia Collaboration et al., 2021, A&A, 649, A1
- Gaia Collaboration et al. (2023) Gaia Collaboration et al., 2023, A&A, 674, A1
- Gomes-Júnior et al. (2015) Gomes-Júnior A. R., et al., 2015, A&A, 580, A76
- Graykowski & Jewitt (2018) Graykowski A., Jewitt D., 2018, AJ, 155, 184
- Green (1985) Green R. M., 1985, Spherical Astronomy. Cambridge University Press
- Guo et al. (2022) Guo B., Peng Q., Chen Y., Zheng Z., Shang Y., Li D., Chen X., 2022, Research in Astronomy and Astrophysics, 22, 055007
- Kilic et al. (2012) Kilic M., Thorstensen J. R., Kowalski P. M., Andrews J., 2012, MNRAS, 423, L132
- Lin et al. (2019) Lin F. R., Peng J. H., Zheng Z. J., Peng Q. Y., 2019, MNRAS, 490, 4382
- Lin et al. (2020) Lin F. R., Peng Q. Y., Zheng Z. J., 2020, MNRAS, 498, 258
- Luu (1991) Luu J., 1991, AJ, 102, 1213
- Magnier et al. (2020) Magnier E. A., et al., 2020, ApJS, 251, 6
- Monet et al. (1992) Monet D. G., Dahn C. C., Vrba F. J., Harris H. C., Pier J. R., Luginbuhl C. B., Ables H. D., 1992, AJ, 103, 638
- Ortiz et al. (2017) Ortiz J. L., et al., 2017, Nature, 550, 219
- Peña & Fuentes (2022) Peña J., Fuentes C., 2022, AJ, 163, 274
- Pilcher et al. (2012) Pilcher F., Mottola S., Denk T., 2012, Icarus, 219, 741
- Rettig et al. (2001) Rettig T. W., Walsh K., Consolmagno G., 2001, Icarus, 154, 313
- Shang et al. (2022) Shang Y. J., Peng Q. Y., Zheng Z. J., Vienne A., Guo B. F., Lin F. R., Chen Y., 2022, AJ, 163, 210
- Skrutskie et al. (2006) Skrutskie M. F., et al., 2006, AJ, 131, 1163
- Stone (2002) Stone R. C., 2002, PASP, 114, 1070
- Velasco et al. (2016) Velasco S., et al., 2016, MNRAS, 460, 3519
- Wang et al. (2015) Wang N., Peng Q. Y., Zhang X. L., Zhang Q. F., Li Z., Meng X. H., 2015, MNRAS, 454, 3805
- White et al. (2022) White R. L., Lubow S. H., Shiao B., 2022, AJ, 164, 73
- Winters et al. (2017) Winters J. G., et al., 2017, AJ, 153, 14
- Yu et al. (2018) Yu Y., Qiao R. C., Yan D., Cheng X., Xi X. J., Tang K., Luo H., 2018, Planet. Space Sci., 152, 82