Late Time Modification of Structure Growth and the S8 Tension
Abstract
The tension between low-redshift galaxy surveys and the primary CMB signals a possible breakdown of the CDM model. Recently differing results have been obtained using low-redshift galaxy surveys and the higher redshifts probed by CMB lensing, motivating a possible time-dependent modification to the growth of structure. We investigate a simple phenomenological model in which the growth of structure deviates from the CDM prediction at late times, in particular as a simple function of the dark energy density. Fitting to galaxy lensing, CMB lensing, BAO, and Supernovae datasets, we find significant evidence - 2.5 - 3, depending on analysis choices - for a non-zero value of the parameter quantifying a deviation from CDM. The preferred model, which has a slower growth of structure below , improves the joint fit to the data over CDM. While the overall fit is improved, there is weak evidence for galaxy and CMB lensing favoring different changes in the growth of structure.
Introduction. In current empirical cosmology two “cosmic tensions” have been actively pursued: the Hubble tension and the tension. The Hubble tension refers to the present-day expansion rate being faster than predicted by the CDM model (the standard, minimal cosmological model with a Cosmological constant plus Cold Dark Matter dominating the energy density) Aghanim et al. (2020a); Riess et al. (2022). The prediction is obtained by using the CMB temperature and polarization measurements at and extrapolating in time to the present using the expansion rate expected in the CDM cosmology. The tension (aka tension) refers to the amplitude of matter density fluctuations at the present being smaller than predicted in CDM, again based on the measurements of the CMB Abbott et al. (2022). The statistical significance of the tension is only at the level, and different galaxy survey measurements – in particular weak lensing (WL) and redshift space distortions (RSD) – have some spread in the inferred value. Nevertheless it has held up for several years, across experiments, and has major implications for cosmology and fundamental physics, so it has rightly received attention and scrutiny.
WL measurements from three powerful galaxy surveys, Dark Energy Survey (DES), Kilo-degree Survey (KiDS), and Hyper Suprime-Cam Subaru Strategic Program (HSC SSP), have obtained consistent results in the plane that show a tension with Planck Abbott et al. (2022); Asgari et al. (2021); Heymans et al. (2021); Dalal et al. (2023); Amon et al. (2023); Aricò et al. (2023). Recent measurements from the Atacama Cosmology Telescope (ACT) Madhavacheril et al. (2023) and re-analysis of the Planck data Rosenberg et al. (2022) have provided an interesting twist to the tension. These two projects find that their lensing measurements are consistent with the primary CMB fluctuations. These different findings from CMB lensing and galaxy lensing suggest that either set of measurements has a bias in the inferred amplitude, or that the growth history of the universe has some characteristic length or time scales.
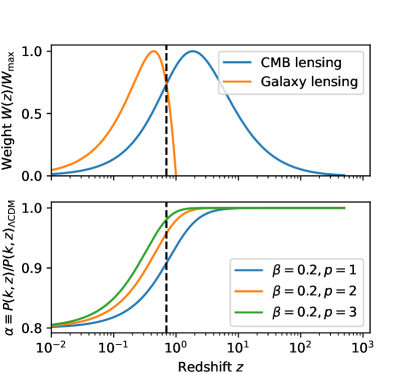
In this Letter, we explore the latter possibility. We note that the lensing kernel of galaxy surveys peaks at , while the CMB lensing kernel spans from recombination to today and has a very wide peak at . Coincidentally, the epoch of the dark energy-matter equality occurs at — assuming a CDM expansion history and Supernovae observations Brout et al. (2022) — which lies between the two sensitivity peaks. Exploiting this possible coincidence, we introduce a two-parameter model in which deviations of growth from CDM track the evolution of the dark energy density, and the behavior of the background is fixed to the CDM one. We use this model to study a possible resolution to the apparent disagreement between the galaxy lensing and CMB lensing measurements. For simplicity, we do not consider other late-time probes of growth of structure, including galaxy clustering in redshift or angular space and galaxy clusters which are broadly consistent with lensing measurements but have different sources of uncertainty.
The Model. We introduce a phenomenological model that rescales the structure growth as a function of redshift. We define the linear matter power spectrum with the modified growth as follows:
| (1) |
where is the linear matter power spectrum, is the fractional energy density of dark energy at a certain time, and is its value today. We then use HalofitTakahashi et al. (2012); Bird et al. (2012) to compute the nonlinear power spectrum.
When , and we recover the CDM model. We illustrate this parameterization in Fig. 1 together with the redshift distributions of CMB and galaxy lensing kernels following Madhavacheril et al. (2023). The rescaling is tied to the time dependence of dark energy density, so it mainly changes the late-time structure growth while leaving the early-time physics unchanged. Note that the parameter alters the effective redshift at which the modification occurs, allowing us to tune the sensitivity of CMB lensing to the change. Hereafter we refer to this model as the Dark Energy Tracking Growth (DETG) model.
In the literature, the “growth index parameter” has been introduced to characterize gravity theories with a single parameter Linder (2005). It is given by
| (2) |
where is the fractional energy density of matter, and is the linear density perturbation of matter. Our parameterization of eq. (1) can be related to the parameter above:
| (3) |
Our DETG model is somewhat similar in implementation to other phenomenological parameterizations of non-standard growth, such as those studied in e.g. Refs Brieden et al. (2022); García-García et al. (2021); White et al. (2022); Collaboration (2023); Nguyen et al. (2023), but represents a more targeted search in that it imposes a redshift dependence associated with the evolution of dark energy density and introduces only one free parameter.
Datasets. In order to assess the ability of the DETG model to reconcile the different constraints between galaxy lensing and CMB lensing, we use both sets of measurements as well as their cross-correlations. We use the DES Year 3 dataset for galaxy lensing, which bins the source galaxies into 4 redshift bins with the bulk of the sample over the range which are lensed by the foreground mass. The cross-correlation with CMB lensing is determined by the overlap of the galaxy lensing and CMB lensing redshift kernels. For additional constraints on the distance-redshift relation, we use Supernovae and BAO measurements. In particular, we employ the following datasets in this work:
- •
- •
- •
-
•
SN: Pantheon+ supernovae dataset of relative luminoisty distances Brout et al. (2022).
-
•
All = DES-Y3 + CMBlens + BAO + SN.
For additional tests of the robustness of the results, we also add the primary CMB likelihood
-
•
CMB primary: high- Planck 2018 [Plik] temperature and polarization (TT+TE+EE) and low-E power spectra Aghanim et al. (2020c).
We do not attempt to model the modifications of primary CMB anisotropies due to lensing and ISW effects of our modified late-time growth, instead, we marginalize over the parameter to accommodate the modified lensing effect and leave out the temperature data at low- that may be impacted by the late time ISW effect.
Results. We perform Markov Chain Monte Carlo (MCMC) analyses with the Polychord algorithm Handley et al. (2015a, b) using COSMOSiSZuntz et al. (2015)111https://cosmosis.readthedocs.io/en/latest/index.html. We use CAMBLewis et al. (2000) for cosmological calculations and GetDistLewis (2019) for MCMC chain analyses. In the analyses, we fix to several discrete constant values. In addition to the standard CDM parameters, we have one more varying parameter for which we impose a flat prior . In our baseline analysis, we have flat priors for CDM parameters: , , , , . For the robustness test, we also try a Gaussian prior on for the case the primary CMB likelihood is not included.
| model | CDM | DETG |
|---|---|---|
| 0.300 (0.3010.009) | 0.321 (0.3150.011) | |
| 72.64 (68.686.59) | 66.85 (66.986.13) | |
| 0.0528 (0.04840.0093) | 0.0464 (0.04520.0090) | |
| 0.907 (0.9370.027) | 0.909 (0.9320.023) | |
| 0.788 (0.7920.015) | 0.673 (0.6990.038) | |
| 0 | 0.182 (0.1490.052) | |
| 0 | -2.9 | |
| 0 | 0.2 | |
| 0 | -1.1 | |
| 0 | -3.3 | |
| 0 | -0.2 | |
| 0 | -7.2 |
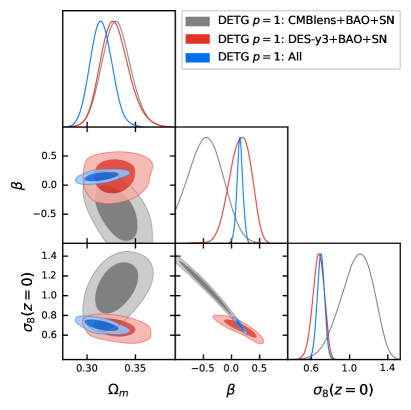
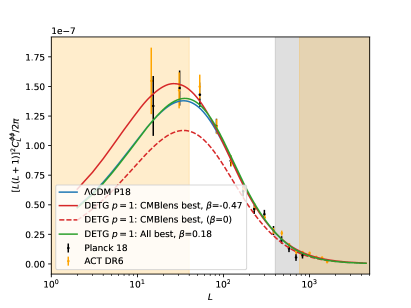
We show the results of our simplest DETG model in Fig. 2. DES-Y3 data, in combination with the probes of the expansion history, favor a positive as we expect due to the slower late-time structure growth compared to CDM. On the other hand, CMB lensing data favor a negative . In Fig. 3 we show the lensing power spectra of different maximum likelihood models in solid lines. We see that Planck and ACT lensing power spectra have relatively higher amplitudes at low- compared to CDM. For the DETG model, varying has some impact on the redshift range at which the CMB lensing kernel peaks, see Fig. 1. To illustrate the impact of , we also show the dashed red line which has all the parameters the same as the maximum likelihood solid red line but with . For the overall lensing power spectrum amplitude, compensates the effects of adjusting CDM parameters. Additionally, the low- CMB lensing power is more sensitive to low redshift structure growth, hence a negative enhances the low- CMB lensing power spectra relative to the high- multipoles, which is favored by the data. However, this preference is weak as the 2 contour extends to the positive as shown in Fig. 2. When combining CMB lensing with DES-Y3 data, it leads to a positive since their different constraints at different redshifts prefer a suppression of late-time growth. The CDM value is excluded at .
Table 1 shows the parameters of the maximum likelihood models fitting to All datasets. Compared to CDM, DETG model has a better fit by at the expense of only one more parameter. This improvement in is roughly compatible with the deviation from CDM we see in . Notice that the best-fit is close to the lower bound of the flat prior; in fact, even after combining DES-Y3 and CMB lensing data is not well constrained, and the preference for low can also be seen in the DES-Y3 cosmic shear constraints Secco et al. (2022).
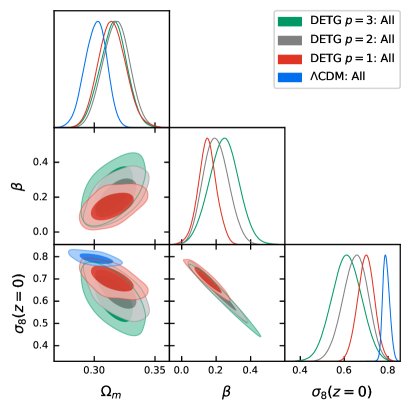
The posteriors of DETG models with different values of the parameter fit to All datasets are shown in Fig. 4 along with CDM results. As goes to higher values, the modification of structure growth affects lower redshifts (see Fig. 1), and its impact on CMB lensing becomes less important. Therefore CMBlens data have less constraining power on , and almost no constraint for the model. The posterior of extends to higher values for a larger .
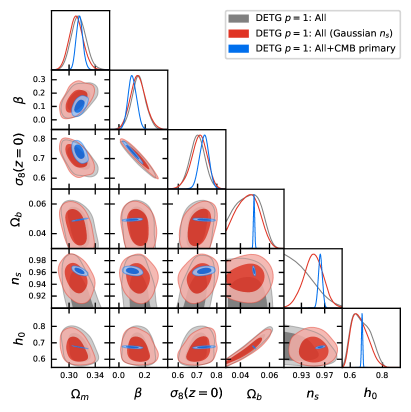
To test the robustness of our results against primary CMB power spectra, we carry out two additional variations of our analyses with the DETG model: 1. using a Gaussian prior on ; 2. adding CMB primary likelihood (as noted above, with as a free parameter to account for the possible modified lensing effect of the DETG model). The posterior distributions are shown in Fig. 5. Both are consistent with our baseline results and show evidence of deviation from CDM, at and respectively.
Conclusion and Discussion. This work is motivated by the difference in matter clustering inferred from CMB lensing versus galaxy lensing. While a new (or under-estimated) source of systematic uncertainty in one or both datasets is a possible explanation, here we explore the possibility that the late-time growth of structure deviates from the standard CDM model. We use measurements of CMB lensing, galaxy lensing, and their cross-correlation to constrain an ad-hoc but simple model for the modification of late-time growth. Our model, which we call Dark Energy Tracking Growth (DETG), modifies the growth rate as a power law of the relative energy density of dark energy (taken to evolve as ). We combine the lensing datasets with BAO and Supernovae data which fix the expansion history at late times to constrain the free parameter of our model: the coefficient , see Eq. (1).
Our main findings are as follows:
-
•
Our one-parameter DETG model provides an improved fit to galaxy lensing and CMB lensing. We find evidence for non-zero in our combined fit, which includes BAO and SN data.
-
•
Galaxy lensing favors slower growth at late times (a positive value of ). Since no reference to an external amplitude calibration is used in the fit, this is evidence for slower growth, independent of the usual tension.
-
•
CMB lensing shows a weak preference for stronger growth at late times. This preference arises from the shape dependence of its power spectrum. Galaxy lensing on the other hand has a preference for slower growth. However, this difference is not significant, and the best-fit model (which has slower growth) improves the overall by about 7, with only one additional free parameter.
-
•
Our model does not explicitly allow for scale-dependent modifications to the growth (beyond the one induced in angular statistics by scale projection of a modified time dependence). The success of the time dependence we introduce suggests that current data does not require this additional feature, but to understand the origin of a possible deviation from CDM, it is worth exploring scale dependence as well, especially as measurements improve.
There are several caveats and extensions to our simple study. We have used new publicly available ACT lensing power spectra but not the cross-correlation with galaxy lensing (for which we use the cross-correlations with SPT lensing Chang et al. (2023)). This measurement would have higher signal-to-noise than the measurements used here and could therefore also impact the results. On the galaxy lensing side, we have used the fiducial DES Y3 measurement of lensing two-point correlations. Other studies, using galaxy clustering, Fourier space correlations or higher order statistics, or measurements from KiDS or HSC SSP Gatti et al. (2022); Doux et al. (2022); Zürcher et al. (2022); Asgari et al. (2021); Dalal et al. (2023), may yield somewhat different results. Rather than carry out an exhaustive comparison, in future work we will use measurements from the full DES survey (the Year 6 data) and other galaxy and CMB surveys to improve our constraints. Finally, as noted above, our model gives only limited freedom to the time dependence of the growth factor, a more extensive exploration that includes scale-dependent deviations is merited, especially with improved measurements expected from DES, ACT, and South Pole Telescope in the near future. For a study of scale-dependent modifications due to baryonic physics, see e.g. Amon and Efstathiou (2022); Preston et al. (2023).
The model in this paper is a phenomenological model. It could possibly be realized by some physical models, e.g. ones that involve a significant DE clustering; modifications to gravity at late times Pogosian et al. (2022); Raveri et al. (2023); interactions between dark energy and dark matter Poulin et al. (2023). We leave the investigation of these interesting model realizations to future work.
Acknowledgements.
Acknowledgements: We thank Neal Dalal and Mathew Madhavacheril for the helpful discussions and comments. Computing resources were provided by the National Energy Research Scientific Computing Center (NERSC), a U.S. Department of Energy Office of Science User Facility operated under Contract No. DE-AC02-05CH11231, and by the University of Chicago Research Computing Center through the Kavli Institute for Cosmological Physics. M-X.L. is supported by funds provided by the Center for Particle Cosmology. B.J. and M.G. are supported in part by the US Department of Energy grant DE-SC0007901. M.R. acknowledges financial support from the INFN InDark initiative. S.L. is supported under a contract with the National Aeronautics and Space Administration and funded through the internal Research and Technology Development program. J.M. is supported in part by the Government of Canada through the Department of Innovation, Science and Economic Development and by the Province of Ontario through the Ministry of Colleges and Universities.References
- Aghanim et al. (2020a) N. Aghanim et al. (Planck), “Planck 2018 results. VI. Cosmological parameters,” Astron. Astrophys. 641, A6 (2020a), [Erratum: Astron.Astrophys. 652, C4 (2021)], arXiv:1807.06209 [astro-ph.CO] .
- Riess et al. (2022) Adam G. Riess et al., “A Comprehensive Measurement of the Local Value of the Hubble Constant with 1 km/s/Mpc Uncertainty from the Hubble Space Telescope and the SH0ES Team,” Astrophys. J. Lett. 934, L7 (2022), arXiv:2112.04510 [astro-ph.CO] .
- Abbott et al. (2022) T. M. C. Abbott et al. (DES), “Dark Energy Survey Year 3 results: Cosmological constraints from galaxy clustering and weak lensing,” Phys. Rev. D 105, 023520 (2022), arXiv:2105.13549 [astro-ph.CO] .
- Asgari et al. (2021) Marika Asgari et al. (KiDS), “KiDS-1000 Cosmology: Cosmic shear constraints and comparison between two point statistics,” Astron. Astrophys. 645, A104 (2021), arXiv:2007.15633 [astro-ph.CO] .
- Heymans et al. (2021) Catherine Heymans et al., “KiDS-1000 Cosmology: Multi-probe weak gravitational lensing and spectroscopic galaxy clustering constraints,” Astron. Astrophys. 646, A140 (2021), arXiv:2007.15632 [astro-ph.CO] .
- Dalal et al. (2023) Roohi Dalal et al., “Hyper Suprime-Cam Year 3 Results: Cosmology from Cosmic Shear Power Spectra,” (2023), arXiv:2304.00701 [astro-ph.CO] .
- Amon et al. (2023) A. Amon et al., “Consistent lensing and clustering in a low- Universe with BOSS, DES Year 3, HSC Year 1 and KiDS-1000,” Mon. Not. Roy. Astron. Soc. 518, 477–503 (2023), arXiv:2202.07440 [astro-ph.CO] .
- Aricò et al. (2023) Giovanni Aricò, Raul E. Angulo, Matteo Zennaro, Sergio Contreras, Angela Chen, and Carlos Hernández-Monteagudo, “DES Y3 cosmic shear down to small scales: constraints on cosmology and baryons,” (2023), arXiv:2303.05537 [astro-ph.CO] .
- Madhavacheril et al. (2023) Mathew S. Madhavacheril et al. (ACT), “The Atacama Cosmology Telescope: DR6 Gravitational Lensing Map and Cosmological Parameters,” (2023), arXiv:2304.05203 [astro-ph.CO] .
- Rosenberg et al. (2022) Erik Rosenberg, Steven Gratton, and George Efstathiou, “CMB power spectra and cosmological parameters from Planck PR4 with CamSpec,” Mon. Not. Roy. Astron. Soc. 517, 4620–4636 (2022), arXiv:2205.10869 [astro-ph.CO] .
- Brout et al. (2022) Dillon Brout et al., “The Pantheon+ Analysis: Cosmological Constraints,” Astrophys. J. 938, 110 (2022), arXiv:2202.04077 [astro-ph.CO] .
- Takahashi et al. (2012) Ryuichi Takahashi, Masanori Sato, Takahiro Nishimichi, Atsushi Taruya, and Masamune Oguri, “Revising the Halofit Model for the Nonlinear Matter Power Spectrum,” Astrophys. J. 761, 152 (2012), arXiv:1208.2701 [astro-ph.CO] .
- Bird et al. (2012) Simeon Bird, Matteo Viel, and Martin G. Haehnelt, “Massive Neutrinos and the Non-linear Matter Power Spectrum,” Mon. Not. Roy. Astron. Soc. 420, 2551–2561 (2012), arXiv:1109.4416 [astro-ph.CO] .
- Linder (2005) Eric V. Linder, “Cosmic growth history and expansion history,” Phys. Rev. D 72, 043529 (2005), arXiv:astro-ph/0507263 .
- Brieden et al. (2022) Samuel Brieden, Héctor Gil-Marín, and Licia Verde, “Model-agnostic interpretation of 10 billion years of cosmic evolution traced by BOSS and eBOSS data,” JCAP 08, 024 (2022), arXiv:2204.11868 [astro-ph.CO] .
- García-García et al. (2021) Carlos García-García, Jaime Ruiz Zapatero, David Alonso, Emilio Bellini, Pedro G. Ferreira, Eva-Maria Mueller, Andrina Nicola, and Pilar Ruiz-Lapuente, “The growth of density perturbations in the last 10 billion years from tomographic large-scale structure data,” JCAP 10, 030 (2021), arXiv:2105.12108 [astro-ph.CO] .
- White et al. (2022) Martin White et al., “Cosmological constraints from the tomographic cross-correlation of DESI Luminous Red Galaxies and Planck CMB lensing,” JCAP 02, 007 (2022), arXiv:2111.09898 [astro-ph.CO] .
- Collaboration (2023) DES Collaboration (DES), “Dark Energy Survey Year 3 results: Constraints on extensions to CDM with weak lensing and galaxy clustering,” Phys. Rev. D 107, 083504 (2023), arXiv:2207.05766 [astro-ph.CO] .
- Nguyen et al. (2023) Nhat-Minh Nguyen, Dragan Huterer, and Yuewei Wen, “Evidence for suppression of structure growth in the concordance cosmological model,” (2023), arXiv:2302.01331 [astro-ph.CO] .
- Amon et al. (2022) A. Amon et al. (DES), “Dark Energy Survey Year 3 results: Cosmology from cosmic shear and robustness to data calibration,” Phys. Rev. D 105, 023514 (2022), arXiv:2105.13543 [astro-ph.CO] .
- Secco et al. (2022) L. F. Secco et al. (DES), “Dark Energy Survey Year 3 results: Cosmology from cosmic shear and robustness to modeling uncertainty,” Phys. Rev. D 105, 023515 (2022), arXiv:2105.13544 [astro-ph.CO] .
- Chang et al. (2023) C. Chang et al. (DES, SPT), “Joint analysis of Dark Energy Survey Year 3 data and CMB lensing from SPT and Planck. II. Cross-correlation measurements and cosmological constraints,” Phys. Rev. D 107, 023530 (2023), arXiv:2203.12440 [astro-ph.CO] .
- Aghanim et al. (2020b) N. Aghanim et al. (Planck), “Planck 2018 results. VIII. Gravitational lensing,” Astron. Astrophys. 641, A8 (2020b), arXiv:1807.06210 [astro-ph.CO] .
- Qu et al. (2023) Frank J. Qu et al. (ACT), “The Atacama Cosmology Telescope: A Measurement of the DR6 CMB Lensing Power Spectrum and its Implications for Structure Growth,” (2023), arXiv:2304.05202 [astro-ph.CO] .
- Beutler et al. (2011) Florian Beutler, Chris Blake, Matthew Colless, D. Heath Jones, Lister Staveley-Smith, Lachlan Campbell, Quentin Parker, Will Saunders, and Fred Watson, “The 6dF Galaxy Survey: Baryon Acoustic Oscillations and the Local Hubble Constant,” Mon. Not. Roy. Astron. Soc. 416, 3017–3032 (2011), arXiv:1106.3366 [astro-ph.CO] .
- Ross et al. (2015) Ashley J. Ross, Lado Samushia, Cullan Howlett, Will J. Percival, Angela Burden, and Marc Manera, “The clustering of the SDSS DR7 main Galaxy sample – I. A 4 per cent distance measure at ,” Mon. Not. Roy. Astron. Soc. 449, 835–847 (2015), arXiv:1409.3242 [astro-ph.CO] .
- Alam et al. (2017) Shadab Alam et al. (BOSS), “The clustering of galaxies in the completed SDSS-III Baryon Oscillation Spectroscopic Survey: cosmological analysis of the DR12 galaxy sample,” Mon. Not. Roy. Astron. Soc. 470, 2617–2652 (2017), arXiv:1607.03155 [astro-ph.CO] .
- Bautista et al. (2020) Julian E. Bautista et al., “The Completed SDSS-IV extended Baryon Oscillation Spectroscopic Survey: measurement of the BAO and growth rate of structure of the luminous red galaxy sample from the anisotropic correlation function between redshifts 0.6 and 1,” Mon. Not. Roy. Astron. Soc. 500, 736–762 (2020), arXiv:2007.08993 [astro-ph.CO] .
- Gil-Marin et al. (2020) Hector Gil-Marin et al., “The Completed SDSS-IV extended Baryon Oscillation Spectroscopic Survey: measurement of the BAO and growth rate of structure of the luminous red galaxy sample from the anisotropic power spectrum between redshifts 0.6 and 1.0,” Mon. Not. Roy. Astron. Soc. 498, 2492–2531 (2020), arXiv:2007.08994 [astro-ph.CO] .
- Aghanim et al. (2020c) N. Aghanim et al. (Planck), “Planck 2018 results. V. CMB power spectra and likelihoods,” Astron. Astrophys. 641, A5 (2020c), arXiv:1907.12875 [astro-ph.CO] .
- Handley et al. (2015a) W. J. Handley, M. P. Hobson, and A. N. Lasenby, “POLYCHORD: nested sampling for cosmology,” MNRAS 450, L61–L65 (2015a), arXiv:1502.01856 .
- Handley et al. (2015b) W. J. Handley, M. P. Hobson, and A. N. Lasenby, “POLYCHORD: next-generation nested sampling,” MNRAS 453, 4384–4398 (2015b), arXiv:1506.00171 [astro-ph.IM] .
- Zuntz et al. (2015) Joe Zuntz, Marc Paterno, Elise Jennings, Douglas Rudd, Alessandro Manzotti, Scott Dodelson, Sarah Bridle, Saba Sehrish, and James Kowalkowski, “CosmoSIS: modular cosmological parameter estimation,” Astron. Comput. 12, 45–59 (2015), arXiv:1409.3409 [astro-ph.CO] .
- Lewis et al. (2000) Antony Lewis, Anthony Challinor, and Anthony Lasenby, “Efficient computation of CMB anisotropies in closed FRW models,” Astrophys. J. 538, 473–476 (2000), arXiv:astro-ph/9911177 .
- Lewis (2019) Antony Lewis, “GetDist: a Python package for analysing Monte Carlo samples,” (2019), arXiv:1910.13970 [astro-ph.IM] .
- Gatti et al. (2022) M. Gatti et al. (DES), “Dark Energy Survey Year 3 results: Cosmology with moments of weak lensing mass maps,” Phys. Rev. D 106, 083509 (2022), arXiv:2110.10141 [astro-ph.CO] .
- Doux et al. (2022) C. Doux et al. (DES), “Dark energy survey year 3 results: cosmological constraints from the analysis of cosmic shear in harmonic space,” Mon. Not. Roy. Astron. Soc. 515, 1942–1972 (2022), arXiv:2203.07128 [astro-ph.CO] .
- Zürcher et al. (2022) D. Zürcher et al. (DES), “Dark energy survey year 3 results: Cosmology with peaks using an emulator approach,” Mon. Not. Roy. Astron. Soc. 511, 2075–2104 (2022), arXiv:2110.10135 [astro-ph.CO] .
- Amon and Efstathiou (2022) Alexandra Amon and George Efstathiou, “A non-linear solution to the tension?” (2022), 10.1093/mnras/stac2429, arXiv:2206.11794 [astro-ph.CO] .
- Preston et al. (2023) Calvin Preston, Alexandra Amon, and George Efstathiou, “A non-linear solution to the tension II: Analysis of DES Year 3 cosmic shear,” (2023), arXiv:2305.09827 [astro-ph.CO] .
- Pogosian et al. (2022) Levon Pogosian, Marco Raveri, Kazuya Koyama, Matteo Martinelli, Alessandra Silvestri, Gong-Bo Zhao, Jian Li, Simone Peirone, and Alex Zucca, “Imprints of cosmological tensions in reconstructed gravity,” Nature Astron. 6, 1484–1490 (2022), arXiv:2107.12992 [astro-ph.CO] .
- Raveri et al. (2023) Marco Raveri, Levon Pogosian, Matteo Martinelli, Kazuya Koyama, Alessandra Silvestri, Gong-Bo Zhao, Jian Li, Simone Peirone, and Alex Zucca, “Principal reconstructed modes of dark energy and gravity,” JCAP 02, 061 (2023), arXiv:2107.12990 [astro-ph.CO] .
- Poulin et al. (2023) Vivian Poulin, José Luis Bernal, Ely D. Kovetz, and Marc Kamionkowski, “Sigma-8 tension is a drag,” Phys. Rev. D 107, 123538 (2023), arXiv:2209.06217 [astro-ph.CO] .