arXiv preprint \DOIDOI HERE \appnotesApplications Note
M. Spytek et al.
[]Corresponding author. przemyslaw.biecek@pw.edu.pl
0Year 0Year 0Year
survex: an R package for explaining machine learning survival models
Abstract
Summary: Due to their flexibility and superior performance, machine learning models frequently complement and outperform traditional statistical survival models. However, their widespread adoption is hindered by a lack of user-friendly tools to explain their internal operations and prediction rationales. To tackle this issue, we introduce the survex R package, which provides a cohesive framework for explaining any survival model by applying explainable artificial intelligence techniques. The capabilities of the proposed software encompass understanding and diagnosing survival models, which can lead to their improvement. By revealing insights into the decision-making process, such as variable effects and importances, survex enables the assessment of model reliability and the detection of biases. Thus, transparency and responsibility may be promoted in sensitive areas, such as biomedical research and healthcare applications.
Availability and Implementation: survex is available under the GPL3 public license at https://github.com/modeloriented/survex and on CRAN with documentation available at https://modeloriented.github.io/survex.
Contact: przemyslaw.biecek@pw.edu.pl
keywords:
survival analysis, machine learning, explainable artificial intelligence, interpretable machine learning1 Introduction
Survival analysis focuses on the estimation of time-to-event distributions while considering the effects of censoring. Over time, this field has witnessed substantial progress, initially driven by conventional statistical approaches like the Cox proportional hazards model (Cox, 1972). However, inherent limitations and challenges within this domain have spurred the integration of machine learning methodologies, introducing enhanced performance and flexibility (Wang et al., 2019). This convergence of statistics and machine learning is particularly evident in the R programming language (R Core Team, 2022), where various frameworks have been developed to facilitate the application of both traditional statistical models and modern machine learning techniques for survival analysis tasks.
Despite the promising potential of integrating machine learning into biomedical research and healthcare, the opaque nature of black-box models has raised valid concerns (Ahmad et al., 2018). In response, interpretable machine learning and explainable artificial intelligence methods has emerged as a viable solution (Biecek and Burzykowski, 2021; Molnar, 2022), including software packages in R (Biecek, 2018; Molnar et al., 2018). However, these software packages cannot handle censoring and do not provide explanations for survival models. To fill this gap, we propose survex as an innovative solution that provides comprehensive explanations for entire models and individual predictions, alongside performance measures and a unified prediction interface. Operating within the R environment, survex supports numerous packages with survival models while maintaining flexibility to integrate others. By integrating explanations into the modeling and analysis process, survex aspires to empower stakeholders, particularly in critical domains like healthcare, with a deeper understanding of the model’s predictions and underlying rationales, ultimately promoting trust and informed decision-making.
2 Related work
In the domain of survival analysis, various software packages offer a range of statistical and machine learning methods. In R, an essential component is the survival package (Therneau, 2023), which contains the fundamental statistical models like the Cox proportional hazards (Cox, 1972) and accelerated failure time (Kalbfleisch and Prentice, 2002) models. Alongside this, randomForestSRC (Ishwaran and Kogalur, 2007) and ranger (Wright and Ziegler, 2017) packages provide implementations of the notable random survival forest algorithm (Ishwaran et al., 2008). Complementing these, the survivalmodels package (Sonabend, 2022) offers deep neural networks within the survival analysis paradigm. To streamline consistency within this diverse toolkit, frameworks such as mlr3proba (Sonabend et al., 2021) and censored (Hvitfeldt and Frick, 2023) extend the mlr3 (Lang et al., 2019) and parsnip (Kuhn and Vaughan, 2023) frameworks, respectively, to provide standardized ways of using different survival models.
To illustrate the wide range of model explainability tools available in the R environment, it is pertinent to highlight packages such as DALEX (Biecek, 2018) and iml (Molnar et al., 2018), which offer a diverse spectrum of XAI techniques. While there are many packages in this field, their core focus remains rooted in the domain of explaining classification and regression models. Adapting certain explanatory methods for survival models can be accomplished, but it requires careful adjustment due to the unique predictive nature of these models. To address this challenge, survex offers specifically tailored explanations that incorporate the time dimension inherent in the survival models’ predictions. Furthermore, methods dedicated to explain survival models have been formulated, such as SurvLIME (Kovalev et al., 2020) with a Python implementation (Pachón-García et al., 2024) or SurvSHAP(t) (Krzyziński et al., 2023). The survex package is equipped to incorporate also these advanced techniques, further enhancing its functionalities range. It is worth acknowledging the inspiration drawn from the survxai package (Grudziaz et al., 2018), which has significantly influenced the development of survex. However, survex offers a broader spectrum of functionalities, recently proposed explanation methods, and supports a wider range of models. In addition, survxai is no longer maintained.
3 Implementation and functionalities
The following section presents a brief overview of the functionalities of survex. More details about the explanation methods and implementation can be found in the accompanying Supplementary Information and package documentation.
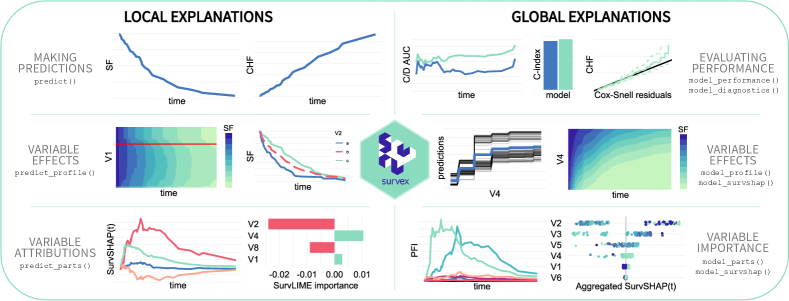
The design of survex draws inspiration from the DALEX R package (Biecek, 2018), serving as an extension tailored to explain survival models. This is exemplified in a methodically structured interface, aligned with the structure proposed by Baniecki et al. (2023a). The package facilitates the interpretation of survival models through its diverse functionalities, categorized into local and global contexts, as depicted in Figure 1. survex is engineered as a model-agnostic framework adaptable to any model that returns predictions in the form of a survival function or cumulative hazards function.
The model-agnostic approach is implemented by the central component of the package – the explainer object. Serving as a wrapper for survival models, it unifies their prediction interfaces and stores essential background data necessary for obtaining predictions and explanations. For models from widely-used packages, the explainer can be created automatically, by providing the model object to the explain() function. However, any model not adapted automatically by survex can be explained by specifying the way of predicting the survival function. For the wrapped model, the unified prediction interface can be used by the predict() function, capable of generating predictions in the form of survival function, cumulative hazard function, or relative risk.
3.1 Explanation methods
Global explanations, concerning the whole model (dataset level), are marked with the model prefix, while local explanations, referring to individual predictions (observation level), are denoted by the predict prefix. Computing an explanation involves invoking the relevant function with the explainer object as the primary argument, supplemented by additional details. One of the key parameters is the output_type – the default selection of ‘survival’ generates time-dependent explanations based on a survival function. However, it is also possible to select ‘chf’ for explanations related to cumulative hazard function or ‘risk’, which results in more standard explanations based on a prediction in the form of relative risk (single number).
The model_parts() function outputs variable importance scores for the model. It leverages permutation variable importance (Breiman, 2001; Fisher et al., 2019), i.e., quantifies the extent by which performance metric values are impacted upon permuting values of a chosen predictor.
Performance measures can also be used with the model_performance() function, allowing users to comprehensively evaluate the models’ predictive capabilities. This function also offers the possibility to prepare ROC curves at different time points, by treating the survival probability at a selected time point as the response for the classification task.
Furthermore, the model_diagnostics() function facilitates diagnostic assessments through analysis of the residuals. It supports the calculation and visualization of martingale residuals, deviance residuals (Therneau et al., 1990), and Cox-Snell residuals (Cox and Snell, 1968).
Explanations obtained by the model_profile() function reveal the influence of a specific variable on the model’s predictions. They are constructed based on one of two distinct methodologies: partial dependence plots (Friedman, 2001) or accumulated local effects (Apley and Zhu, 2020). Moreover, for insight into potential interaction effects, survex offers the model_profile_2d() function, which generates profiles for two variables.
Using the predict_parts() function results in explanations that reveal the contributions of variables to a model’s prediction for a selected observation. In survex, these insights can be obtained using one of the two methodologies. The default method is SurvSHAP(t) (Krzyziński et al., 2023), leveraging SHAP values applied to the survival function to give the variable attributions at different times, alongside their aggregations over time. Alternatively, the SurvLIME approach fits a surrogate Cox model in the local neighborhood of the selected observation and uses its coefficients as the explanation.
The predict_profile() function is related to explanations concerning a single variable’s impact on a specific prediction. These insights are derived via the individual conditional expectation method (Goldstein et al., 2015), also known as the ceteris paribus method, as it involves altering the values of a single variable while keeping all others constant. These results can be analyzed together with partial dependence plots, which are their average.
The model_survshap() function streamlines the process of accessing SurvSHAP(t) explanations for a specified set of observations. Beyond individual explanations, this function aggregates SurvSHAP(t) values, revealing global insights into the model’s behavior. Moreover, it incorporates accessible visualization methods, including SurvSHAP(t) bee swarm and dependence plots, inspired by the well-established shap Python package (Lundberg and Lee, 2017).
It should be noted that methods using permute-and-predict mechanism have been criticized for producing misleading results when dealing with strongly correlated variables (Hooker et al., 2019), and there are alternative methods specifically designed to address these challenges (Delicado and Peña, 2019). Thus, techniques like permutation variable importance, individual conditional expectation and partial dependence plots should be used cautiously.
3.2 Visualizations
Within survex, various visualizations accompany its explanations. Plots are prepared using the ggplot2 package (Wickham, 2016) through the implemented plot() function called on the object returned by the explanation. Extensive user customization is enabled by adjustable parameters within the plotting functions, augmented with advanced functions available in ggplot2. Plots can be created for multiple explainer objects at once, allowing the user to compare and differentiate the explanations for different models and observations.
3.3 Applications
survex has already demonstrated its applicability in the field of biomedical research and healthcare. Chen et al. (2023) employed the package to find out the relative importance of variables in survival models predicting sporadic pancreatic cancer. Nachit et al. (2023) used it to analyze partial dependence plots of different body composition parameters extracted from computer tomography scans in a random survival forest. Additionally, we successfully applied survex to explain model bias in predicting hospital length of stay (Baniecki et al., 2023b).
4 Future work
Currently, survex handles the most common case of right-censored data with a single type of event. However, a future roadmap envisions its extension to cover alternative censoring types and accommodate competing risk models. Moreover, survex can be easily extended with additional explanation techniques, e.g., counterfactual explanations proposed by Kovalev et al. (2021), or more adaptations of existing methods known from classification and regression tasks.
Supplementary data
Supplementary data are available at Bioinformatics online.
Funding
This work was supported by the National Science Centre [SONATA BIS 9 grant 2019/34/E/ST6/00052]; the Polish National Centre for Research and Development [INFOSTRATEG-I/0022/2021-00]; and the German Research Foundation (DFG) [Grants 437611051, 459360854].
References
- Ahmad et al. [2018] M. A. Ahmad, C. Eckert, and A. Teredesai. Interpretable Machine Learning in Healthcare. In ACM International Conference on Bioinformatics, Computational Biology, and Health Informatics, pages 559–560, 2018. 10.1145/3233547.3233667.
- Apley and Zhu [2020] D. W. Apley and J. Zhu. Visualizing the Effects of Predictor Variables in Black Box Supervised Learning Models. Journal of the Royal Statistical Society Series B, 82(4):1059–1086, 2020. 10.1111/rssb.12377.
- Baniecki et al. [2023a] H. Baniecki, D. Parzych, and P. Biecek. The Grammar of Interactive Explanatory Model Analysis. Data Mining and Knowledge Discovery, pages 1–37, 2023a.
- Baniecki et al. [2023b] H. Baniecki, B. Sobieski, P. Bombiński, P. Szatkowski, and P. Biecek. Hospital Length of Stay Prediction Based on Multi-modal Data Towards Trustworthy Human-AI Collaboration in Radiomics. In International Conference on Artificial Intelligence in Medicine, pages 65–74, 2023b. 10.1007/978-3-031-34344-5_9.
- Biecek [2018] P. Biecek. DALEX: Explainers for Complex Predictive Models in R. Journal of Machine Learning Research, 19(84):1–5, 2018.
- Biecek and Burzykowski [2021] P. Biecek and T. Burzykowski. Explanatory Model Analysis. CRC Press, 2021. URL https://ema.drwhy.ai/.
- Breiman [2001] L. Breiman. Random Forests. Machine Learning, 45:5–32, 2001.
- Chen et al. [2023] W. Chen, B. Zhou, C. Y. Jeon, F. Xie, Y.-C. Lin, R. K. Butler, Y. Zhou, T. Q. Luong, E. Lustigova, J. R. Pisegna, and B. U. Wu. Machine Learning Versus Regression for Prediction of Sporadic Pancreatic Cancer. Pancreatology, 23(4):396–402, 2023. 10.1016/j.pan.2023.04.009.
- Cox [1972] D. R. Cox. Regression Models and Life-Tables. Journal of the Royal Statistical Society. Series B, 34(2):187–220, 1972.
- Cox and Snell [1968] D. R. Cox and E. J. Snell. A General Definition of Residuals. Journal of the Royal Statistical Society: Series B, 30(2):248–265, 1968. h10.1111/j.2517-6161.1968.tb00724.x.
- Delicado and Peña [2019] P. Delicado and D. Peña. Understanding Complex Predictive Models with Ghost Variables. TEST, 32:107 – 145, 2019.
- Fisher et al. [2019] A. Fisher, C. Rudin, and F. Dominici. All Models are Wrong, but Many are Useful: Learning a Variable’s Importance by Studying an Entire Class of Prediction Models Simultaneously. Journal of Machine Learning Research, 20(177):1–81, 2019.
- Friedman [2001] J. H. Friedman. Greedy Function Approximation: a Gradient Boosting Machine. Annals of Statistics, pages 1189–1232, 2001.
- Goldstein et al. [2015] A. Goldstein, A. Kapelner, J. Bleich, and E. Pitkin. Peeking Inside the Black Box: Visualizing Statistical Learning With Plots of Individual Conditional Expectation. Journal of Computational and Graphical Statistics, 24(1):44–65, 2015. 10.1080/10618600.2014.907095.
- Grudziaz et al. [2018] A. Grudziaz, A. Gosiewska, and P. Biecek. survxai: An R Package for Structure-agnostic Explanations of Survival Models. Journal of Open Source Software, 3(31):961, 2018. 10.21105/joss.00961.
- Hooker et al. [2019] G. Hooker, L. K. Mentch, and S. Zhou. Unrestricted Permutation Forces Extrapolation: Variable Importance Requires at Least One More Model, or There is No Free Variable Importance. Statistics and Computing, 31, 2019.
- Hvitfeldt and Frick [2023] E. Hvitfeldt and H. Frick. censored: ’parsnip’ Engines for Survival Models, 2023. URL https://github.com/tidymodels/censored. R package version 0.2.0.
- Ishwaran and Kogalur [2007] H. Ishwaran and U. B. Kogalur. Random Survival Forests for R. R News, 7(2):25–31, 2007.
- Ishwaran et al. [2008] H. Ishwaran, U. B. Kogalur, E. H. Blackstone, and M. S. Lauer. Random Survival Forests. The Annals of Applied Statistics, 2(3):841–860, 2008.
- Kalbfleisch and Prentice [2002] J. D. Kalbfleisch and R. L. Prentice. The Statistical Analysis of Failure Time Data. John Wiley & Sons, 2nd edition, 2002.
- Kovalev et al. [2021] M. Kovalev, L. Utkin, F. Coolen, and A. Konstantinov. Counterfactual Explanation of Machine Learning Survival Models. Informatica, 32(4):817–847, 2021. 10.15388/21-INFOR468.
- Kovalev et al. [2020] M. S. Kovalev, L. V. Utkin, and E. M. Kasimov. SurvLIME: A Method for Explaining Machine Learning Survival Models. Knowledge-Based Systems, 203:106164, 2020.
- Krzyziński et al. [2023] M. Krzyziński, M. Spytek, H. Baniecki, and P. Biecek. SurvSHAP(t): Time-dependent Explanations of Machine Learning Survival Models. Knowledge-Based Systems, 262:110234, 2023.
- Kuhn and Vaughan [2023] M. Kuhn and D. Vaughan. parsnip: A Common API to Modeling and Analysis Functions, 2023. URL https://CRAN.R-project.org/package=parsnip. R package version 1.1.0.
- Lang et al. [2019] M. Lang, M. Binder, J. Richter, P. Schratz, F. Pfisterer, S. Coors, Q. Au, G. Casalicchio, L. Kotthoff, and B. Bischl. mlr3: A Modern Object-oriented Machine Learning Framework in R. Journal of Open Source Software, 4(44):1903, 2019.
- Lundberg and Lee [2017] S. M. Lundberg and S.-I. Lee. A Unified Approach to Interpreting Model Predictions. In Advances in Neural Information Processing Systems, pages 4765–4774, 2017.
- Molnar [2022] C. Molnar. Interpretable Machine Learning, 2nd edition, 2022.
- Molnar et al. [2018] C. Molnar, B. Bischl, and G. Casalicchio. iml: An R Package for Interpretable Machine Learning. Journal of Open Source Software, 3(26):786, 2018. 10.21105/joss.00786.
- Nachit et al. [2023] M. Nachit, Y. Horsmans, R. M. Summers, I. A. Leclercq, and P. J. Pickhardt. AI-based CT Body Composition Identifies Myosteatosis as Key Mortality Predictor in Asymptomatic Adults. Radiology, 307(5):222008, 2023.
- Pachón-García et al. [2024] C. Pachón-García, C. Hernández-Pérez, P. Delicado, and V. Vilaplana. SurvLIMEpy: A Python Package Implementing SurvLIME. Expert Systems with Applications, 237:121620, 2024.
- R Core Team [2022] R Core Team. R: A Language and Environment for Statistical Computing. R Foundation for Statistical Computing, Vienna, Austria, 2022. URL https://www.R-project.org/.
- Sonabend [2022] R. Sonabend. survivalmodels: Models for Survival Analysis, 2022. URL https://CRAN.R-project.org/package=survivalmodels. R package version 0.1.13.
- Sonabend et al. [2021] R. Sonabend, F. J. Király, A. Bender, B. Bischl, and M. Lang. mlr3proba: An R Package for Machine Learning in Survival Analysis. Bioinformatics, 37(17):2789–2791, 2021.
- Therneau [2023] T. M. Therneau. A Package for Survival Analysis in R, 2023. URL https://CRAN.R-project.org/package=survival. R package version 3.5-3.
- Therneau et al. [1990] T. M. Therneau, P. M. Grambsch, and T. R. Fleming. Martingale-based Residuals for Survival Models. Biometrika, 77(1):147–160, 1990. 10.1093/biomet/77.1.147.
- Wang et al. [2019] P. Wang, Y. Li, and C. K. Reddy. Machine Learning for Survival Analysis: A Survey. ACM Computing Surveys, 51(6), 2019. 10.1145/3214306.
- Wickham [2016] H. Wickham. ggplot2: Elegant Graphics for Data Analysis. Springer-Verlag New York, 2016.
- Wright and Ziegler [2017] M. N. Wright and A. Ziegler. ranger: A Fast Implementation of Random Forests for High Dimensional Data in C++ and R. Journal of Statistical Software, 77(1):1–17, 2017.
See pages - of supplementary_information.pdf